This pipeline uses various statistical tests to identify genes whose promoter methylation levels correlated to selected clinical features.
Testing the association between 17315 genes and 5 clinical features across 506 samples, statistically thresholded by Q value < 0.05, 5 clinical features related to at least one genes.
-
1 gene correlated to 'Time to Death'.
-
CDC73
-
145 genes correlated to 'AGE'.
-
KIF15 , MEX3C , EGR2 , LGALS8 , C10ORF35 , ...
-
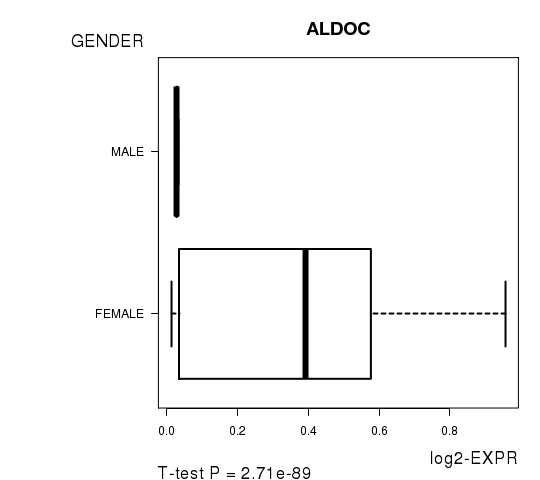
186 genes correlated to 'GENDER'.
-
ALDOC , ZNF486 , CRIP1 , NMNAT3 , LOC400043 , ...
-
242 genes correlated to 'RADIATIONS.RADIATION.REGIMENINDICATION'.
-
CCDC86 , TUBA4B , MAP1LC3B2 , TAF6 , HS1BP3 , ...
-
433 genes correlated to 'NEOADJUVANT.THERAPY'.
-
TAF6 , DKFZP779M0652 , HS1BP3 , SYNGR4 , RPS15 , ...
Complete statistical result table is provided in Supplement Table 1
Table 1. Get Full Table This table shows the clinical features, statistical methods used, and the number of genes that are significantly associated with each clinical feature at Q value < 0.05.
| Clinical feature | Statistical test | Significant genes | Associated with | Associated with | ||
|---|---|---|---|---|---|---|
| Time to Death | Cox regression test | N=1 | shorter survival | N=0 | longer survival | N=1 |
| AGE | Spearman correlation test | N=145 | older | N=131 | younger | N=14 |
| GENDER | t test | N=186 | male | N=41 | female | N=145 |
| RADIATIONS RADIATION REGIMENINDICATION | t test | N=242 | yes | N=182 | no | N=60 |
| NEOADJUVANT THERAPY | t test | N=433 | yes | N=326 | no | N=107 |
Table S1. Basic characteristics of clinical feature: 'Time to Death'
| Time to Death | Duration (Months) | 0-223.4 (median=18.3) |
| censored | N = 422 | |
| death | N = 56 | |
| Significant markers | N = 1 | |
| associated with shorter survival | 0 | |
| associated with longer survival | 1 |
Table S2. Get Full Table List of one gene significantly associated with 'Time to Death' by Cox regression test
| HazardRatio | Wald_P | Q | C_index | |
|---|---|---|---|---|
| CDC73 | 0 | 2.414e-06 | 0.042 | 0.351 |
Figure S1. Get High-res Image As an example, this figure shows the association of CDC73 to 'Time to Death'. four curves present the cumulative survival rates of 4 quartile subsets of patients. P value = 2.41e-06 with univariate Cox regression analysis using continuous log-2 expression values.

Table S3. Basic characteristics of clinical feature: 'AGE'
| AGE | Mean (SD) | 57.47 (13) |
| Significant markers | N = 145 | |
| pos. correlated | 131 | |
| neg. correlated | 14 |
Table S4. Get Full Table List of top 10 genes significantly correlated to 'AGE' by Spearman correlation test
| SpearmanCorr | corrP | Q | |
|---|---|---|---|
| KIF15 | 0.2973 | 9.117e-12 | 1.58e-07 |
| MEX3C | 0.2874 | 4.627e-11 | 8.01e-07 |
| EGR2 | 0.2856 | 6.172e-11 | 1.07e-06 |
| LGALS8 | -0.2844 | 7.45e-11 | 1.29e-06 |
| C10ORF35 | 0.2838 | 8.295e-11 | 1.44e-06 |
| PAPSS1 | 0.2786 | 1.855e-10 | 3.21e-06 |
| RPS2 | 0.2758 | 2.887e-10 | 5e-06 |
| RPL13A | 0.2738 | 3.932e-10 | 6.81e-06 |
| MTMR7 | 0.2731 | 4.344e-10 | 7.52e-06 |
| RPL7A | 0.272 | 5.104e-10 | 8.83e-06 |
Figure S2. Get High-res Image As an example, this figure shows the association of KIF15 to 'AGE'. P value = 9.12e-12 with Spearman correlation analysis. The straight line presents the best linear regression.
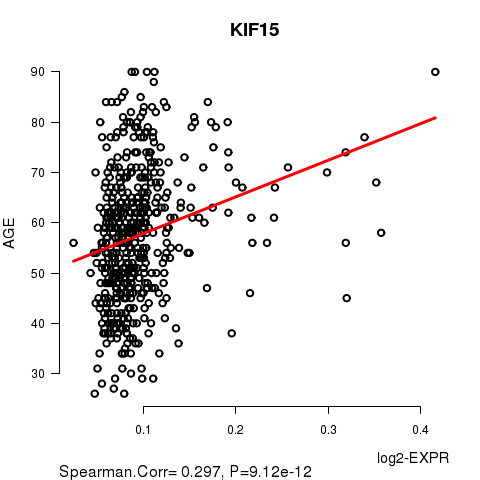
Table S5. Basic characteristics of clinical feature: 'GENDER'
| GENDER | Labels | N |
| FEMALE | 500 | |
| MALE | 6 | |
| Significant markers | N = 186 | |
| Higher in MALE | 41 | |
| Higher in FEMALE | 145 |
Table S6. Get Full Table List of top 10 genes differentially expressed by 'GENDER'
| T(pos if higher in 'MALE') | ttestP | Q | AUC | |
|---|---|---|---|---|
| ALDOC | -25.02 | 2.713e-89 | 4.7e-85 | 0.8637 |
| ZNF486 | -18.01 | 3.185e-56 | 5.51e-52 | 0.819 |
| CRIP1 | -16.27 | 3.944e-48 | 6.83e-44 | 0.8667 |
| NMNAT3 | -13.04 | 2.914e-33 | 5.05e-29 | 0.687 |
| LOC400043 | -12.99 | 7.319e-31 | 1.27e-26 | 0.6022 |
| RND2 | -12.86 | 9.539e-28 | 1.65e-23 | 0.7923 |
| EML1 | -11.17 | 7.152e-26 | 1.24e-21 | 0.6103 |
| SPC25 | -11.85 | 1.759e-25 | 3.05e-21 | 0.7523 |
| HSPC157 | -12.76 | 7.425e-25 | 1.29e-20 | 0.6363 |
| ADCY5 | 12.08 | 2.017e-24 | 3.49e-20 | 0.7297 |
Figure S3. Get High-res Image As an example, this figure shows the association of ALDOC to 'GENDER'. P value = 2.71e-89 with T-test analysis.
242 genes related to 'RADIATIONS.RADIATION.REGIMENINDICATION'.
Table S7. Basic characteristics of clinical feature: 'RADIATIONS.RADIATION.REGIMENINDICATION'
| RADIATIONS.RADIATION.REGIMENINDICATION | Labels | N |
| NO | 124 | |
| YES | 382 | |
| Significant markers | N = 242 | |
| Higher in YES | 182 | |
| Higher in NO | 60 |
Table S8. Get Full Table List of top 10 genes differentially expressed by 'RADIATIONS.RADIATION.REGIMENINDICATION'
| T(pos if higher in 'YES') | ttestP | Q | AUC | |
|---|---|---|---|---|
| CCDC86 | 7.7 | 2.621e-13 | 4.54e-09 | 0.7089 |
| TUBA4B | 7.29 | 1.756e-12 | 3.04e-08 | 0.6682 |
| MAP1LC3B2 | -7.16 | 1.157e-11 | 2e-07 | 0.695 |
| TAF6 | 7.05 | 1.256e-11 | 2.17e-07 | 0.6702 |
| HS1BP3 | 7.02 | 1.372e-11 | 2.38e-07 | 0.6885 |
| C12ORF52 | 7.04 | 1.413e-11 | 2.45e-07 | 0.6783 |
| DDX54 | 7.04 | 1.413e-11 | 2.45e-07 | 0.6783 |
| CCDC85B | 7.04 | 1.486e-11 | 2.57e-07 | 0.6834 |
| MBD3 | 6.99 | 2.301e-11 | 3.98e-07 | 0.6819 |
| SYNGR4 | 6.91 | 4.995e-11 | 8.64e-07 | 0.7098 |
Figure S4. Get High-res Image As an example, this figure shows the association of CCDC86 to 'RADIATIONS.RADIATION.REGIMENINDICATION'. P value = 2.62e-13 with T-test analysis.

Table S9. Basic characteristics of clinical feature: 'NEOADJUVANT.THERAPY'
| NEOADJUVANT.THERAPY | Labels | N |
| NO | 190 | |
| YES | 316 | |
| Significant markers | N = 433 | |
| Higher in YES | 326 | |
| Higher in NO | 107 |
Table S10. Get Full Table List of top 10 genes differentially expressed by 'NEOADJUVANT.THERAPY'
| T(pos if higher in 'YES') | ttestP | Q | AUC | |
|---|---|---|---|---|
| TAF6 | 8.94 | 7.834e-18 | 1.36e-13 | 0.7046 |
| DKFZP779M0652 | 8.4 | 4.816e-16 | 8.34e-12 | 0.7038 |
| HS1BP3 | 8.22 | 1.7e-15 | 2.94e-11 | 0.694 |
| SYNGR4 | 8.26 | 1.861e-15 | 3.22e-11 | 0.7152 |
| RPS15 | 8.2 | 2.066e-15 | 3.58e-11 | 0.7072 |
| CATSPER2 | -8.33 | 2.624e-15 | 4.54e-11 | 0.7185 |
| DLEU2L | -8.17 | 2.733e-15 | 4.73e-11 | 0.7058 |
| C12ORF52 | 8.08 | 4.909e-15 | 8.5e-11 | 0.686 |
| DDX54 | 8.08 | 4.909e-15 | 8.5e-11 | 0.686 |
| MAP1LC3B2 | -8.13 | 5.013e-15 | 8.68e-11 | 0.7126 |
Figure S5. Get High-res Image As an example, this figure shows the association of TAF6 to 'NEOADJUVANT.THERAPY'. P value = 7.83e-18 with T-test analysis.

-
Expresson data file = BRCA.meth.for_correlation.filtered_data.txt
-
Clinical data file = BRCA.clin.merged.picked.txt
-
Number of patients = 506
-
Number of genes = 17315
-
Number of clinical features = 5
For survival clinical features, Wald's test in univariate Cox regression analysis with proportional hazards model (Andersen and Gill 1982) was used to estimate the P values using the 'coxph' function in R. Kaplan-Meier survival curves were plot using the four quartile subgroups of patients based on expression levels
For continuous numerical clinical features, Spearman's rank correlation coefficients (Spearman 1904) and two-tailed P values were estimated using 'cor.test' function in R
For two-class clinical features, two-tailed Student's t test with unequal variance (Lehmann and Romano 2005) was applied to compare the log2-expression levels between the two clinical classes using 't.test' function in R
For multiple hypothesis correction, Q value is the False Discovery Rate (FDR) analogue of the P value (Benjamini and Hochberg 1995), defined as the minimum FDR at which the test may be called significant. We used the 'Benjamini and Hochberg' method of 'p.adjust' function in R to convert P values into Q values.
This is an experimental feature. The full results of the analysis summarized in this report can be downloaded from the TCGA Data Coordination Center.