This pipeline uses various statistical tests to identify miRs whose expression levels correlated to selected clinical features.
Testing the association between 508 genes and 5 clinical features across 838 samples, statistically thresholded by Q value < 0.05, 4 clinical features related to at least one genes.
-
2 genes correlated to 'Time to Death'.
-
HSA-MIR-874 , HSA-MIR-148B
-
26 genes correlated to 'AGE'.
-
HSA-MIR-424 , HSA-MIR-381 , HSA-MIR-31 , HSA-MIR-598 , HSA-MIR-99A , ...
-
3 genes correlated to 'RADIATIONS.RADIATION.REGIMENINDICATION'.
-
HSA-MIR-374C , HSA-MIR-3607 , HSA-MIR-489
-
5 genes correlated to 'NEOADJUVANT.THERAPY'.
-
HSA-MIR-374C , HSA-MIR-3607 , HSA-MIR-26A-1 , HSA-MIR-1180 , HSA-MIR-361
-
No genes correlated to 'GENDER'
Complete statistical result table is provided in Supplement Table 1
Table 1. Get Full Table This table shows the clinical features, statistical methods used, and the number of genes that are significantly associated with each clinical feature at Q value < 0.05.
| Clinical feature | Statistical test | Significant genes | Associated with | Associated with | ||
|---|---|---|---|---|---|---|
| Time to Death | Cox regression test | N=2 | shorter survival | N=2 | longer survival | N=0 |
| AGE | Spearman correlation test | N=26 | older | N=2 | younger | N=24 |
| GENDER | t test | N=0 | ||||
| RADIATIONS RADIATION REGIMENINDICATION | t test | N=3 | yes | N=0 | no | N=3 |
| NEOADJUVANT THERAPY | t test | N=5 | yes | N=2 | no | N=3 |
Table S1. Basic characteristics of clinical feature: 'Time to Death'
| Time to Death | Duration (Months) | 0-223.4 (median=18.9) |
| censored | N = 684 | |
| death | N = 95 | |
| Significant markers | N = 2 | |
| associated with shorter survival | 2 | |
| associated with longer survival | 0 |
Table S2. Get Full Table List of 2 genes significantly associated with 'Time to Death' by Cox regression test
| HazardRatio | Wald_P | Q | C_index | |
|---|---|---|---|---|
| HSA-MIR-874 | 1.58 | 7.068e-06 | 0.0036 | 0.606 |
| HSA-MIR-148B | 1.79 | 5.138e-05 | 0.026 | 0.627 |
Figure S1. Get High-res Image As an example, this figure shows the association of HSA-MIR-874 to 'Time to Death'. four curves present the cumulative survival rates of 4 quartile subsets of patients. P value = 7.07e-06 with univariate Cox regression analysis using continuous log-2 expression values.

Table S3. Basic characteristics of clinical feature: 'AGE'
| AGE | Mean (SD) | 58.41 (13) |
| Significant markers | N = 26 | |
| pos. correlated | 2 | |
| neg. correlated | 24 |
Table S4. Get Full Table List of top 10 genes significantly correlated to 'AGE' by Spearman correlation test
| SpearmanCorr | corrP | Q | |
|---|---|---|---|
| HSA-MIR-424 | -0.2234 | 6.369e-11 | 3.24e-08 |
| HSA-MIR-381 | -0.2111 | 6.876e-10 | 3.49e-07 |
| HSA-MIR-31 | -0.2037 | 4.305e-09 | 2.18e-06 |
| HSA-MIR-598 | -0.1956 | 1.151e-08 | 5.81e-06 |
| HSA-MIR-99A | -0.1945 | 1.403e-08 | 7.07e-06 |
| HSA-MIR-542 | -0.1935 | 1.676e-08 | 8.43e-06 |
| HSA-MIR-652 | -0.1854 | 6.519e-08 | 3.27e-05 |
| HSA-LET-7C | -0.1739 | 4.17e-07 | 0.000209 |
| HSA-MIR-125B-1 | -0.1589 | 3.818e-06 | 0.00191 |
| HSA-MIR-450B | -0.159 | 3.849e-06 | 0.00192 |
Figure S2. Get High-res Image As an example, this figure shows the association of HSA-MIR-424 to 'AGE'. P value = 6.37e-11 with Spearman correlation analysis. The straight line presents the best linear regression.

Table S5. Basic characteristics of clinical feature: 'GENDER'
| GENDER | Labels | N |
| FEMALE | 829 | |
| MALE | 9 | |
| Significant markers | N = 0 |
3 genes related to 'RADIATIONS.RADIATION.REGIMENINDICATION'.
Table S6. Basic characteristics of clinical feature: 'RADIATIONS.RADIATION.REGIMENINDICATION'
| RADIATIONS.RADIATION.REGIMENINDICATION | Labels | N |
| NO | 193 | |
| YES | 645 | |
| Significant markers | N = 3 | |
| Higher in YES | 0 | |
| Higher in NO | 3 |
Table S7. Get Full Table List of 3 genes differentially expressed by 'RADIATIONS.RADIATION.REGIMENINDICATION'
| T(pos if higher in 'YES') | ttestP | Q | AUC | |
|---|---|---|---|---|
| HSA-MIR-374C | -4.78 | 3.1e-06 | 0.00157 | 0.6323 |
| HSA-MIR-3607 | -4.3 | 2.122e-05 | 0.0108 | 0.5721 |
| HSA-MIR-489 | -4.25 | 3.472e-05 | 0.0176 | 0.6254 |
Figure S3. Get High-res Image As an example, this figure shows the association of HSA-MIR-374C to 'RADIATIONS.RADIATION.REGIMENINDICATION'. P value = 3.1e-06 with T-test analysis.

Table S8. Basic characteristics of clinical feature: 'NEOADJUVANT.THERAPY'
| NEOADJUVANT.THERAPY | Labels | N |
| NO | 303 | |
| YES | 535 | |
| Significant markers | N = 5 | |
| Higher in YES | 2 | |
| Higher in NO | 3 |
Table S9. Get Full Table List of 5 genes differentially expressed by 'NEOADJUVANT.THERAPY'
| T(pos if higher in 'YES') | ttestP | Q | AUC | |
|---|---|---|---|---|
| HSA-MIR-374C | -5.78 | 1.409e-08 | 7.16e-06 | 0.6401 |
| HSA-MIR-3607 | -5.43 | 7.725e-08 | 3.92e-05 | 0.5805 |
| HSA-MIR-26A-1 | -4.74 | 2.543e-06 | 0.00129 | 0.5792 |
| HSA-MIR-1180 | 4.7 | 3.195e-06 | 0.00161 | 0.5955 |
| HSA-MIR-361 | 4.02 | 6.66e-05 | 0.0336 | 0.5823 |
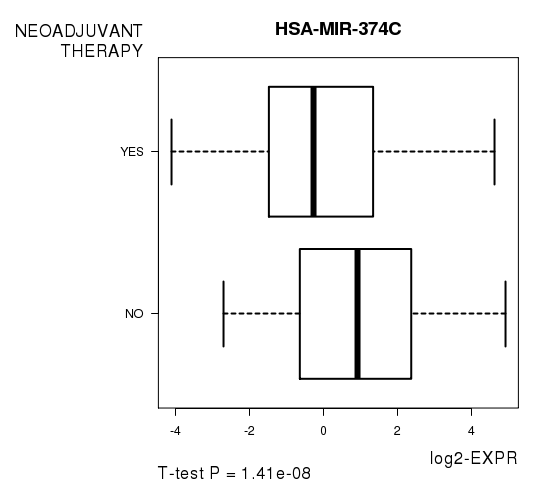
Figure S4. Get High-res Image As an example, this figure shows the association of HSA-MIR-374C to 'NEOADJUVANT.THERAPY'. P value = 1.41e-08 with T-test analysis.
-
Expresson data file = BRCA.miRseq_RPKM_log2.txt
-
Clinical data file = BRCA.clin.merged.picked.txt
-
Number of patients = 838
-
Number of genes = 508
-
Number of clinical features = 5
For survival clinical features, Wald's test in univariate Cox regression analysis with proportional hazards model (Andersen and Gill 1982) was used to estimate the P values using the 'coxph' function in R. Kaplan-Meier survival curves were plot using the four quartile subgroups of patients based on expression levels
For continuous numerical clinical features, Spearman's rank correlation coefficients (Spearman 1904) and two-tailed P values were estimated using 'cor.test' function in R
For two-class clinical features, two-tailed Student's t test with unequal variance (Lehmann and Romano 2005) was applied to compare the log2-expression levels between the two clinical classes using 't.test' function in R
For multiple hypothesis correction, Q value is the False Discovery Rate (FDR) analogue of the P value (Benjamini and Hochberg 1995), defined as the minimum FDR at which the test may be called significant. We used the 'Benjamini and Hochberg' method of 'p.adjust' function in R to convert P values into Q values.
This is an experimental feature. The full results of the analysis summarized in this report can be downloaded from the TCGA Data Coordination Center.