This pipeline uses various statistical tests to identify genes whose promoter methylation levels correlated to selected clinical features.
Testing the association between 16935 genes and 8 clinical features across 29 samples, statistically thresholded by Q value < 0.05, 2 clinical features related to at least one genes.
-
1 gene correlated to 'GENDER'.
-
UTP14C
-
29 genes correlated to 'PATHOLOGICSPREAD(M)'.
-
WDR76 , UBL5 , SLC30A7 , MAP6D1 , KLF15 , ...
-
No genes correlated to 'Time to Death', 'AGE', 'PATHOLOGY.T', 'PATHOLOGY.N', 'TUMOR.STAGE', and 'NEOADJUVANT.THERAPY'.
Complete statistical result table is provided in Supplement Table 1
Table 1. Get Full Table This table shows the clinical features, statistical methods used, and the number of genes that are significantly associated with each clinical feature at Q value < 0.05.
| Clinical feature | Statistical test | Significant genes | Associated with | Associated with | ||
|---|---|---|---|---|---|---|
| Time to Death | Cox regression test | N=0 | ||||
| AGE | Spearman correlation test | N=0 | ||||
| GENDER | t test | N=1 | male | N=1 | female | N=0 |
| PATHOLOGY T | Spearman correlation test | N=0 | ||||
| PATHOLOGY N | Spearman correlation test | N=0 | ||||
| PATHOLOGICSPREAD(M) | ANOVA test | N=29 | ||||
| TUMOR STAGE | Spearman correlation test | N=0 | ||||
| NEOADJUVANT THERAPY | t test | N=0 |
Table S1. Basic characteristics of clinical feature: 'Time to Death'
| Time to Death | Duration (Months) | 1-71.7 (median=13.9) |
| censored | N = 22 | |
| death | N = 3 | |
| Significant markers | N = 0 |
Table S2. Basic characteristics of clinical feature: 'AGE'
| AGE | Mean (SD) | 64.28 (14) |
| Significant markers | N = 0 |
Table S3. Basic characteristics of clinical feature: 'GENDER'
| GENDER | Labels | N |
| FEMALE | 16 | |
| MALE | 13 | |
| Significant markers | N = 1 | |
| Higher in MALE | 1 | |
| Higher in FEMALE | 0 |
Table S4. Get Full Table List of one gene differentially expressed by 'GENDER'
| T(pos if higher in 'MALE') | ttestP | Q | AUC | |
|---|---|---|---|---|
| UTP14C | 7.67 | 1.095e-06 | 0.0185 | 1 |
Figure S1. Get High-res Image As an example, this figure shows the association of UTP14C to 'GENDER'. P value = 1.1e-06 with T-test analysis.
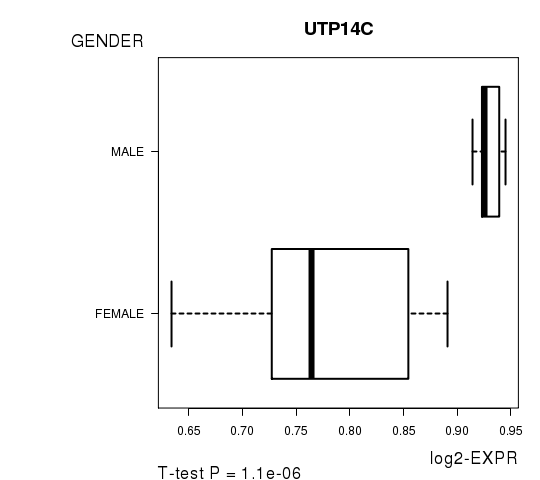
Table S5. Basic characteristics of clinical feature: 'PATHOLOGY.T'
| PATHOLOGY.T | Mean (SD) | 2.79 (0.77) |
| N | ||
| T1 | 2 | |
| T2 | 6 | |
| T3 | 17 | |
| T4 | 4 | |
| Significant markers | N = 0 |
Table S6. Basic characteristics of clinical feature: 'PATHOLOGY.N'
| PATHOLOGY.N | Mean (SD) | 0.45 (0.63) |
| N | ||
| N0 | 18 | |
| N1 | 9 | |
| N2 | 2 | |
| Significant markers | N = 0 |
Table S7. Basic characteristics of clinical feature: 'PATHOLOGICSPREAD(M)'
| PATHOLOGICSPREAD(M) | Labels | N |
| M0 | 22 | |
| M1 | 5 | |
| M1A | 1 | |
| Significant markers | N = 29 |
Table S8. Get Full Table List of top 10 genes differentially expressed by 'PATHOLOGICSPREAD(M)'
| ANOVA_P | Q | |
|---|---|---|
| WDR76 | 3.114e-38 | 5.27e-34 |
| UBL5 | 1.831e-20 | 3.1e-16 |
| SLC30A7 | 4.39e-16 | 7.43e-12 |
| MAP6D1 | 1.79e-15 | 3.03e-11 |
| KLF15 | 4.634e-14 | 7.85e-10 |
| DERL2 | 1.589e-12 | 2.69e-08 |
| MIS12 | 1.589e-12 | 2.69e-08 |
| UGDH | 3.331e-11 | 5.64e-07 |
| HMG20B | 6.915e-11 | 1.17e-06 |
| SEPP1 | 2.748e-09 | 4.65e-05 |
Figure S2. Get High-res Image As an example, this figure shows the association of WDR76 to 'PATHOLOGICSPREAD(M)'. P value = 3.11e-38 with ANOVA analysis.
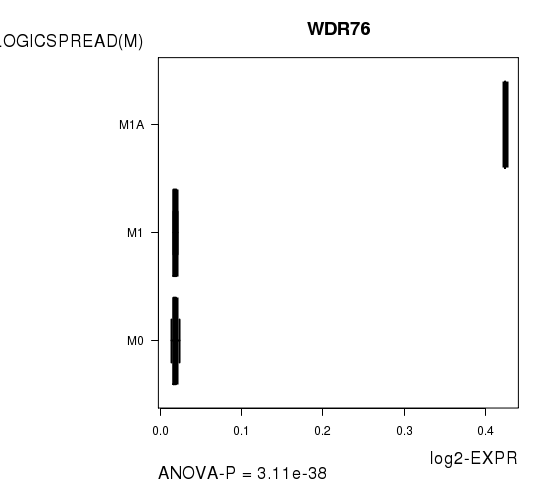
Table S9. Basic characteristics of clinical feature: 'TUMOR.STAGE'
| TUMOR.STAGE | Mean (SD) | 2.36 (1.1) |
| N | ||
| Stage 1 | 6 | |
| Stage 2 | 9 | |
| Stage 3 | 5 | |
| Stage 4 | 5 | |
| Significant markers | N = 0 |
-
Expresson data file = COAD.meth.for_correlation.filtered_data.txt
-
Clinical data file = COAD.clin.merged.picked.txt
-
Number of patients = 29
-
Number of genes = 16935
-
Number of clinical features = 8
For survival clinical features, Wald's test in univariate Cox regression analysis with proportional hazards model (Andersen and Gill 1982) was used to estimate the P values using the 'coxph' function in R. Kaplan-Meier survival curves were plot using the four quartile subgroups of patients based on expression levels
For continuous numerical clinical features, Spearman's rank correlation coefficients (Spearman 1904) and two-tailed P values were estimated using 'cor.test' function in R
For two-class clinical features, two-tailed Student's t test with unequal variance (Lehmann and Romano 2005) was applied to compare the log2-expression levels between the two clinical classes using 't.test' function in R
For multi-class clinical features (ordinal or nominal), one-way analysis of variance (Howell 2002) was applied to compare the log2-expression levels between different clinical classes using 'anova' function in R
For multiple hypothesis correction, Q value is the False Discovery Rate (FDR) analogue of the P value (Benjamini and Hochberg 1995), defined as the minimum FDR at which the test may be called significant. We used the 'Benjamini and Hochberg' method of 'p.adjust' function in R to convert P values into Q values.
This is an experimental feature. The full results of the analysis summarized in this report can be downloaded from the TCGA Data Coordination Center.