This pipeline uses various statistical tests to identify mRNAs whose expression levels correlated to selected clinical features.
Testing the association between 18203 genes and 6 clinical features across 159 samples, statistically thresholded by Q value < 0.05, 4 clinical features related to at least one genes.
-
1 gene correlated to 'AGE'.
-
CBARA1|10367
-
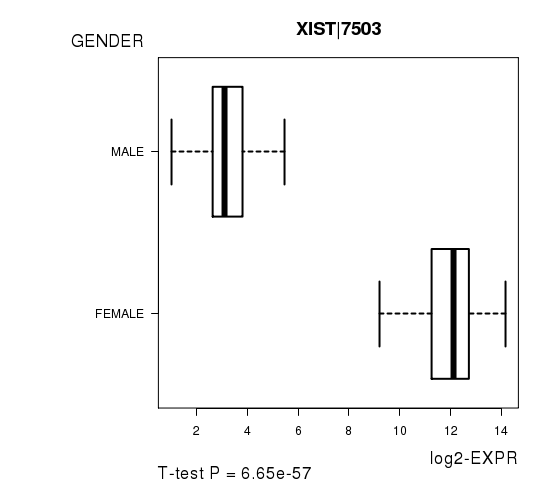
27 genes correlated to 'GENDER'.
-
XIST|7503 , RPS4Y1|6192 , DDX3Y|8653 , KDM5D|8284 , USP9Y|8287 , ...
-
1 gene correlated to 'RADIATIONS.RADIATION.REGIMENINDICATION'.
-
ZBTB33|10009
-
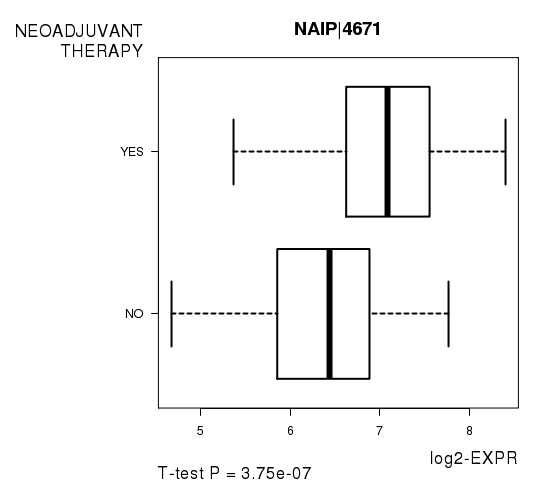
4 genes correlated to 'NEOADJUVANT.THERAPY'.
-
NAIP|4671 , MYO15B|80022 , DDX10|1662 , C16ORF70|80262
-
No genes correlated to 'Time to Death', and 'KARNOFSKY.PERFORMANCE.SCORE'.
Complete statistical result table is provided in Supplement Table 1
Table 1. Get Full Table This table shows the clinical features, statistical methods used, and the number of genes that are significantly associated with each clinical feature at Q value < 0.05.
| Clinical feature | Statistical test | Significant genes | Associated with | Associated with | ||
|---|---|---|---|---|---|---|
| Time to Death | Cox regression test | N=0 | ||||
| AGE | Spearman correlation test | N=1 | older | N=0 | younger | N=1 |
| GENDER | t test | N=27 | male | N=15 | female | N=12 |
| KARNOFSKY PERFORMANCE SCORE | Spearman correlation test | N=0 | ||||
| RADIATIONS RADIATION REGIMENINDICATION | t test | N=1 | yes | N=0 | no | N=1 |
| NEOADJUVANT THERAPY | t test | N=4 | yes | N=3 | no | N=1 |
Table S1. Basic characteristics of clinical feature: 'Time to Death'
| Time to Death | Duration (Months) | 0.2-54 (median=8.8) |
| censored | N = 53 | |
| death | N = 106 | |
| Significant markers | N = 0 |
Table S2. Basic characteristics of clinical feature: 'AGE'
| AGE | Mean (SD) | 59.77 (13) |
| Significant markers | N = 1 | |
| pos. correlated | 0 | |
| neg. correlated | 1 |
Table S3. Get Full Table List of one gene significantly correlated to 'AGE' by Spearman correlation test
| SpearmanCorr | corrP | Q | |
|---|---|---|---|
| CBARA1|10367 | -0.3796 | 8.048e-07 | 0.0147 |
Figure S1. Get High-res Image As an example, this figure shows the association of CBARA1|10367 to 'AGE'. P value = 8.05e-07 with Spearman correlation analysis. The straight line presents the best linear regression.

Table S4. Basic characteristics of clinical feature: 'GENDER'
| GENDER | Labels | N |
| FEMALE | 56 | |
| MALE | 103 | |
| Significant markers | N = 27 | |
| Higher in MALE | 15 | |
| Higher in FEMALE | 12 |
Table S5. Get Full Table List of top 10 genes differentially expressed by 'GENDER'
| T(pos if higher in 'MALE') | ttestP | Q | AUC | |
|---|---|---|---|---|
| XIST|7503 | -38.75 | 6.649e-57 | 1.21e-52 | 1 |
| RPS4Y1|6192 | 49.77 | 8.603e-57 | 1.57e-52 | 1 |
| DDX3Y|8653 | 51.38 | 1.114e-51 | 2.03e-47 | 1 |
| KDM5D|8284 | 45.62 | 4.365e-51 | 7.94e-47 | 1 |
| USP9Y|8287 | 51.16 | 5.952e-50 | 1.08e-45 | 1 |
| CYORF15A|246126 | 44.58 | 5.64e-47 | 1.03e-42 | 1 |
| TSIX|9383 | -23.01 | 3.45e-43 | 6.28e-39 | 0.9977 |
| ZFY|7544 | 49.76 | 1.33e-41 | 2.42e-37 | 1 |
| EIF1AY|9086 | 42.31 | 8.049e-41 | 1.46e-36 | 1 |
| PRKY|5616 | 26.57 | 4.237e-37 | 7.71e-33 | 0.9989 |
Figure S2. Get High-res Image As an example, this figure shows the association of XIST|7503 to 'GENDER'. P value = 6.65e-57 with T-test analysis.
No gene related to 'KARNOFSKY.PERFORMANCE.SCORE'.
Table S6. Basic characteristics of clinical feature: 'KARNOFSKY.PERFORMANCE.SCORE'
| KARNOFSKY.PERFORMANCE.SCORE | Mean (SD) | 76.3 (15) |
| Significant markers | N = 0 |
One gene related to 'RADIATIONS.RADIATION.REGIMENINDICATION'.
Table S7. Basic characteristics of clinical feature: 'RADIATIONS.RADIATION.REGIMENINDICATION'
| RADIATIONS.RADIATION.REGIMENINDICATION | Labels | N |
| NO | 103 | |
| YES | 56 | |
| Significant markers | N = 1 | |
| Higher in YES | 0 | |
| Higher in NO | 1 |
Table S8. Get Full Table List of one gene differentially expressed by 'RADIATIONS.RADIATION.REGIMENINDICATION'
| T(pos if higher in 'YES') | ttestP | Q | AUC | |
|---|---|---|---|---|
| ZBTB33|10009 | -5.15 | 1.072e-06 | 0.0195 | 0.7243 |
Figure S3. Get High-res Image As an example, this figure shows the association of ZBTB33|10009 to 'RADIATIONS.RADIATION.REGIMENINDICATION'. P value = 1.07e-06 with T-test analysis.

Table S9. Basic characteristics of clinical feature: 'NEOADJUVANT.THERAPY'
| NEOADJUVANT.THERAPY | Labels | N |
| NO | 80 | |
| YES | 79 | |
| Significant markers | N = 4 | |
| Higher in YES | 3 | |
| Higher in NO | 1 |
Table S10. Get Full Table List of 4 genes differentially expressed by 'NEOADJUVANT.THERAPY'
| T(pos if higher in 'YES') | ttestP | Q | AUC | |
|---|---|---|---|---|
| NAIP|4671 | 5.31 | 3.75e-07 | 0.00683 | 0.734 |
| MYO15B|80022 | 5 | 1.601e-06 | 0.0291 | 0.7059 |
| DDX10|1662 | -4.95 | 2.021e-06 | 0.0368 | 0.6934 |
| C16ORF70|80262 | 4.91 | 2.316e-06 | 0.0421 | 0.7215 |
Figure S4. Get High-res Image As an example, this figure shows the association of NAIP|4671 to 'NEOADJUVANT.THERAPY'. P value = 3.75e-07 with T-test analysis.
-
Expresson data file = GBM.uncv2.mRNAseq_RSEM_normalized_log2.txt
-
Clinical data file = GBM.clin.merged.picked.txt
-
Number of patients = 159
-
Number of genes = 18203
-
Number of clinical features = 6
For survival clinical features, Wald's test in univariate Cox regression analysis with proportional hazards model (Andersen and Gill 1982) was used to estimate the P values using the 'coxph' function in R. Kaplan-Meier survival curves were plot using the four quartile subgroups of patients based on expression levels
For continuous numerical clinical features, Spearman's rank correlation coefficients (Spearman 1904) and two-tailed P values were estimated using 'cor.test' function in R
For two-class clinical features, two-tailed Student's t test with unequal variance (Lehmann and Romano 2005) was applied to compare the log2-expression levels between the two clinical classes using 't.test' function in R
For multiple hypothesis correction, Q value is the False Discovery Rate (FDR) analogue of the P value (Benjamini and Hochberg 1995), defined as the minimum FDR at which the test may be called significant. We used the 'Benjamini and Hochberg' method of 'p.adjust' function in R to convert P values into Q values.
This is an experimental feature. The full results of the analysis summarized in this report can be downloaded from the TCGA Data Coordination Center.