This report serves to describe the mutational landscape and properties of a given individual set, as well as rank genes and genesets according to mutational significance. MutSig v2.0 was used to generate the results found in this report.
-
Working with individual set: GBM
-
Number of patients in set: 276
The input for this pipeline is a set of individuals with the following files associated for each:
-
An annotated .maf file describing the mutations called for the respective individual, and their properties.
-
A .wig file that contains information about the coverage of the sample.
-
MAF used for this analysis:GBM.final_analysis_set.maf
-
Significantly mutated genes (q ≤ 0.1): 257
-
Mutations seen in COSMIC: 446
-
Significantly mutated genes in COSMIC territory: 55
-
Genes with clustered mutations (≤ 3 aa apart): 393
-
Significantly mutated genesets: 164
-
Significantly mutated genesets: (excluding sig. mutated genes):0
-
Read 276 MAFs of type "Broad"
-
Total number of mutations in input MAFs: 36691
-
Number of mutations before filtering: 36691
-
After removing 139 mutations outside gene set: 36552
-
After removing 81 mutations outside category set: 36471
-
After removing 233 "impossible" mutations in
-
gene-patient-category bins of zero coverage: 36238
Table 1. Get Full Table Table representing breakdown of mutations by type.
| type | count |
|---|---|
| De_novo_Start_InFrame | 6 |
| De_novo_Start_OutOfFrame | 10 |
| Frame_Shift_Del | 814 |
| Frame_Shift_Ins | 363 |
| In_Frame_Del | 329 |
| In_Frame_Ins | 38 |
| Indel | 1 |
| Missense_Mutation | 23575 |
| Nonsense_Mutation | 1747 |
| Nonstop_Mutation | 17 |
| Silent | 8955 |
| Splice_Site_DNP | 11 |
| Splice_Site_Del | 102 |
| Splice_Site_Ins | 28 |
| Splice_Site_ONP | 1 |
| Splice_Site_SNP | 469 |
| Start_Codon_Del | 2 |
| Start_Codon_Ins | 1 |
| Stop_Codon_Del | 2 |
| Total | 36471 |
Table 2. Get Full Table A breakdown of mutation rates per category discovered for this individual set.
| category | n | N | rate | rate_per_mb | relative_rate |
|---|---|---|---|---|---|
| *CpG->T | 8794 | 406970401 | 0.000022 | 22 | 6 |
| *Cp(A/C/T)->T | 3993 | 3448378213 | 1.2e-06 | 1.2 | 0.32 |
| C->(G/A) | 5881 | 3855348614 | 1.5e-06 | 1.5 | 0.43 |
| A->mut | 4753 | 3770634164 | 1.3e-06 | 1.3 | 0.35 |
| indel+null | 3857 | 7625982864 | 5.1e-07 | 0.51 | 0.14 |
| double_null | 79 | 7625982864 | 1e-08 | 0.01 | 0.0029 |
| Total | 27357 | 7625982864 | 3.6e-06 | 3.6 | 1 |
The x axis represents the samples. The y axis represents the exons, one row per exon, and they are sorted by average coverage across samples. For exons with exactly the same average coverage, they are sorted next by the %GC of the exon. (The secondary sort is especially useful for the zero-coverage exons at the bottom).
Figure 1.
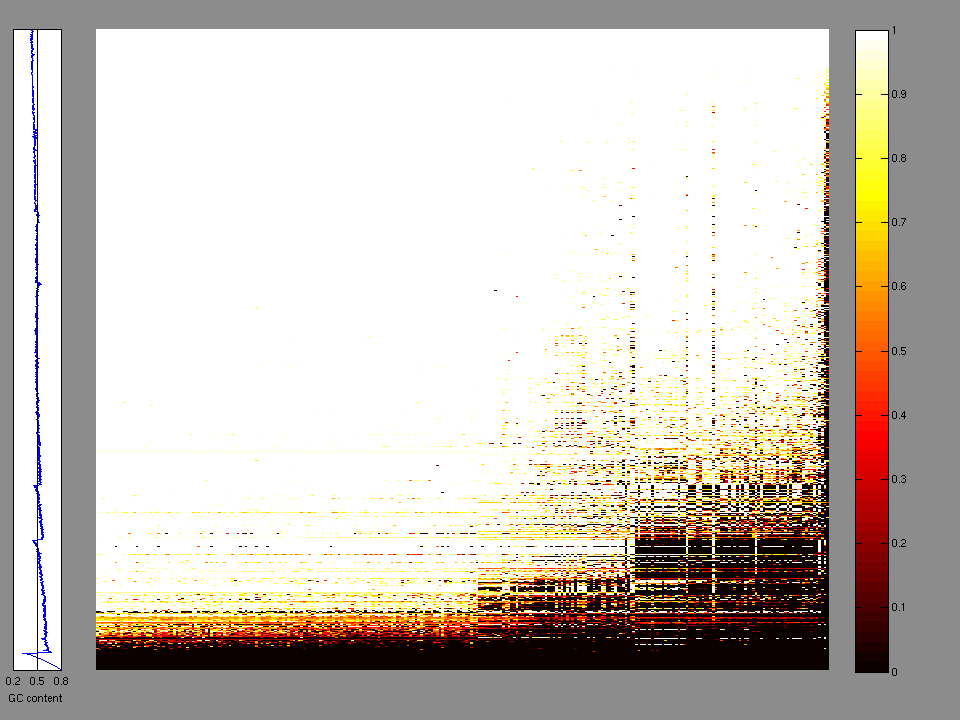
Figure 2. Patients counts and rates file used to generate this plot: GBM.patients.counts_and_rates.txt
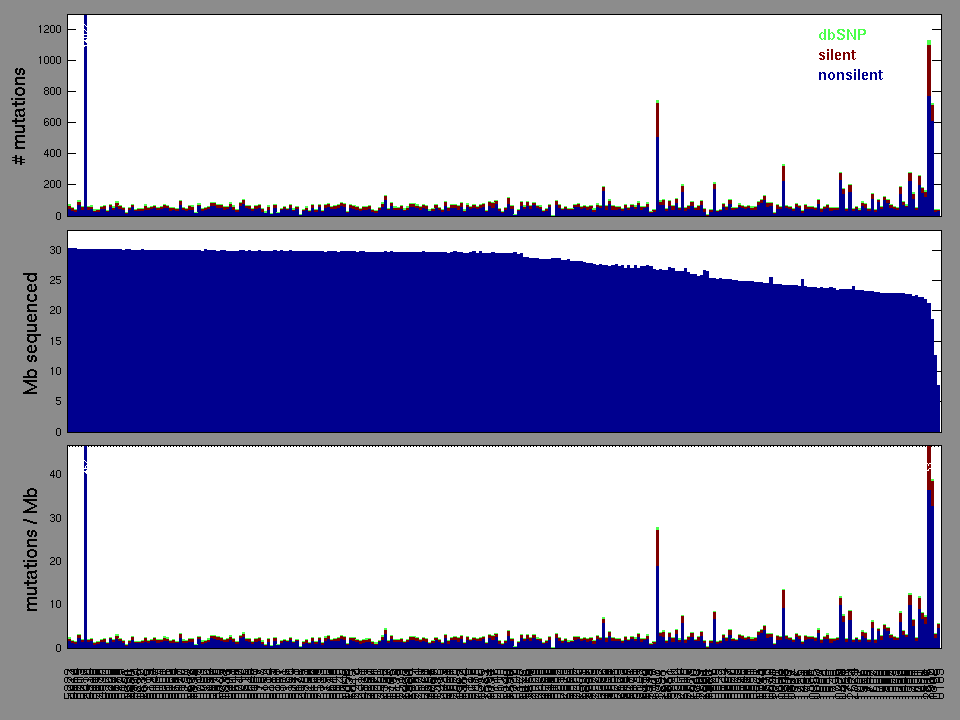
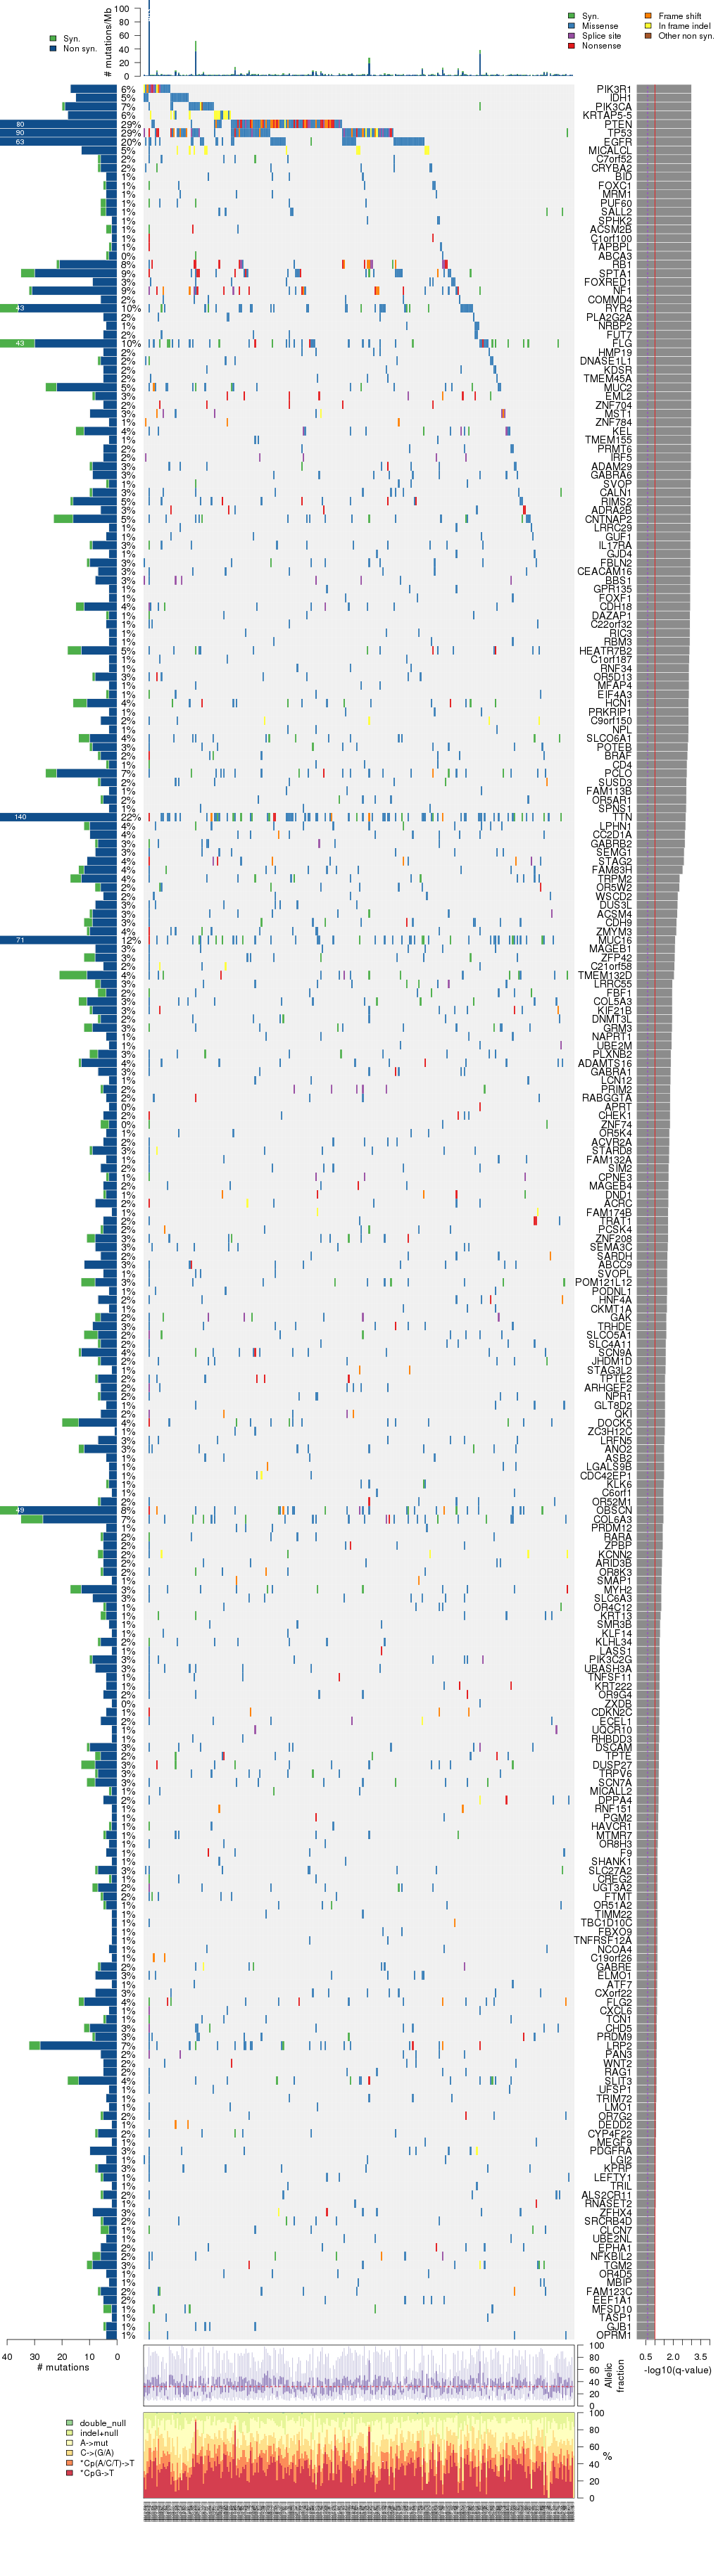
Figure 3. Get High-res Image The matrix in the center of the figure represents individual mutations in patient samples, color-coded by type of mutation, for the significantly mutated genes. The rate of synonymous and non-synonymous mutations is displayed at the top of the matrix. The barplot on the left of the matrix shows the number of mutations in each gene. The percentages represent the fraction of tumors with at least one mutation in the specified gene. The barplot to the right of the matrix displays the q-values for the most significantly mutated genes. The purple boxplots below the matrix (only displayed if required columns are present in the provided MAF) represent the distributions of allelic fractions observed in each sample. The plot at the bottom represents the base substitution distribution of individual samples, using the same categories that were used to calculate significance.
Column Descriptions:
-
N = number of sequenced bases in this gene across the individual set
-
n = number of (nonsilent) mutations in this gene across the individual set
-
npat = number of patients (individuals) with at least one nonsilent mutation
-
nsite = number of unique sites having a non-silent mutation
-
nsil = number of silent mutations in this gene across the individual set
-
n1 = number of nonsilent mutations of type: *CpG->T
-
n2 = number of nonsilent mutations of type: *Cp(A/C/T)->T
-
n3 = number of nonsilent mutations of type: C->(G/A)
-
n4 = number of nonsilent mutations of type: A->mut
-
n5 = number of nonsilent mutations of type: indel+null
-
n6 = number of nonsilent mutations of type: double_null
-
p_classic = p-value for the observed amount of nonsilent mutations being elevated in this gene
-
p_ks = p-value for clustering of mutations (Kolmogorov-Smirnoff test)
-
p_cons = p-value for enrichment of mutations at evolutionarily most-conserved sites in gene
-
p_joint = p-value for clustering + conservation
-
p = p-value (overall)
-
q = q-value, False Discovery Rate (Benjamini-Hochberg procedure)
Table 3. Get Full Table A Ranked List of Significantly Mutated Genes. Number of significant genes found: 257. Number of genes displayed: 35. Click on a gene name to display its stick figure depicting the distribution of mutations and mutation types across the chosen gene (this feature may not be available for all significant genes).
| rank | gene | description | N | n | npat | nsite | nsil | n1 | n2 | n3 | n4 | n5 | n6 | p_classic | p_ks | p_cons | p_joint | p | q |
|---|---|---|---|---|---|---|---|---|---|---|---|---|---|---|---|---|---|---|---|
| 1 | PIK3R1 | phosphoinositide-3-kinase, regulatory subunit 1 (alpha) | 642722 | 17 | 17 | 14 | 0 | 0 | 3 | 2 | 4 | 8 | 0 | 1.90e-14 | 0.000013 | 0.0045 | 0.000014 | 0.000 | 0.000 |
| 2 | IDH1 | isocitrate dehydrogenase 1 (NADP+), soluble | 349470 | 15 | 15 | 2 | 0 | 14 | 0 | 1 | 0 | 0 | 0 | 6.11e-15 | 2e-07 | 0.97 | 0.000012 | 0.000 | 0.000 |
| 3 | PIK3CA | phosphoinositide-3-kinase, catalytic, alpha polypeptide | 885302 | 19 | 19 | 17 | 1 | 3 | 5 | 2 | 7 | 2 | 0 | 5.33e-15 | 0.018 | 0.0053 | 0.0028 | 5.55e-16 | 8.92e-13 |
| 4 | KRTAP5-5 | keratin associated protein 5-5 | 181491 | 18 | 16 | 7 | 0 | 0 | 0 | 3 | 1 | 14 | 0 | 4.22e-15 | 0.0012 | 1 | 0.0039 | 6.66e-16 | 8.92e-13 |
| 5 | PTEN | phosphatase and tensin homolog (mutated in multiple advanced cancers 1) | 314597 | 80 | 79 | 65 | 0 | 7 | 19 | 8 | 11 | 35 | 0 | <1.00e-15 | 0.0098 | 0.48 | 0.02 | <7.77e-16 | <8.92e-13 |
| 6 | TP53 | tumor protein p53 | 344937 | 89 | 80 | 63 | 1 | 23 | 15 | 12 | 13 | 24 | 2 | 1.89e-15 | 2e-07 | 2e-07 | 0 | <1.00e-15 | <8.92e-13 |
| 7 | EGFR | epidermal growth factor receptor (erythroblastic leukemia viral (v-erb-b) oncogene homolog, avian) | 1089173 | 58 | 54 | 26 | 5 | 9 | 21 | 23 | 5 | 0 | 0 | 2.55e-15 | 2e-07 | 2e-07 | 0 | <1.00e-15 | <8.92e-13 |
| 8 | MICALCL | MICAL C-terminal like | 537385 | 13 | 13 | 3 | 0 | 0 | 0 | 0 | 1 | 12 | 0 | 3.66e-12 | 2e-07 | 0.63 | 0 | <1.00e-15 | <8.92e-13 |
| 9 | C7orf52 | chromosome 7 open reading frame 52 | 247344 | 6 | 6 | 2 | 1 | 1 | 5 | 0 | 0 | 0 | 0 | 0.000105 | 0.00082 | 2e-07 | 0 | <1.00e-15 | <8.92e-13 |
| 10 | CRYBA2 | crystallin, beta A2 | 136089 | 6 | 6 | 3 | 1 | 0 | 0 | 5 | 1 | 0 | 0 | 2.72e-07 | 2e-07 | 0.86 | 0 | <1.00e-15 | <8.92e-13 |
| 11 | BID | BH3 interacting domain death agonist | 174925 | 4 | 4 | 1 | 0 | 0 | 0 | 0 | 4 | 0 | 0 | 0.000365 | 2e-07 | 0.89 | 0 | <1.00e-15 | <8.92e-13 |
| 12 | FOXC1 | forkhead box C1 | 130178 | 4 | 4 | 3 | 1 | 0 | 0 | 3 | 1 | 0 | 0 | 0.000199 | 2e-07 | 0.57 | 0 | <1.00e-15 | <8.92e-13 |
| 13 | MRM1 | mitochondrial rRNA methyltransferase 1 homolog (S. cerevisiae) | 284558 | 4 | 4 | 1 | 0 | 0 | 0 | 0 | 4 | 0 | 0 | 0.00203 | 2e-07 | 0.42 | 0 | <1.00e-15 | <8.92e-13 |
| 14 | PUF60 | poly-U binding splicing factor 60KDa | 249059 | 4 | 4 | 1 | 2 | 0 | 0 | 4 | 0 | 0 | 0 | 0.00106 | 2e-07 | 0.21 | 0 | <1.00e-15 | <8.92e-13 |
| 15 | SALL2 | sal-like 2 (Drosophila) | 820150 | 4 | 4 | 2 | 2 | 0 | 0 | 4 | 0 | 0 | 0 | 0.0675 | 2e-07 | 0.76 | 0 | <1.00e-15 | <8.92e-13 |
| 16 | SPHK2 | sphingosine kinase 2 | 414038 | 2 | 3 | 1 | 0 | 0 | 0 | 2 | 0 | 0 | 0 | 0.188 | 1e-06 | 0.000026 | 0 | <1.00e-15 | <8.92e-13 |
| 17 | ACSM2B | acyl-CoA synthetase medium-chain family member 2B | 454814 | 2 | 2 | 2 | 2 | 0 | 0 | 0 | 1 | 1 | 0 | 0.131 | 0.00023 | 0.68 | 0 | <1.00e-15 | <8.92e-13 |
| 18 | C1orf100 | chromosome 1 open reading frame 100 | 126907 | 2 | 2 | 2 | 0 | 0 | 0 | 0 | 0 | 2 | 0 | 0.0386 | 0.013 | 0.75 | 0 | <1.00e-15 | <8.92e-13 |
| 19 | TAPBPL | TAP binding protein-like | 353808 | 2 | 2 | 2 | 1 | 0 | 1 | 0 | 0 | 1 | 0 | 0.206 | 0.00049 | 0.66 | 0 | <1.00e-15 | <8.92e-13 |
| 20 | ABCA3 | ATP-binding cassette, sub-family A (ABC1), member 3 | 1218196 | 3 | 1 | 3 | 1 | 0 | 0 | 2 | 1 | 0 | 0 | 0.945 | 2e-07 | 0.011 | 0 | <1.00e-15 | <8.92e-13 |
| 21 | RB1 | retinoblastoma 1 (including osteosarcoma) | 722445 | 21 | 21 | 19 | 1 | 1 | 1 | 1 | 0 | 18 | 0 | 1.15e-14 | 0.045 | 0.28 | 0.059 | 2.44e-14 | 2.08e-11 |
| 22 | SPTA1 | spectrin, alpha, erythrocytic 1 (elliptocytosis 2) | 2040988 | 30 | 26 | 28 | 5 | 12 | 4 | 6 | 1 | 7 | 0 | 1.82e-14 | 0.27 | 0.3 | 0.49 | 2.99e-13 | 2.42e-10 |
| 23 | FOXRED1 | FAD-dependent oxidoreductase domain containing 1 | 345284 | 9 | 9 | 1 | 0 | 0 | 0 | 0 | 9 | 0 | 0 | 4.46e-09 | 2e-07 | 0.93 | 0.000015 | 2.15e-12 | 1.67e-09 |
| 24 | NF1 | neurofibromin 1 (neurofibromatosis, von Recklinghausen disease, Watson disease) | 2380799 | 31 | 25 | 30 | 1 | 2 | 5 | 3 | 4 | 14 | 3 | 8.69e-13 | 0.43 | 0.66 | 0.59 | 1.50e-11 | 1.12e-08 |
| 25 | COMMD4 | COMM domain containing 4 | 147026 | 6 | 6 | 1 | 0 | 0 | 0 | 6 | 0 | 0 | 0 | 1.79e-07 | 2e-07 | 1 | 0.000019 | 9.21e-11 | 6.58e-08 |
| 26 | RYR2 | ryanodine receptor 2 (cardiac) | 3381004 | 36 | 28 | 35 | 7 | 21 | 3 | 6 | 6 | 0 | 0 | 1.10e-10 | 0.11 | 0.38 | 0.13 | 3.78e-10 | 2.59e-07 |
| 27 | PLA2G2A | phospholipase A2, group IIA (platelets, synovial fluid) | 123007 | 5 | 5 | 1 | 0 | 0 | 0 | 5 | 0 | 0 | 0 | 1.62e-06 | 4e-07 | 0.27 | 1e-05 | 4.27e-10 | 2.82e-07 |
| 28 | NRBP2 | nuclear receptor binding protein 2 | 119779 | 4 | 4 | 1 | 0 | 0 | 4 | 0 | 0 | 0 | 0 | 2.33e-05 | 4e-07 | 0.99 | 1.6e-06 | 9.33e-10 | 5.95e-07 |
| 29 | FUT7 | fucosyltransferase 7 (alpha (1,3) fucosyltransferase) | 113313 | 5 | 5 | 1 | 0 | 0 | 0 | 5 | 0 | 0 | 0 | 5.18e-06 | 2e-07 | 0.95 | 0.000017 | 2.10e-09 | 1.29e-06 |
| 30 | FLG | filaggrin | 3183335 | 30 | 28 | 30 | 13 | 12 | 6 | 6 | 3 | 3 | 0 | 8.10e-10 | 0.63 | 0.038 | 0.15 | 2.84e-09 | 1.69e-06 |
| 31 | HMP19 | 143577 | 5 | 5 | 1 | 0 | 0 | 0 | 5 | 0 | 0 | 0 | 1.30e-05 | 2e-07 | 0.92 | 1e-05 | 3.15e-09 | 1.81e-06 | |
| 32 | DNASE1L1 | deoxyribonuclease I-like 1 | 189681 | 6 | 6 | 2 | 1 | 1 | 0 | 5 | 0 | 0 | 0 | 1.43e-06 | 0.000065 | 0.07 | 0.0001 | 3.51e-09 | 1.96e-06 |
| 33 | KDSR | 3-ketodihydrosphingosine reductase | 270146 | 5 | 5 | 1 | 0 | 0 | 0 | 5 | 0 | 0 | 0 | 6.51e-05 | 2e-07 | 0.62 | 4e-06 | 6.00e-09 | 3.25e-06 |
| 34 | TMEM45A | transmembrane protein 45A | 233464 | 5 | 5 | 1 | 0 | 0 | 0 | 0 | 5 | 0 | 0 | 5.02e-05 | 2e-07 | 0.08 | 8.8e-06 | 9.96e-09 | 5.23e-06 |
| 35 | MUC2 | mucin 2, oligomeric mucus/gel-forming | 1046521 | 22 | 15 | 19 | 4 | 9 | 1 | 7 | 4 | 1 | 0 | 4.09e-09 | 0.19 | 0.94 | 0.29 | 2.57e-08 | 1.31e-05 |
Figure S1. This figure depicts the distribution of mutations and mutation types across the PIK3R1 significant gene.
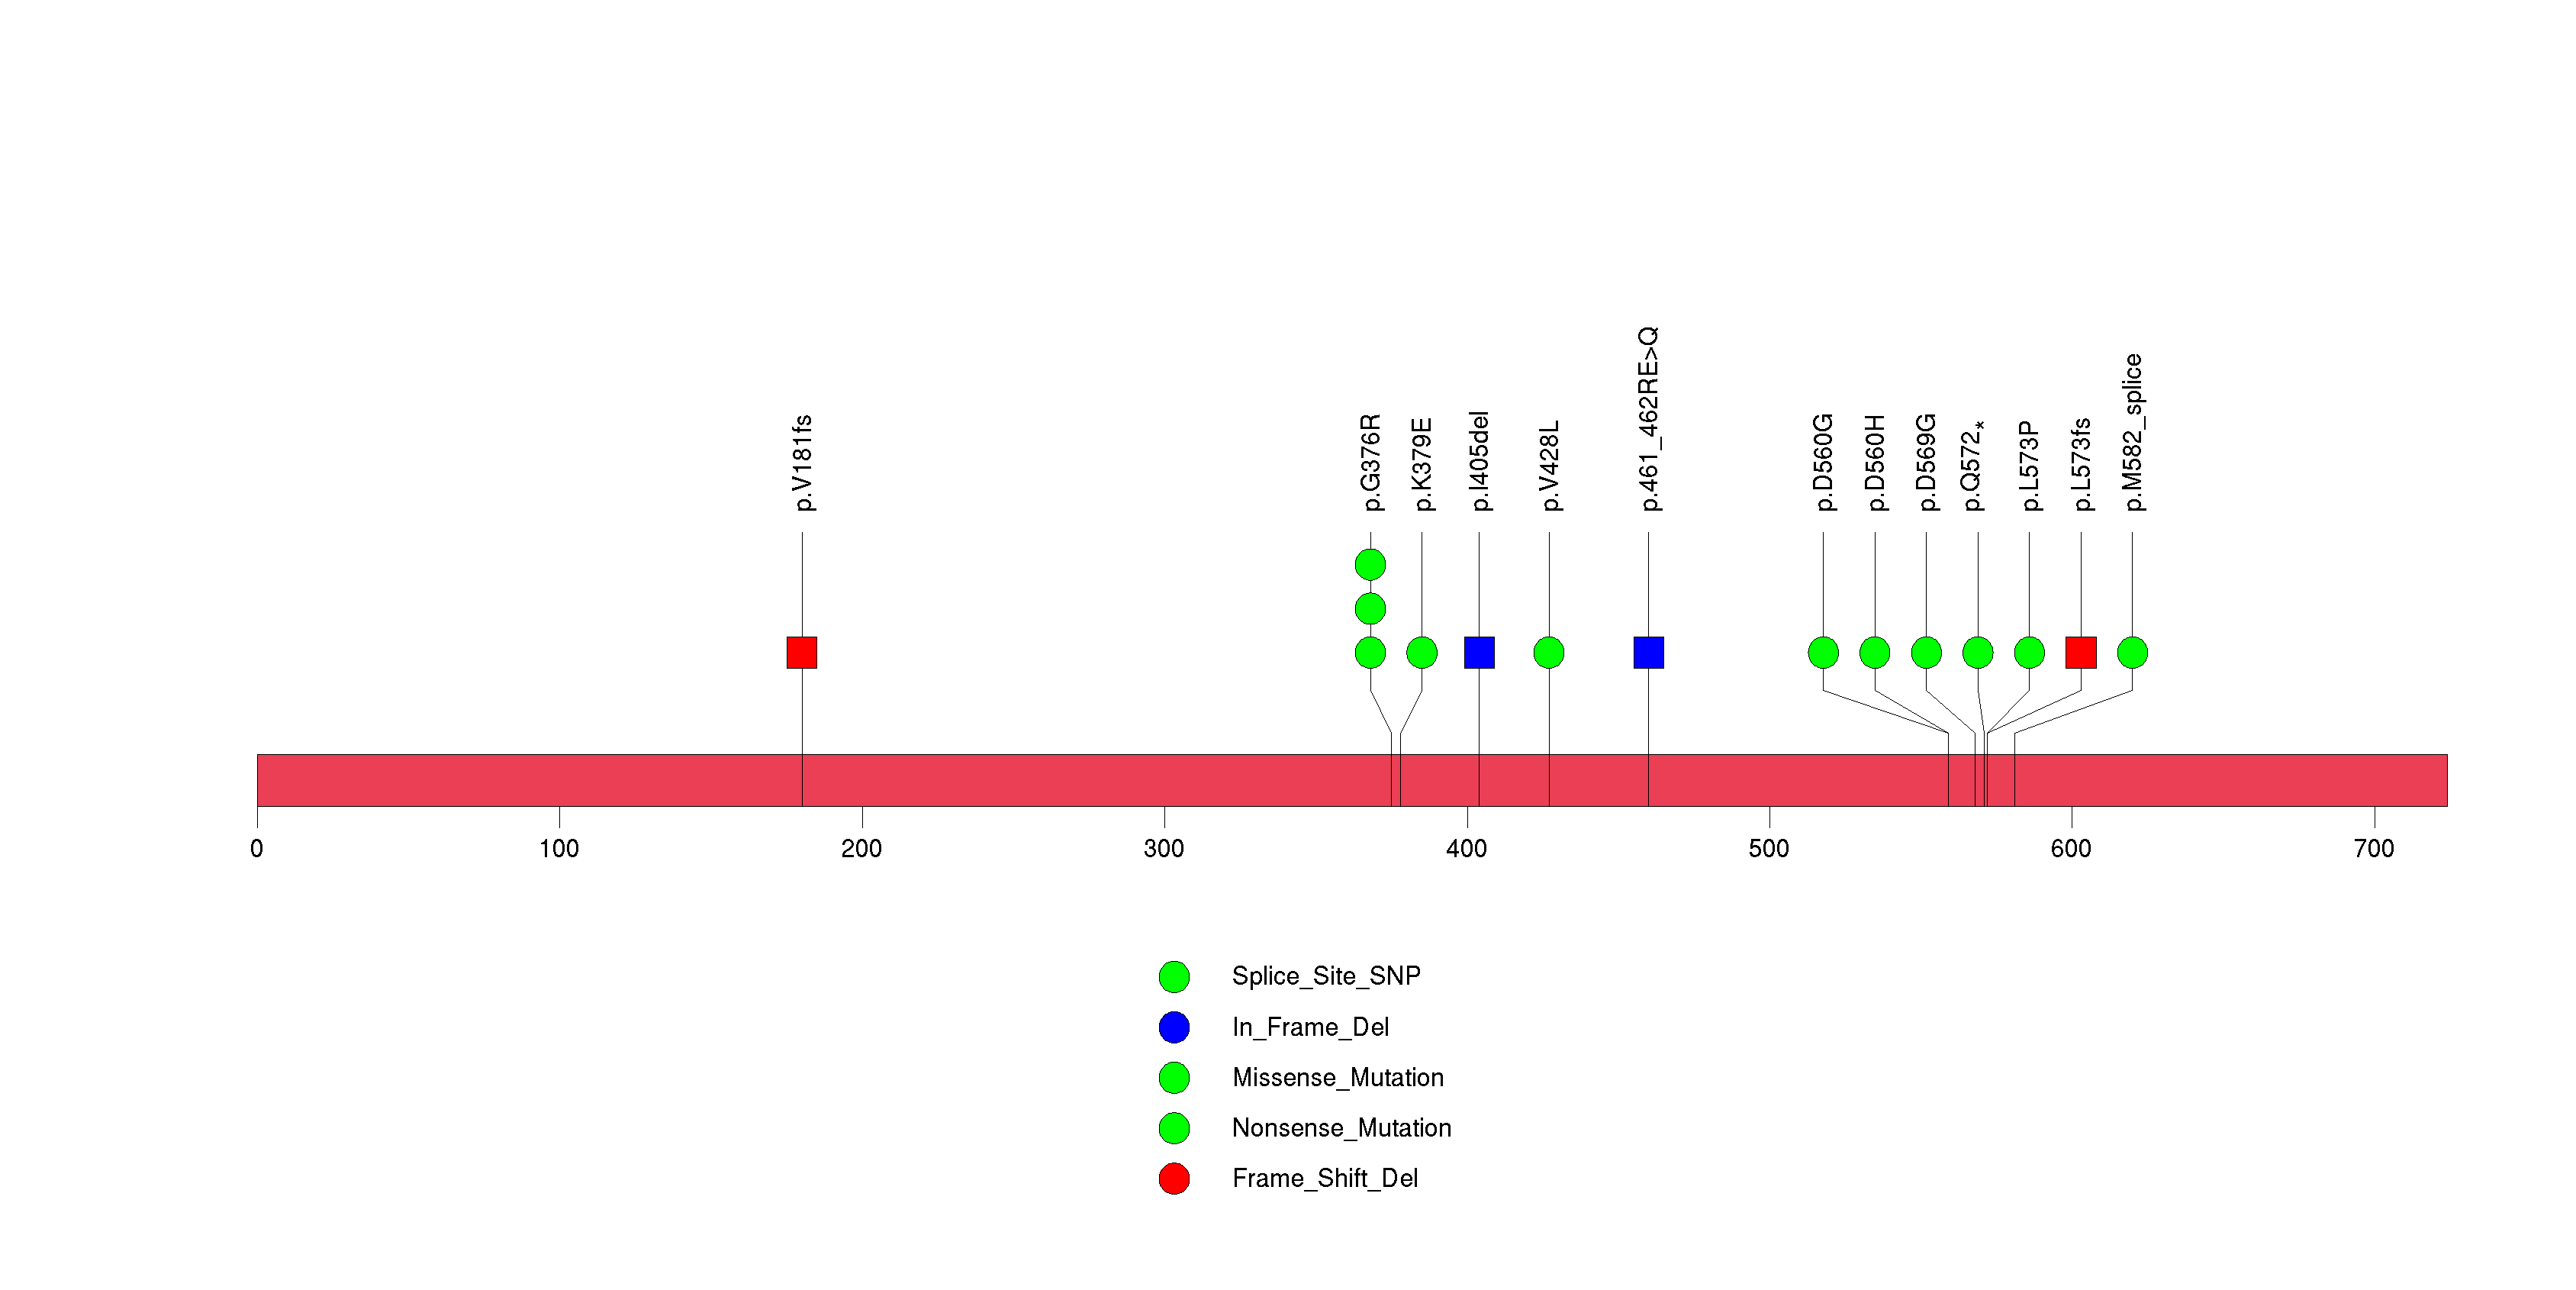
Figure S2. This figure depicts the distribution of mutations and mutation types across the IDH1 significant gene.
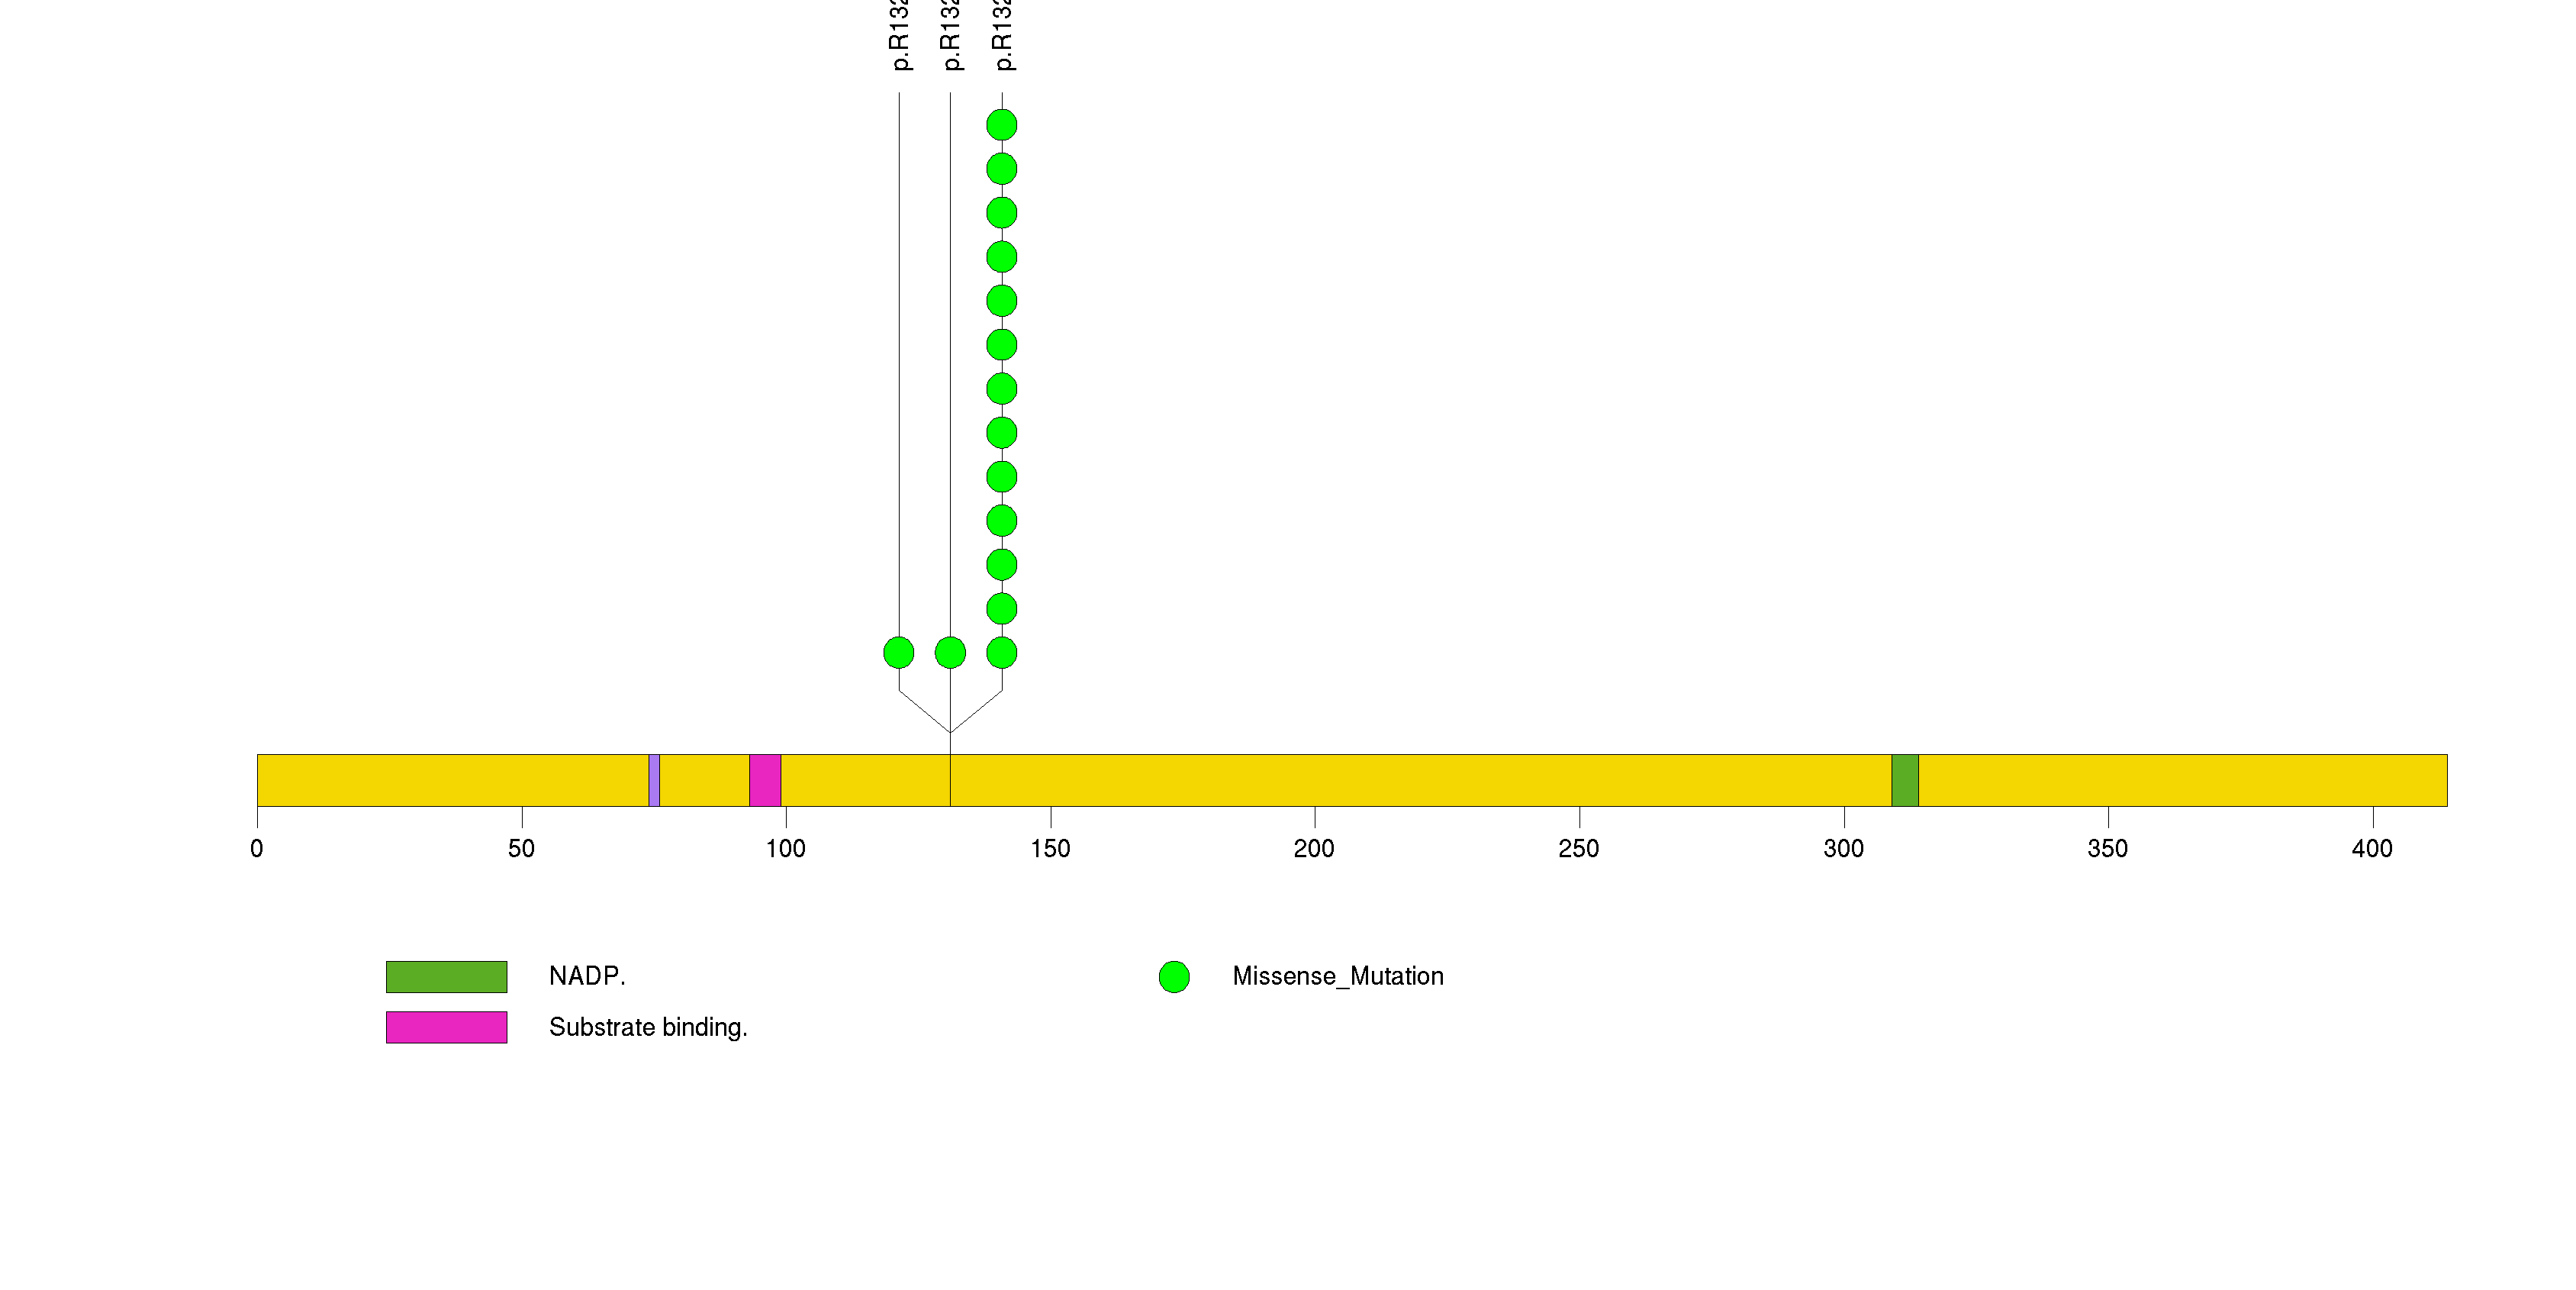
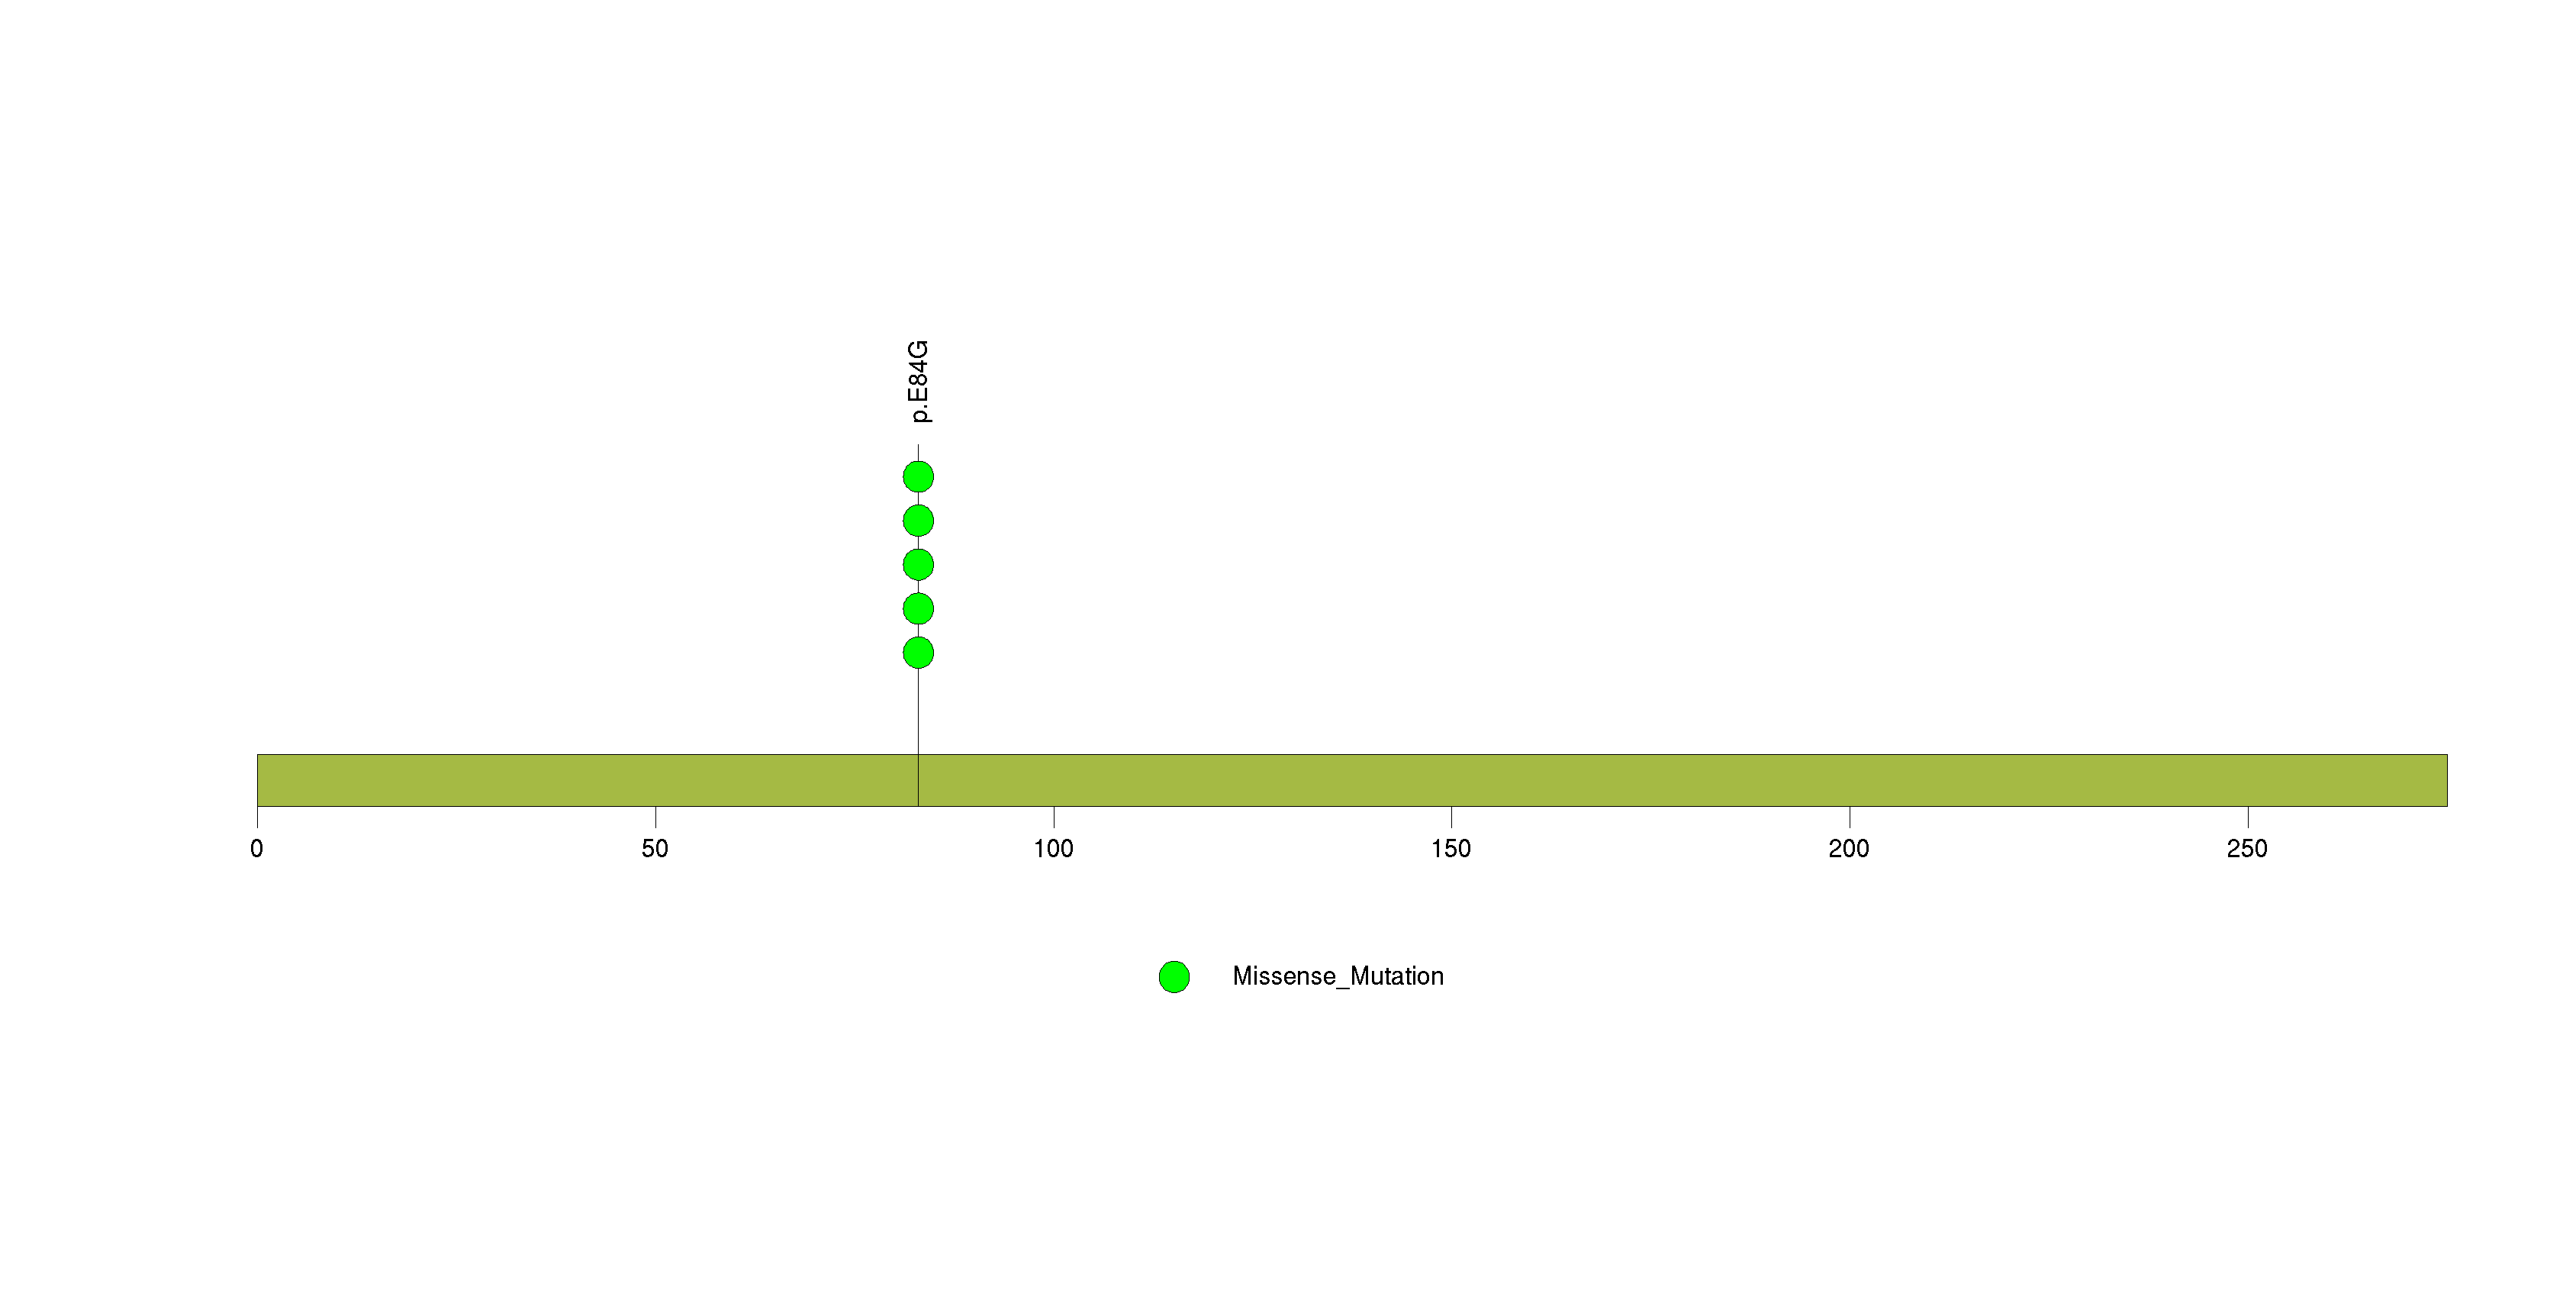
Figure S3. This figure depicts the distribution of mutations and mutation types across the PIK3CA significant gene.
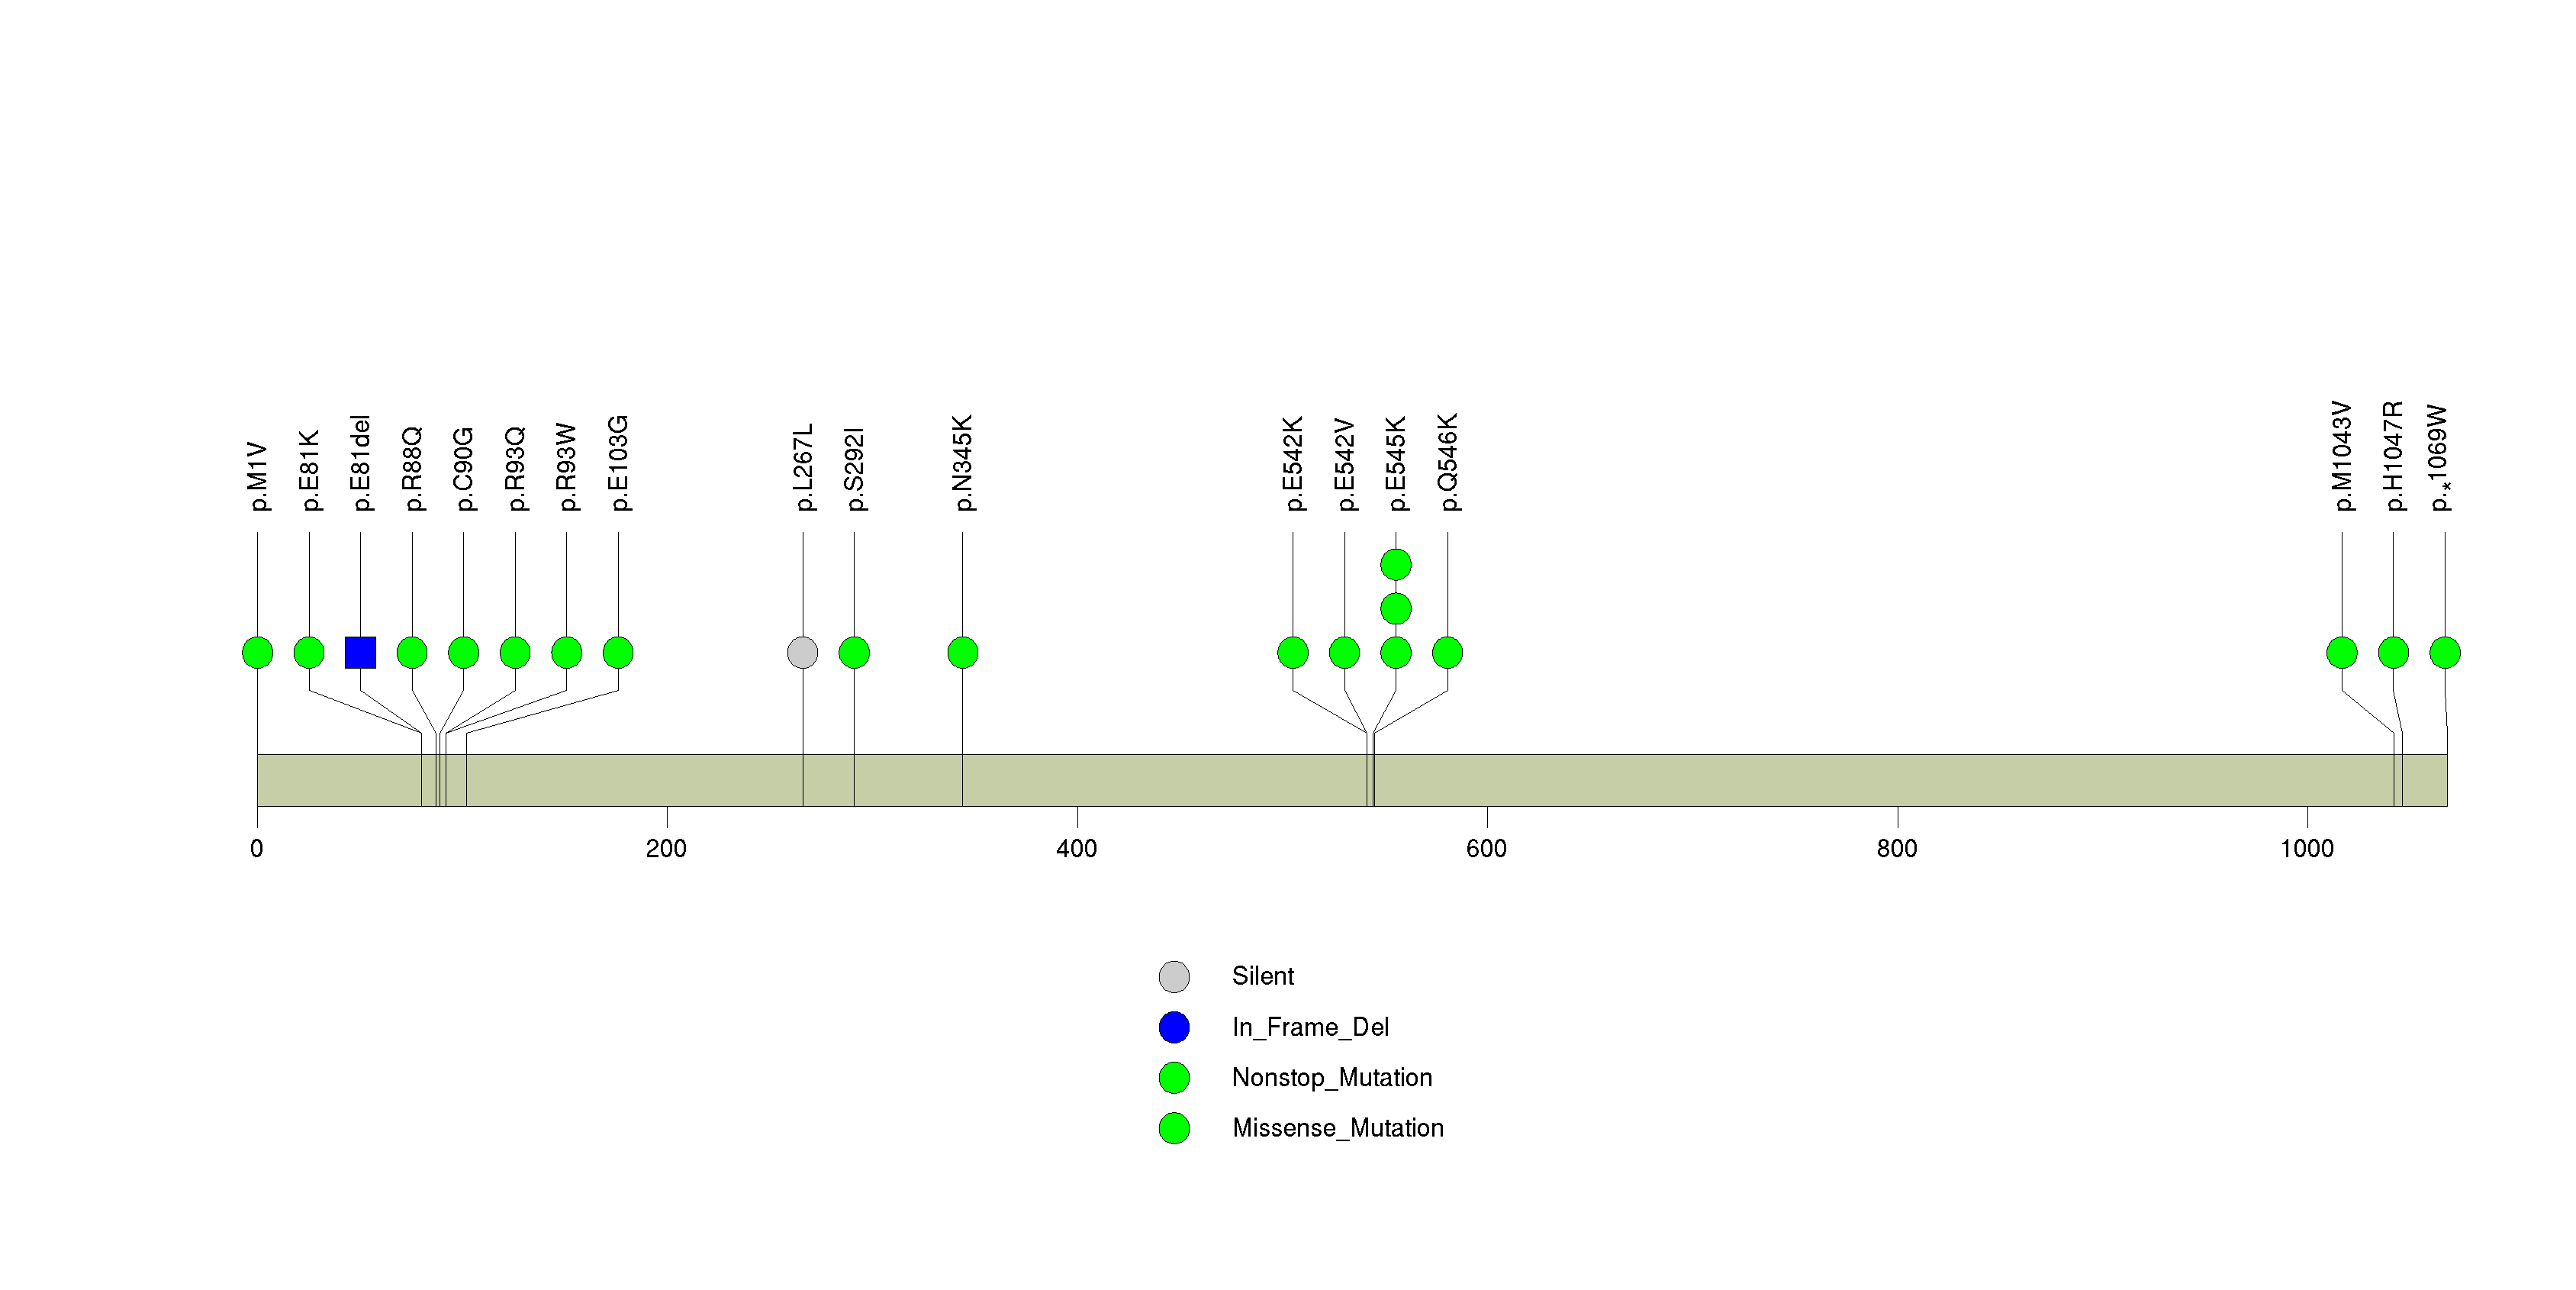
Figure S4. This figure depicts the distribution of mutations and mutation types across the KRTAP5-5 significant gene.
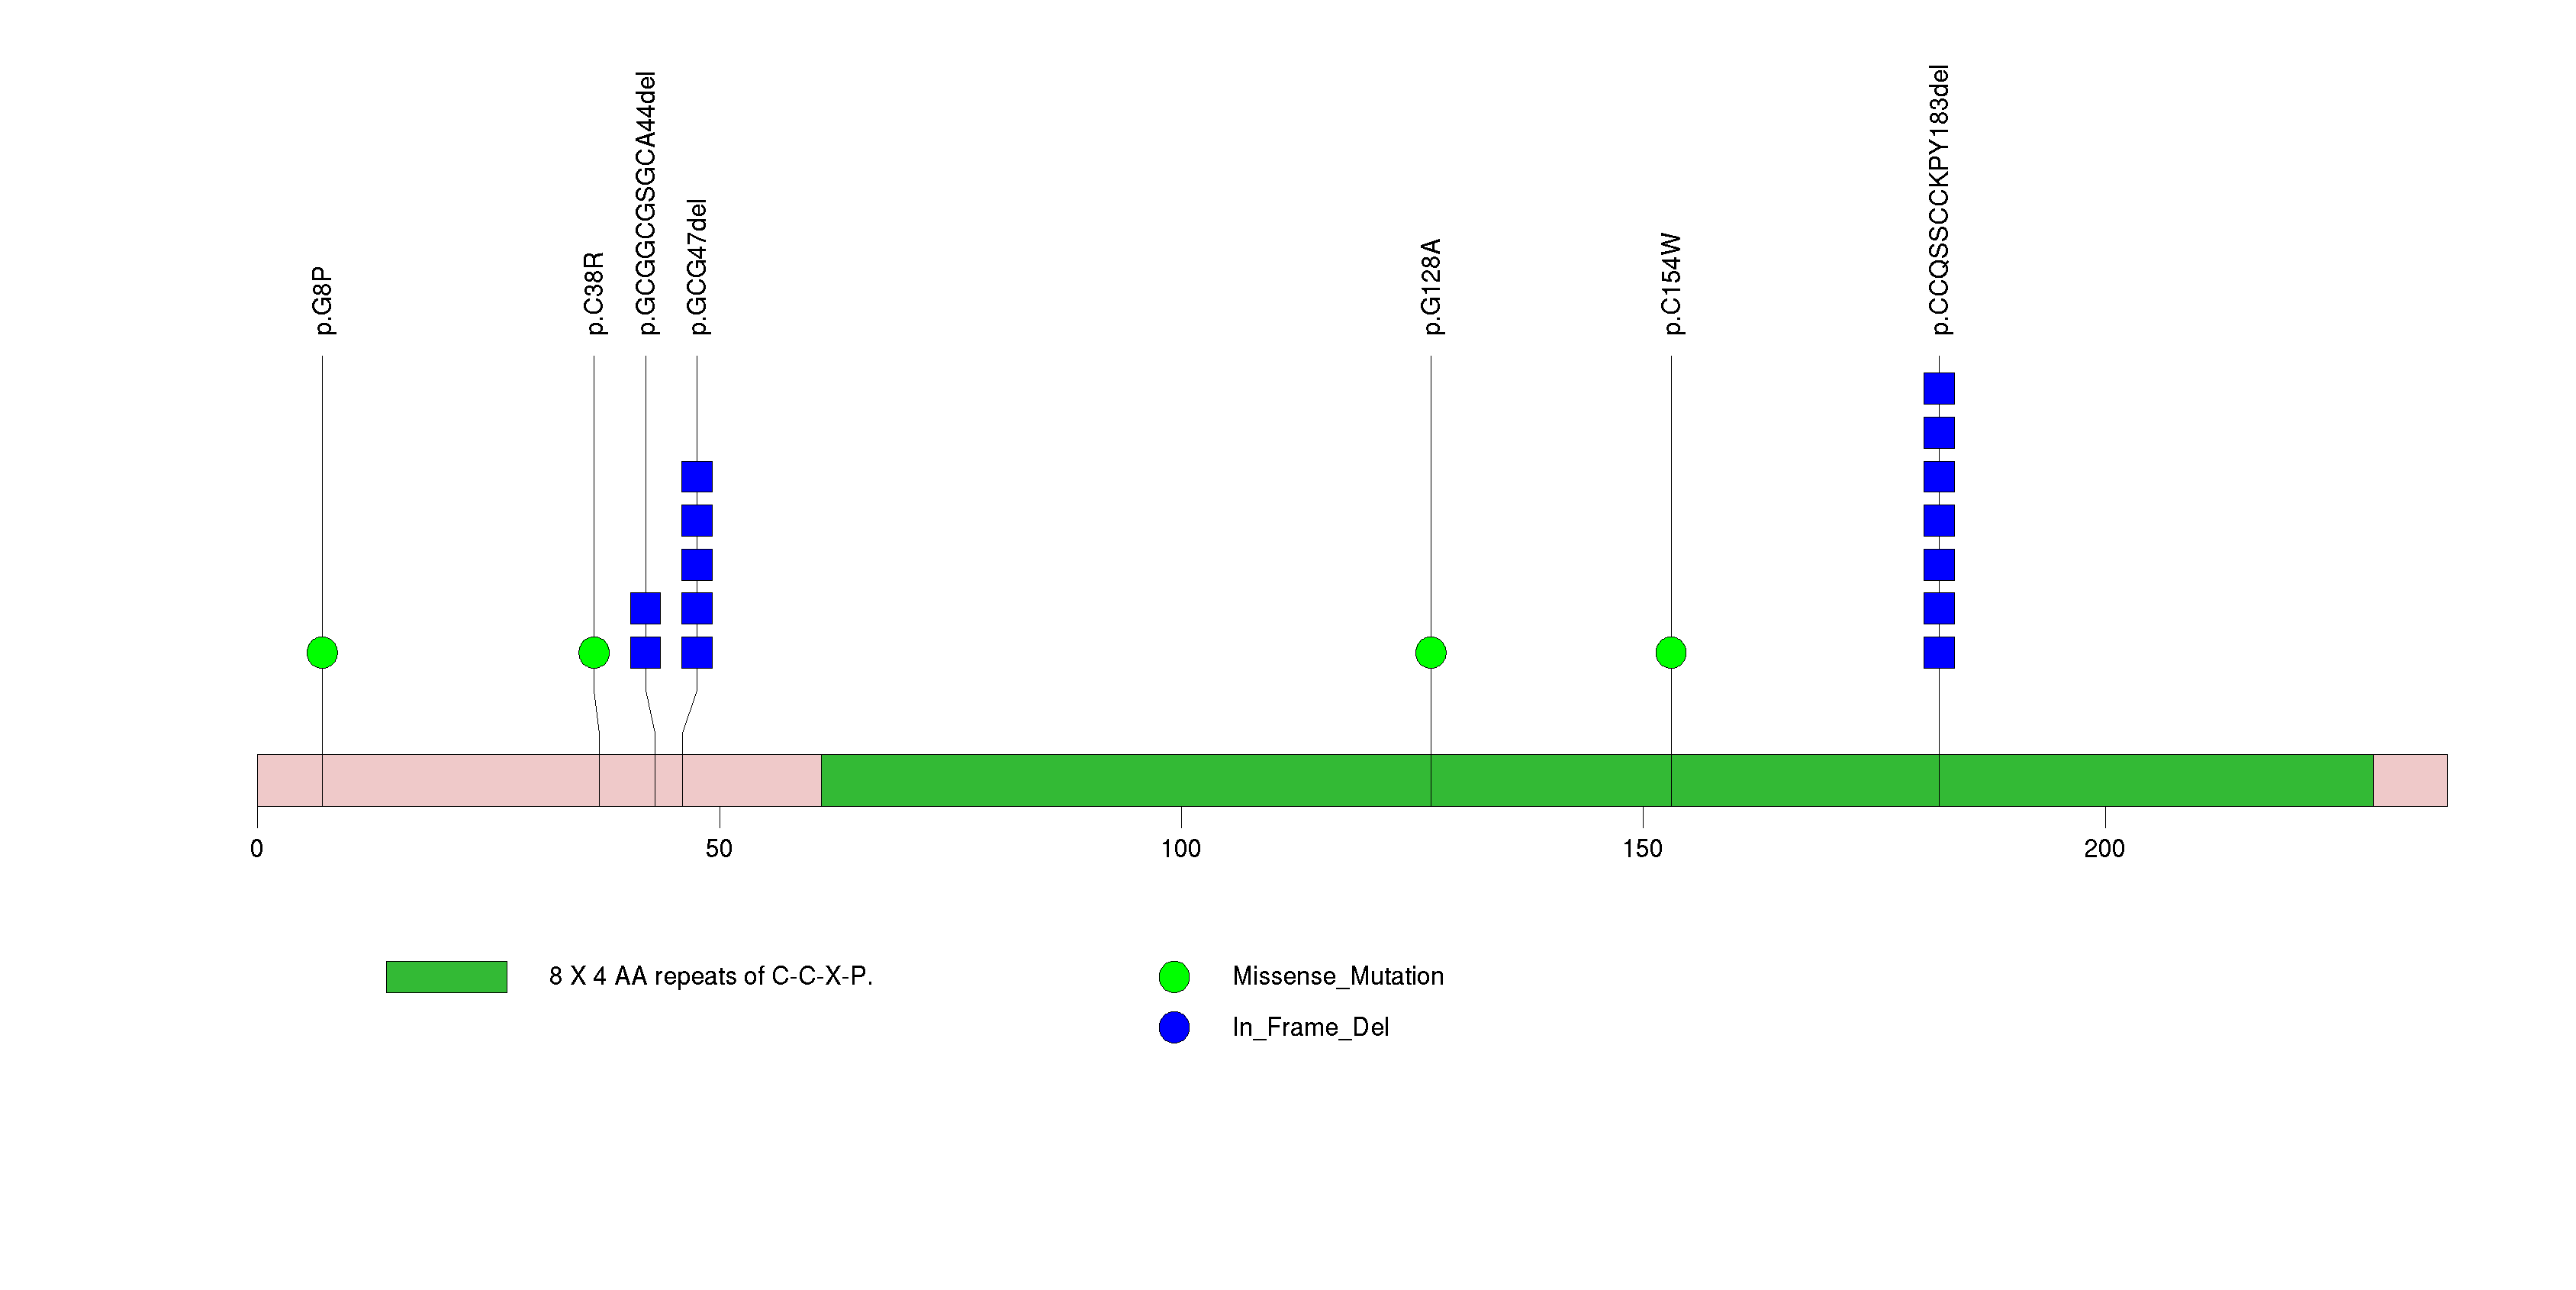
Figure S5. This figure depicts the distribution of mutations and mutation types across the PTEN significant gene.
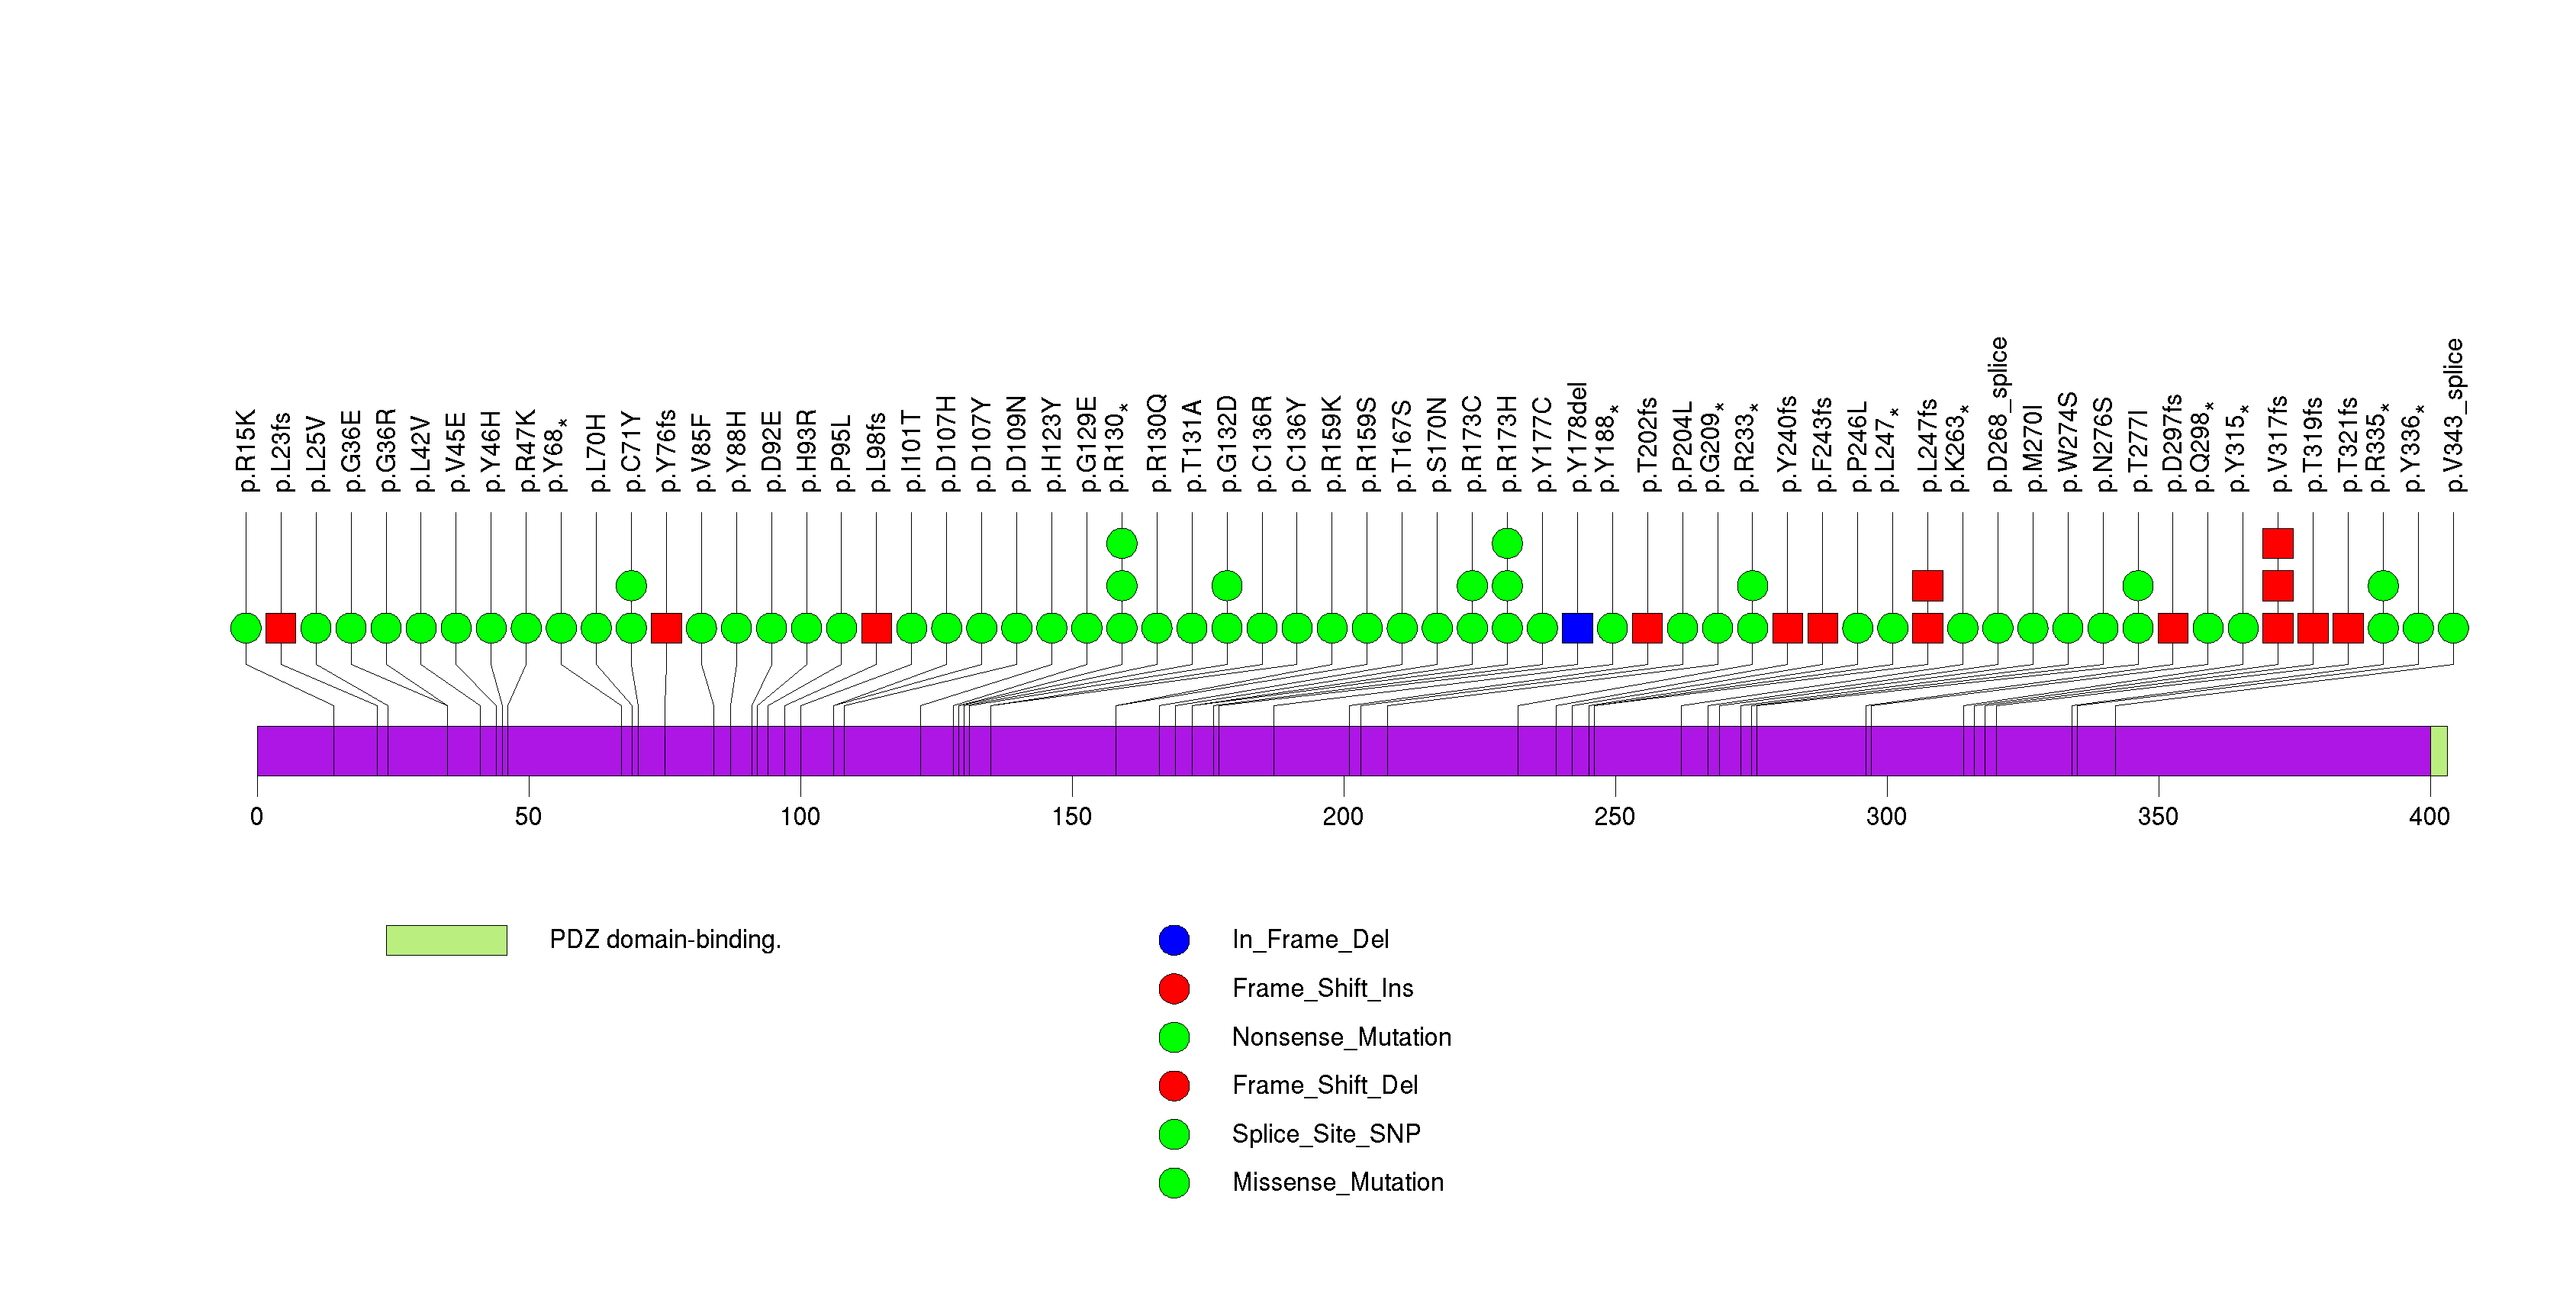
Figure S6. This figure depicts the distribution of mutations and mutation types across the TP53 significant gene.
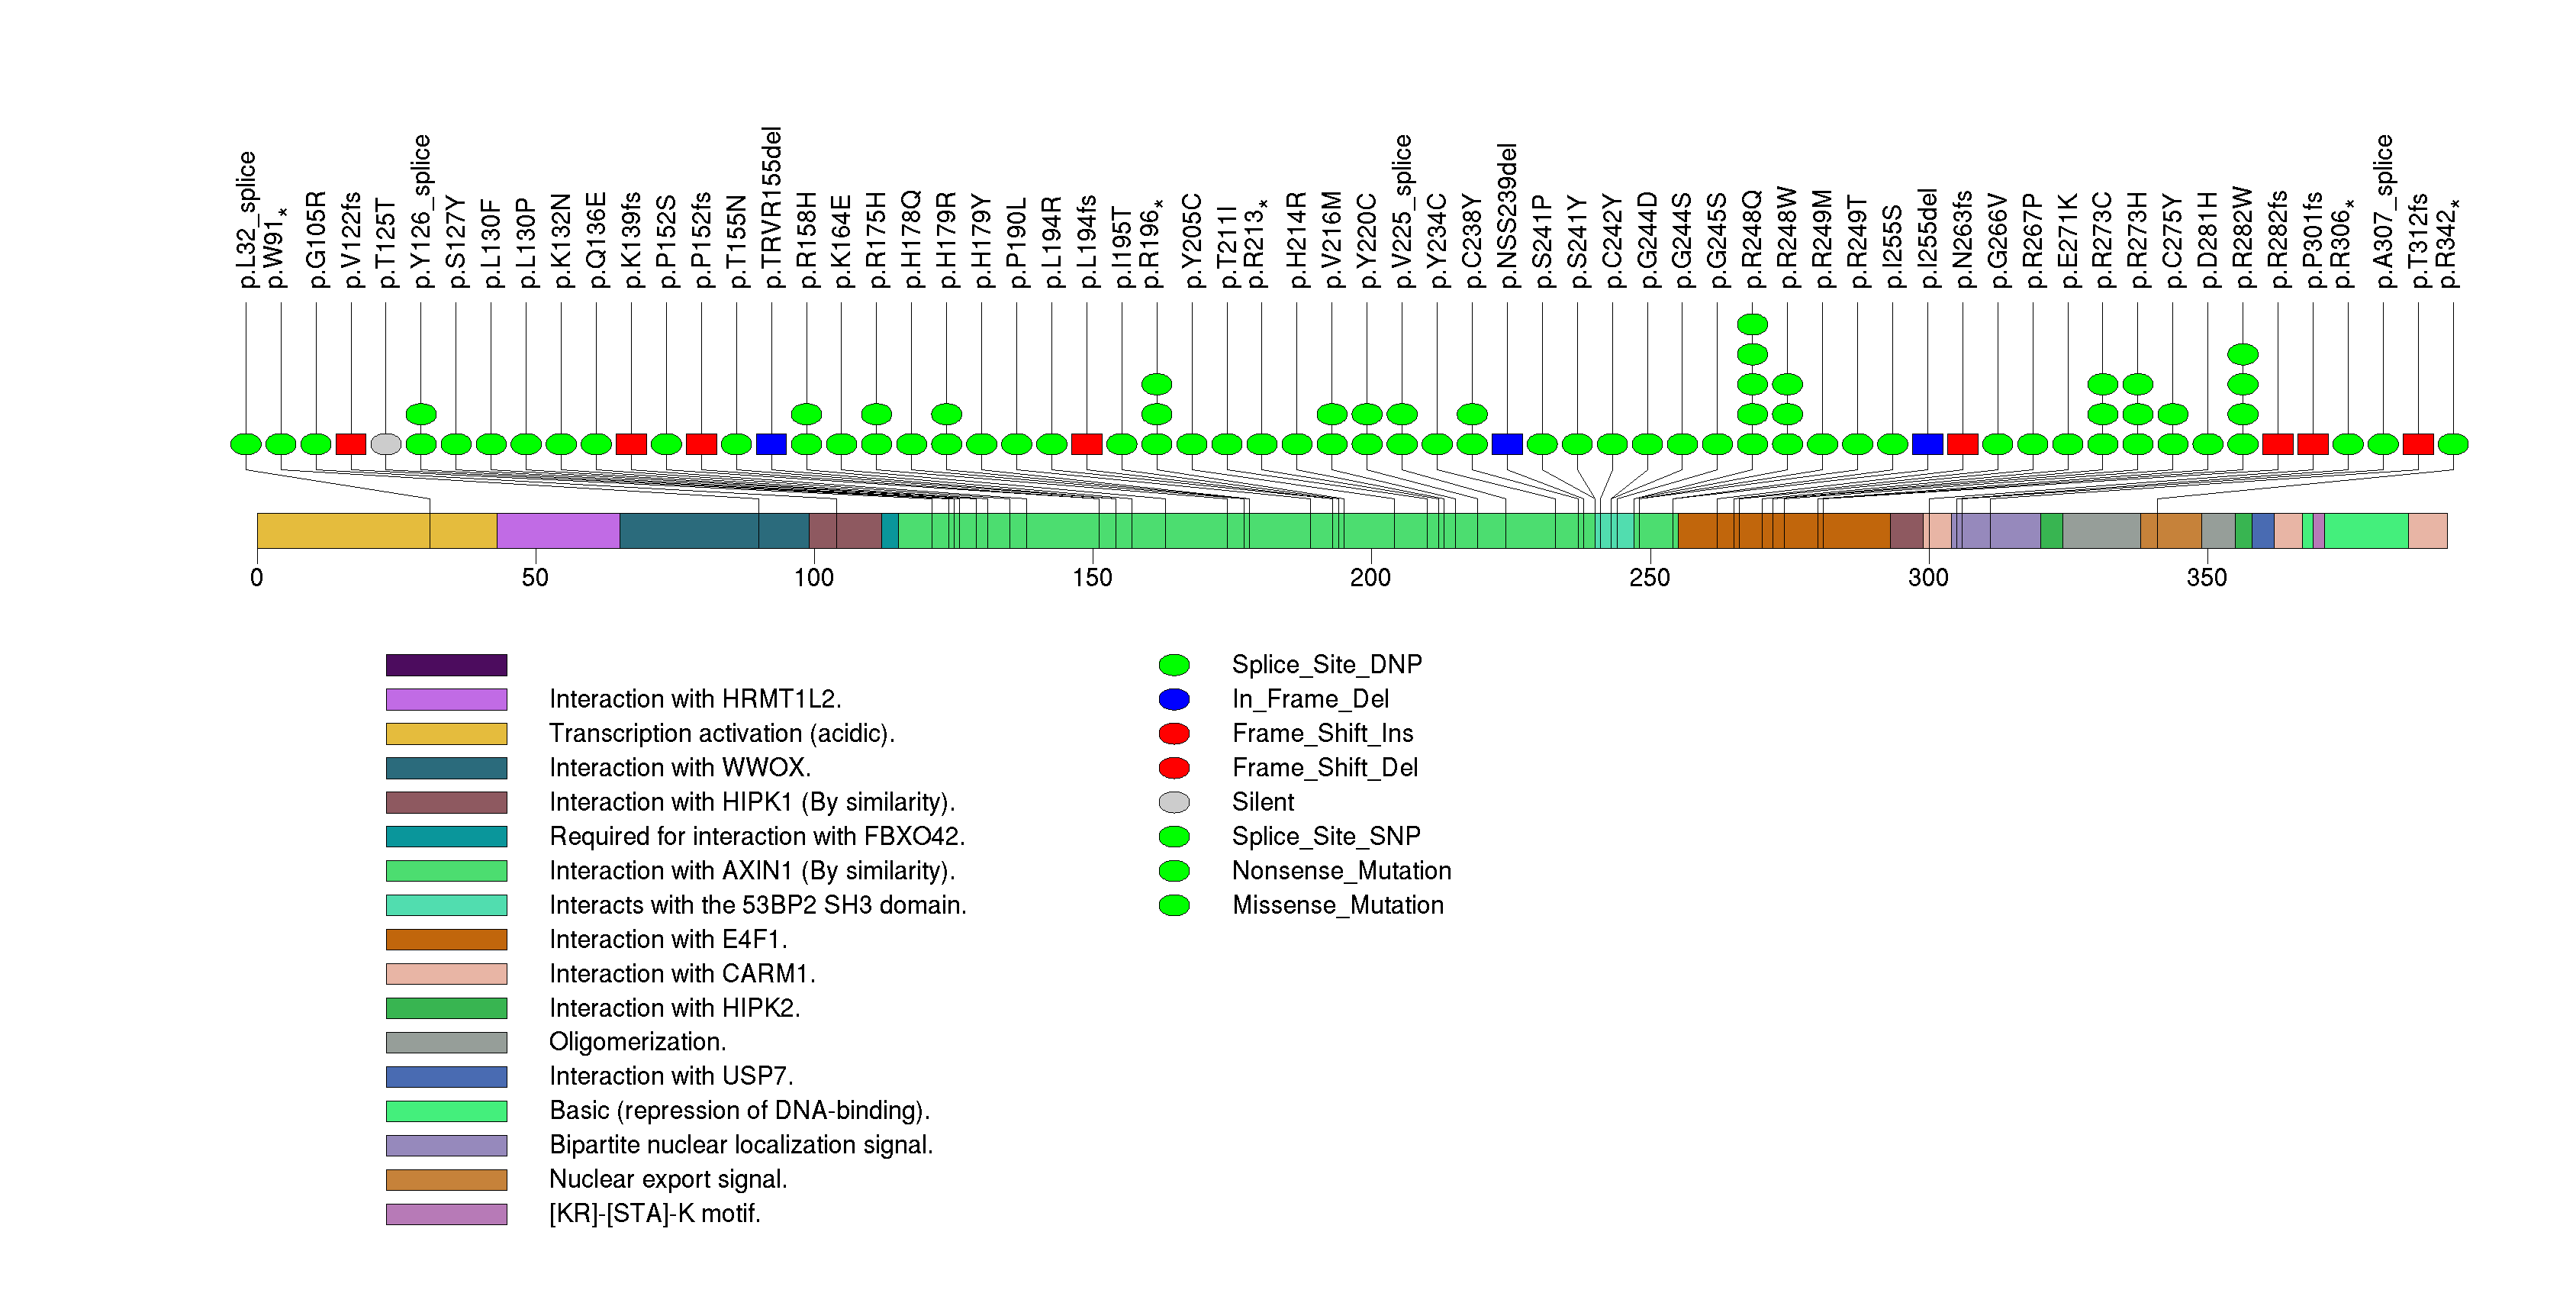
Figure S7. This figure depicts the distribution of mutations and mutation types across the EGFR significant gene.
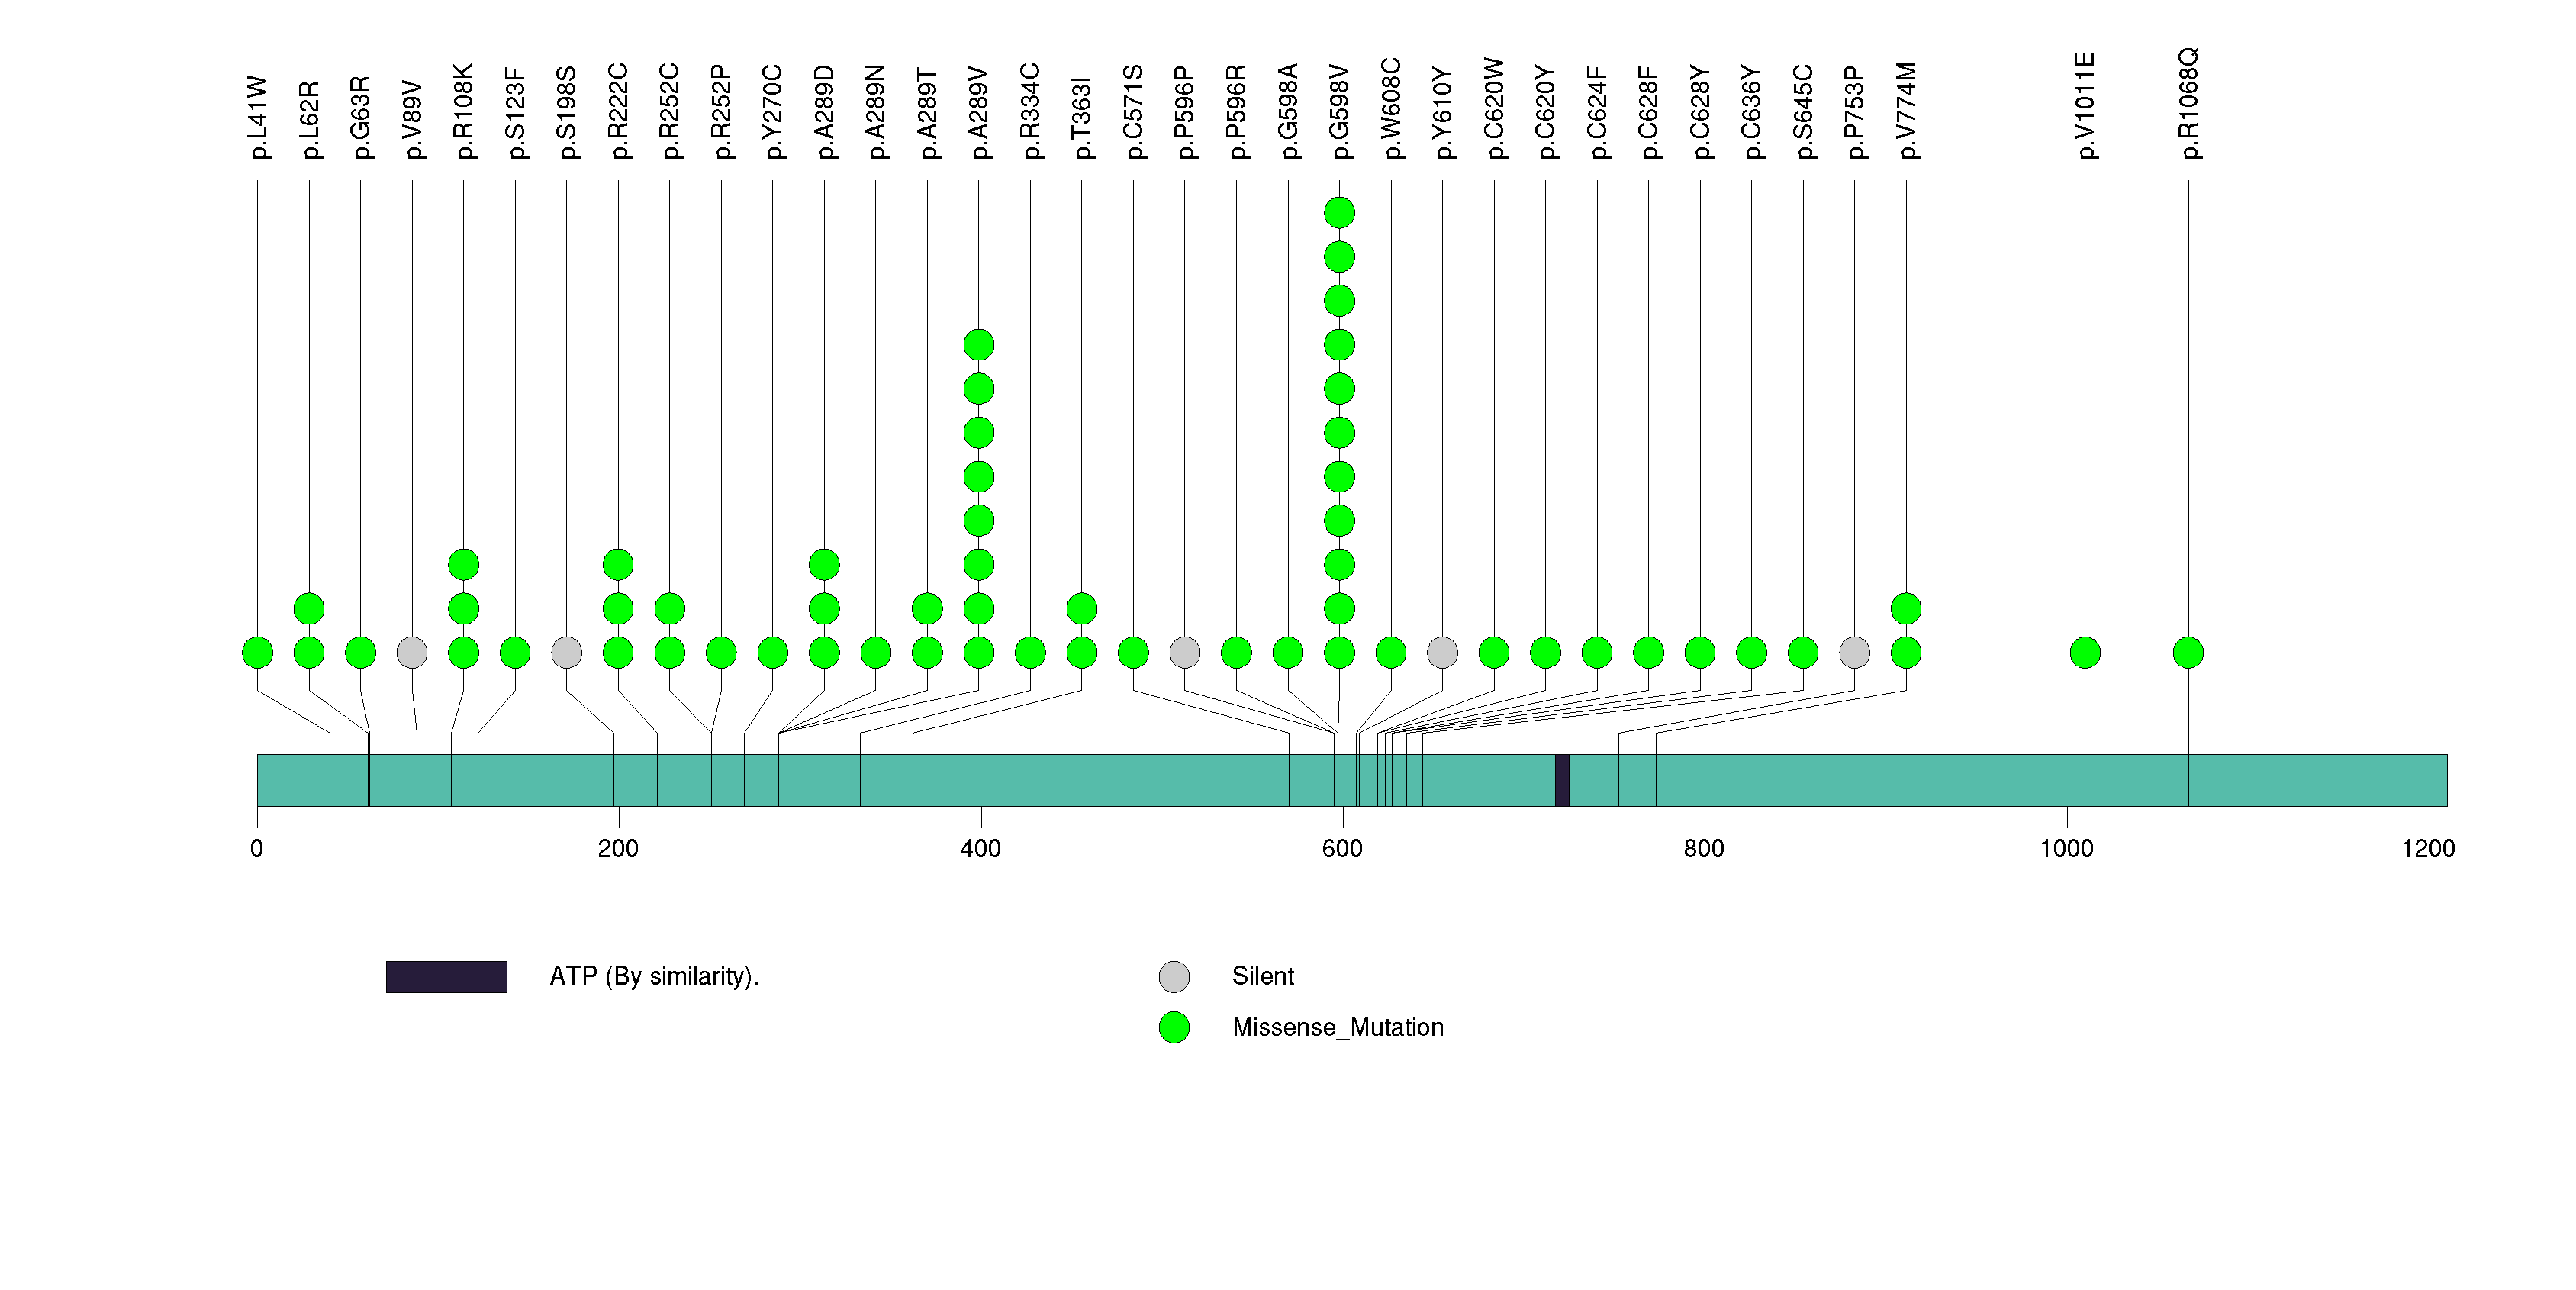
Figure S8. This figure depicts the distribution of mutations and mutation types across the MICALCL significant gene.
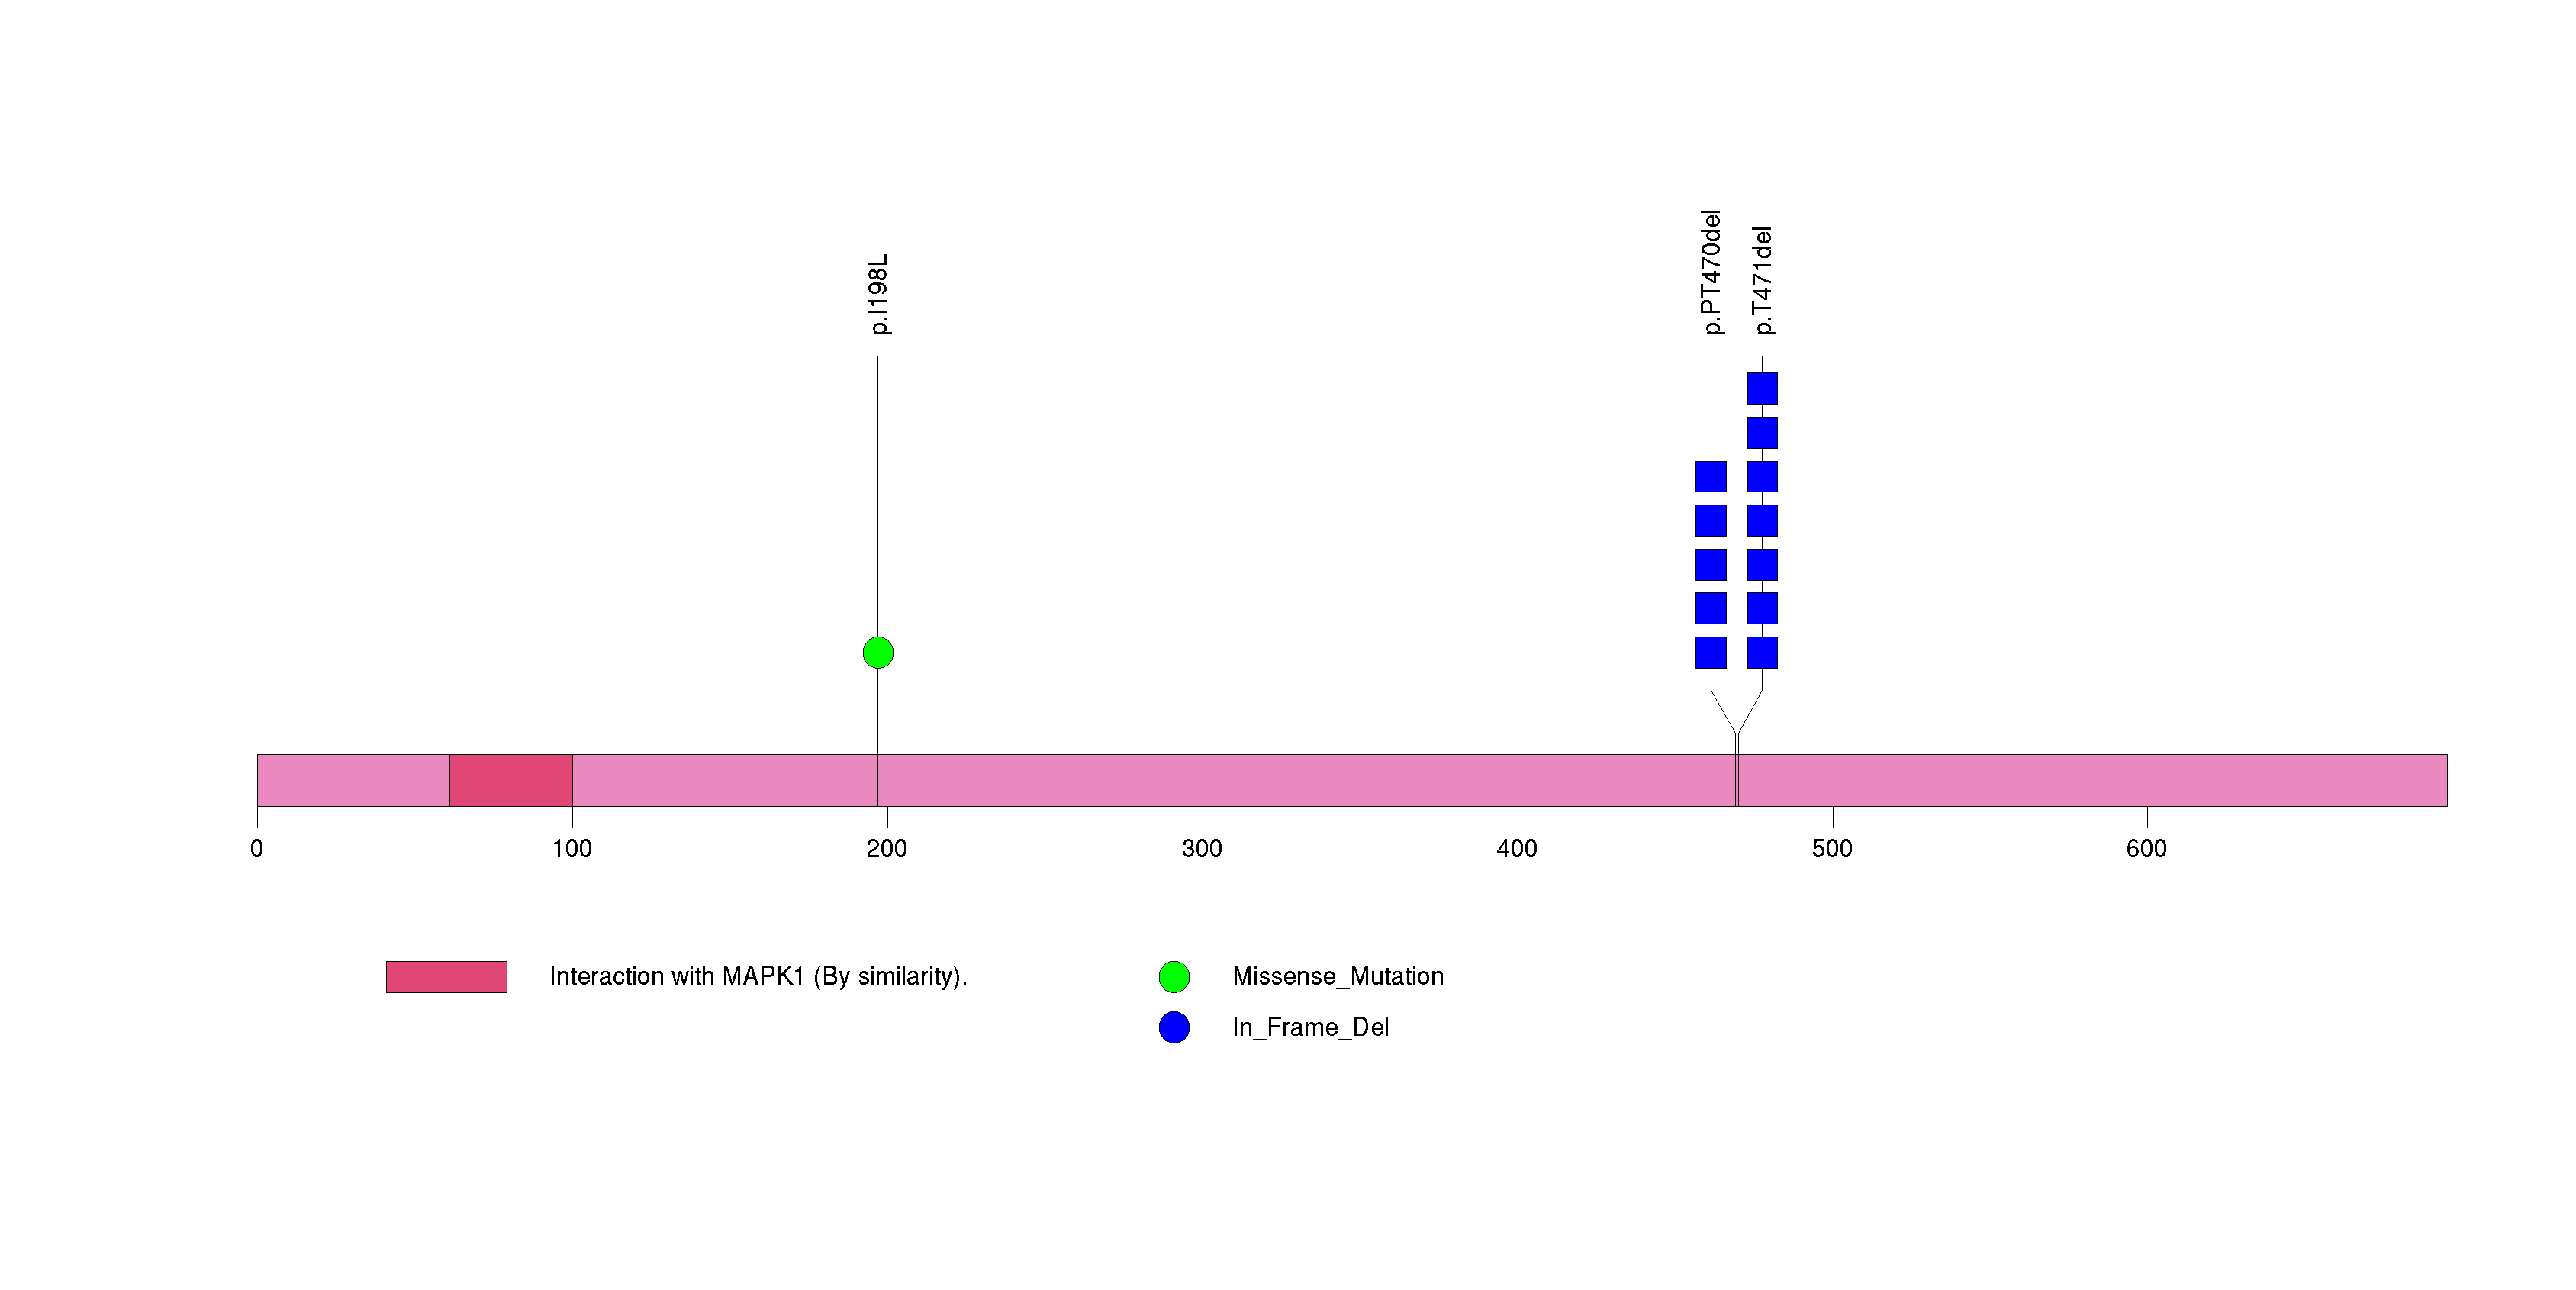
Figure S9. This figure depicts the distribution of mutations and mutation types across the C7orf52 significant gene.
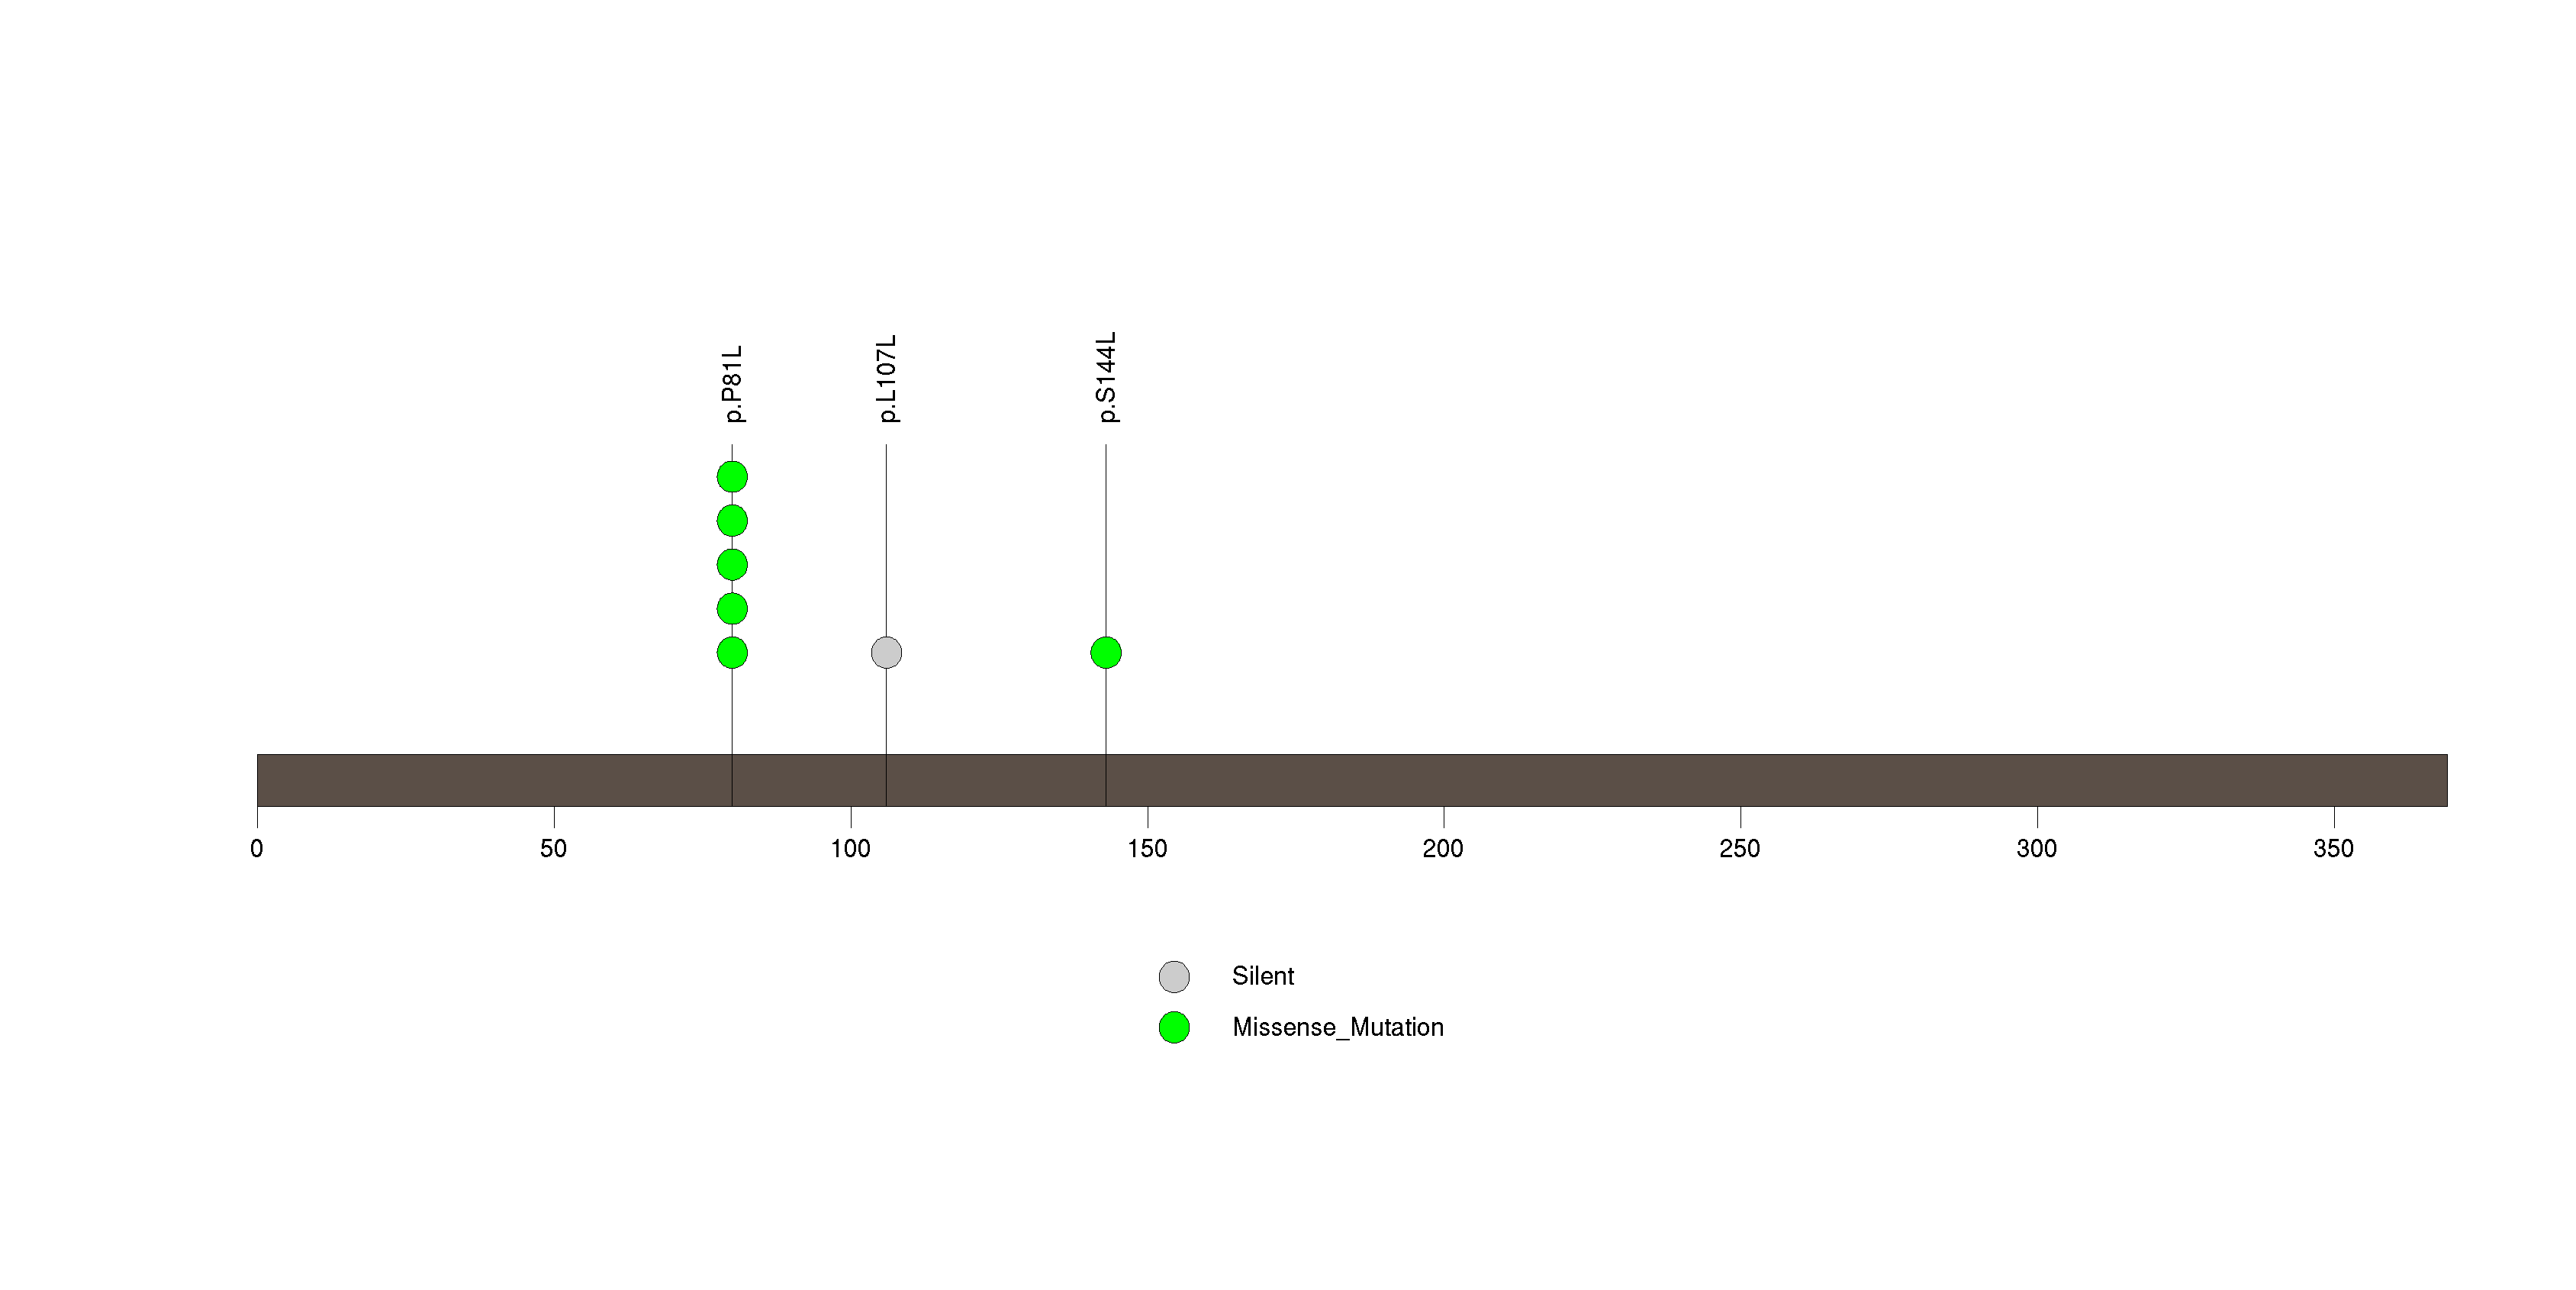
Figure S10. This figure depicts the distribution of mutations and mutation types across the CRYBA2 significant gene.
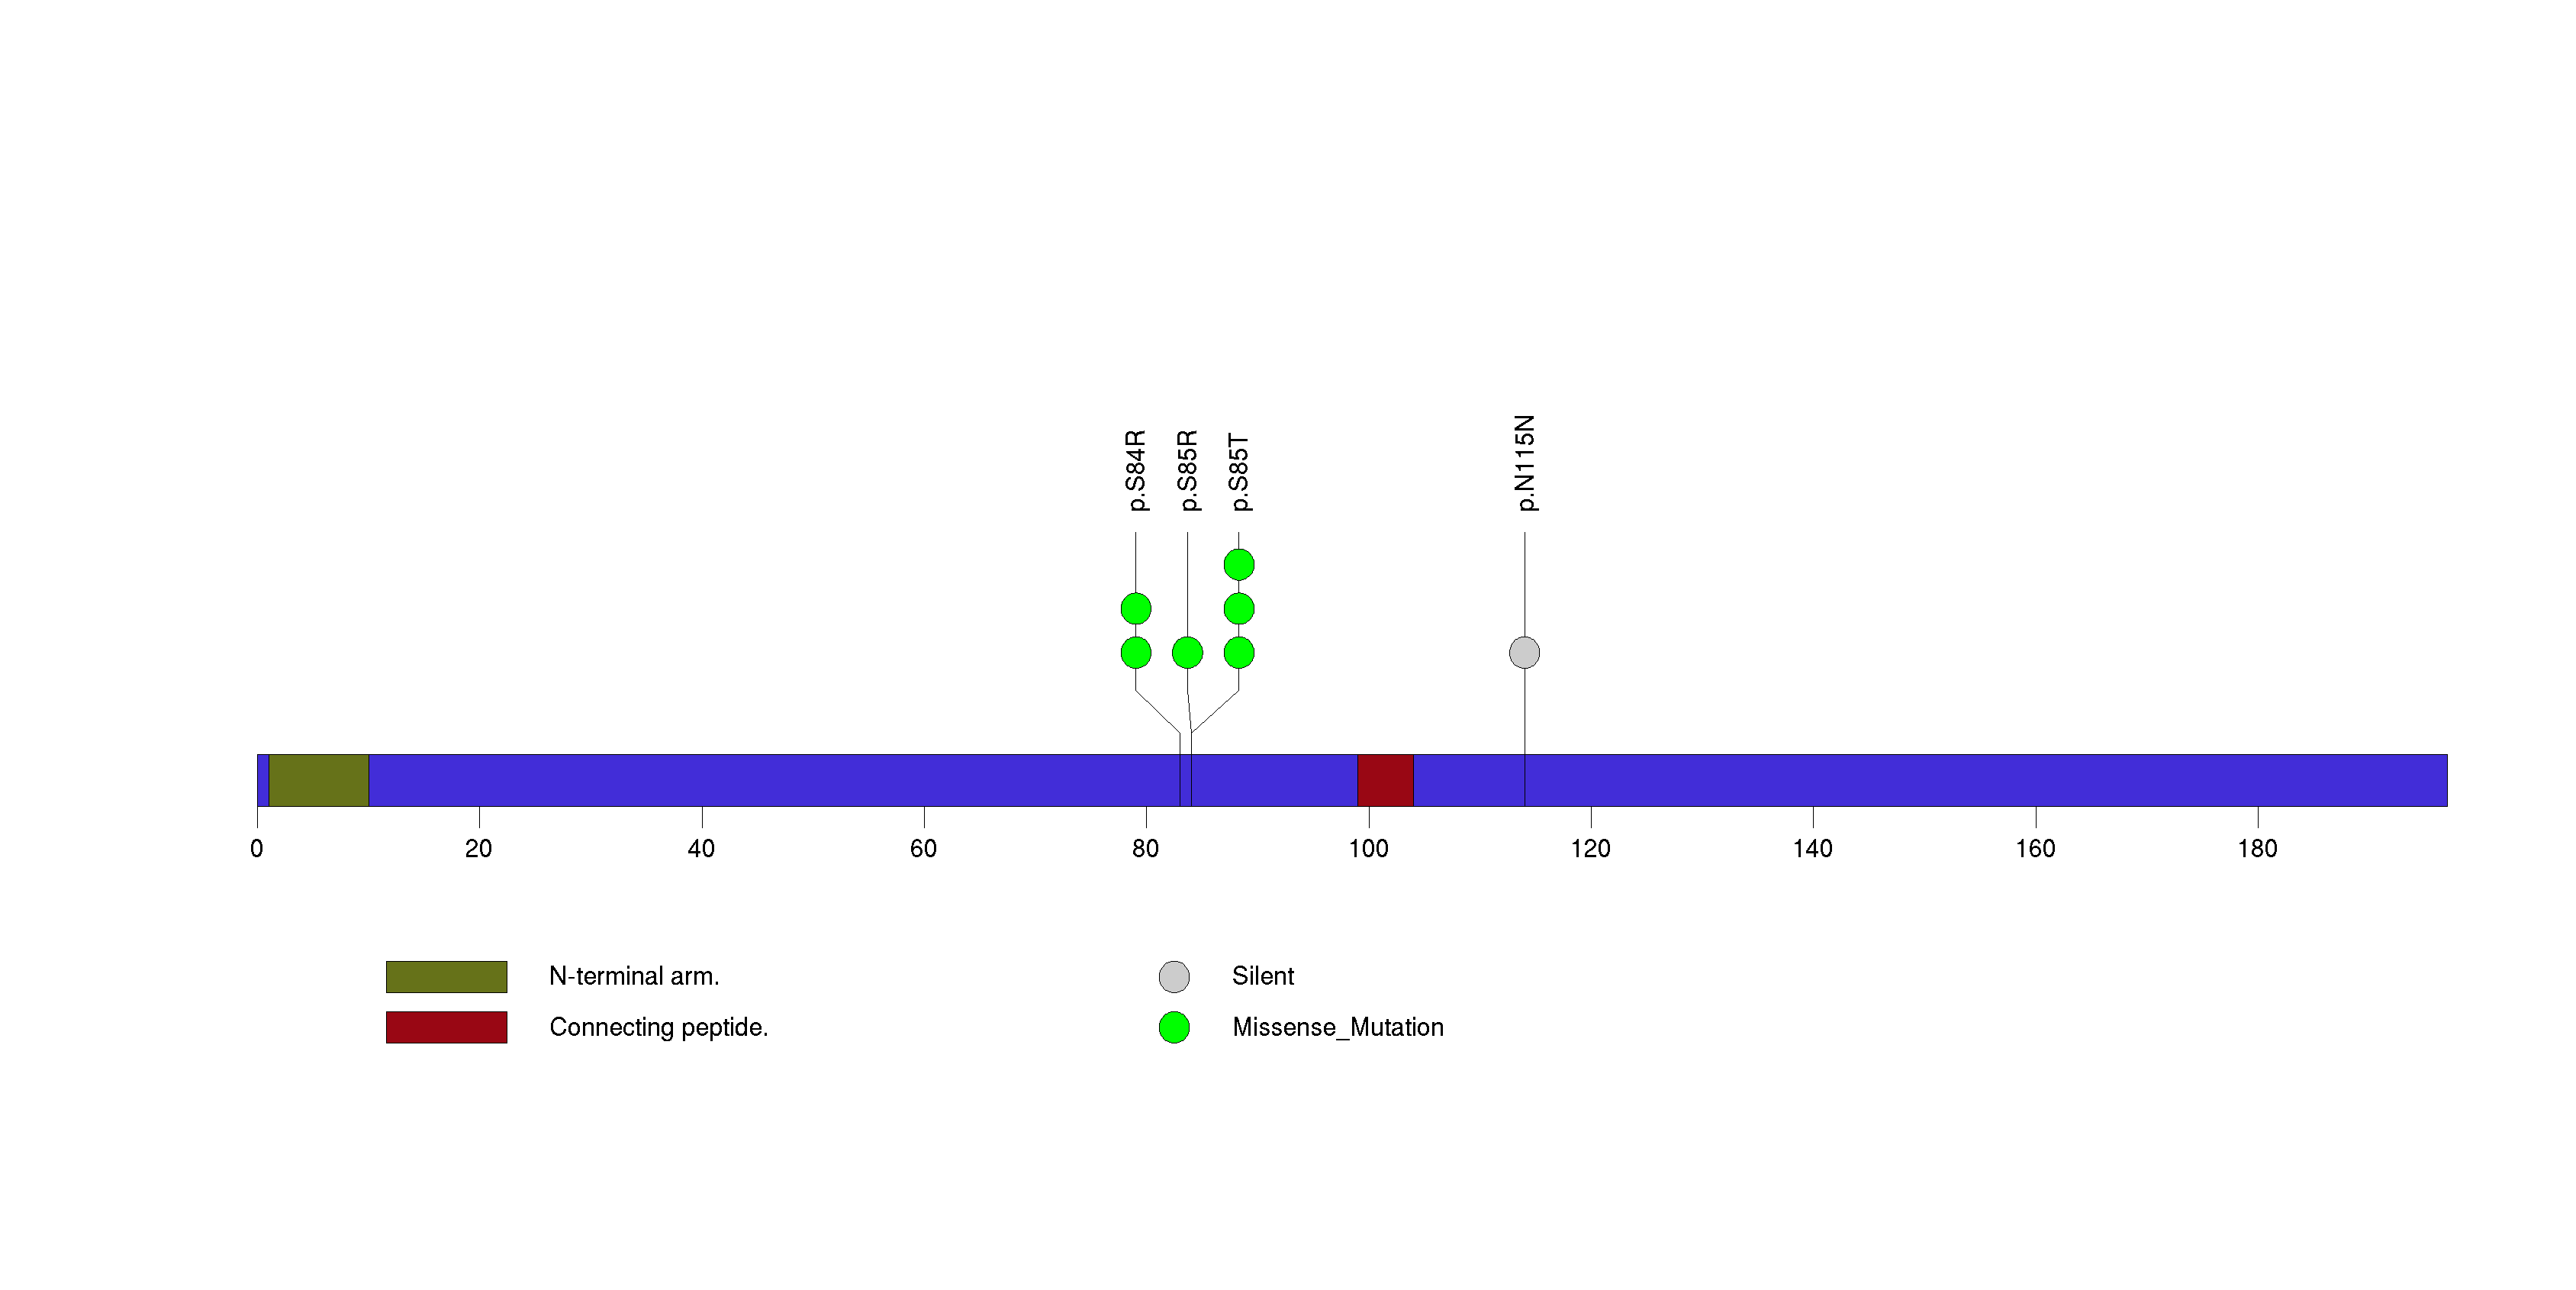
Figure S11. This figure depicts the distribution of mutations and mutation types across the BID significant gene.
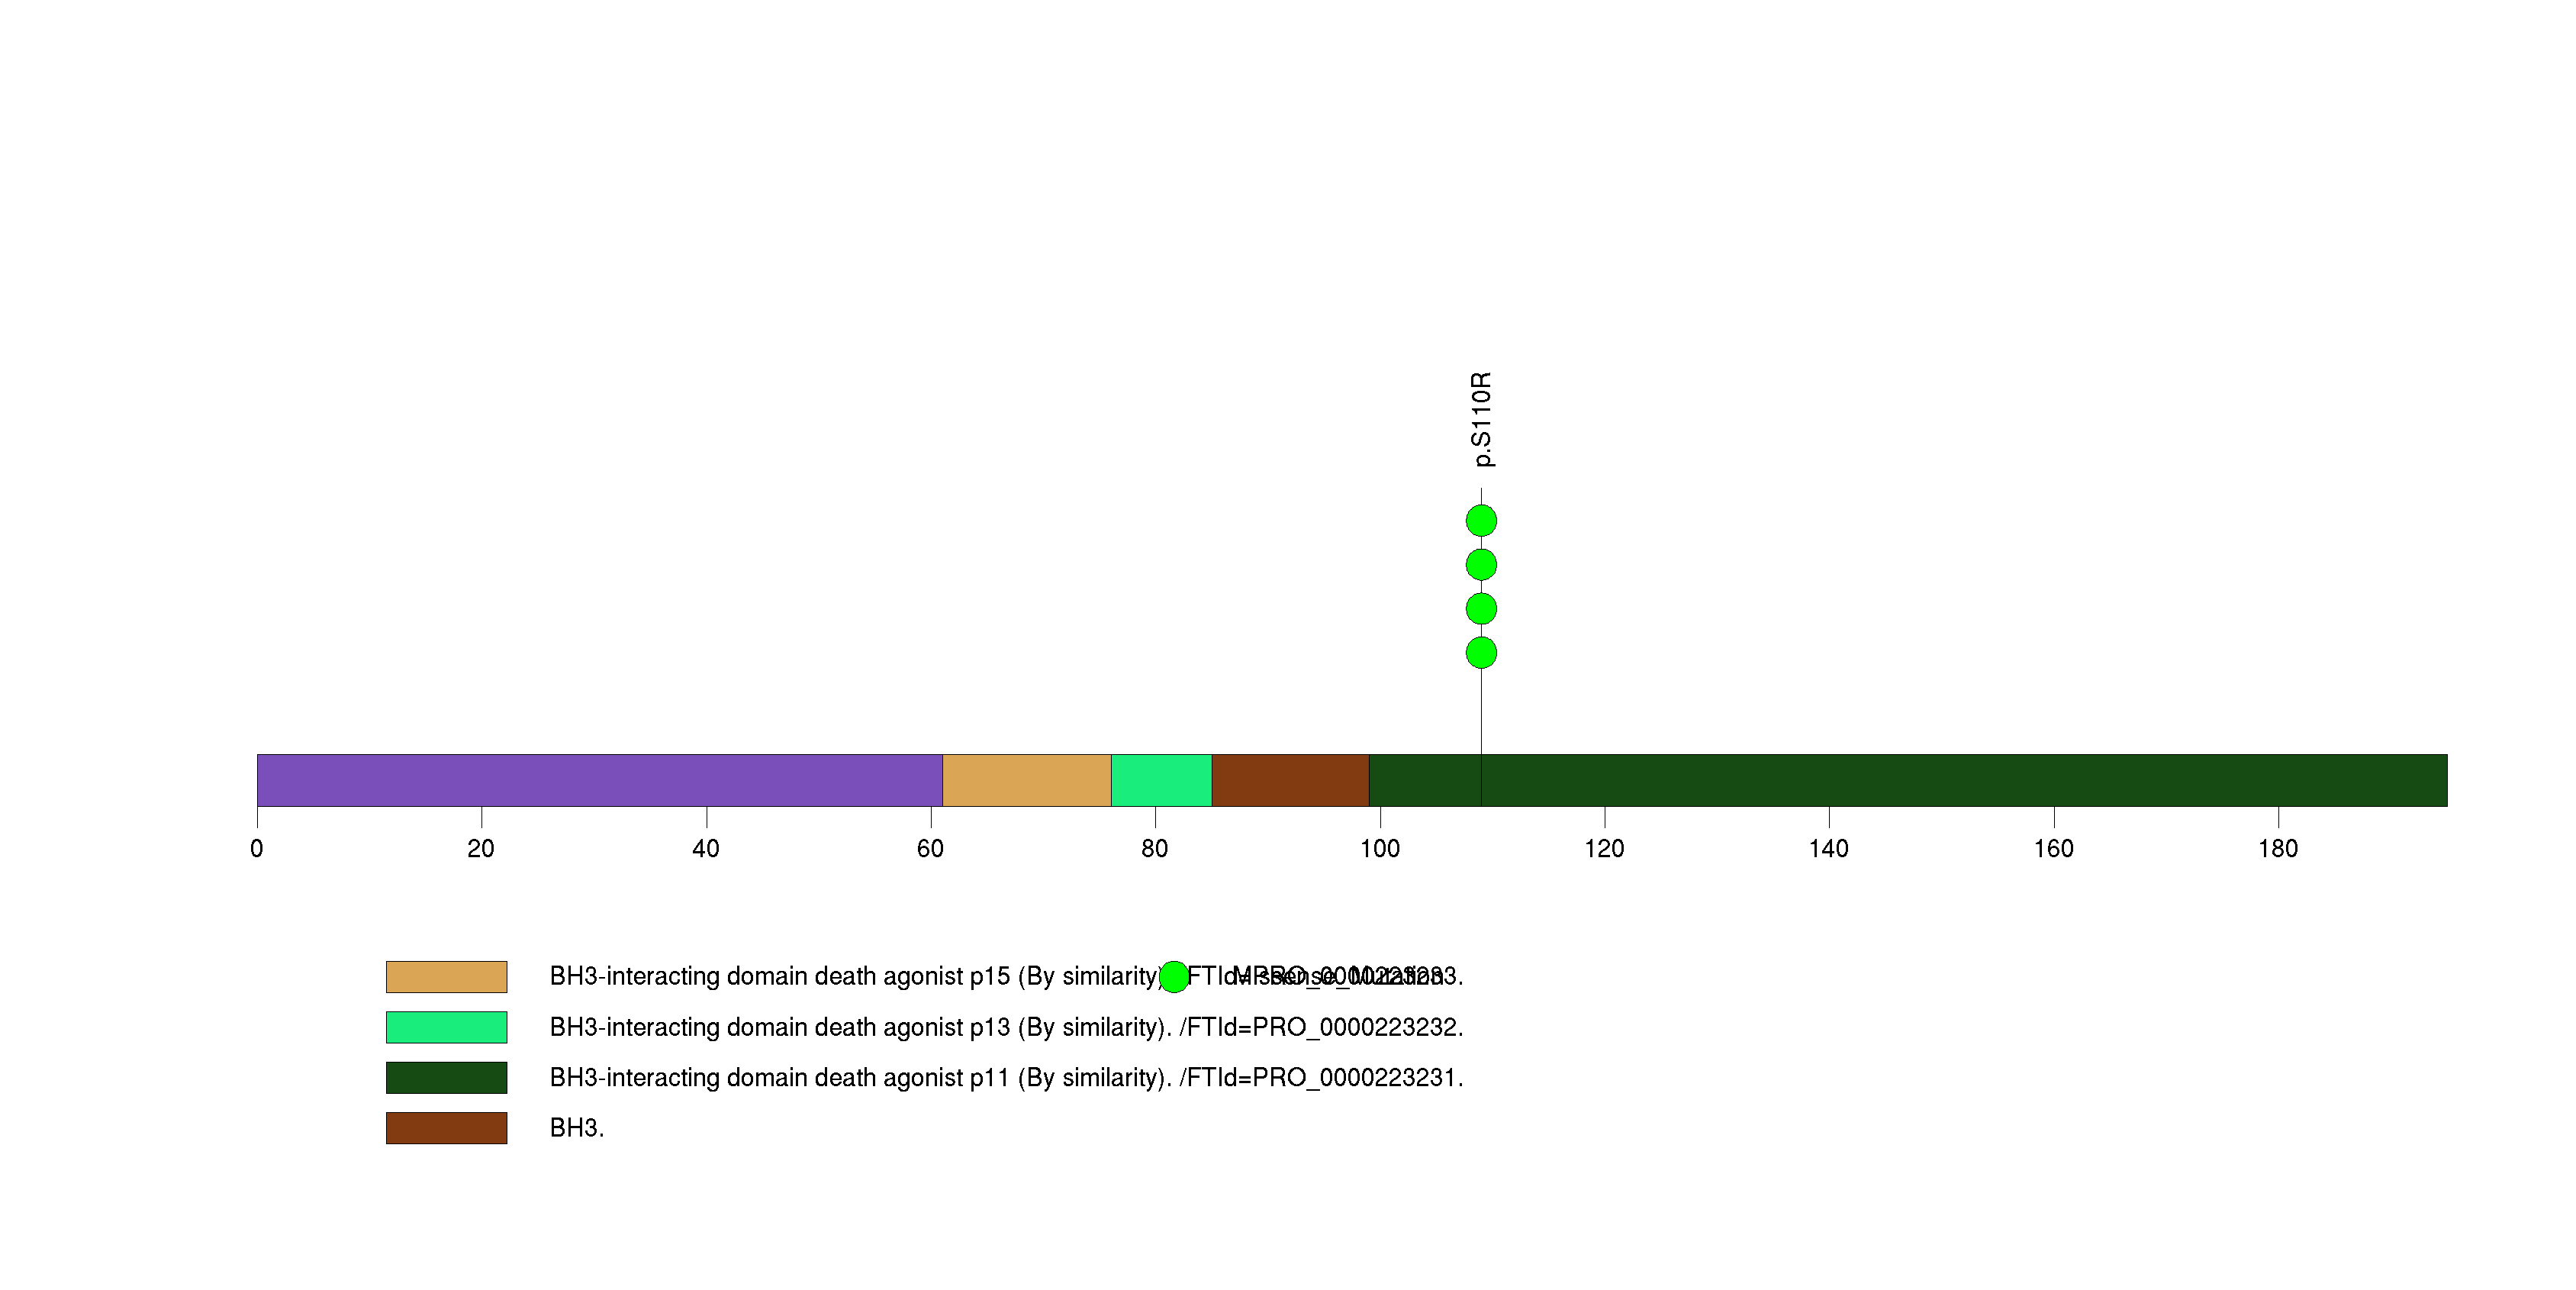
Figure S12. This figure depicts the distribution of mutations and mutation types across the FOXC1 significant gene.
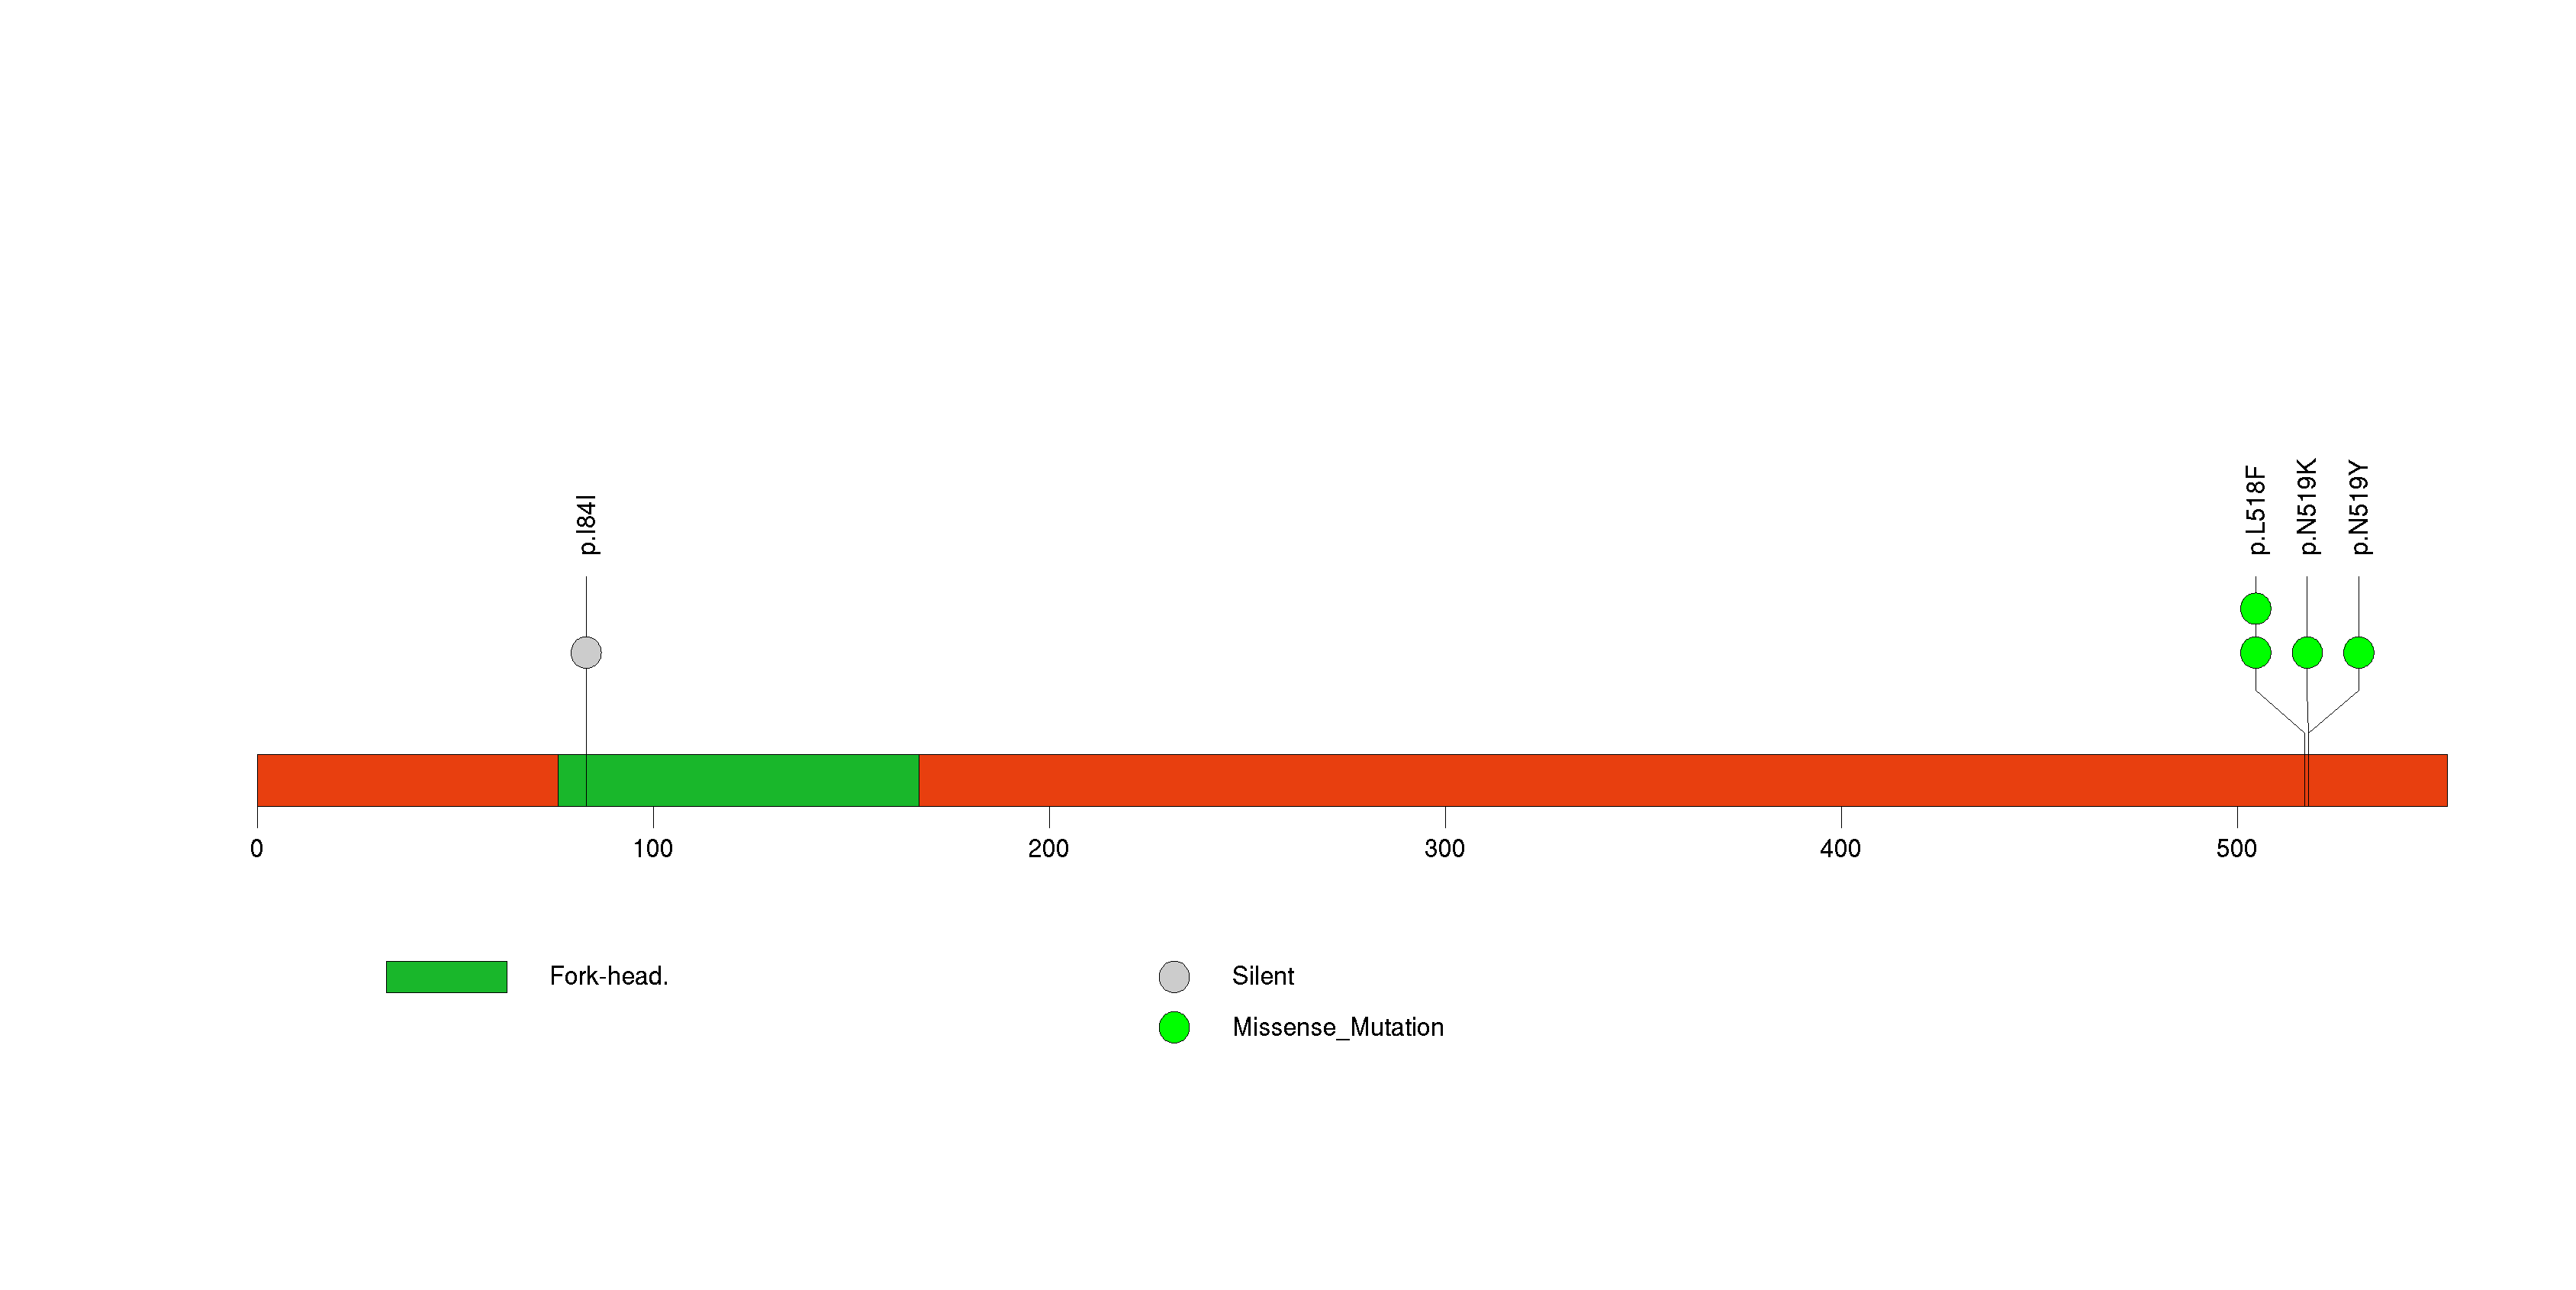
Figure S13. This figure depicts the distribution of mutations and mutation types across the MRM1 significant gene.
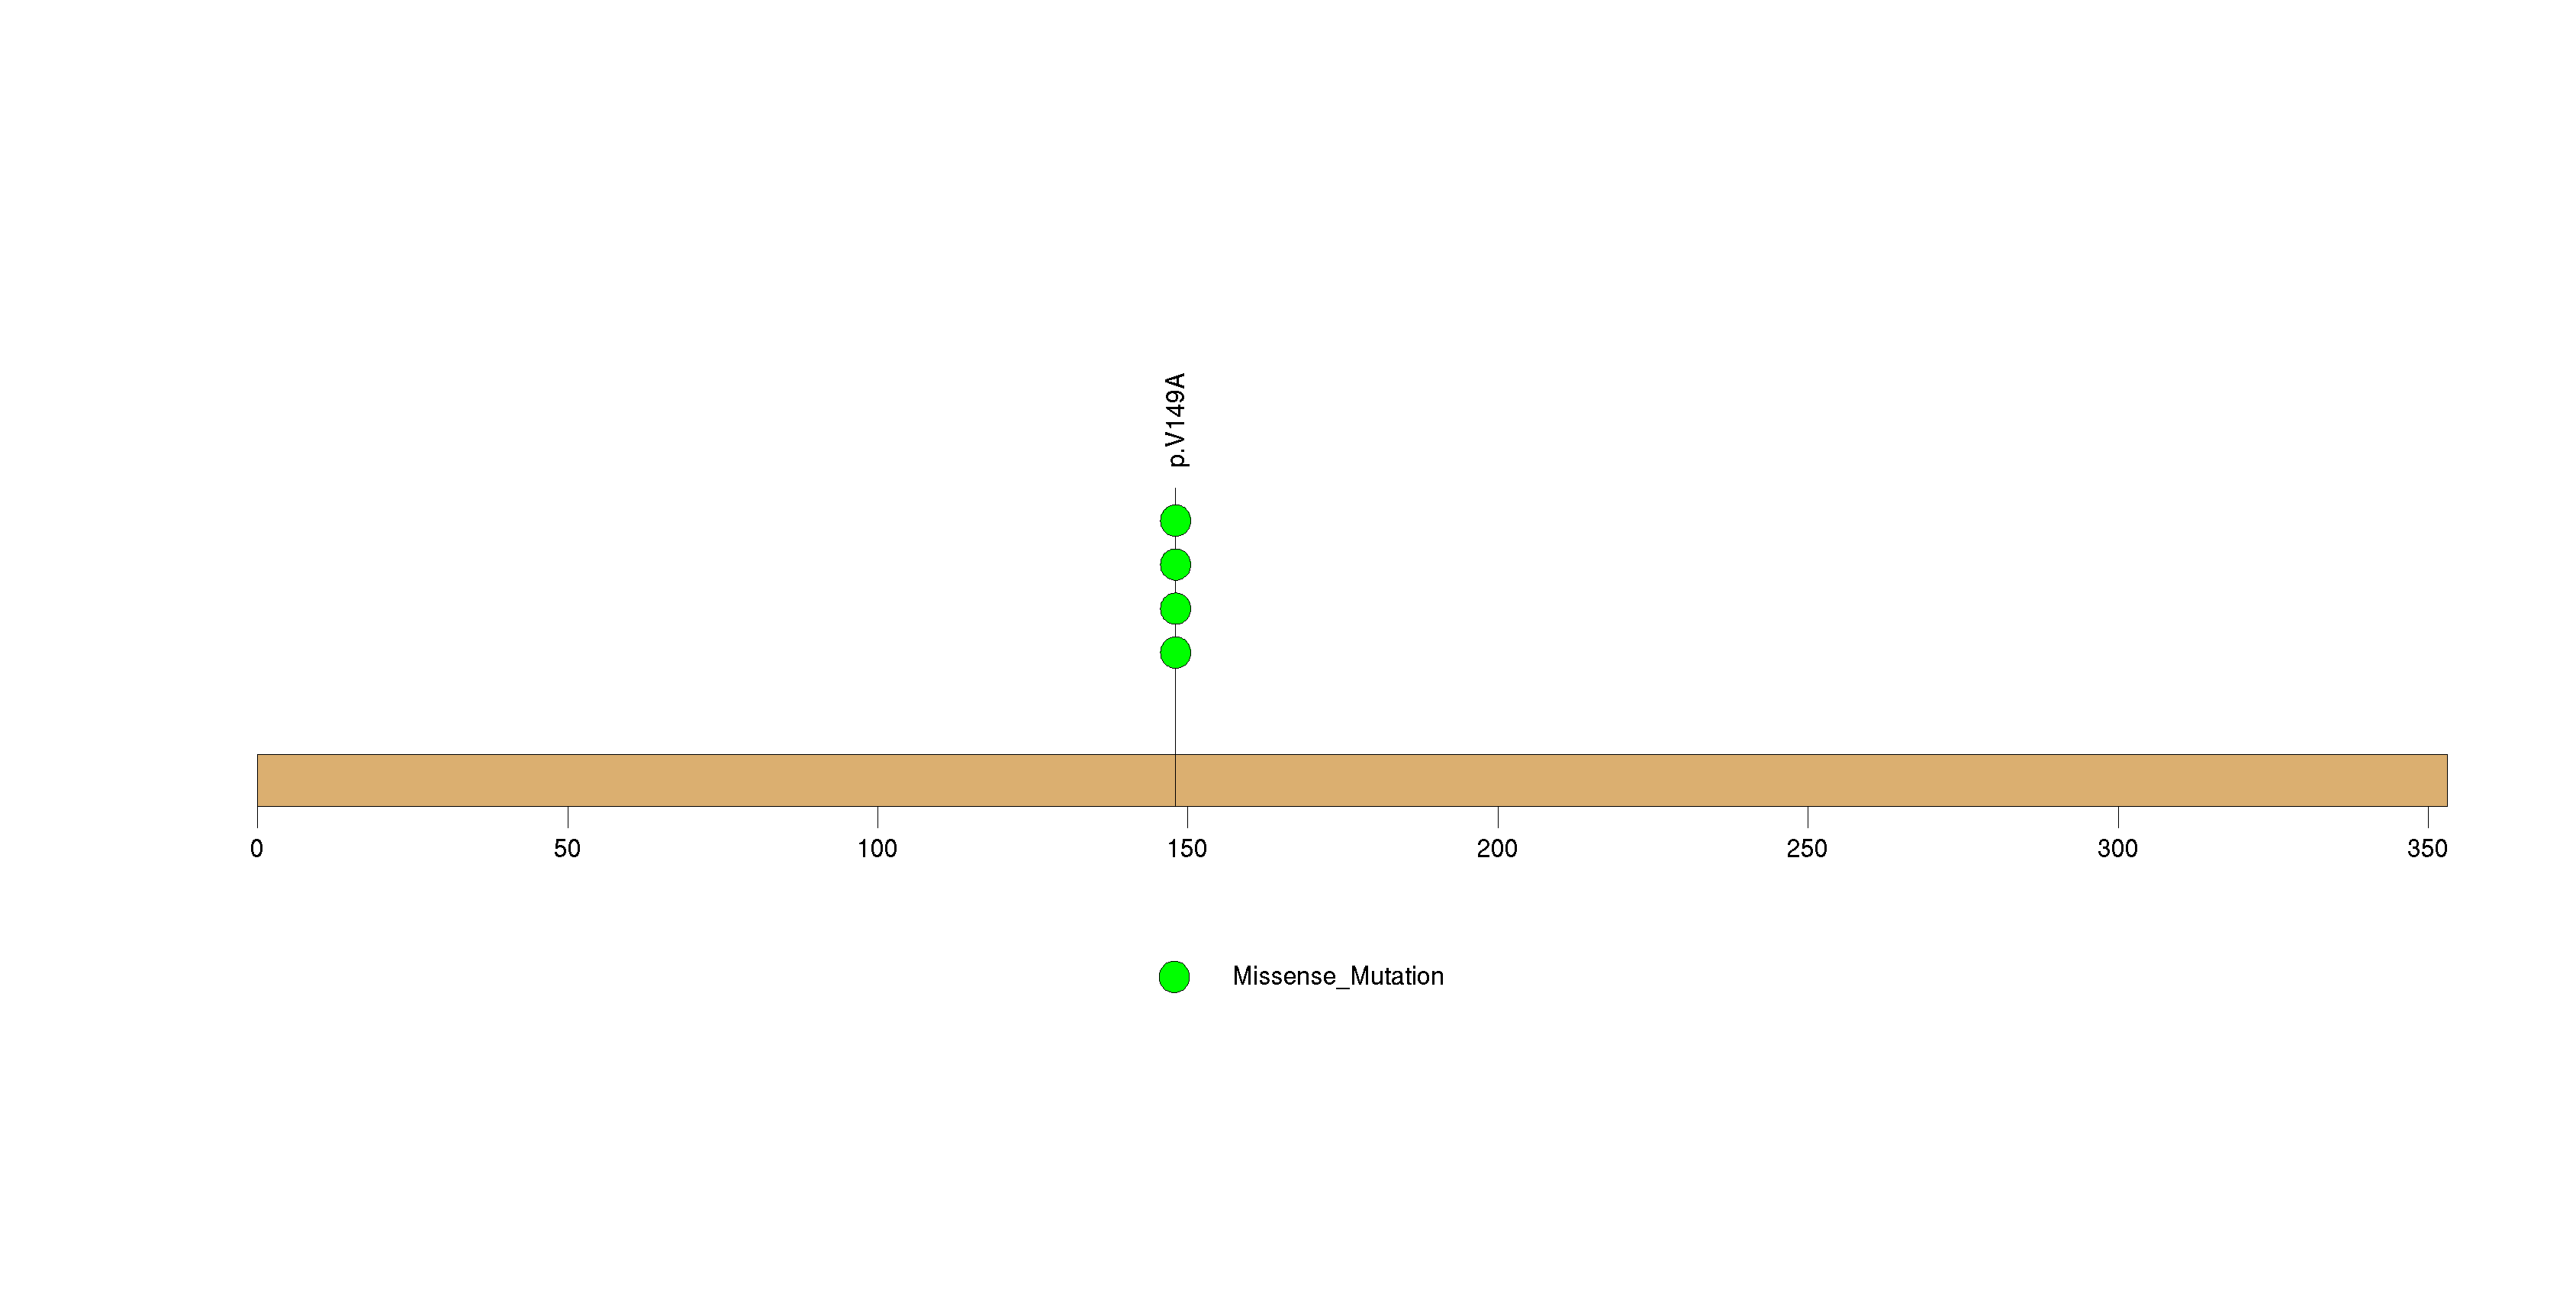
Figure S14. This figure depicts the distribution of mutations and mutation types across the PUF60 significant gene.
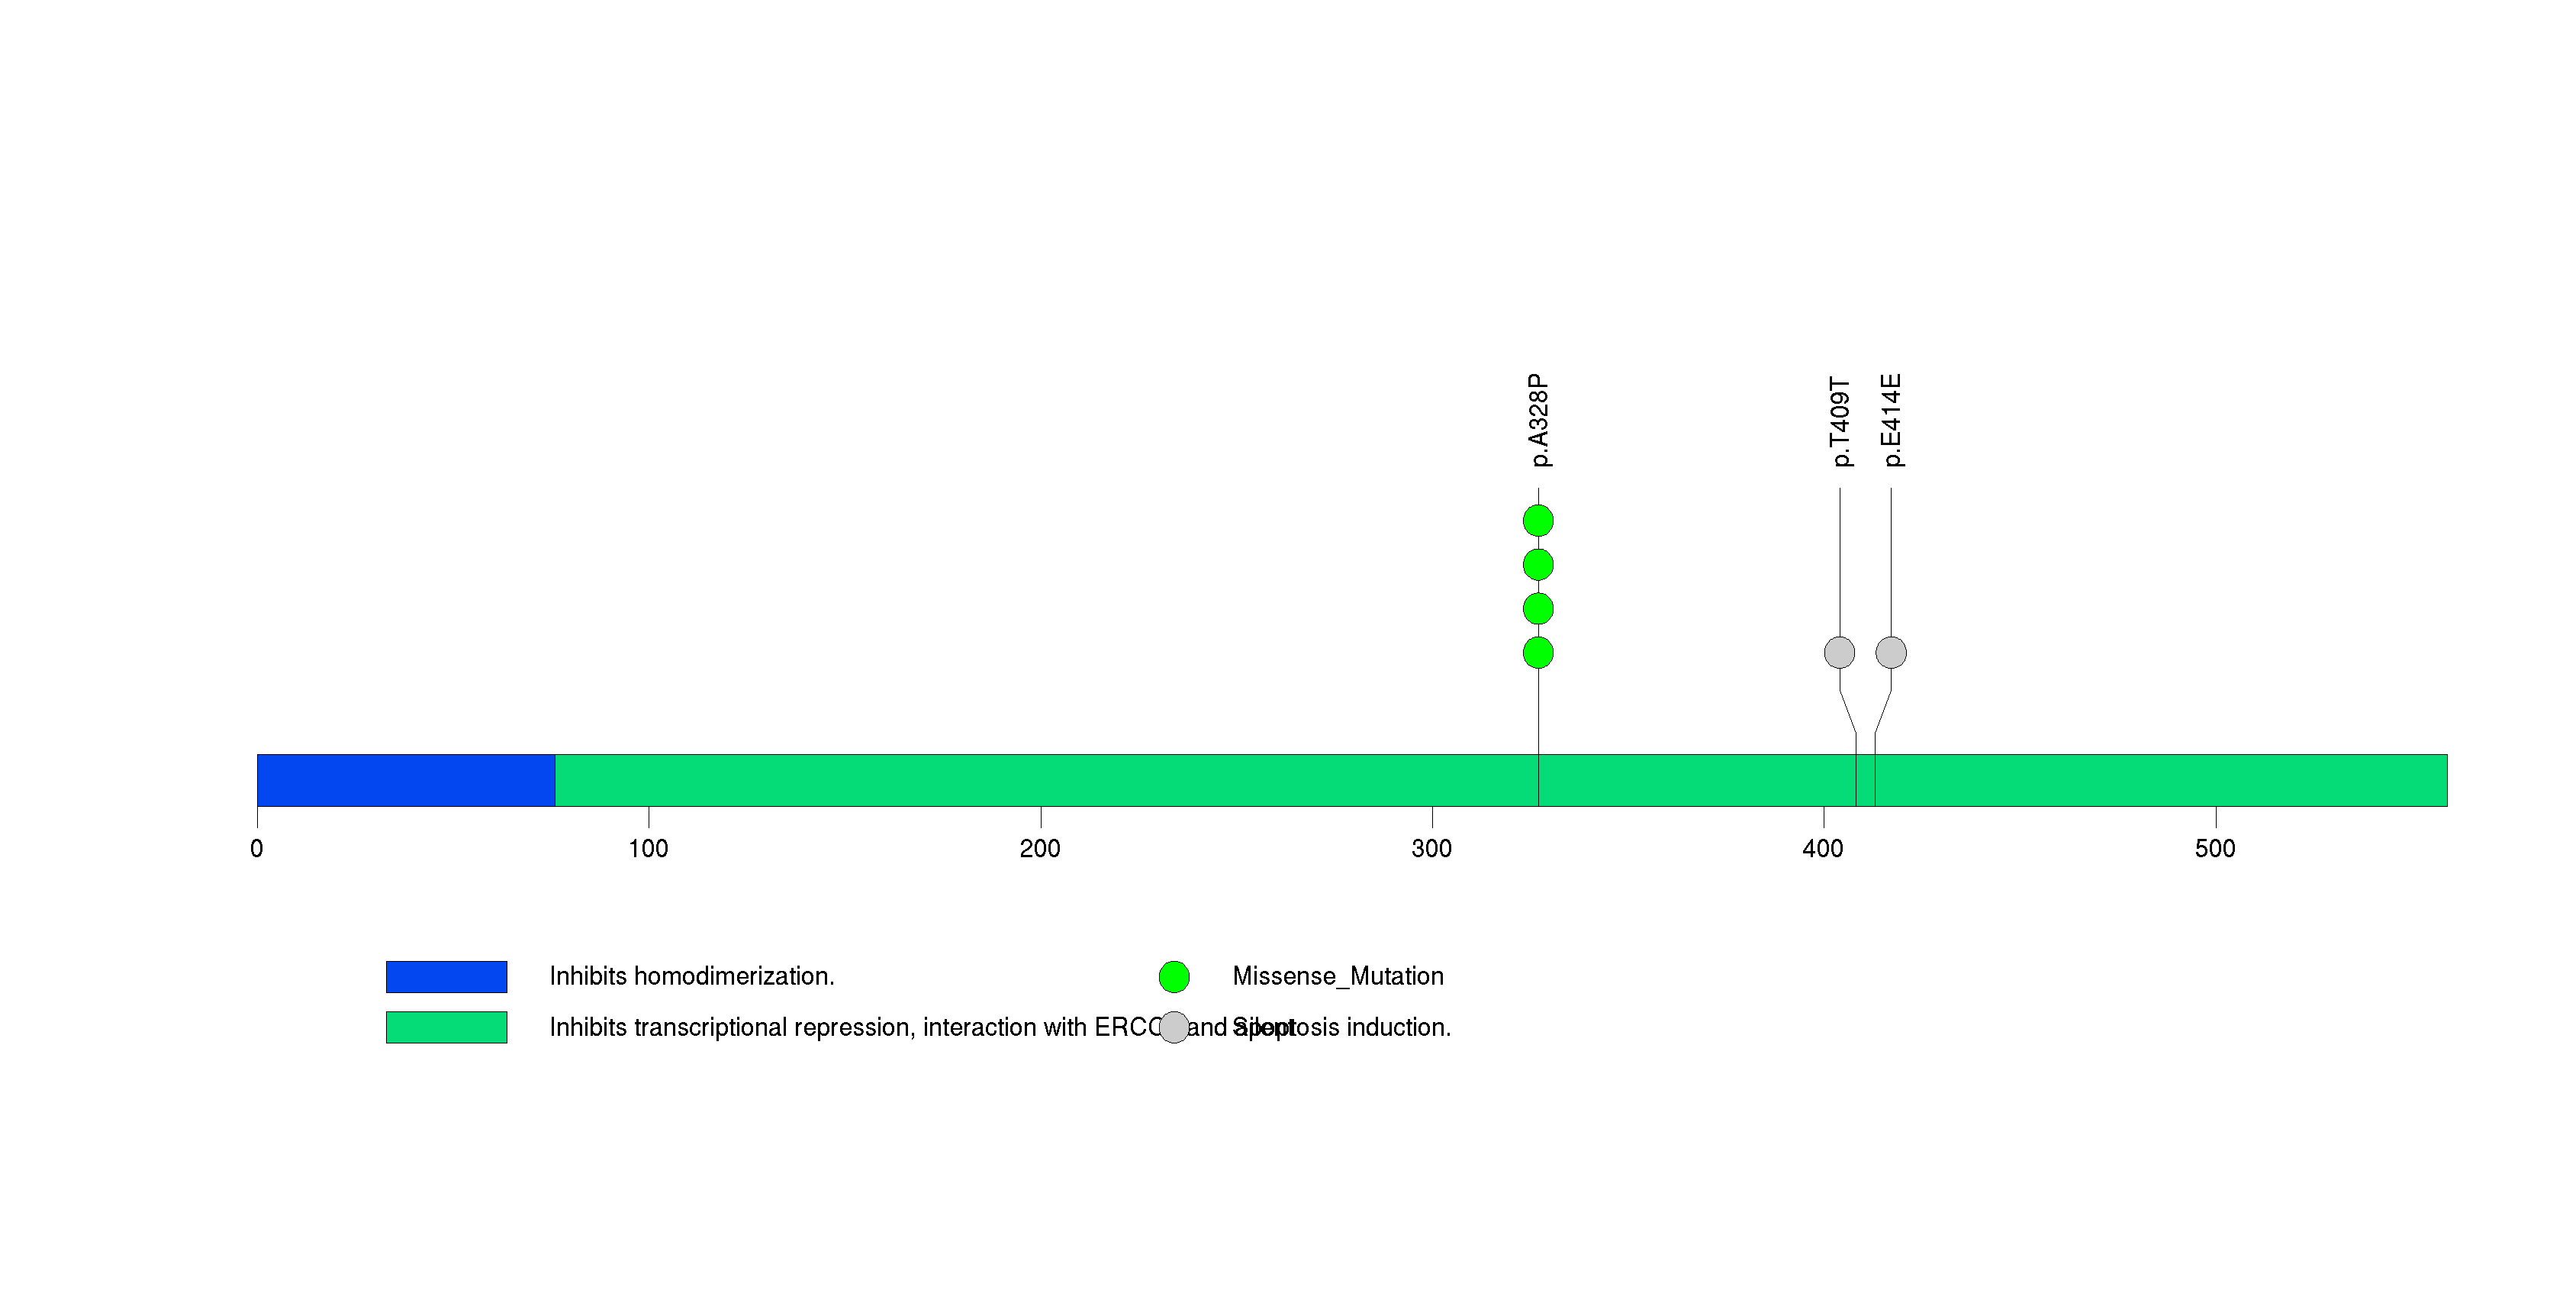
Figure S15. This figure depicts the distribution of mutations and mutation types across the SALL2 significant gene.
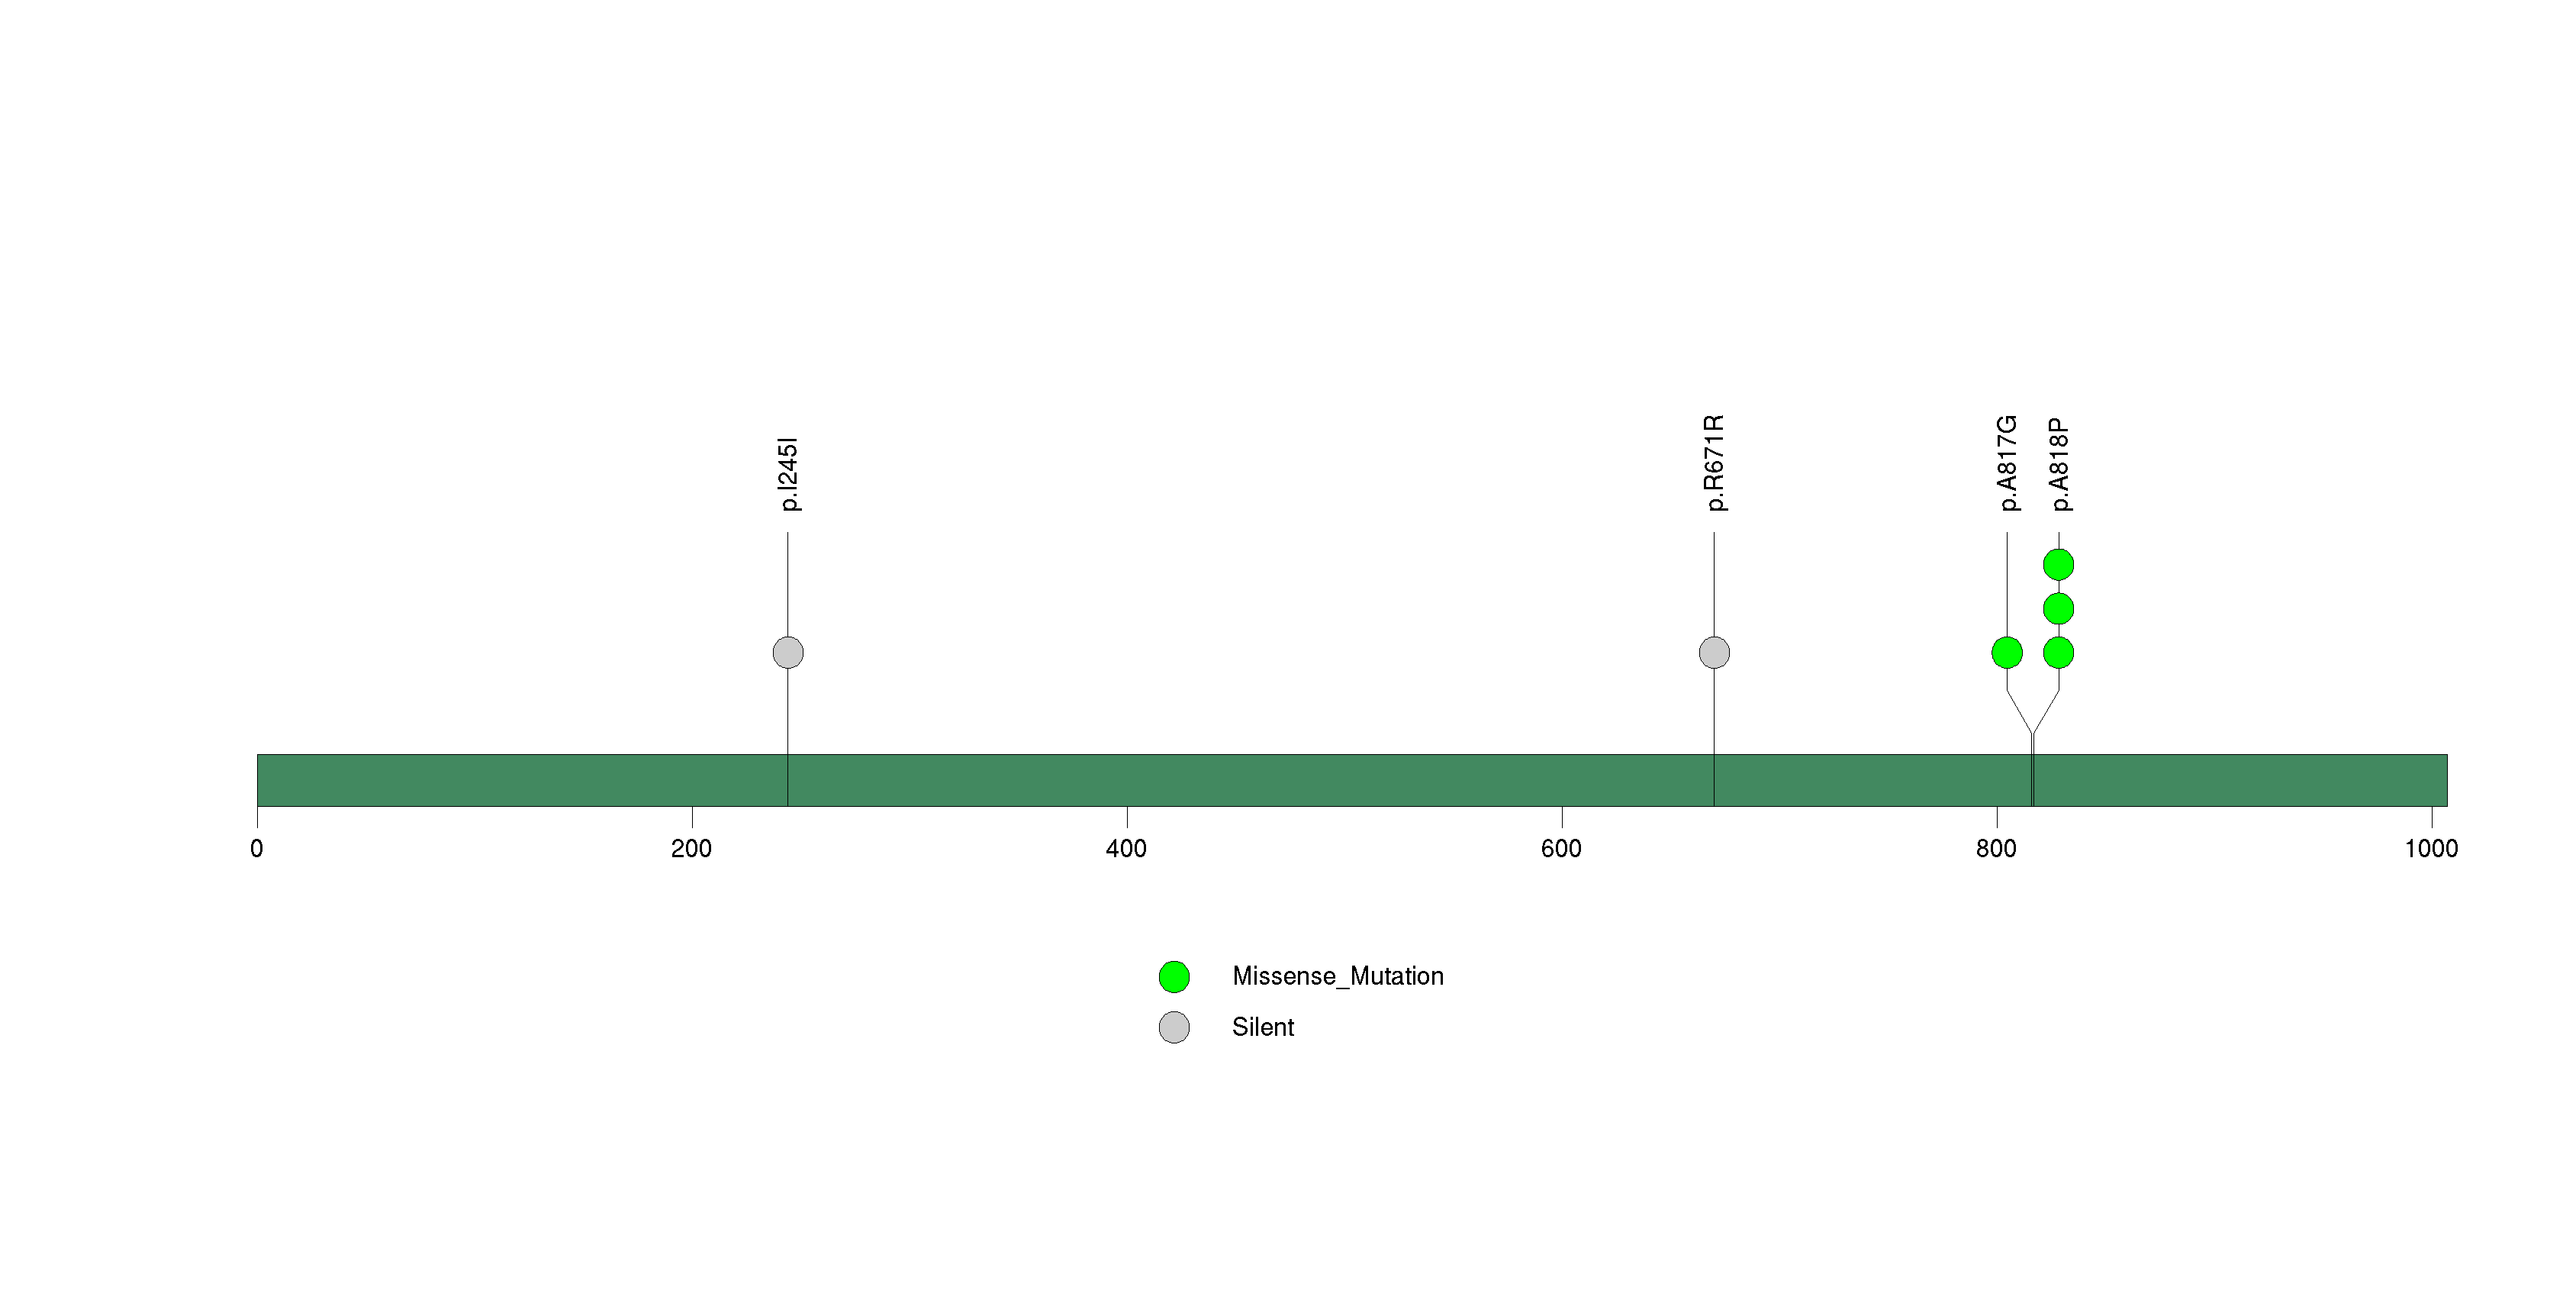
Figure S16. This figure depicts the distribution of mutations and mutation types across the SPHK2 significant gene.
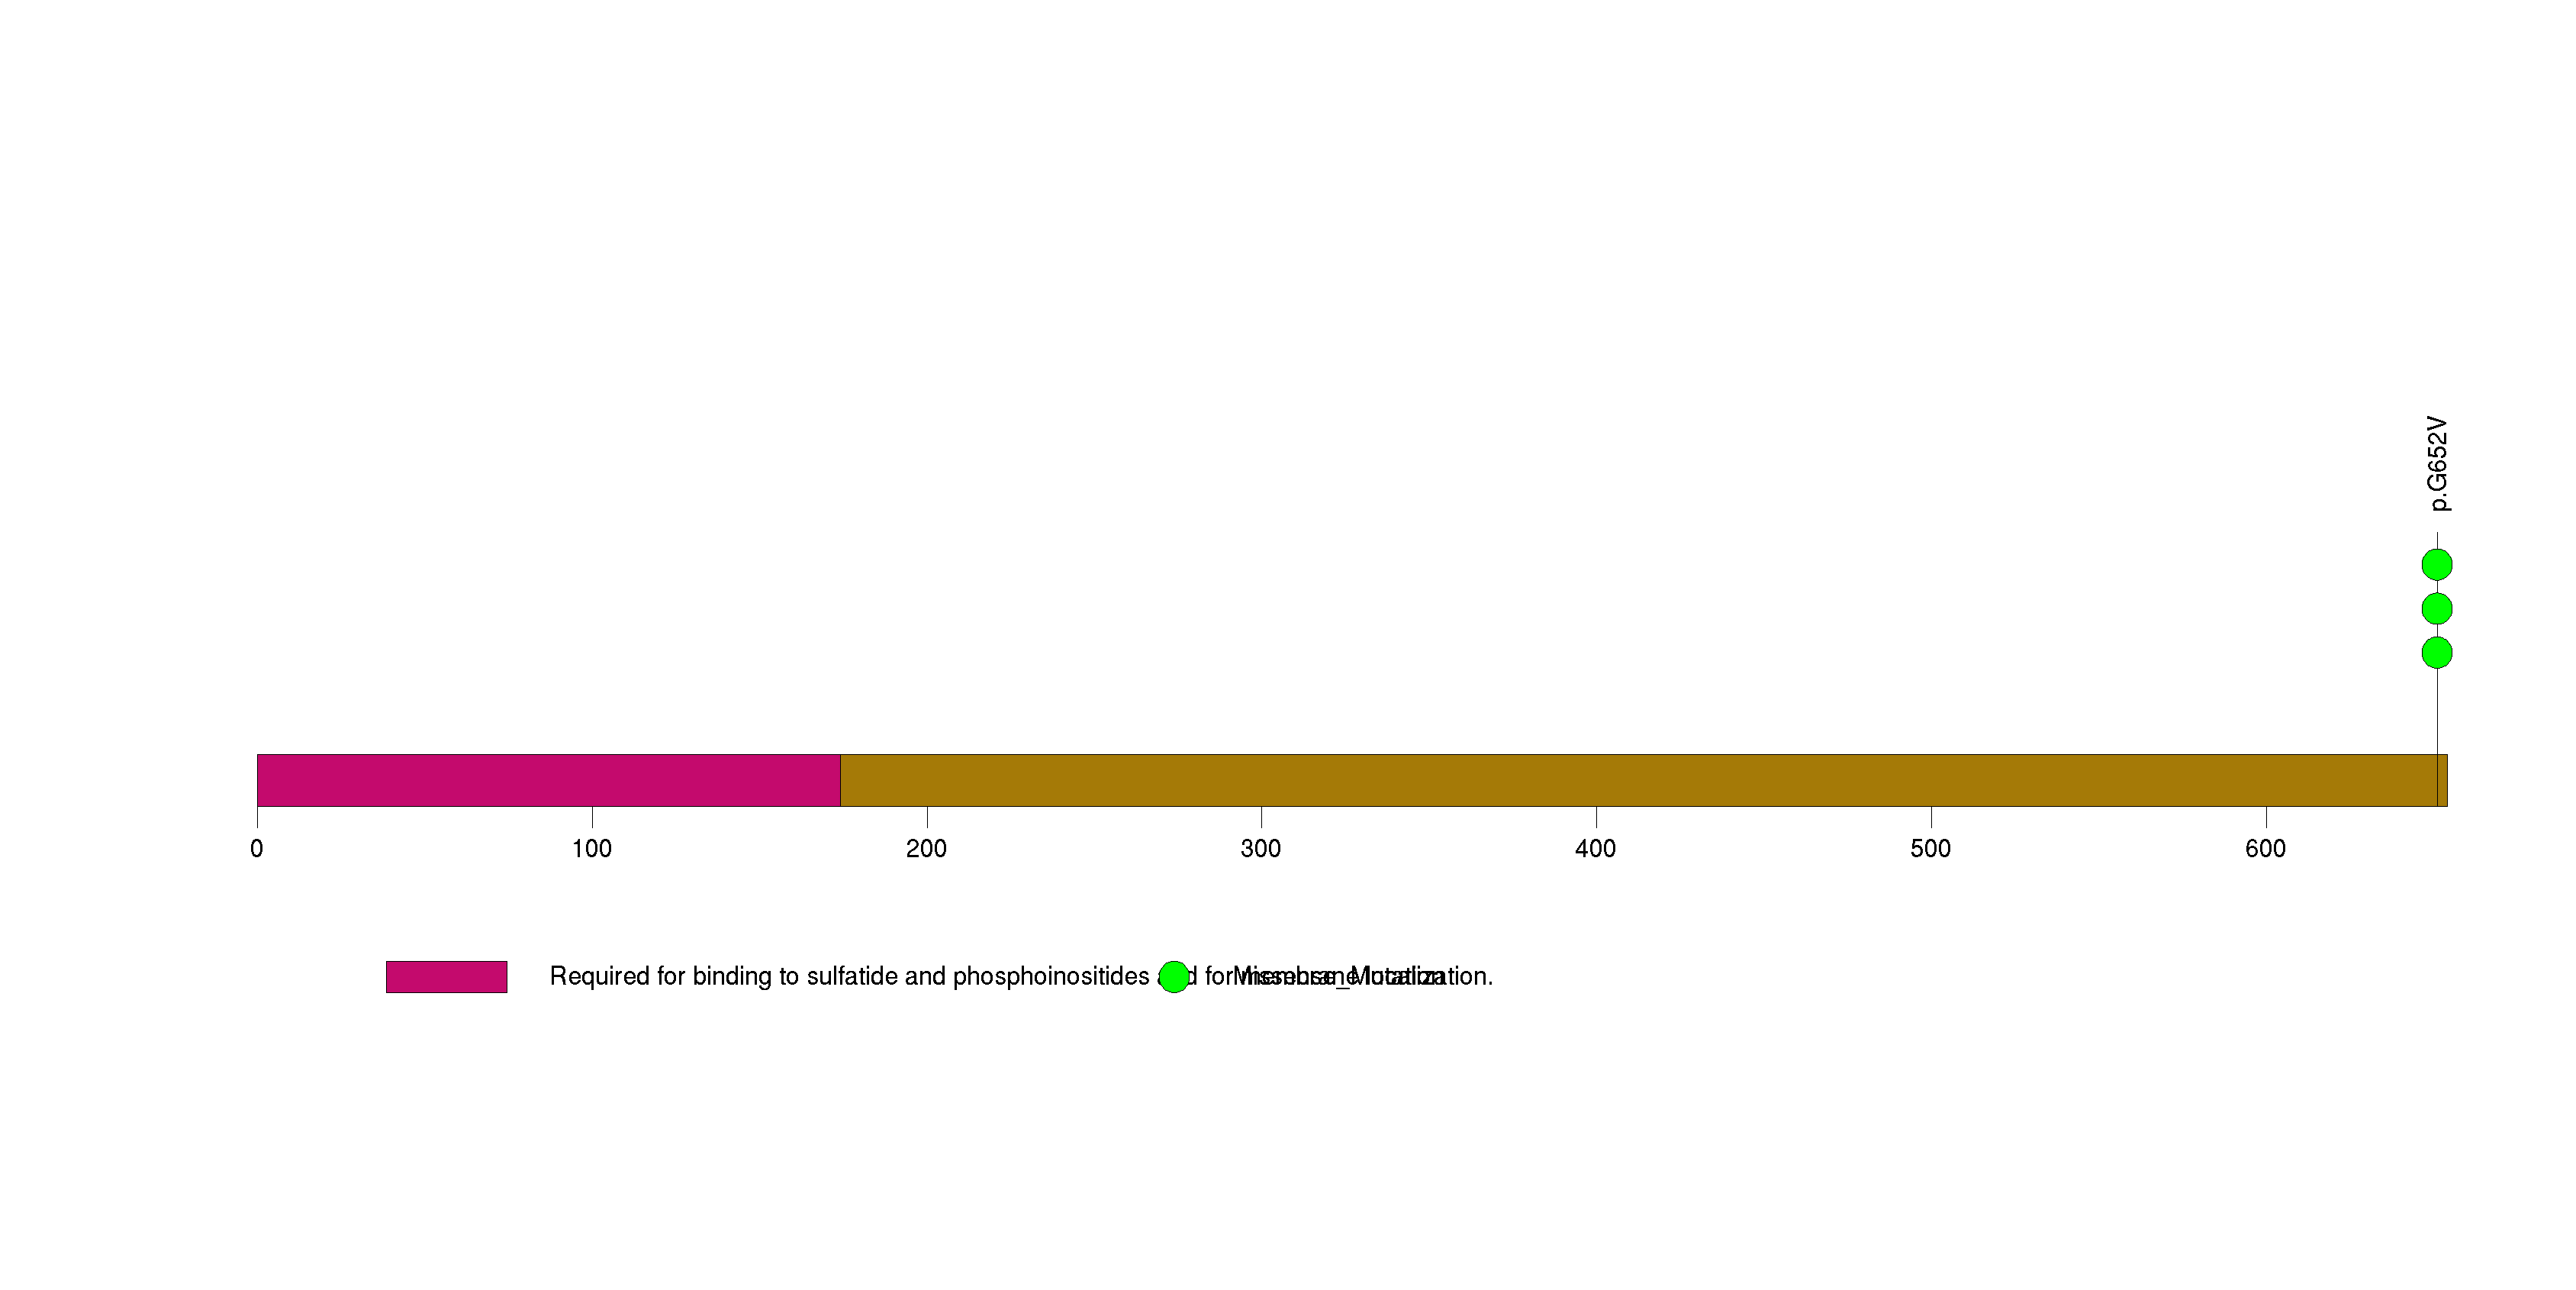
Figure S17. This figure depicts the distribution of mutations and mutation types across the ACSM2B significant gene.
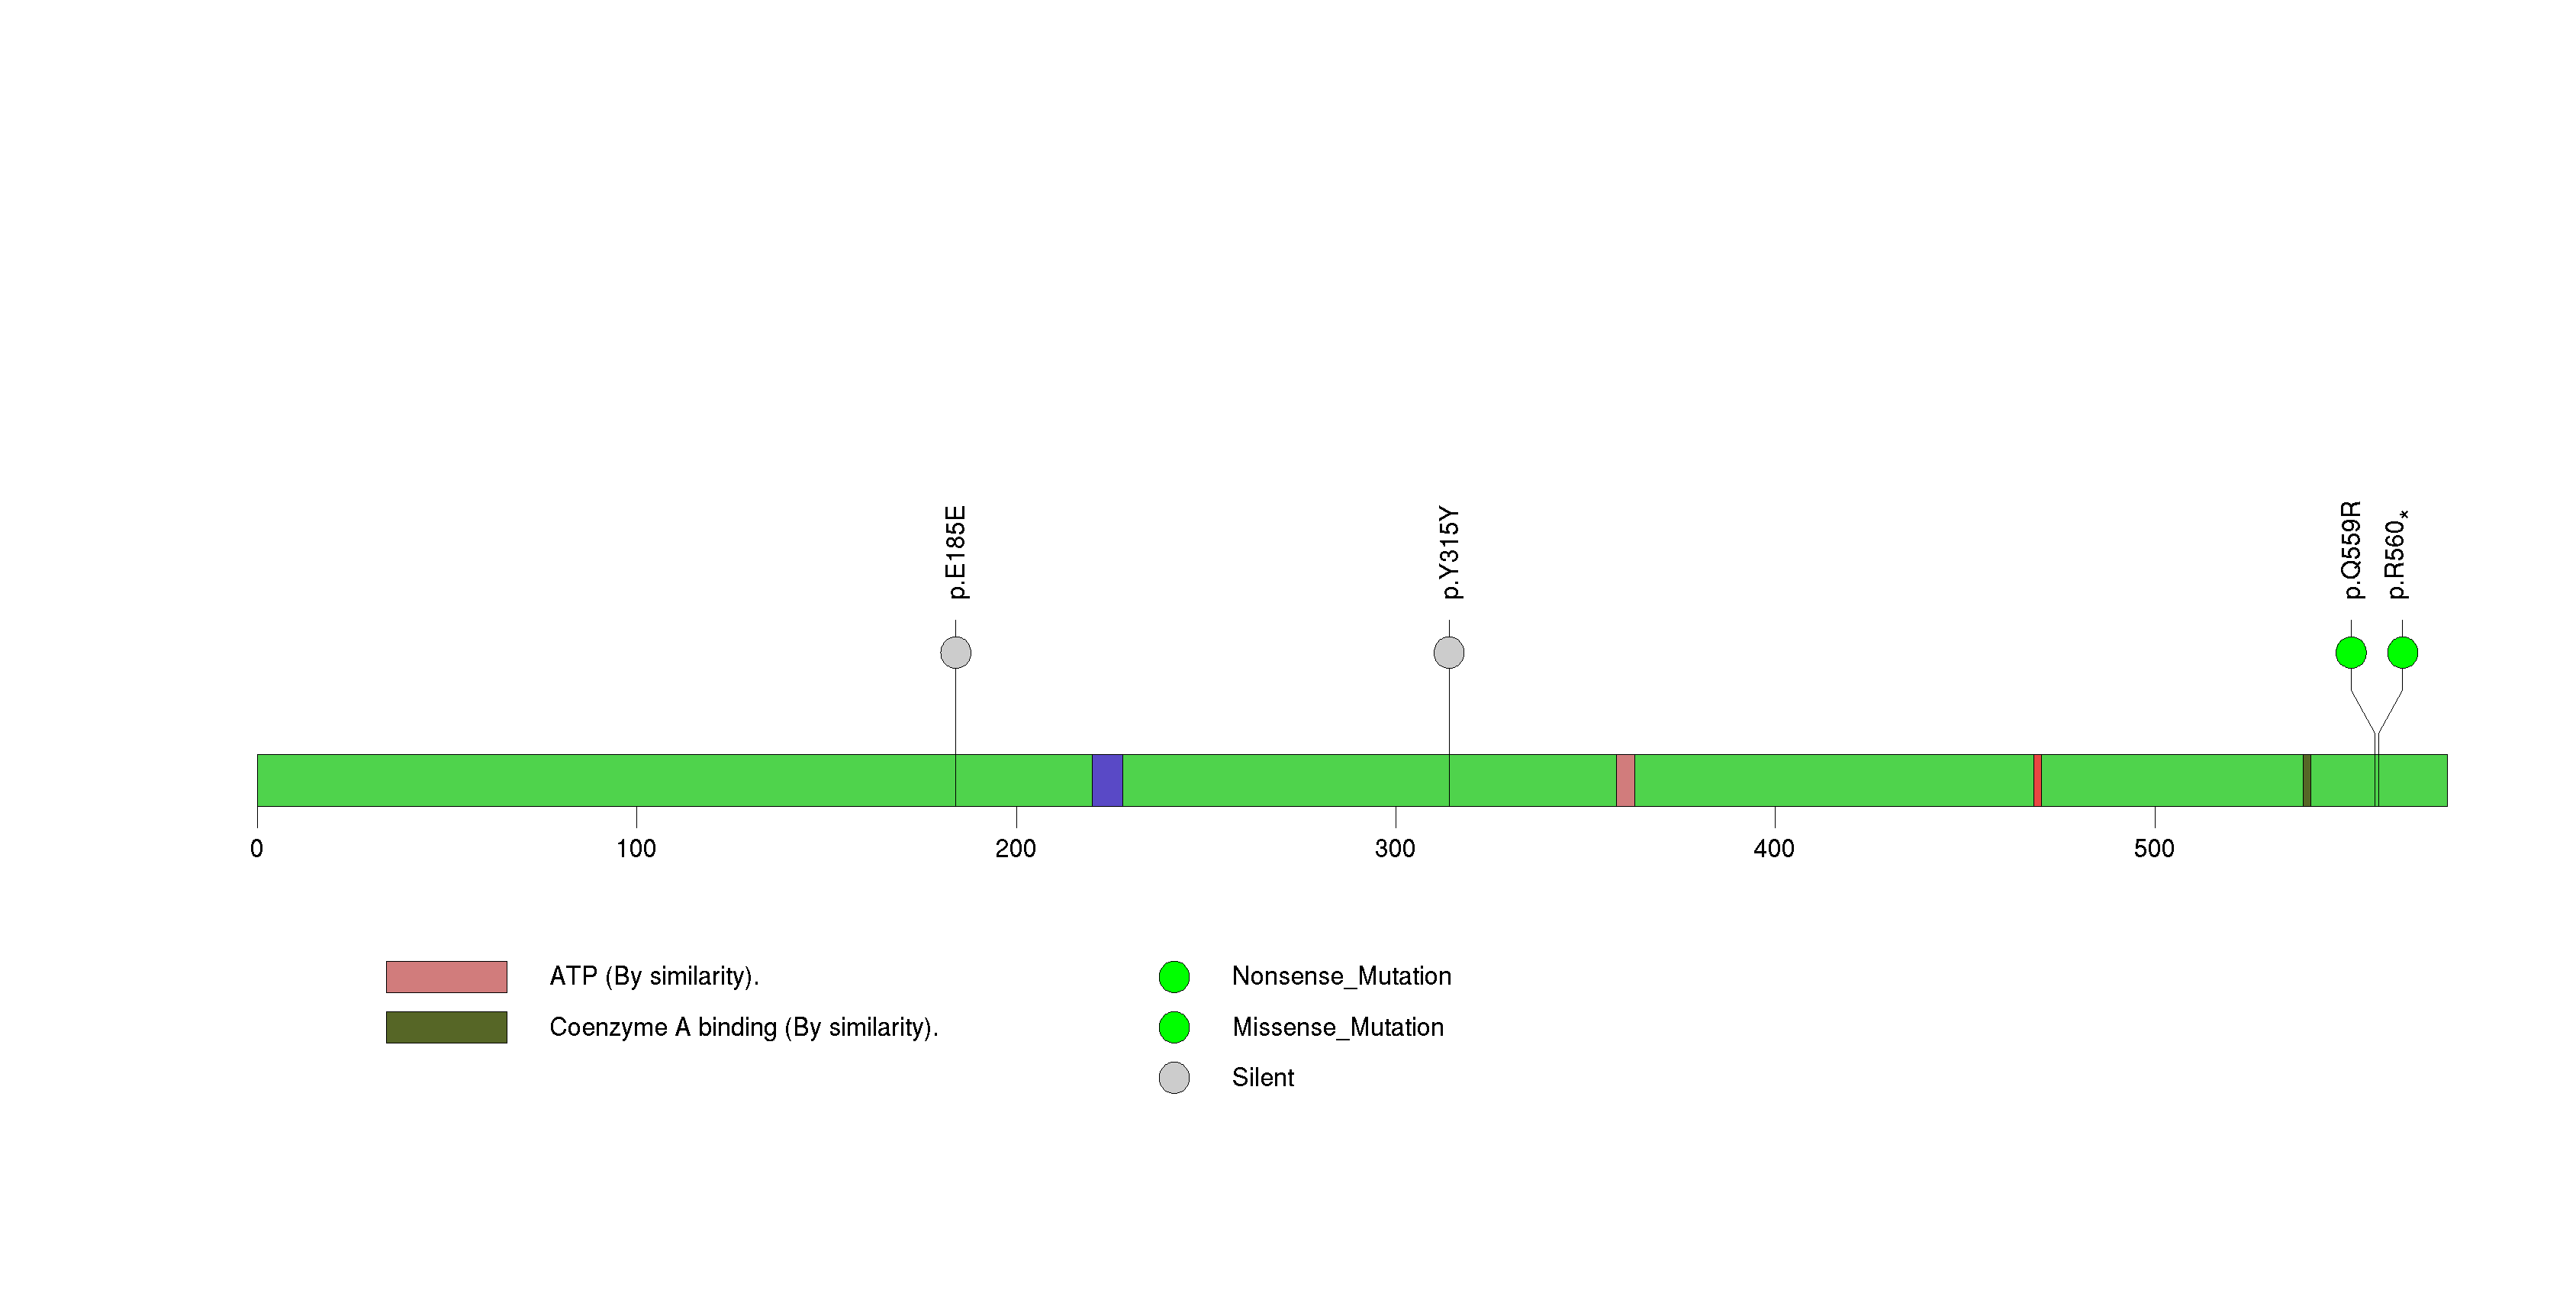
Figure S18. This figure depicts the distribution of mutations and mutation types across the C1orf100 significant gene.
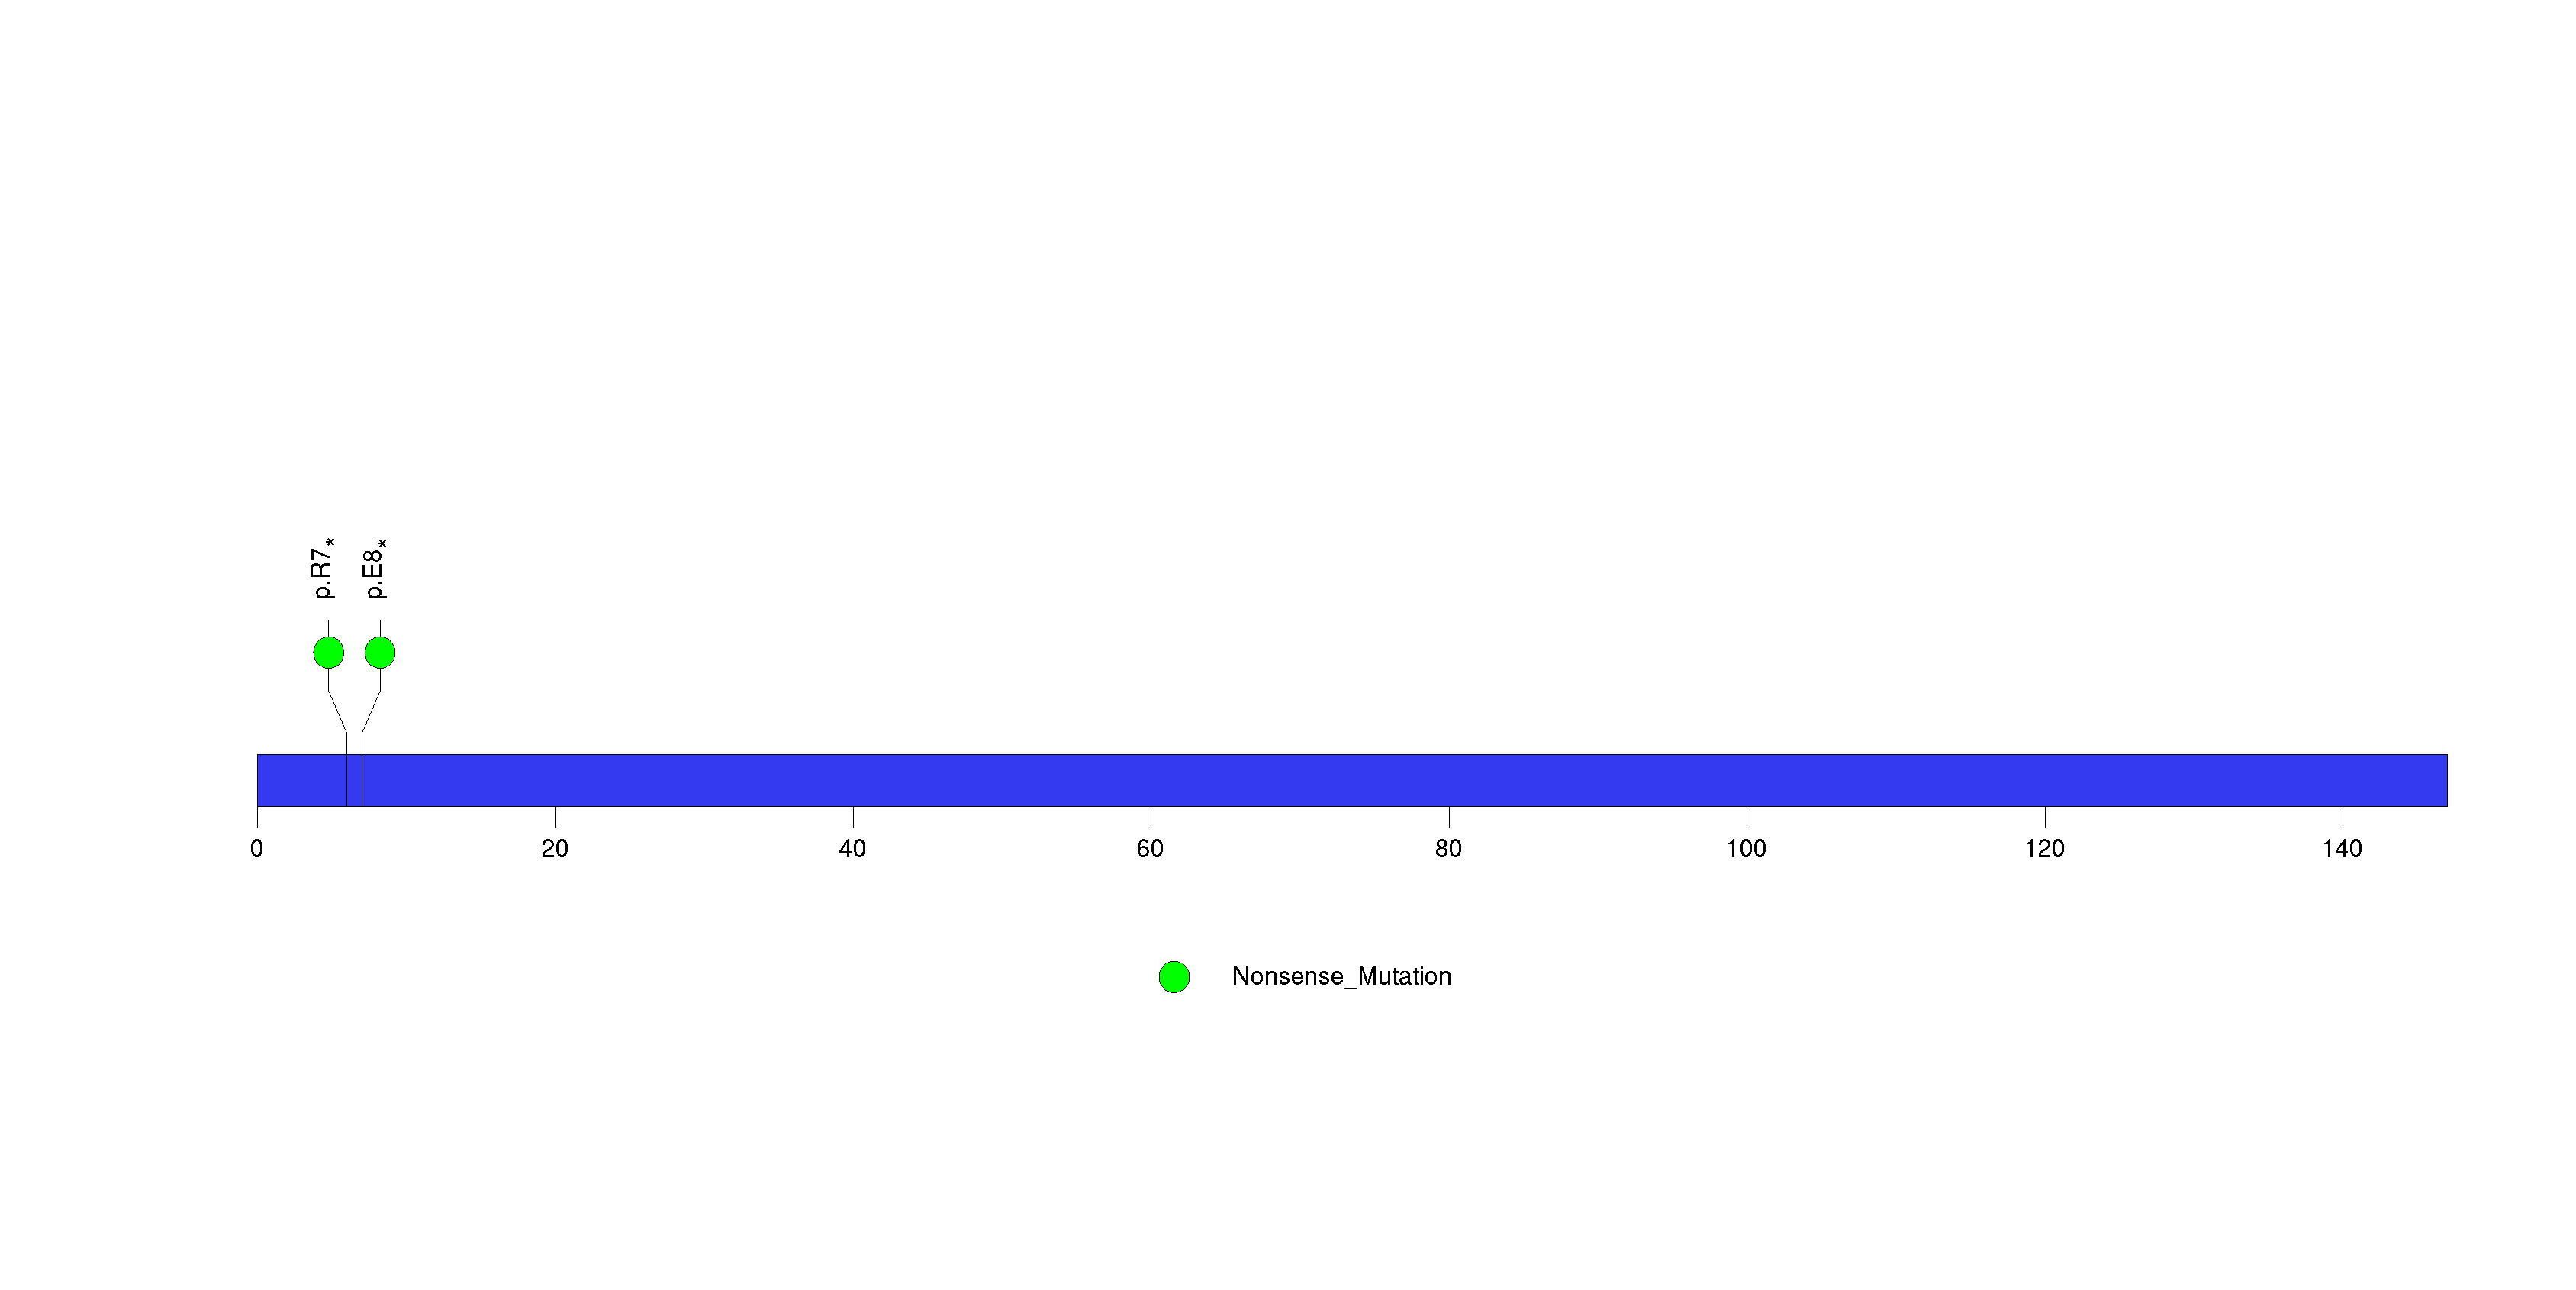
Figure S19. This figure depicts the distribution of mutations and mutation types across the TAPBPL significant gene.
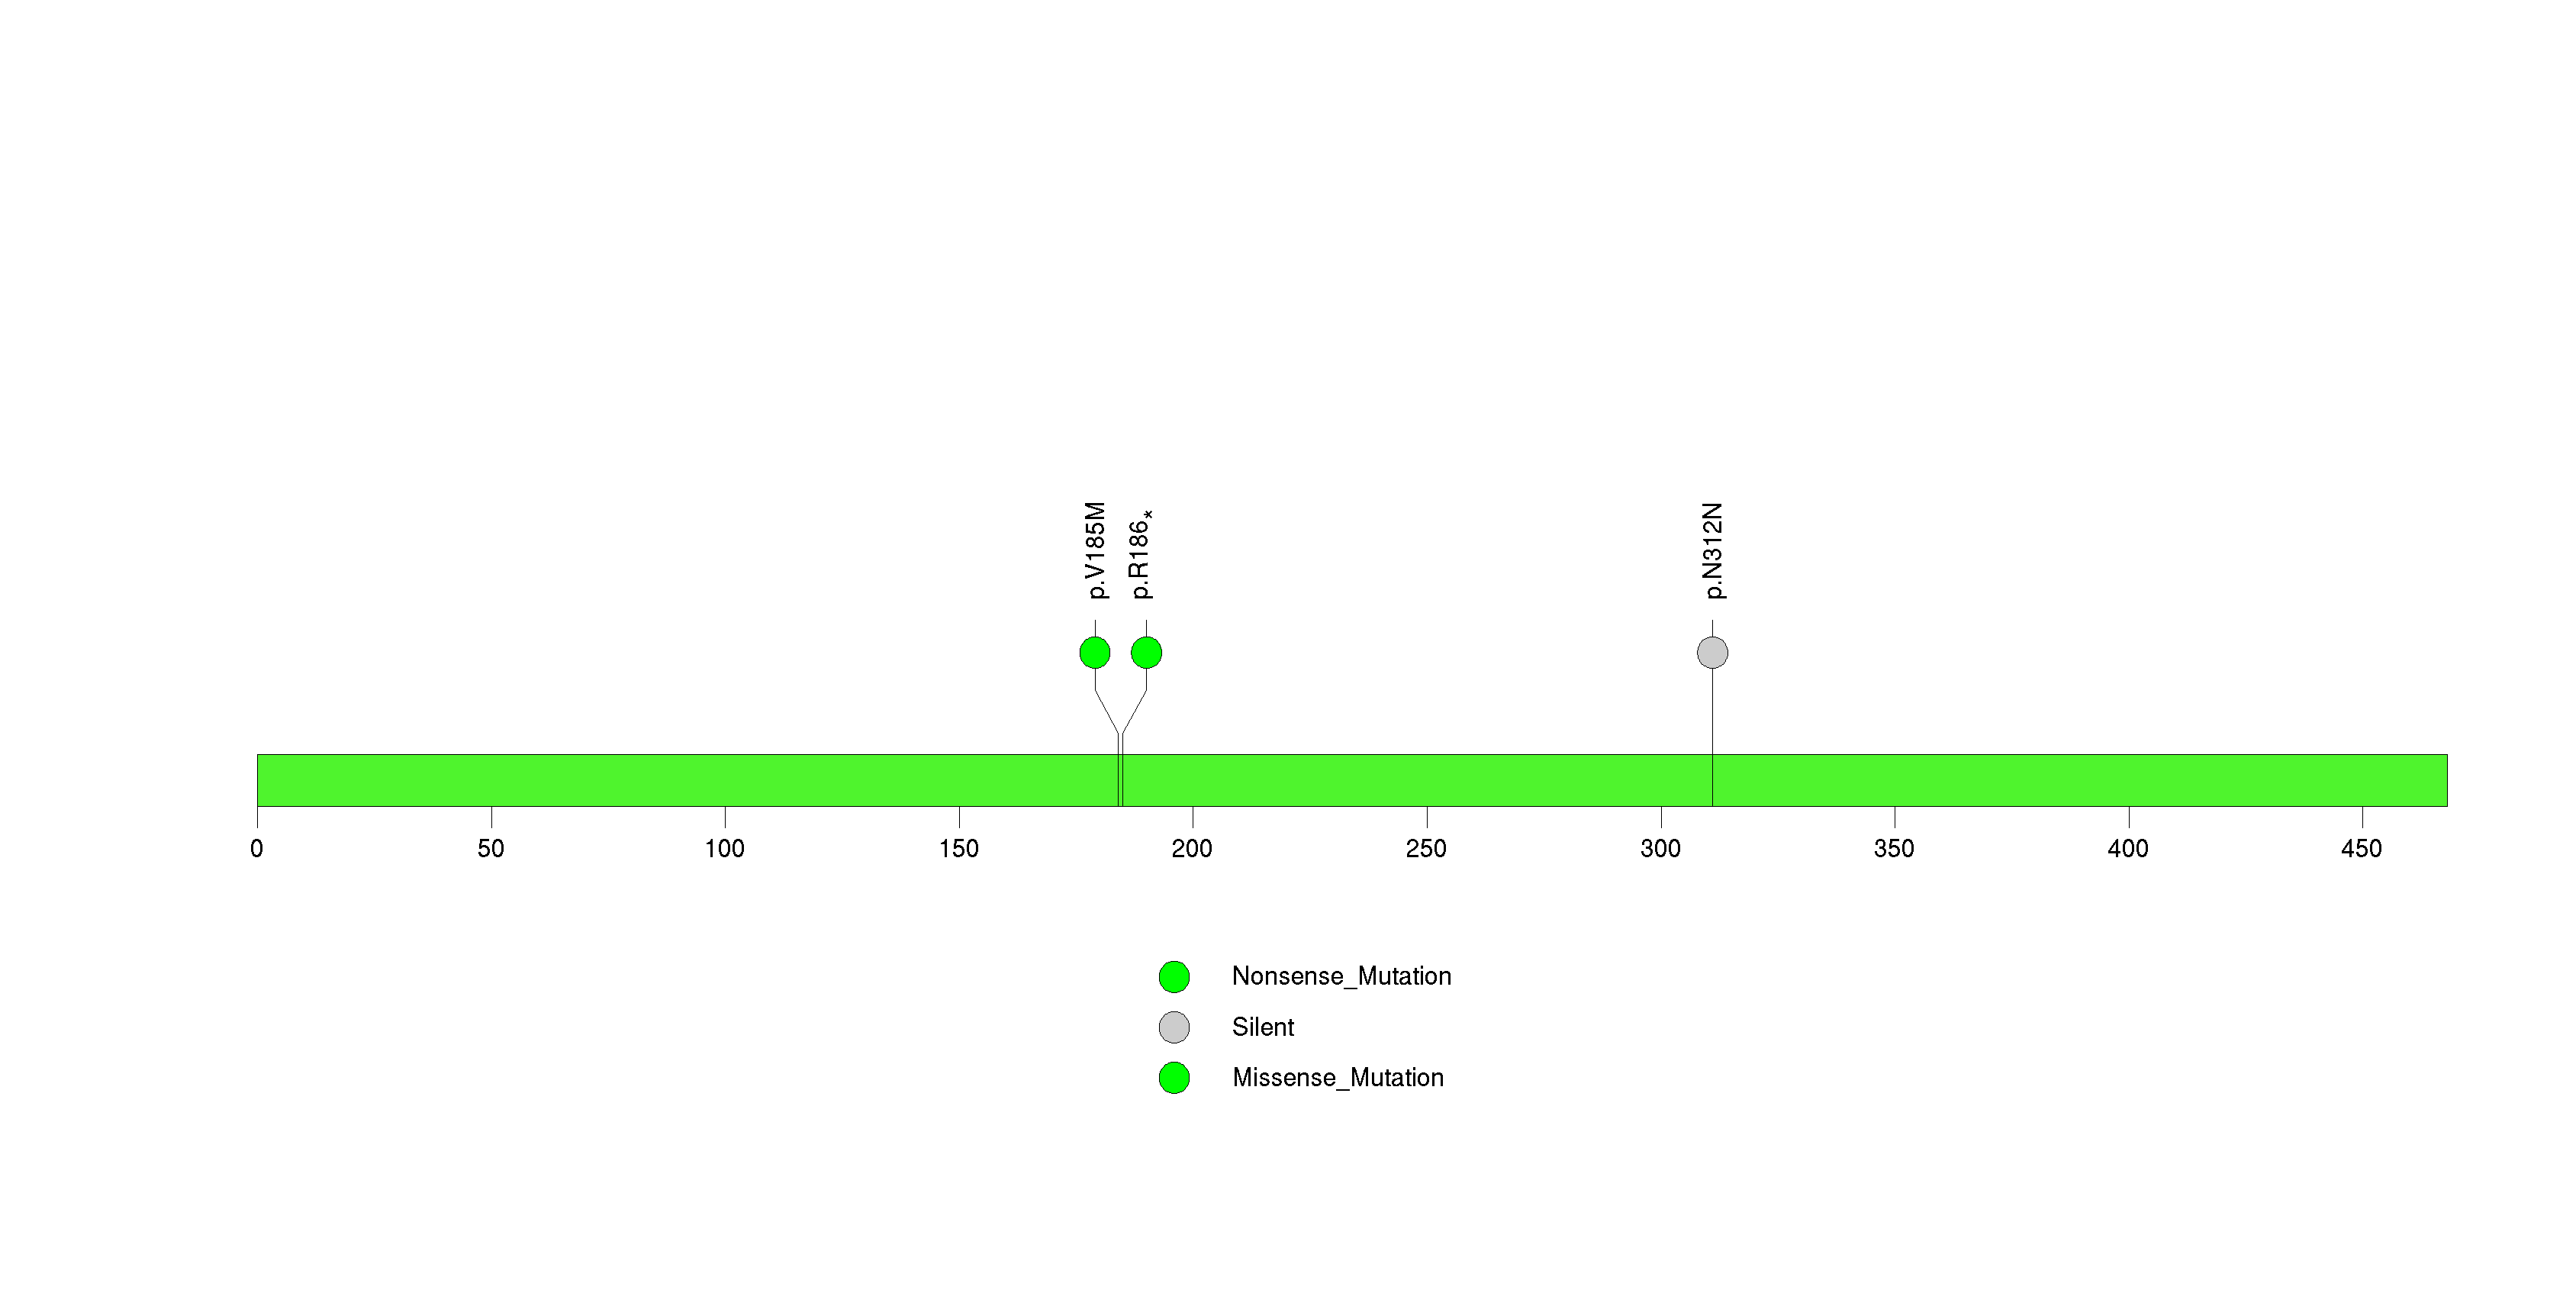
Figure S20. This figure depicts the distribution of mutations and mutation types across the ABCA3 significant gene.

Figure S21. This figure depicts the distribution of mutations and mutation types across the RB1 significant gene.
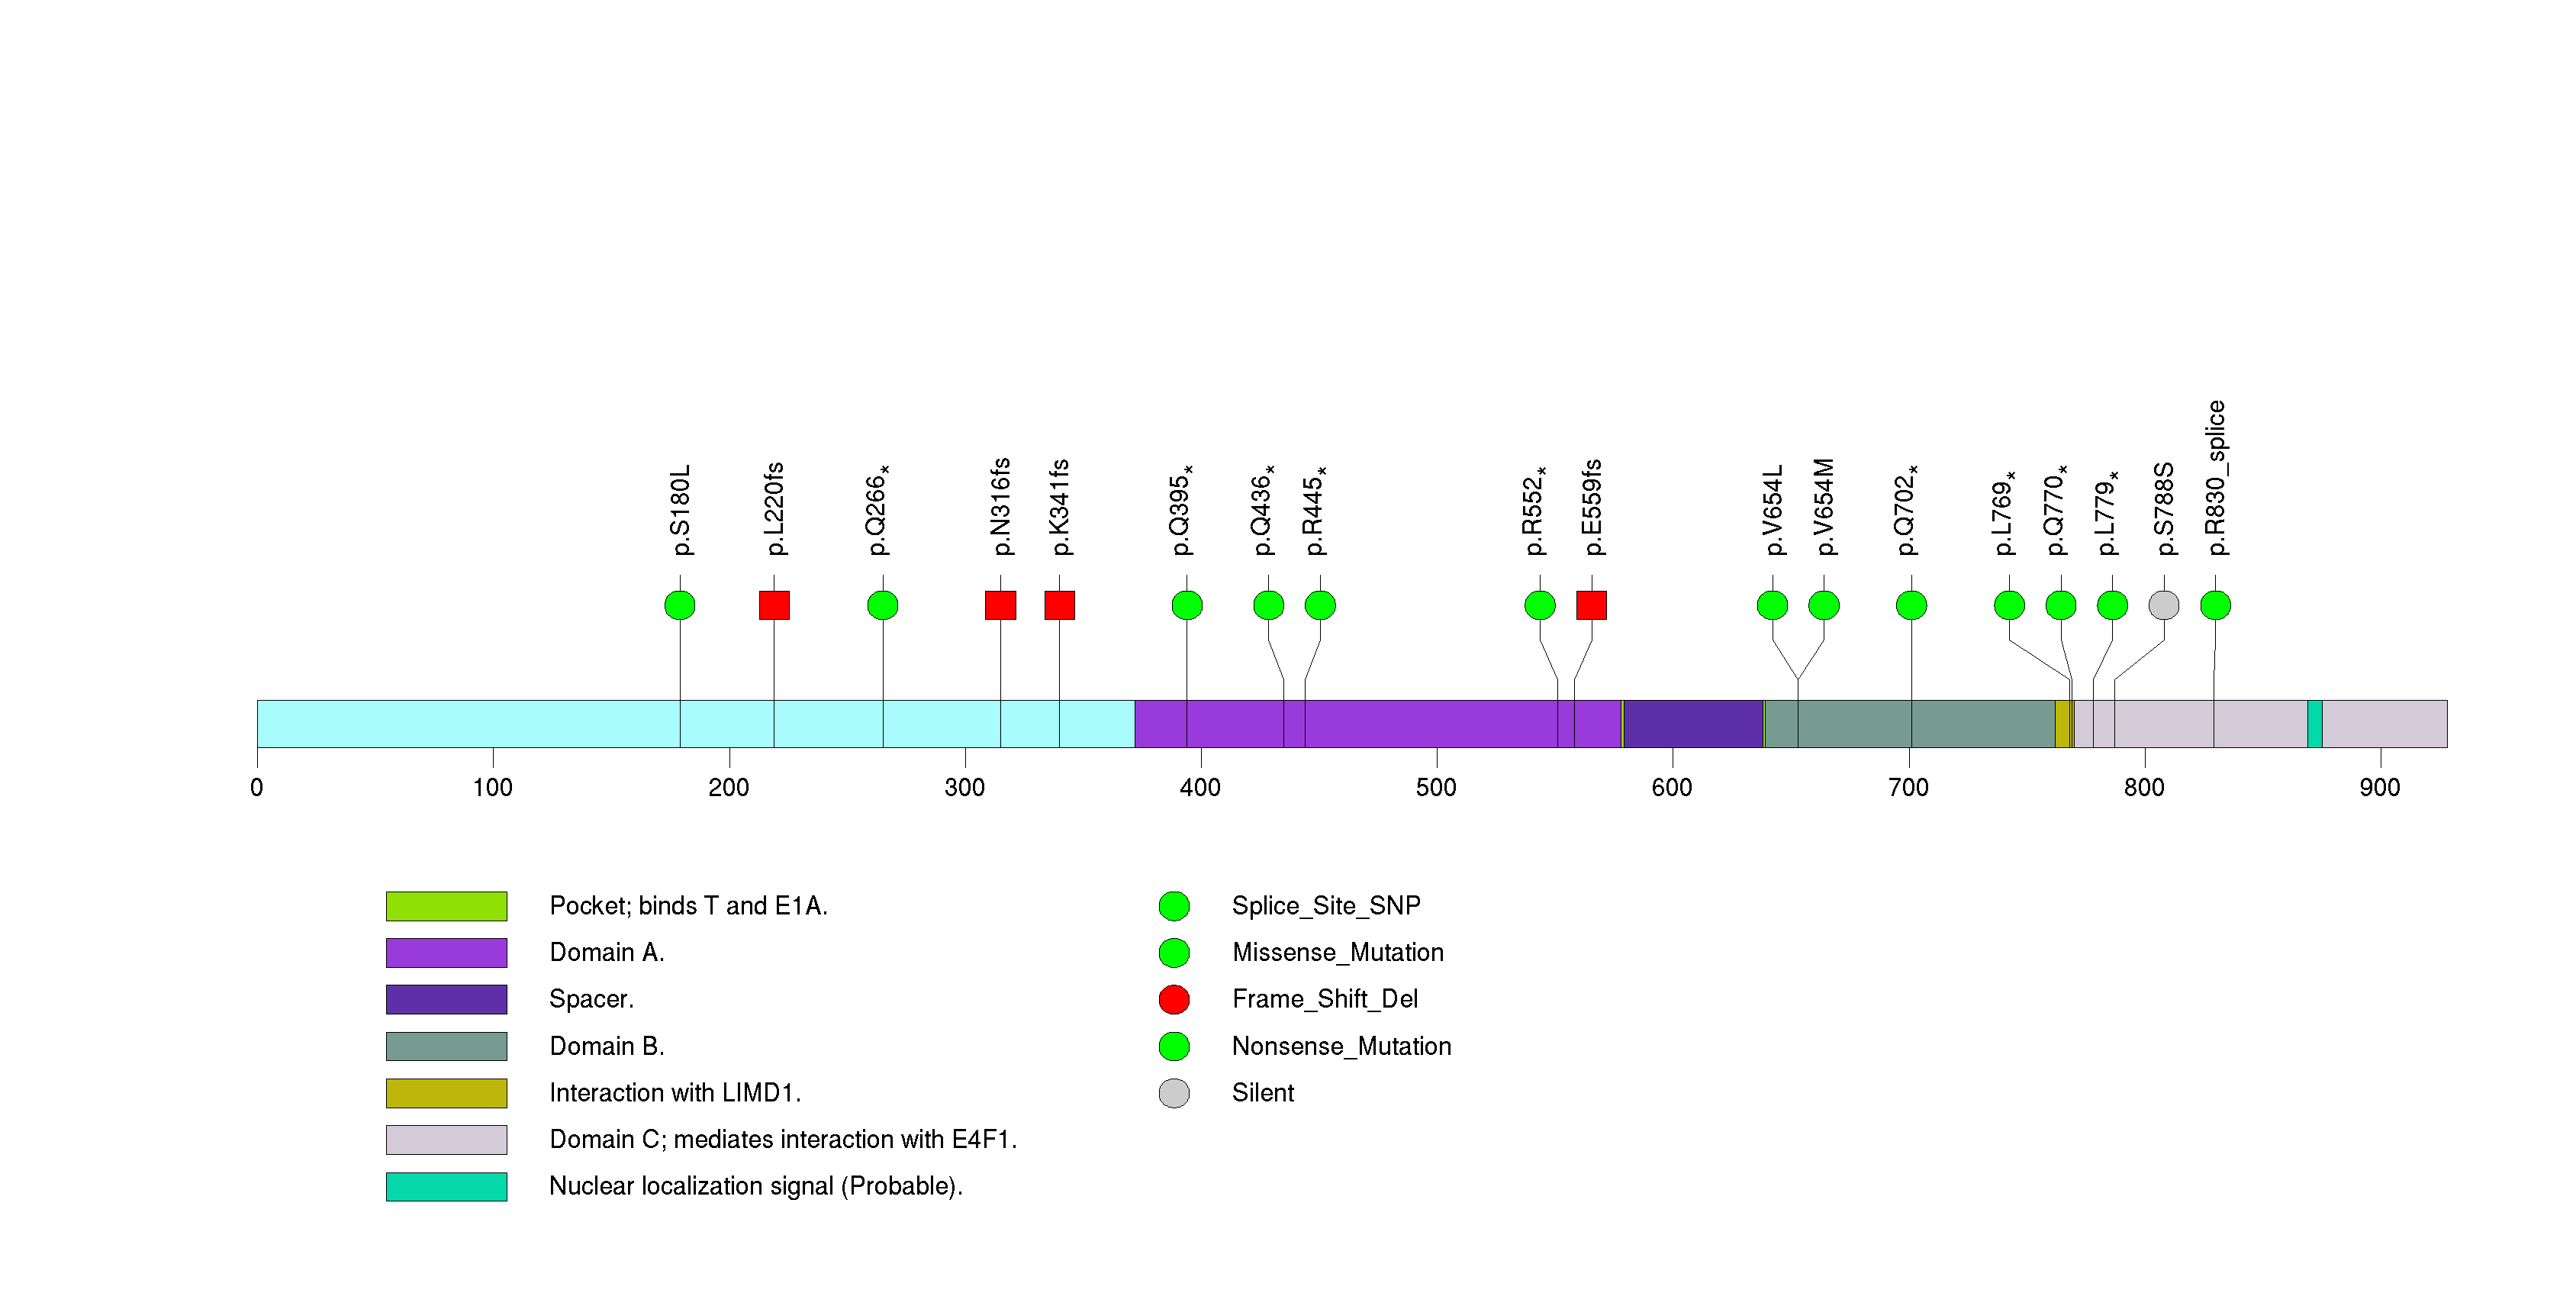
Figure S22. This figure depicts the distribution of mutations and mutation types across the SPTA1 significant gene.
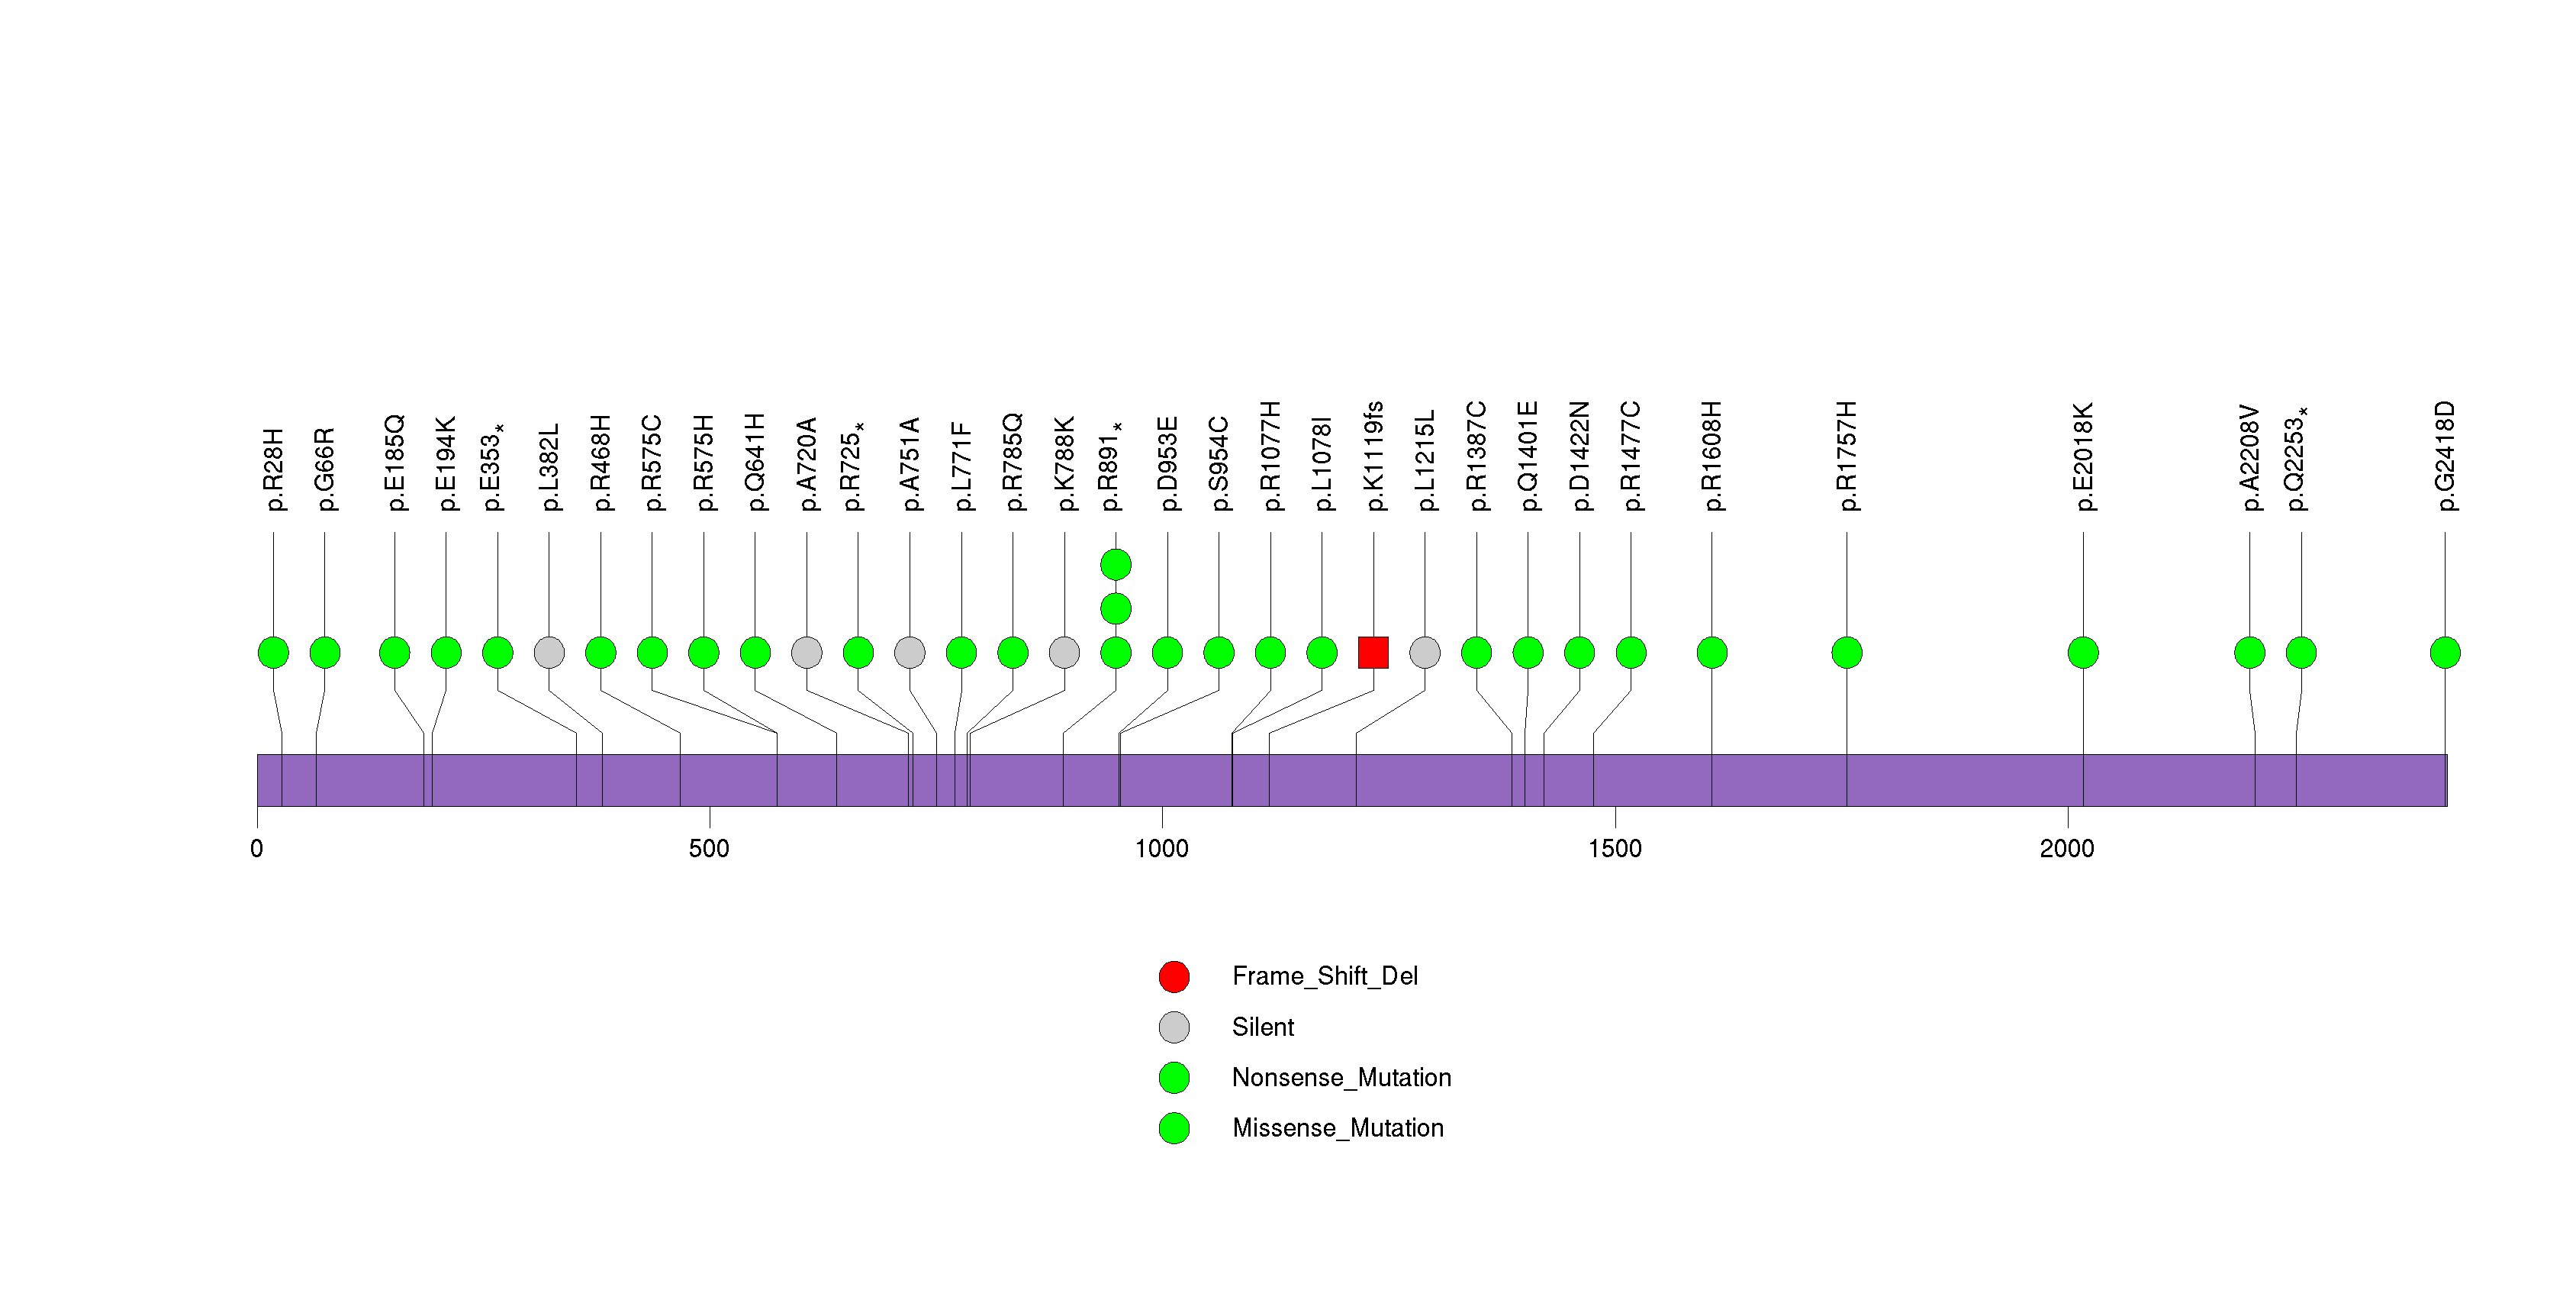
Figure S23. This figure depicts the distribution of mutations and mutation types across the FOXRED1 significant gene.
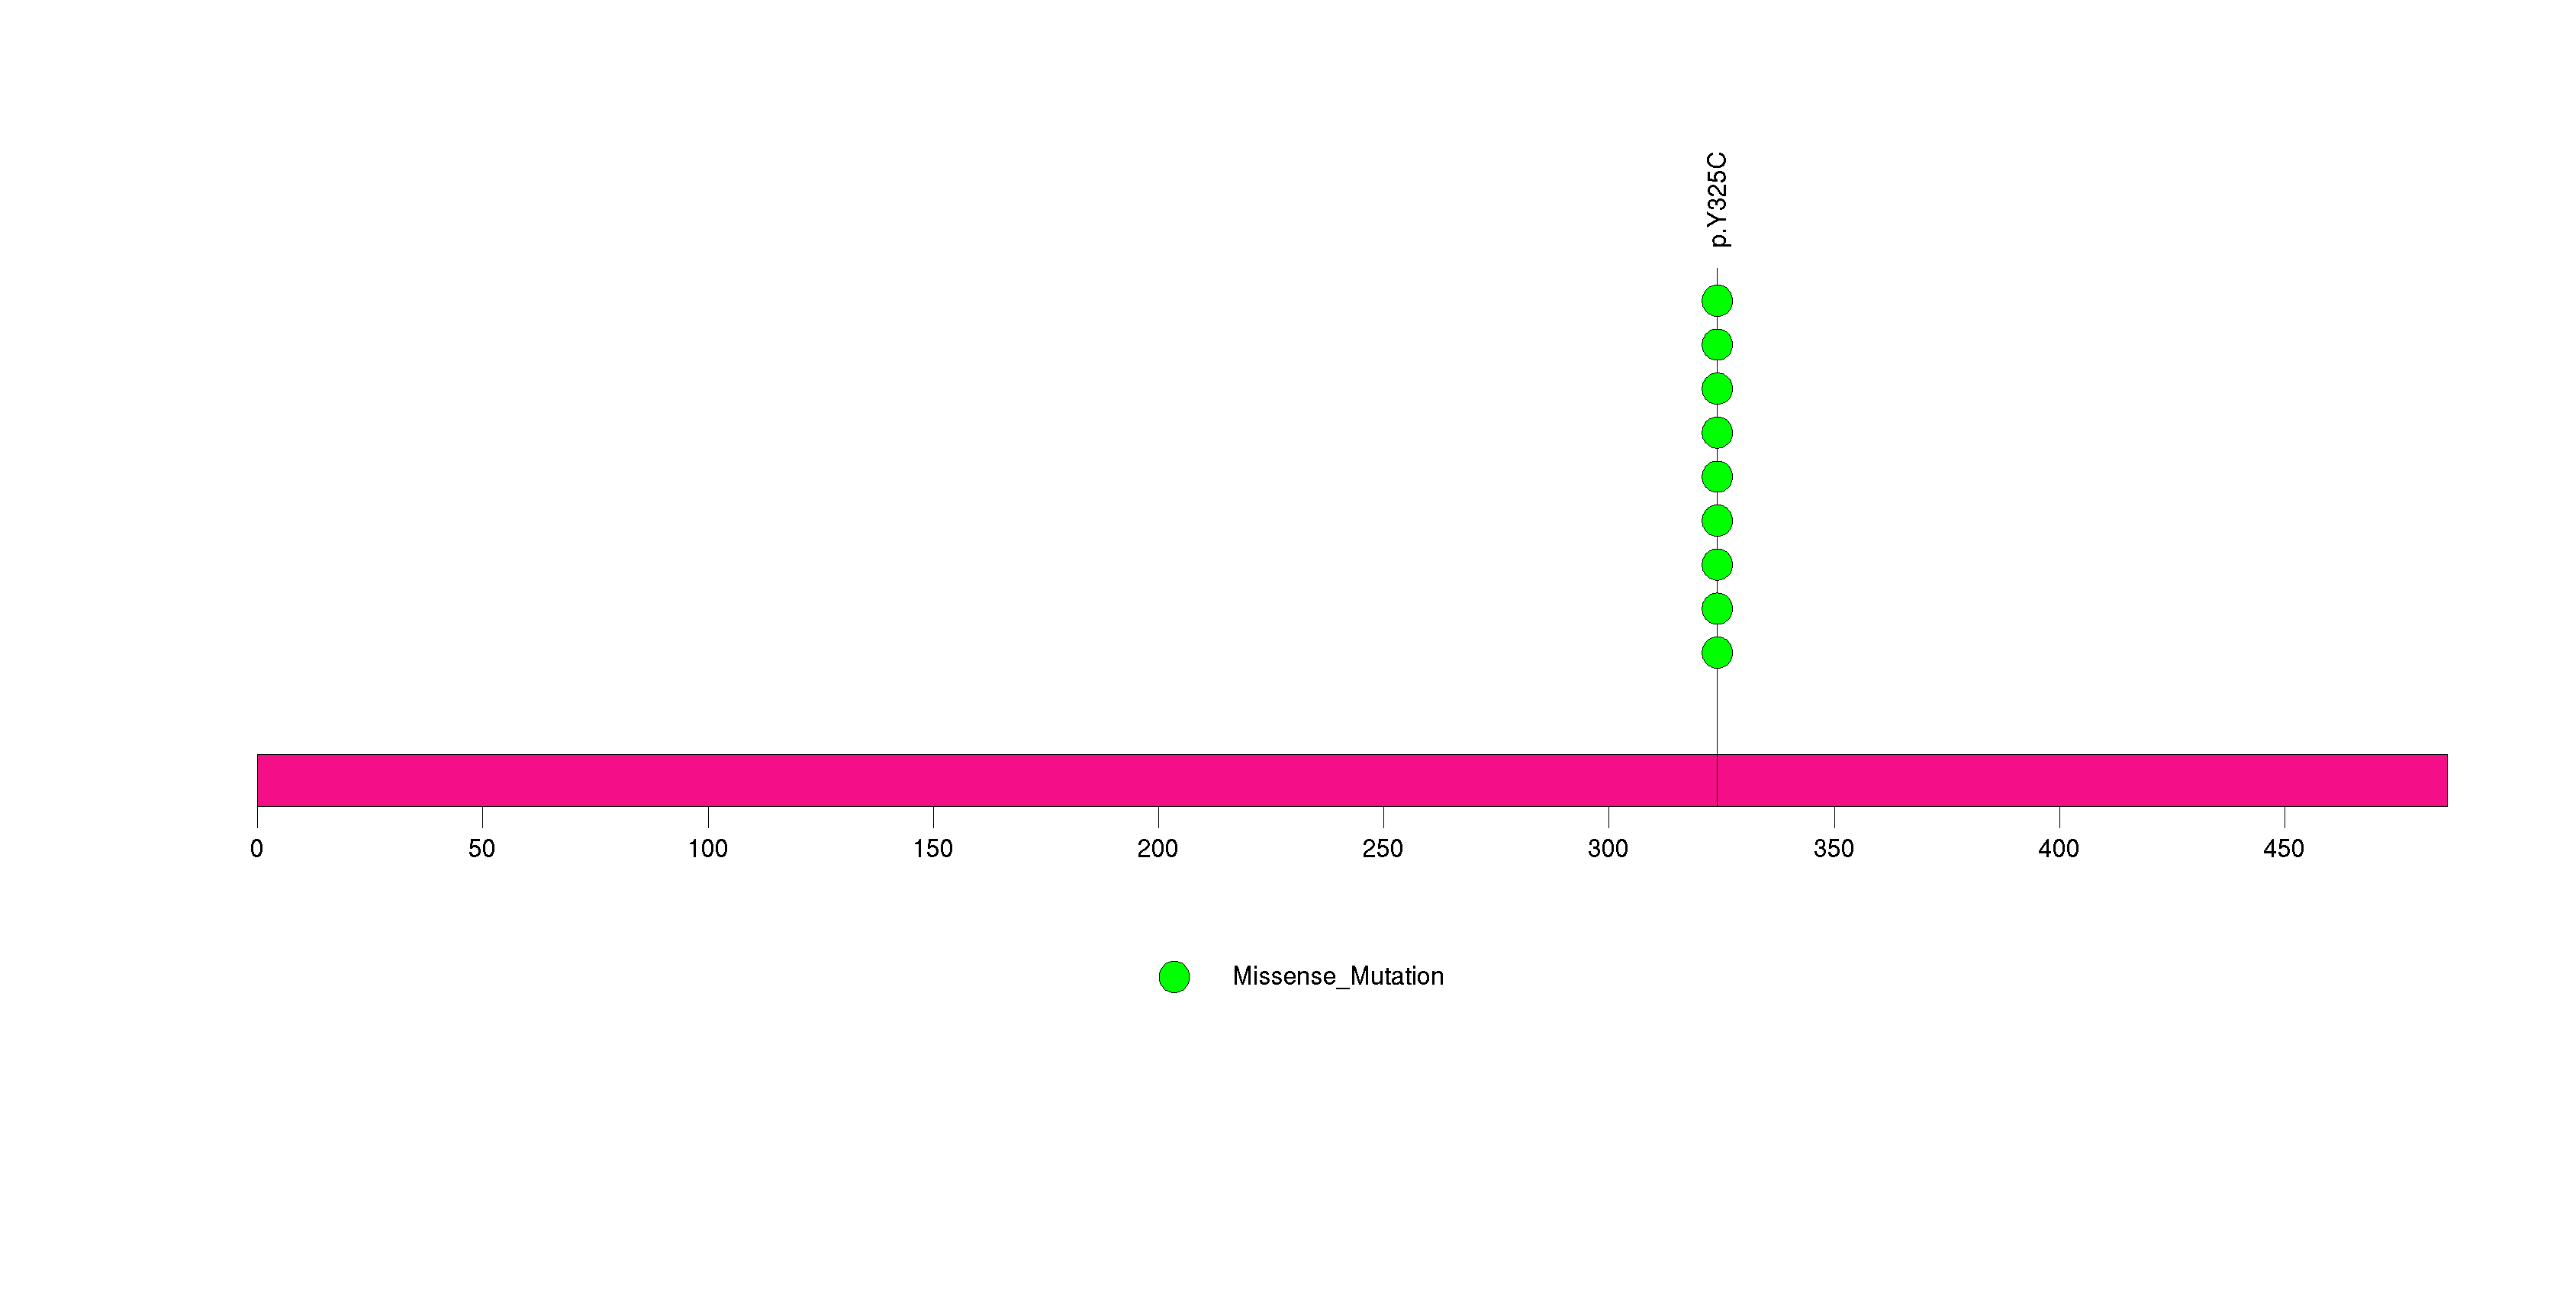
Figure S24. This figure depicts the distribution of mutations and mutation types across the NF1 significant gene.
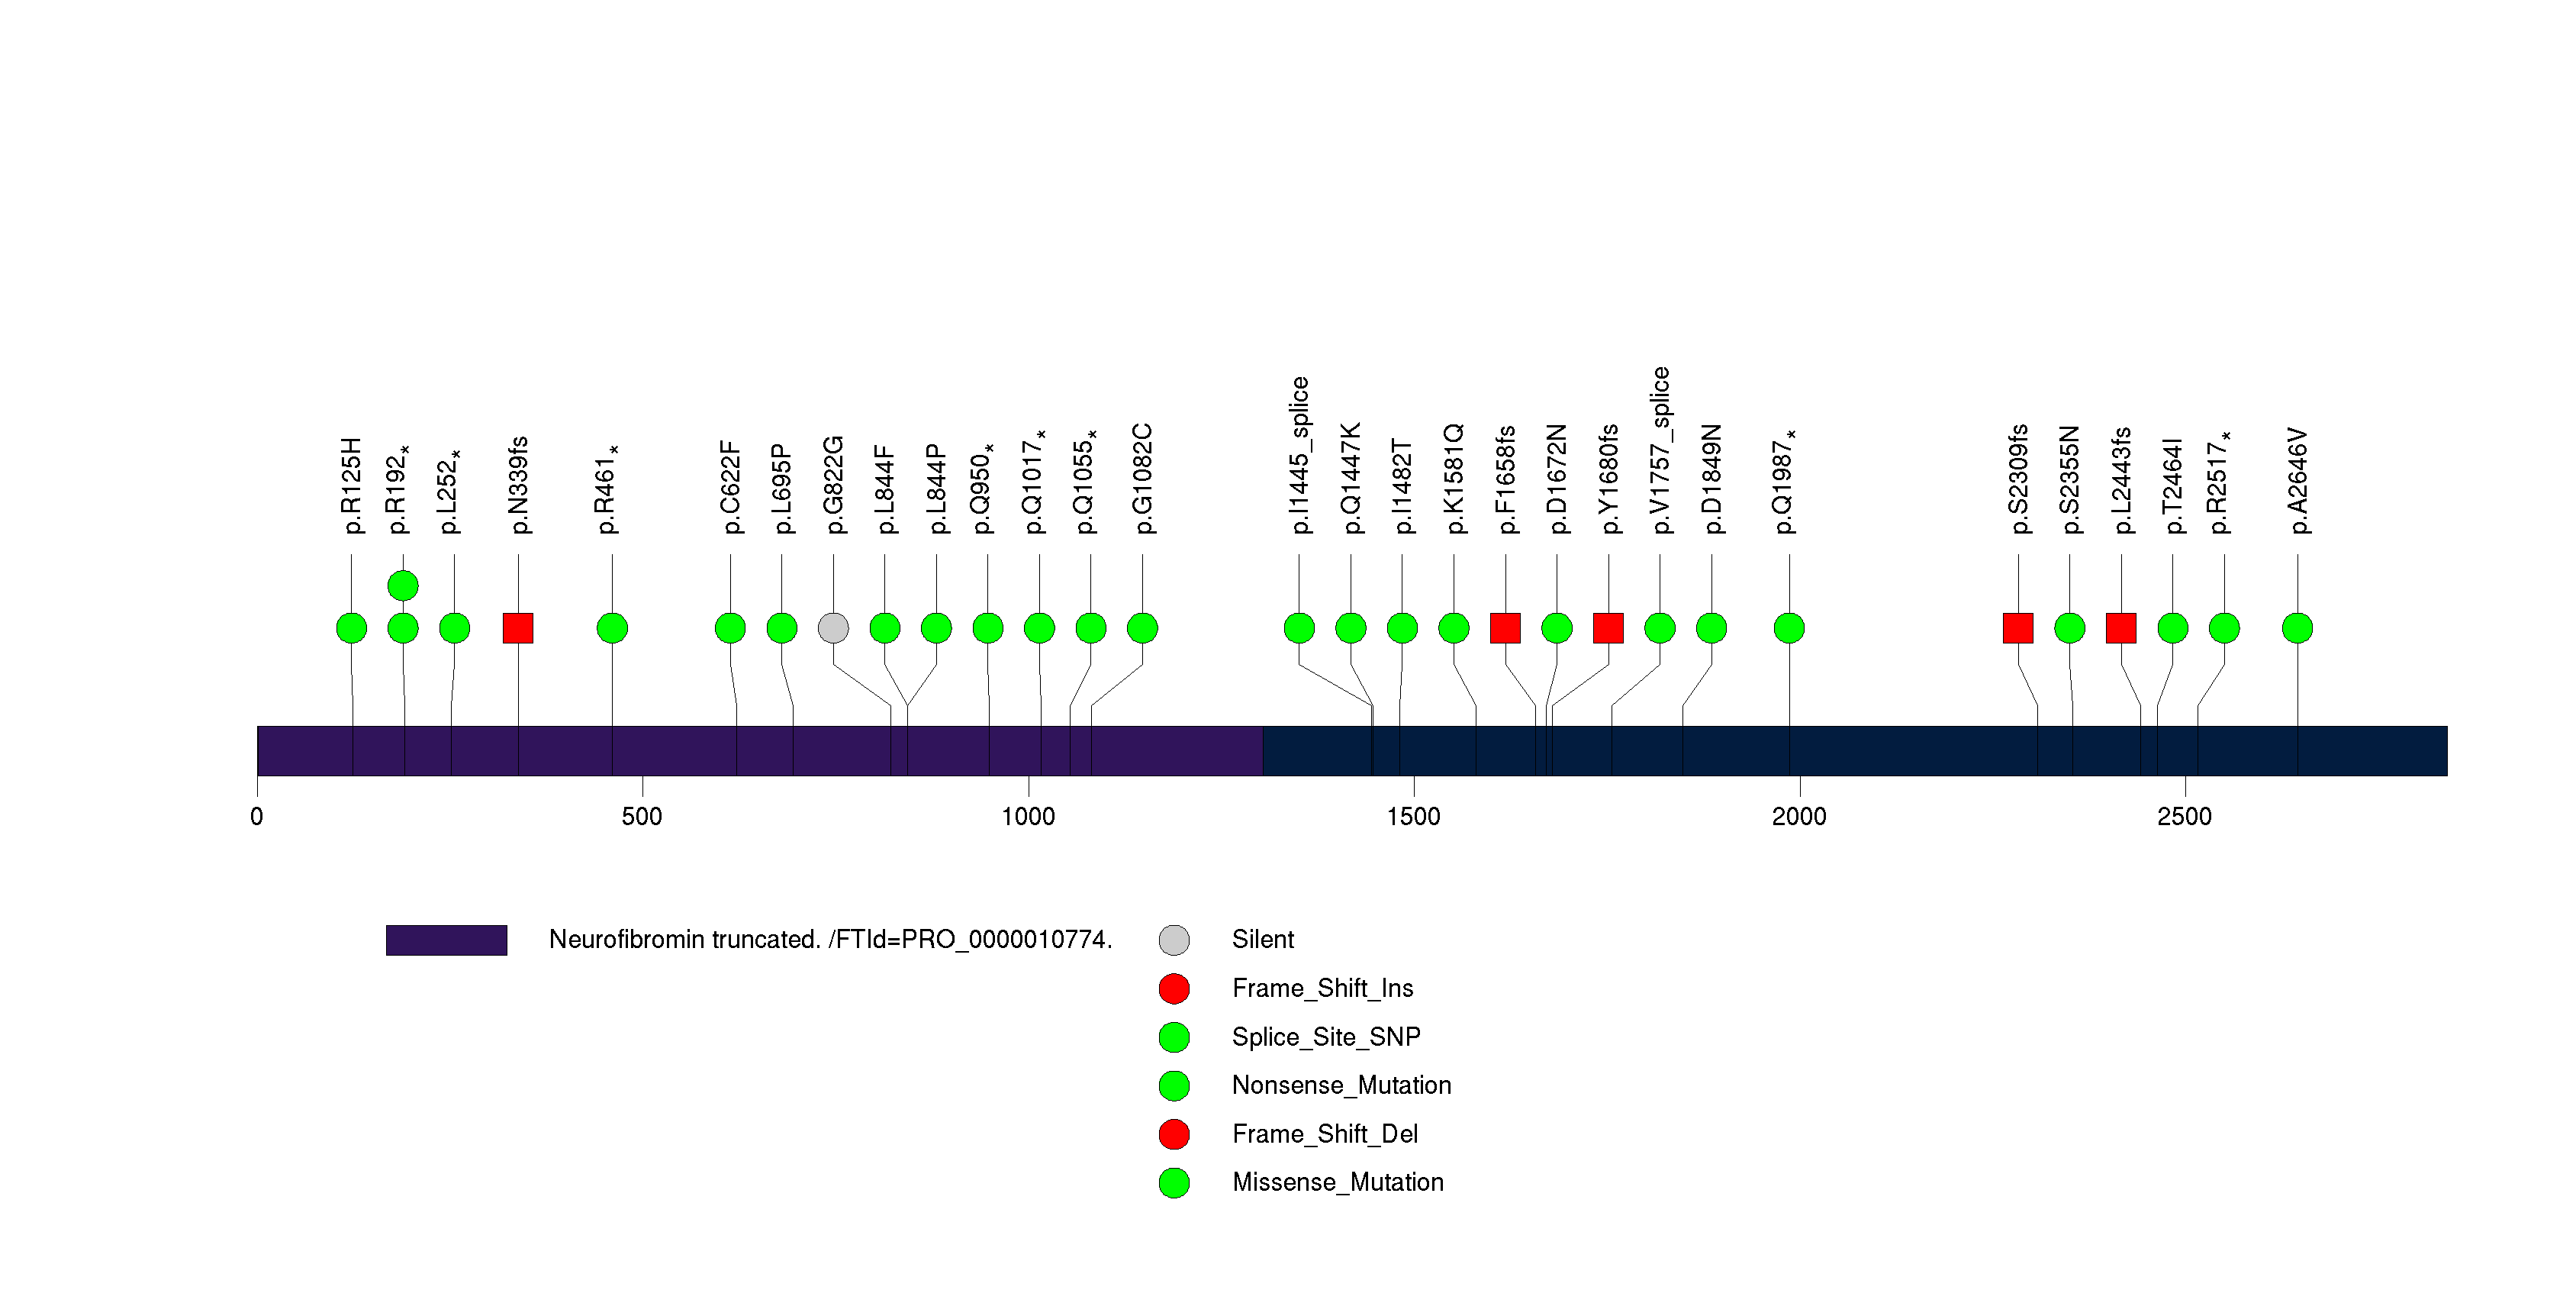
Figure S25. This figure depicts the distribution of mutations and mutation types across the COMMD4 significant gene.
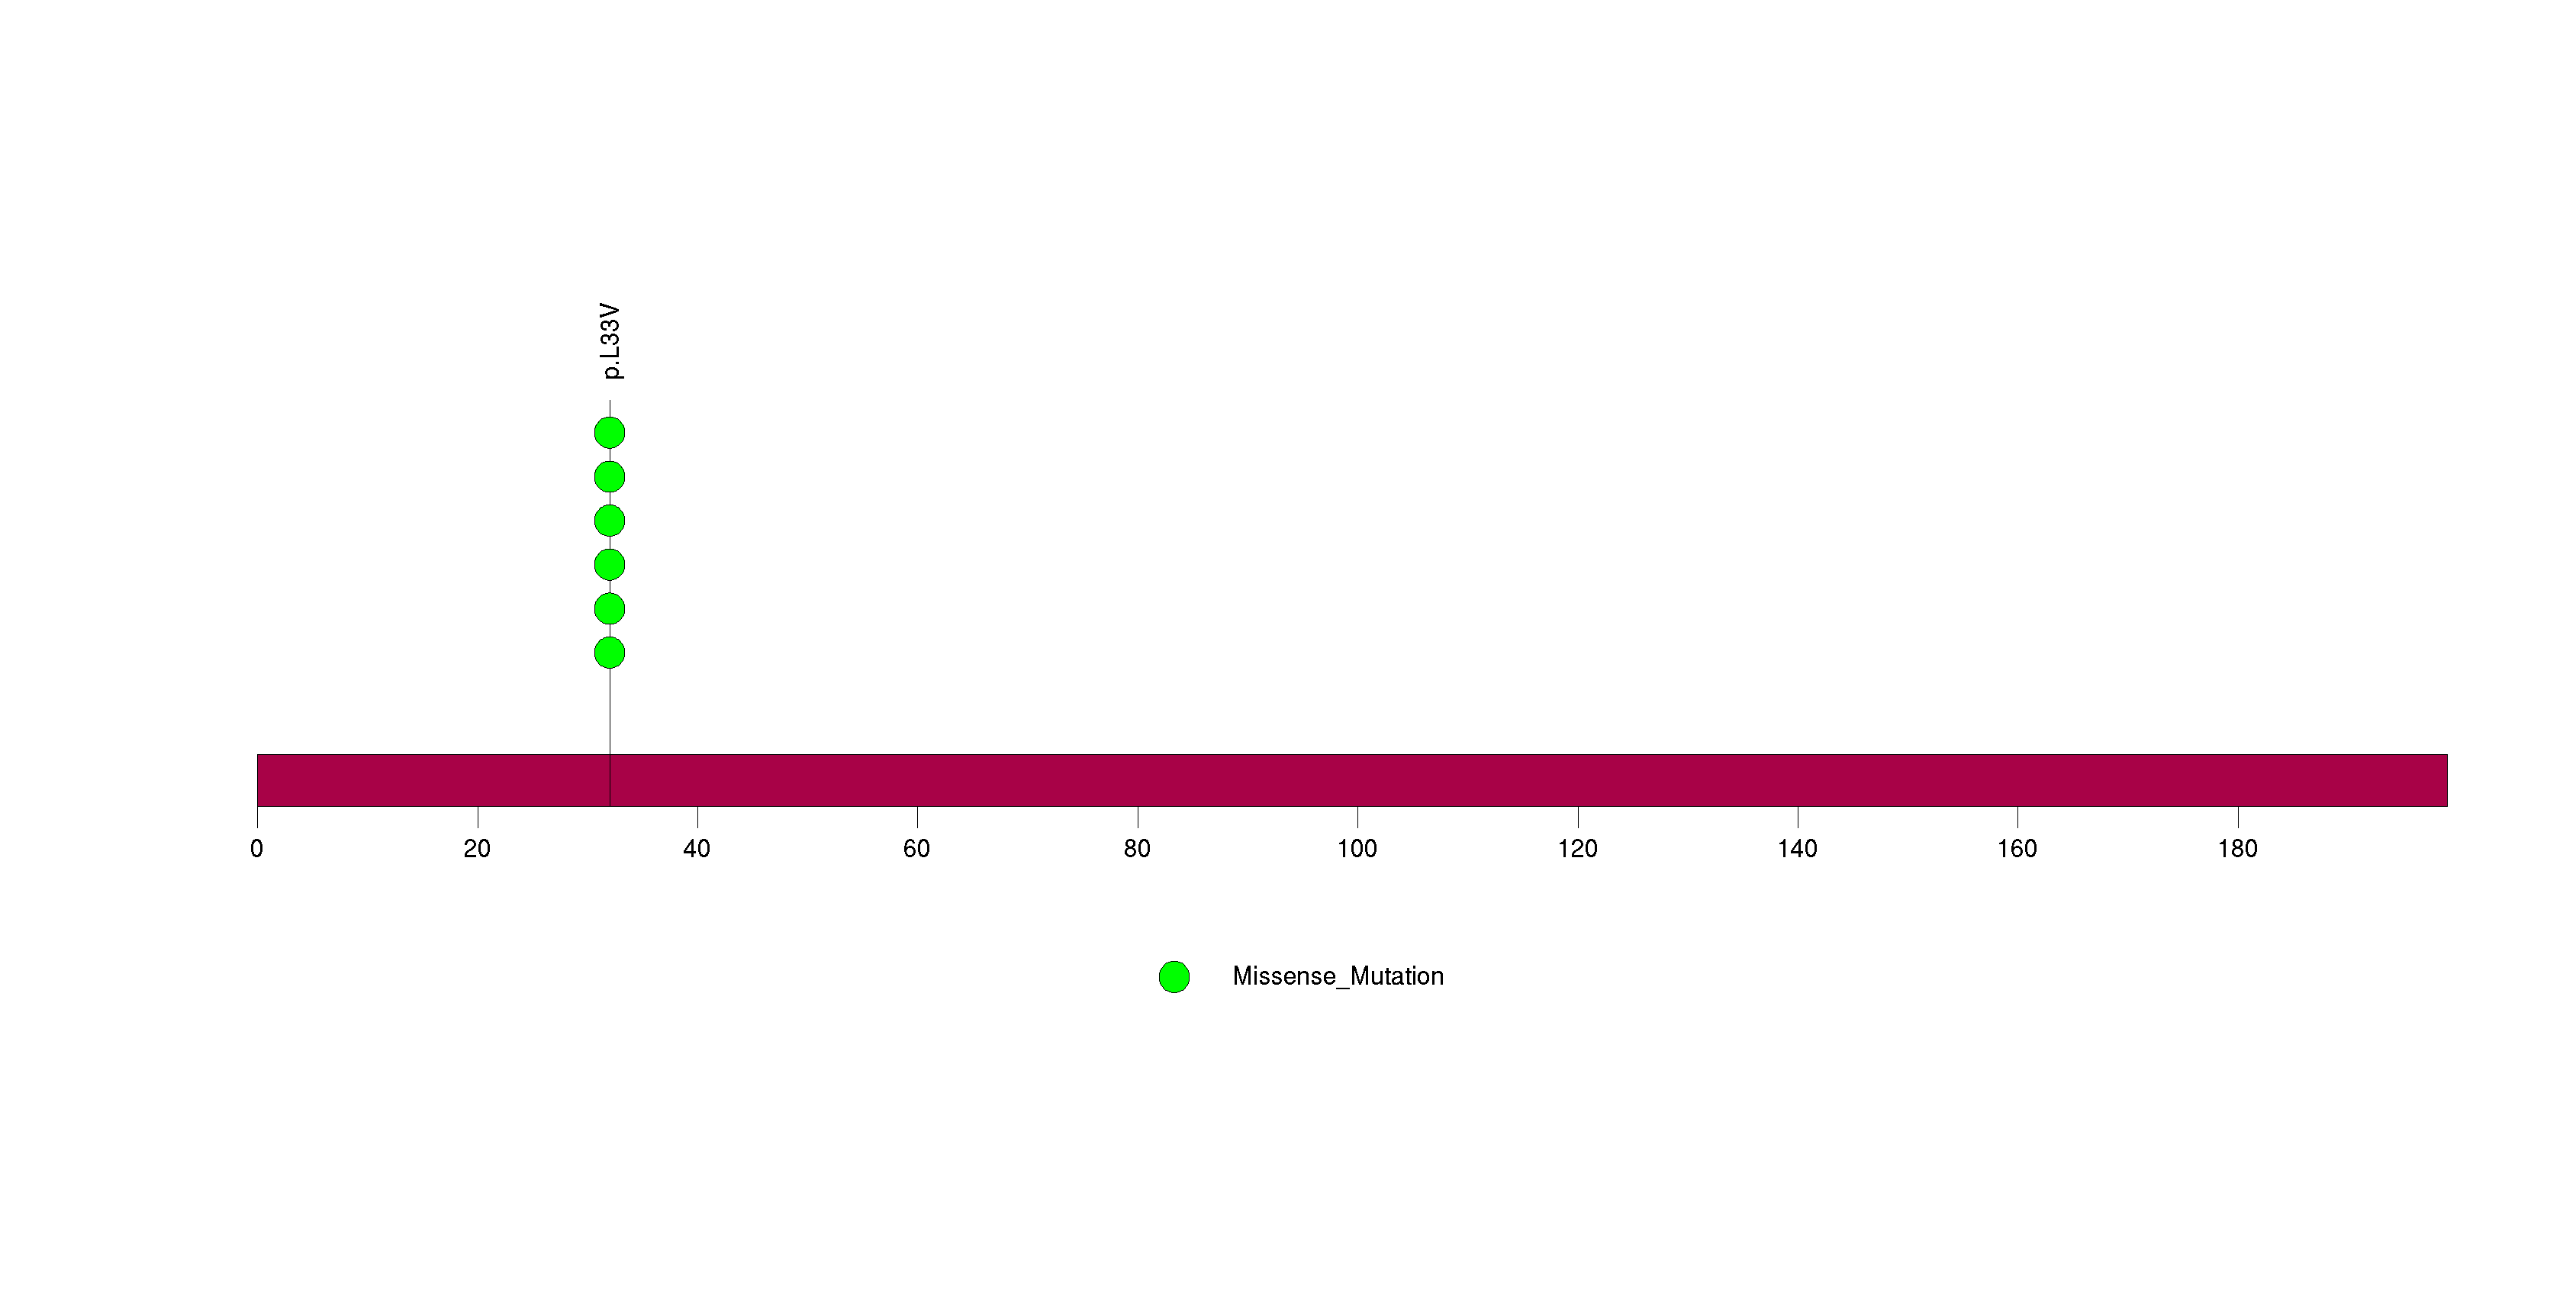
Figure S26. This figure depicts the distribution of mutations and mutation types across the RYR2 significant gene.
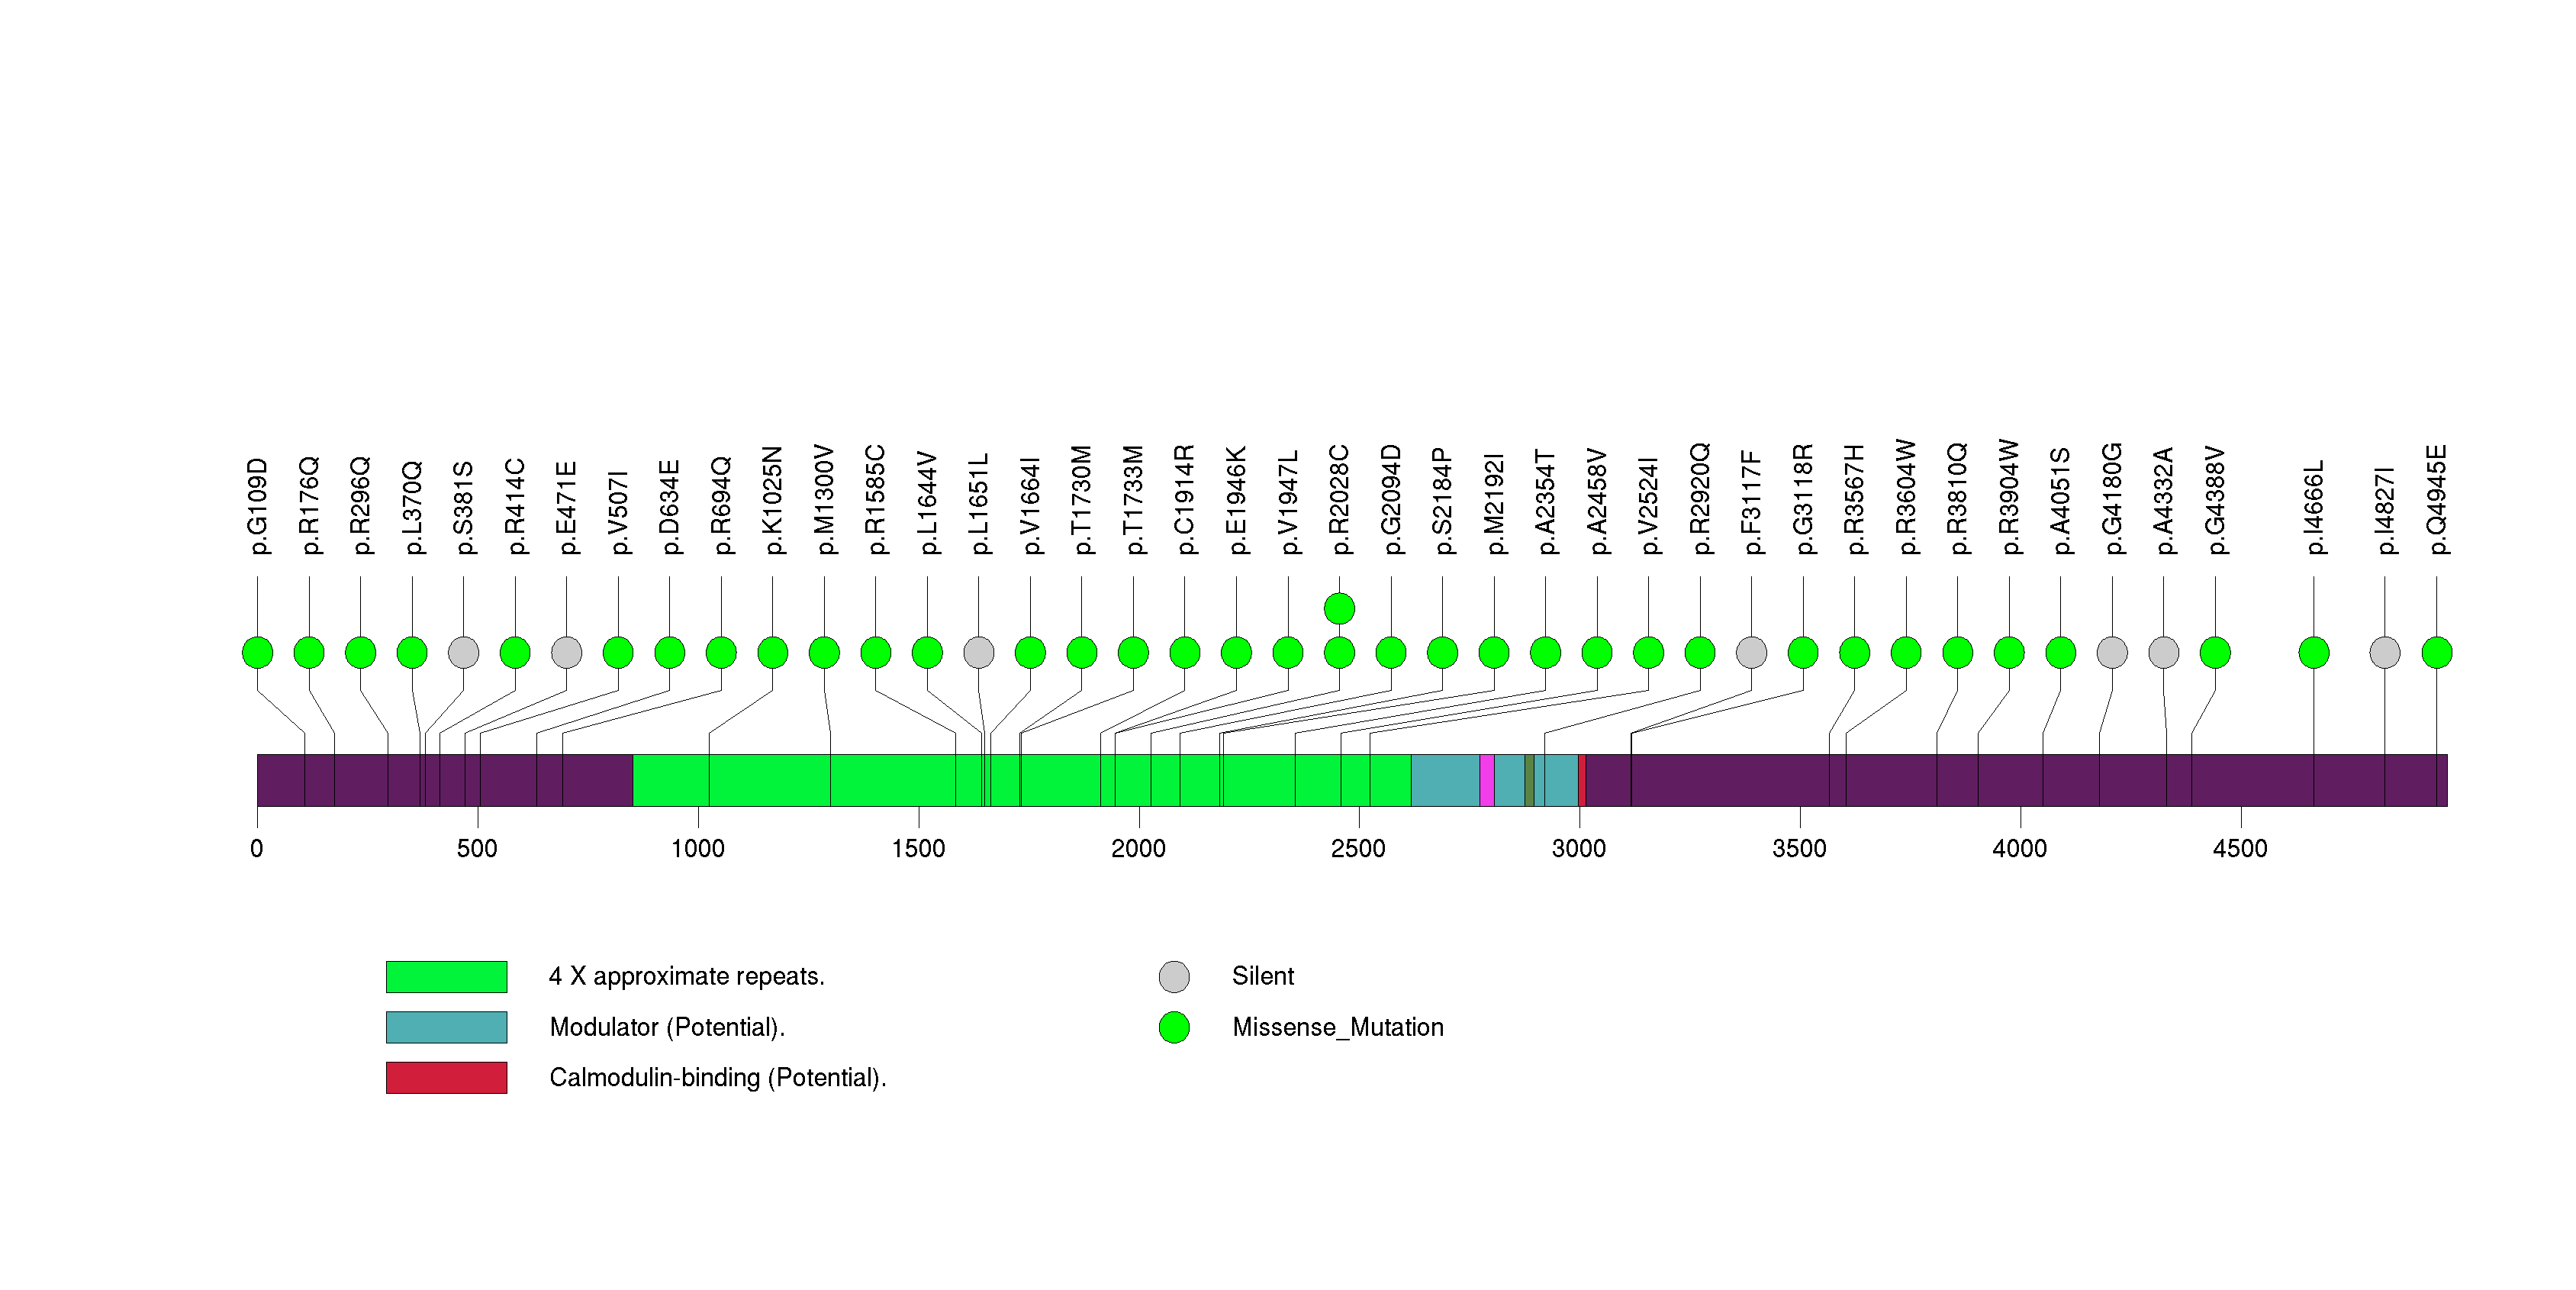
Figure S27. This figure depicts the distribution of mutations and mutation types across the PLA2G2A significant gene.
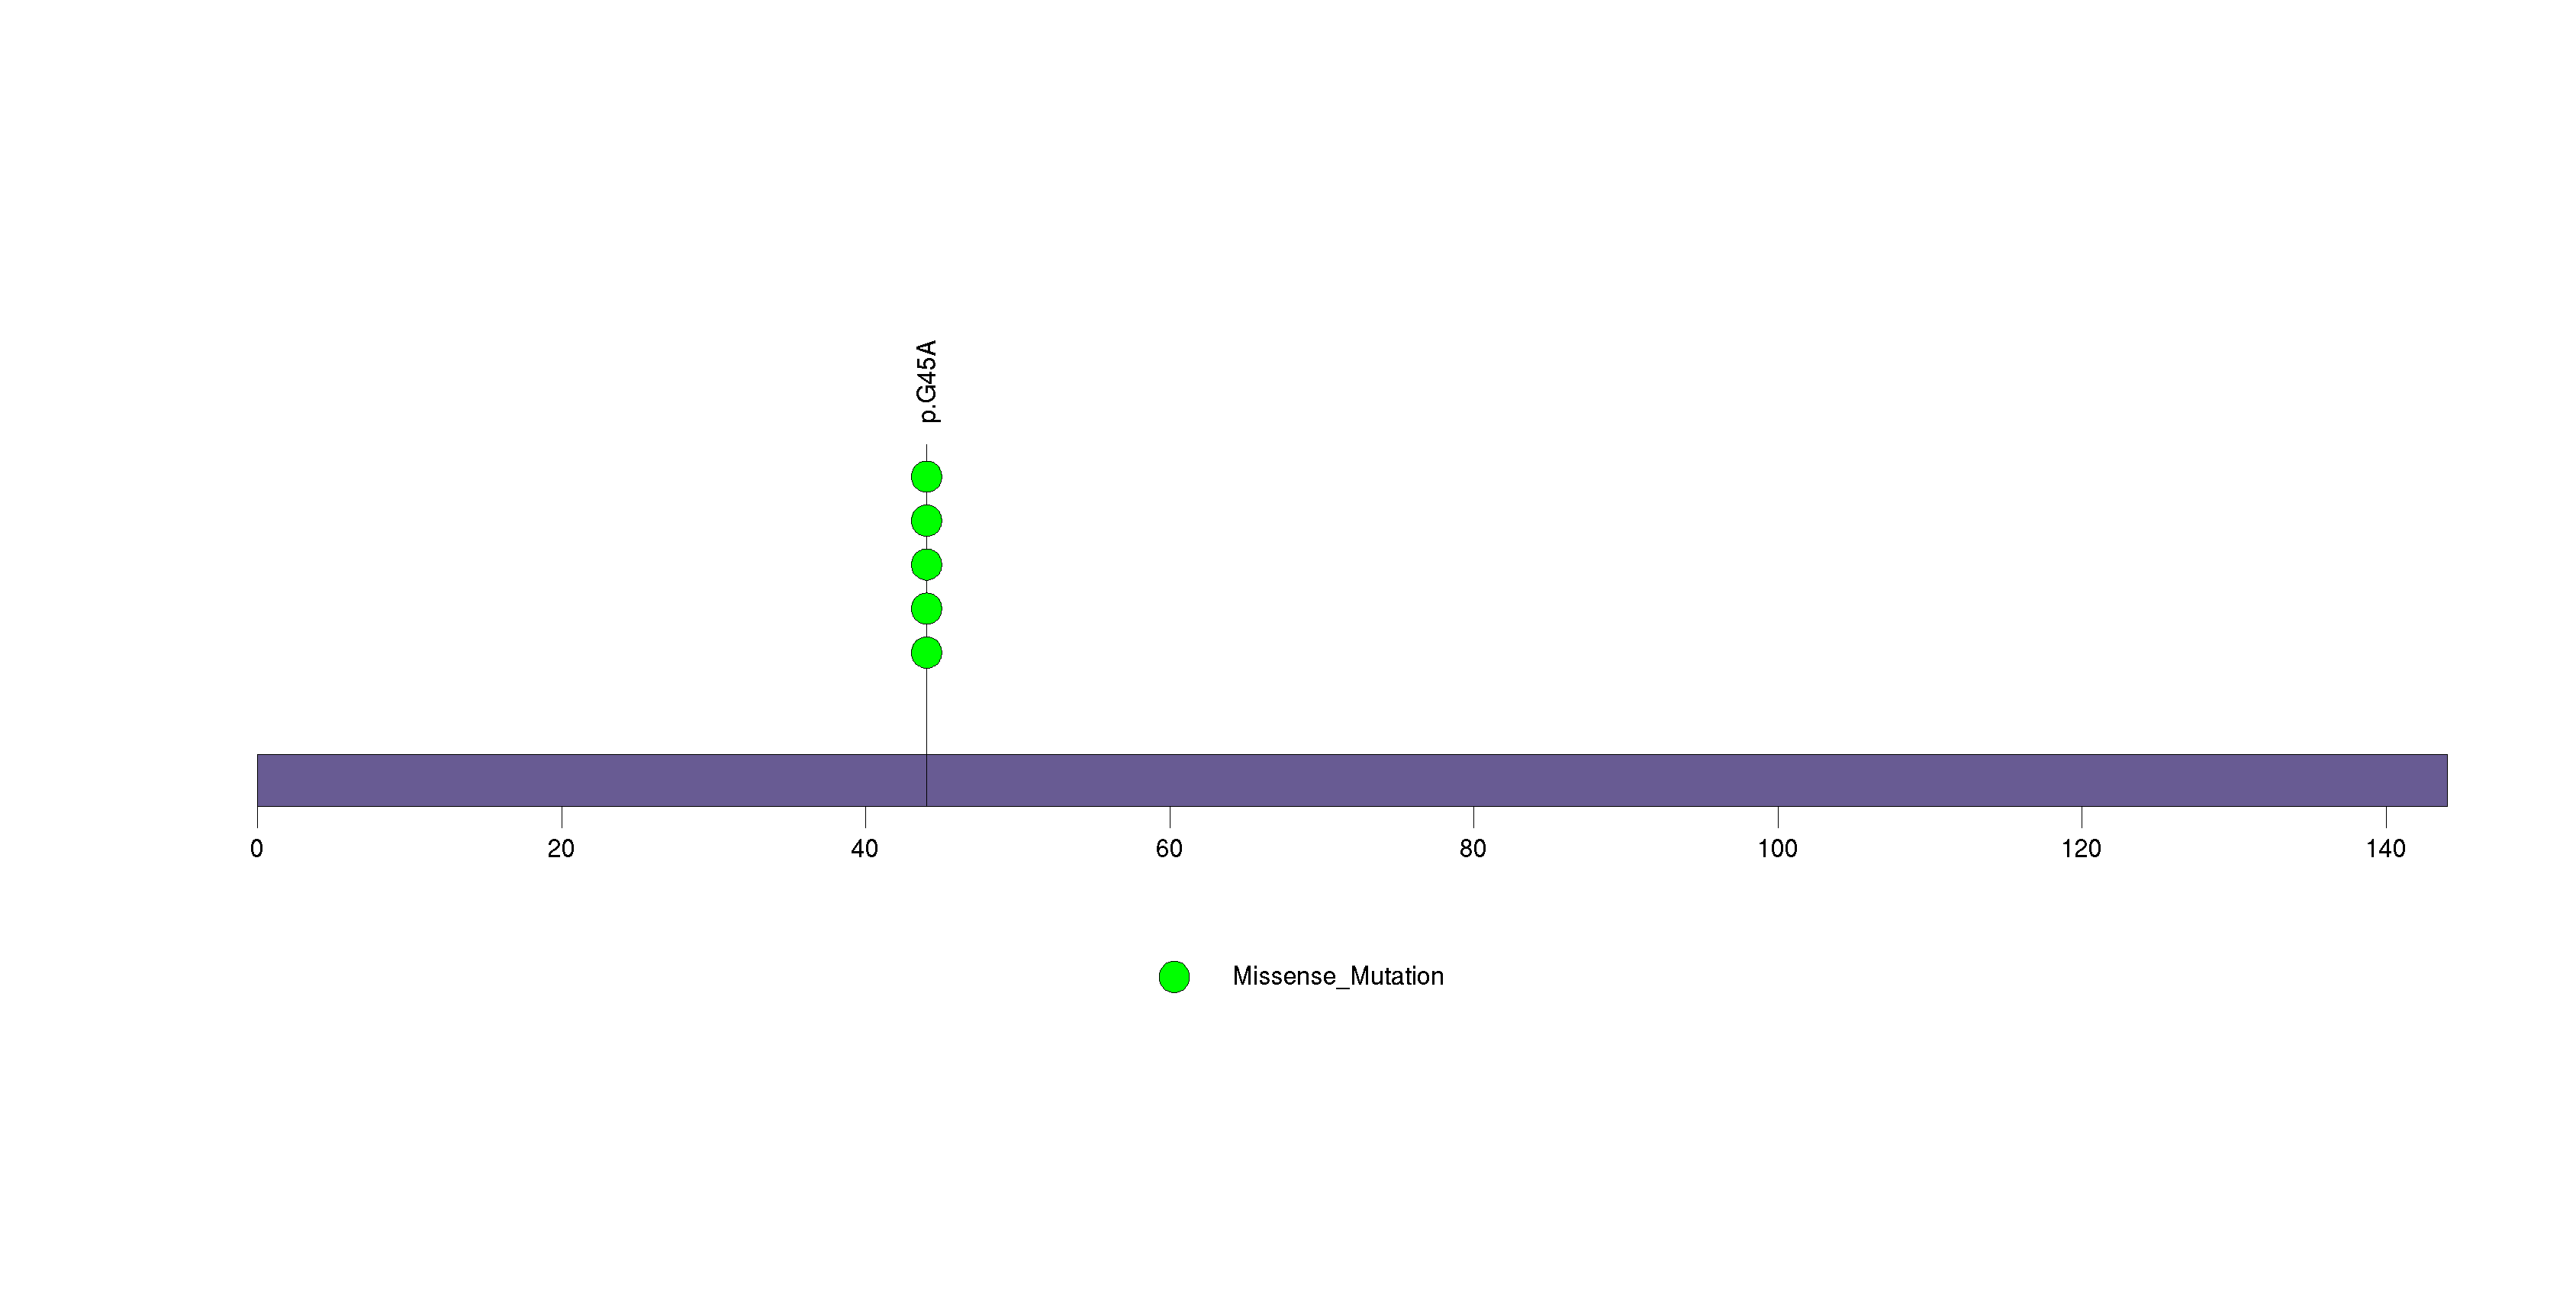
Figure S28. This figure depicts the distribution of mutations and mutation types across the NRBP2 significant gene.
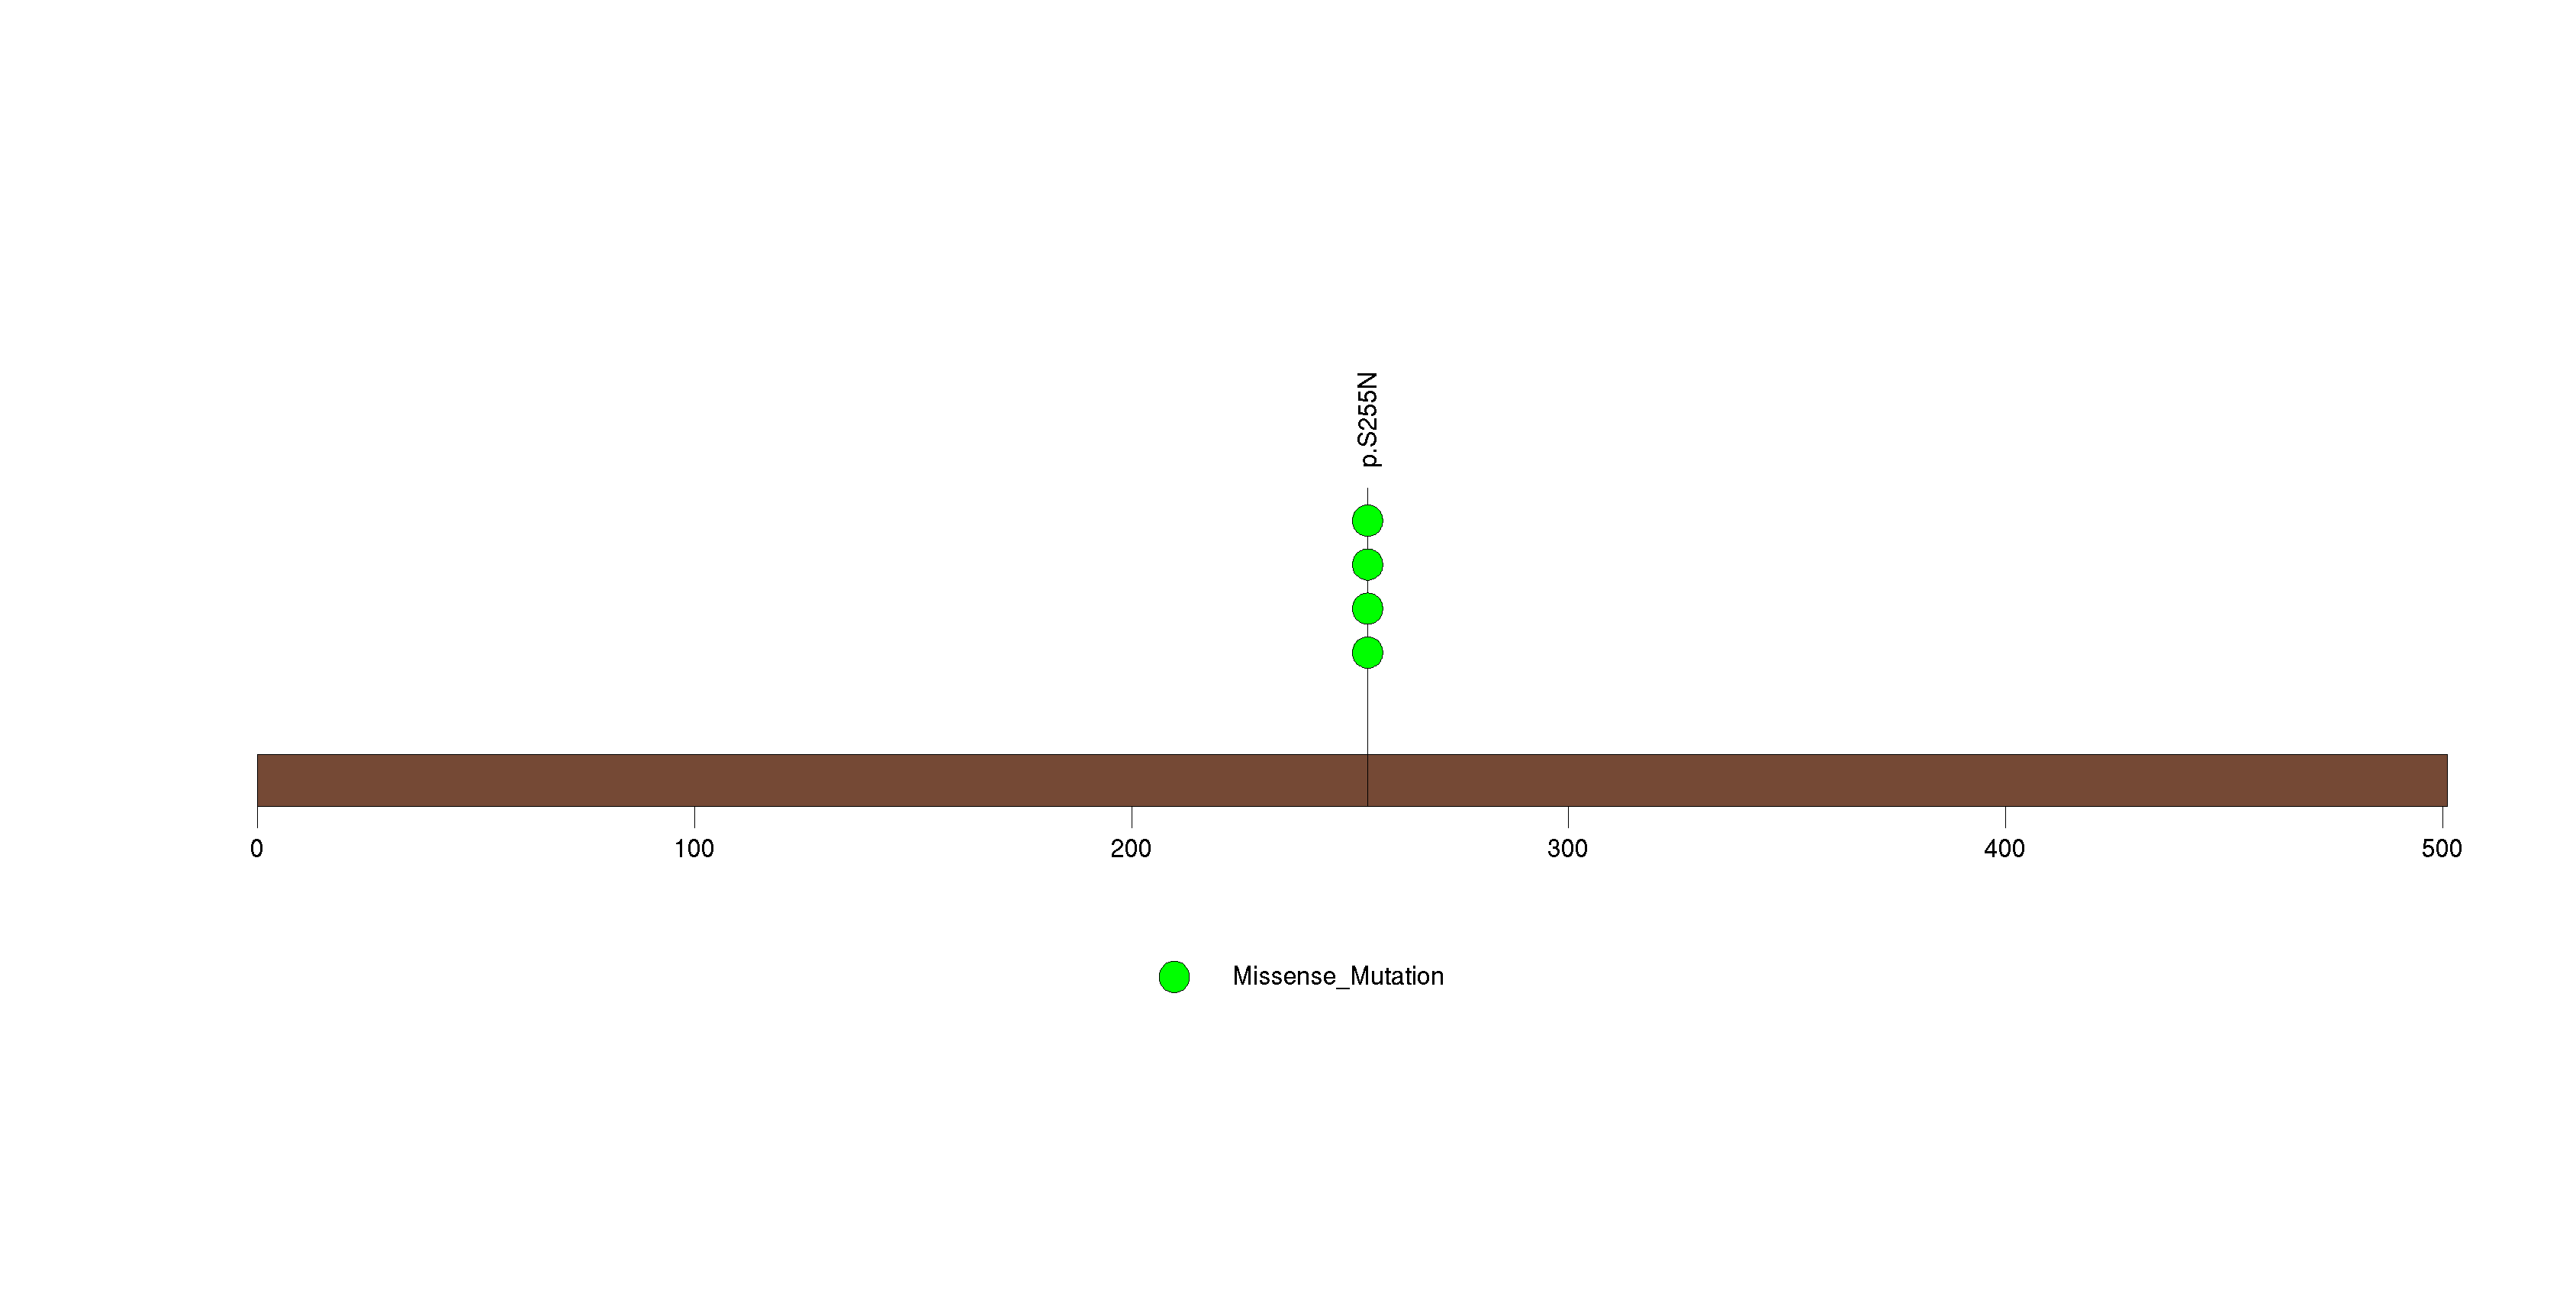
Figure S29. This figure depicts the distribution of mutations and mutation types across the FUT7 significant gene.
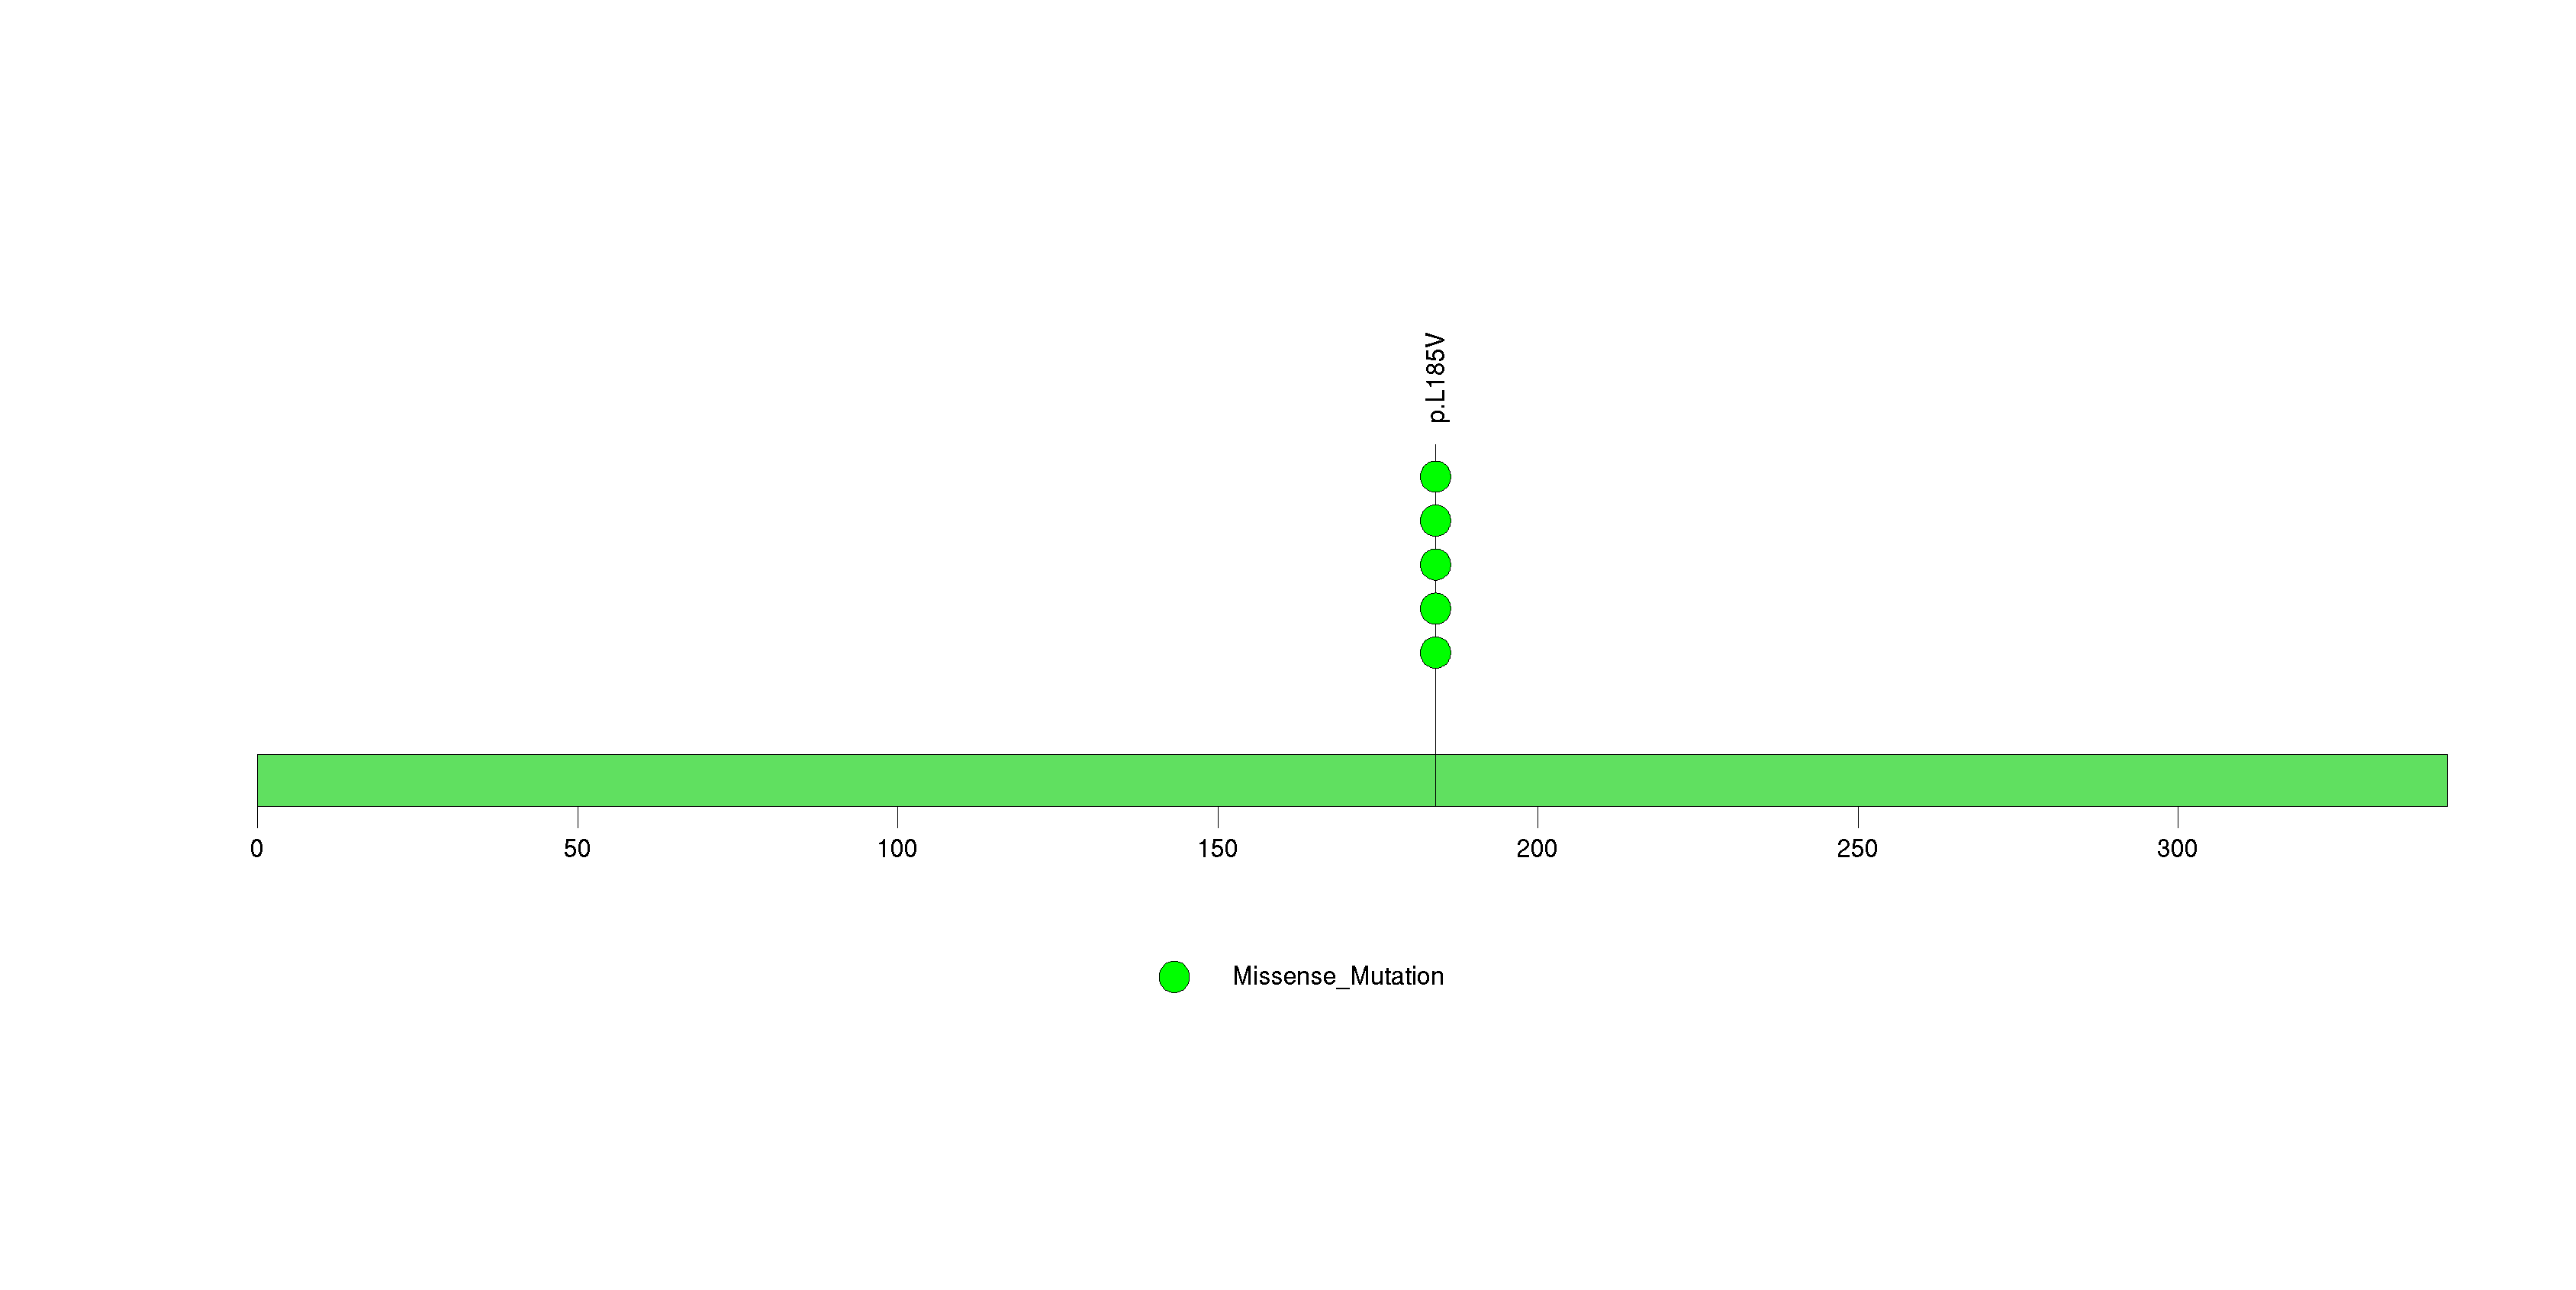
Figure S30. This figure depicts the distribution of mutations and mutation types across the FLG significant gene.
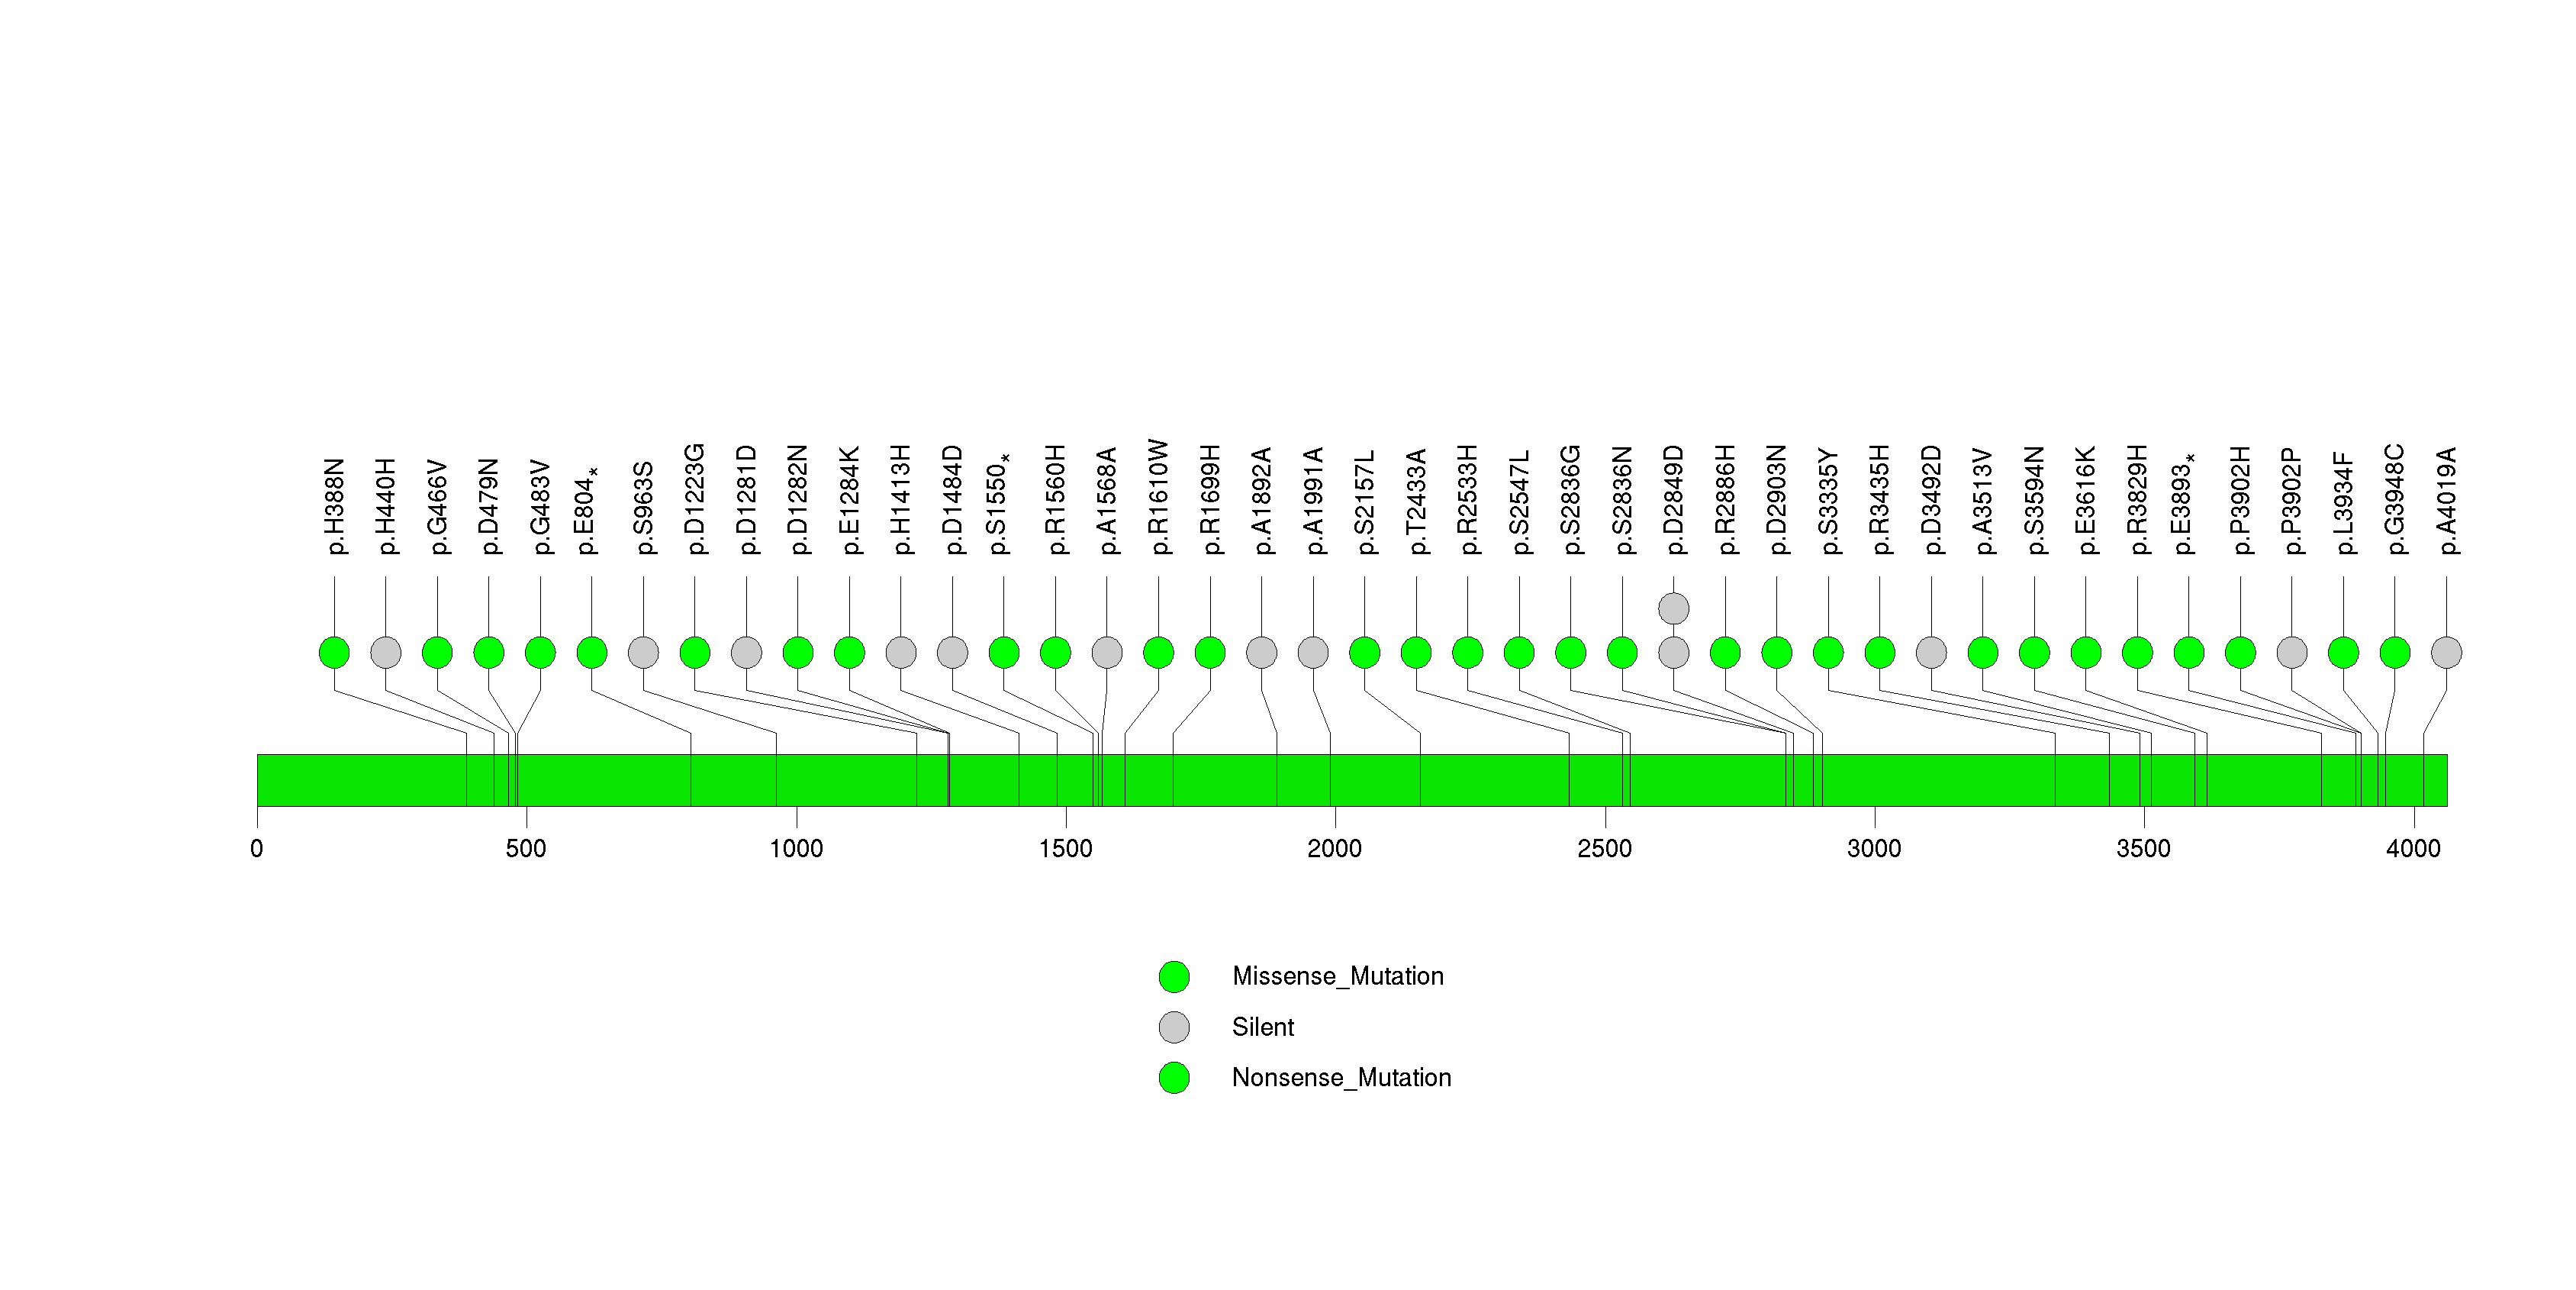
Figure S31. This figure depicts the distribution of mutations and mutation types across the HMP19 significant gene.
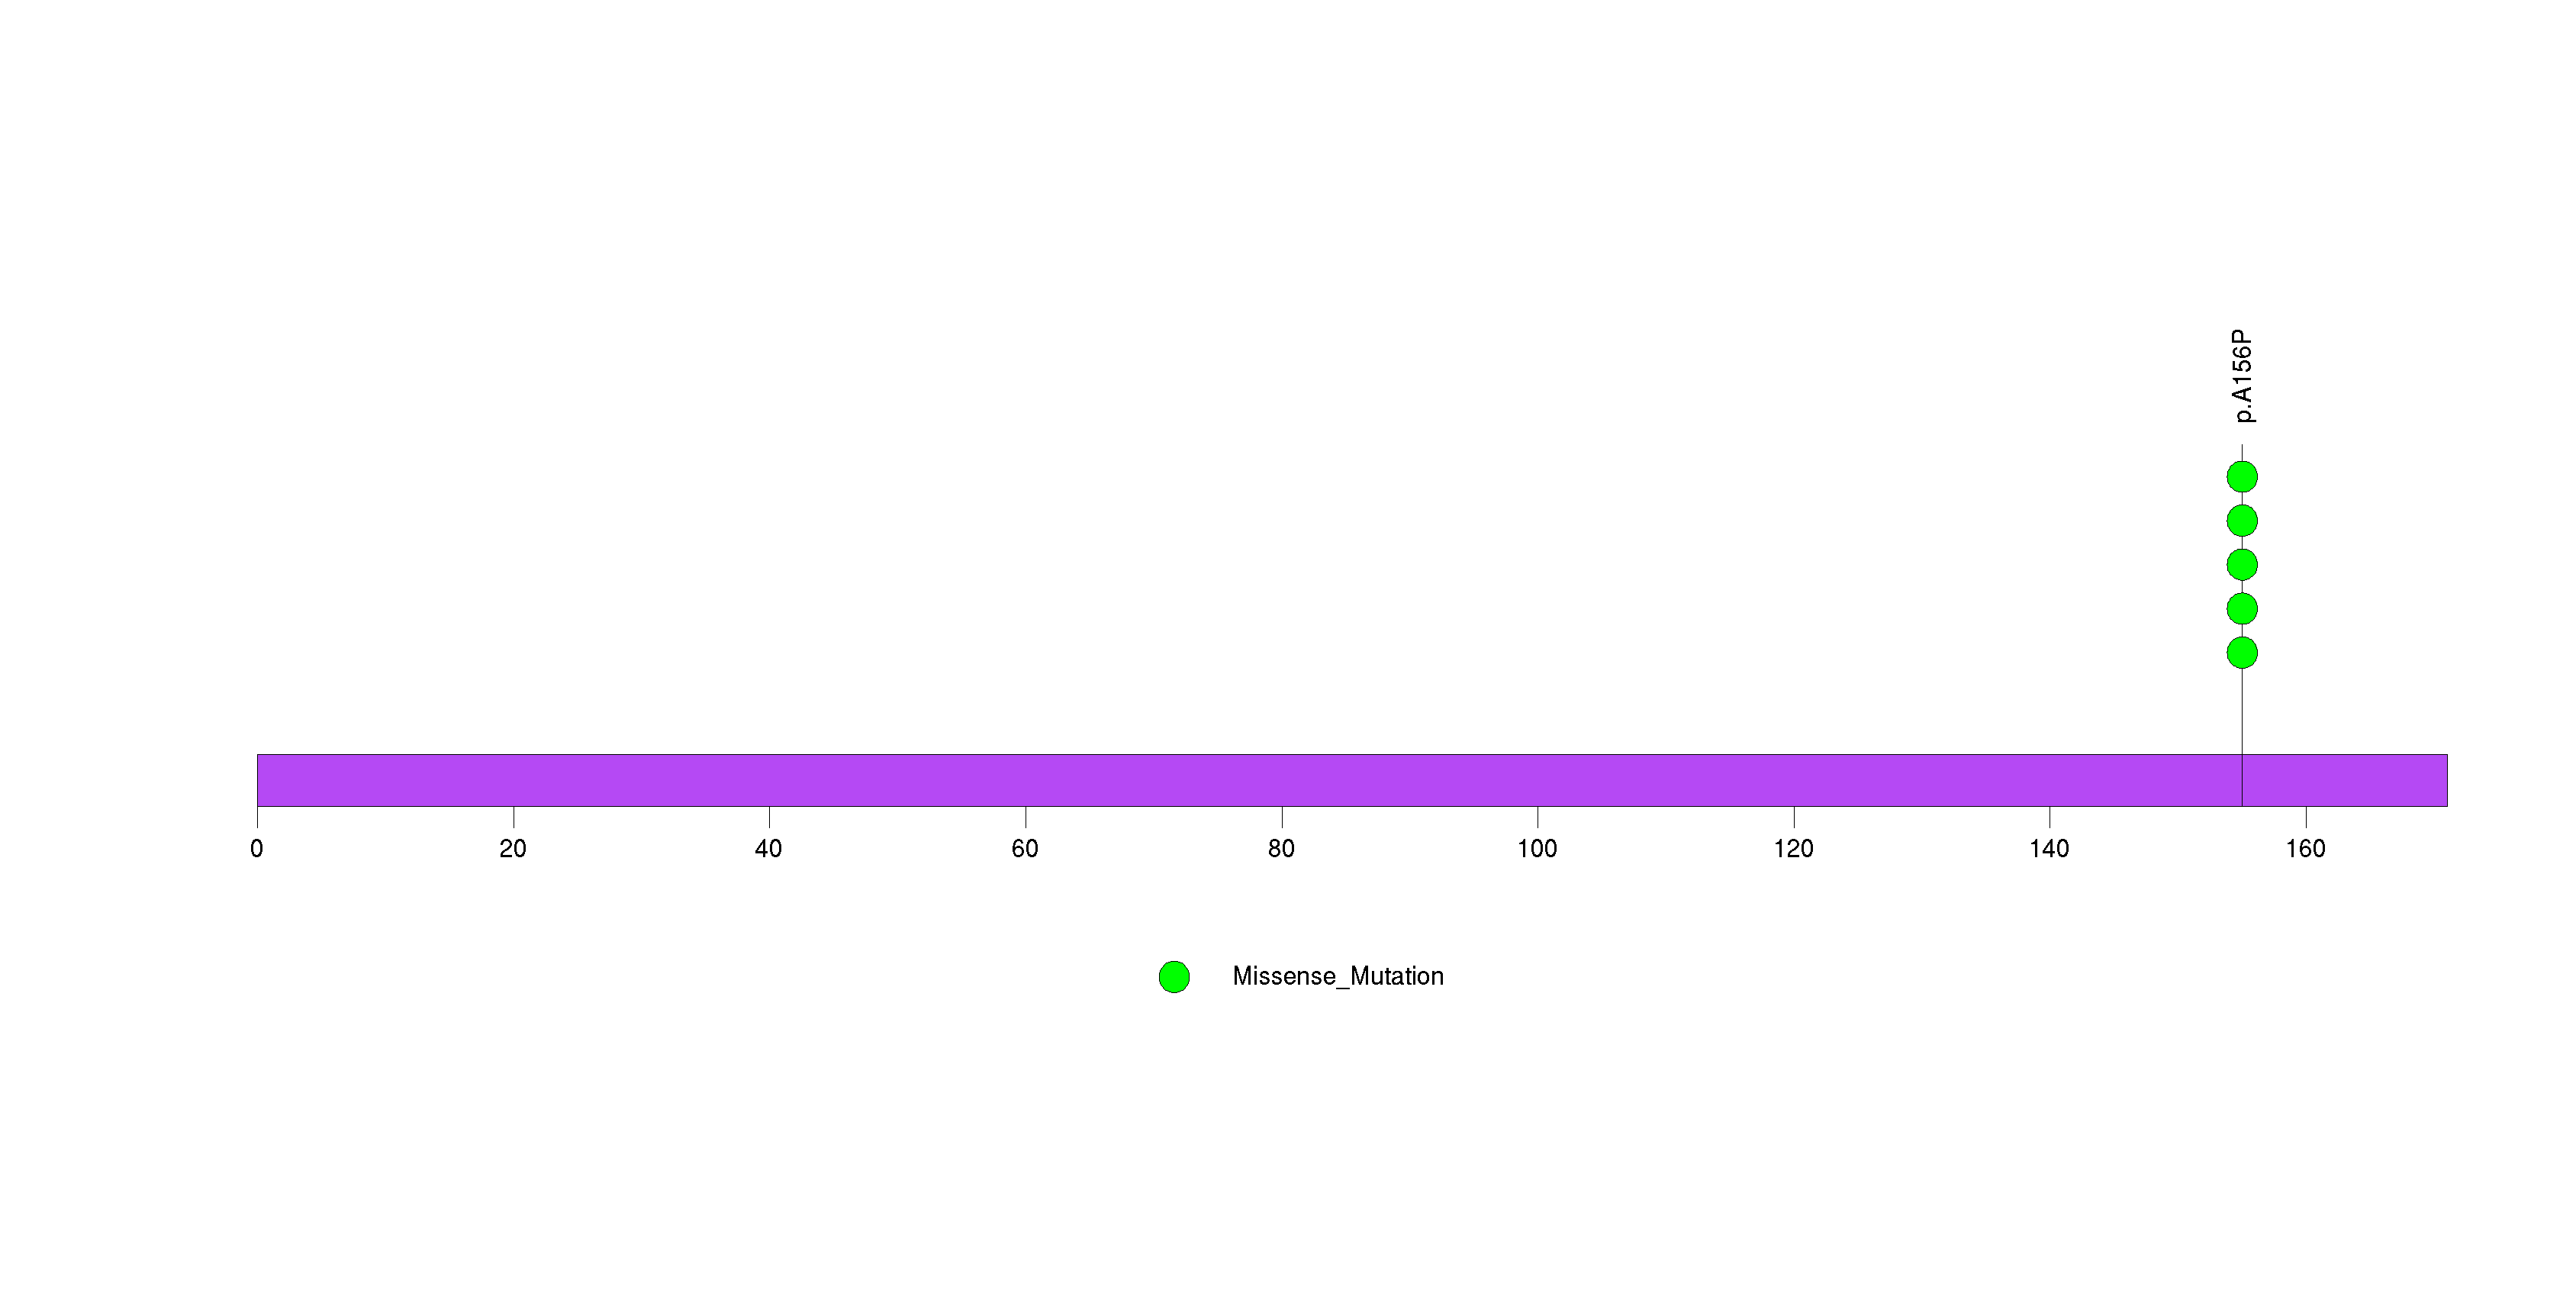
Figure S32. This figure depicts the distribution of mutations and mutation types across the DNASE1L1 significant gene.
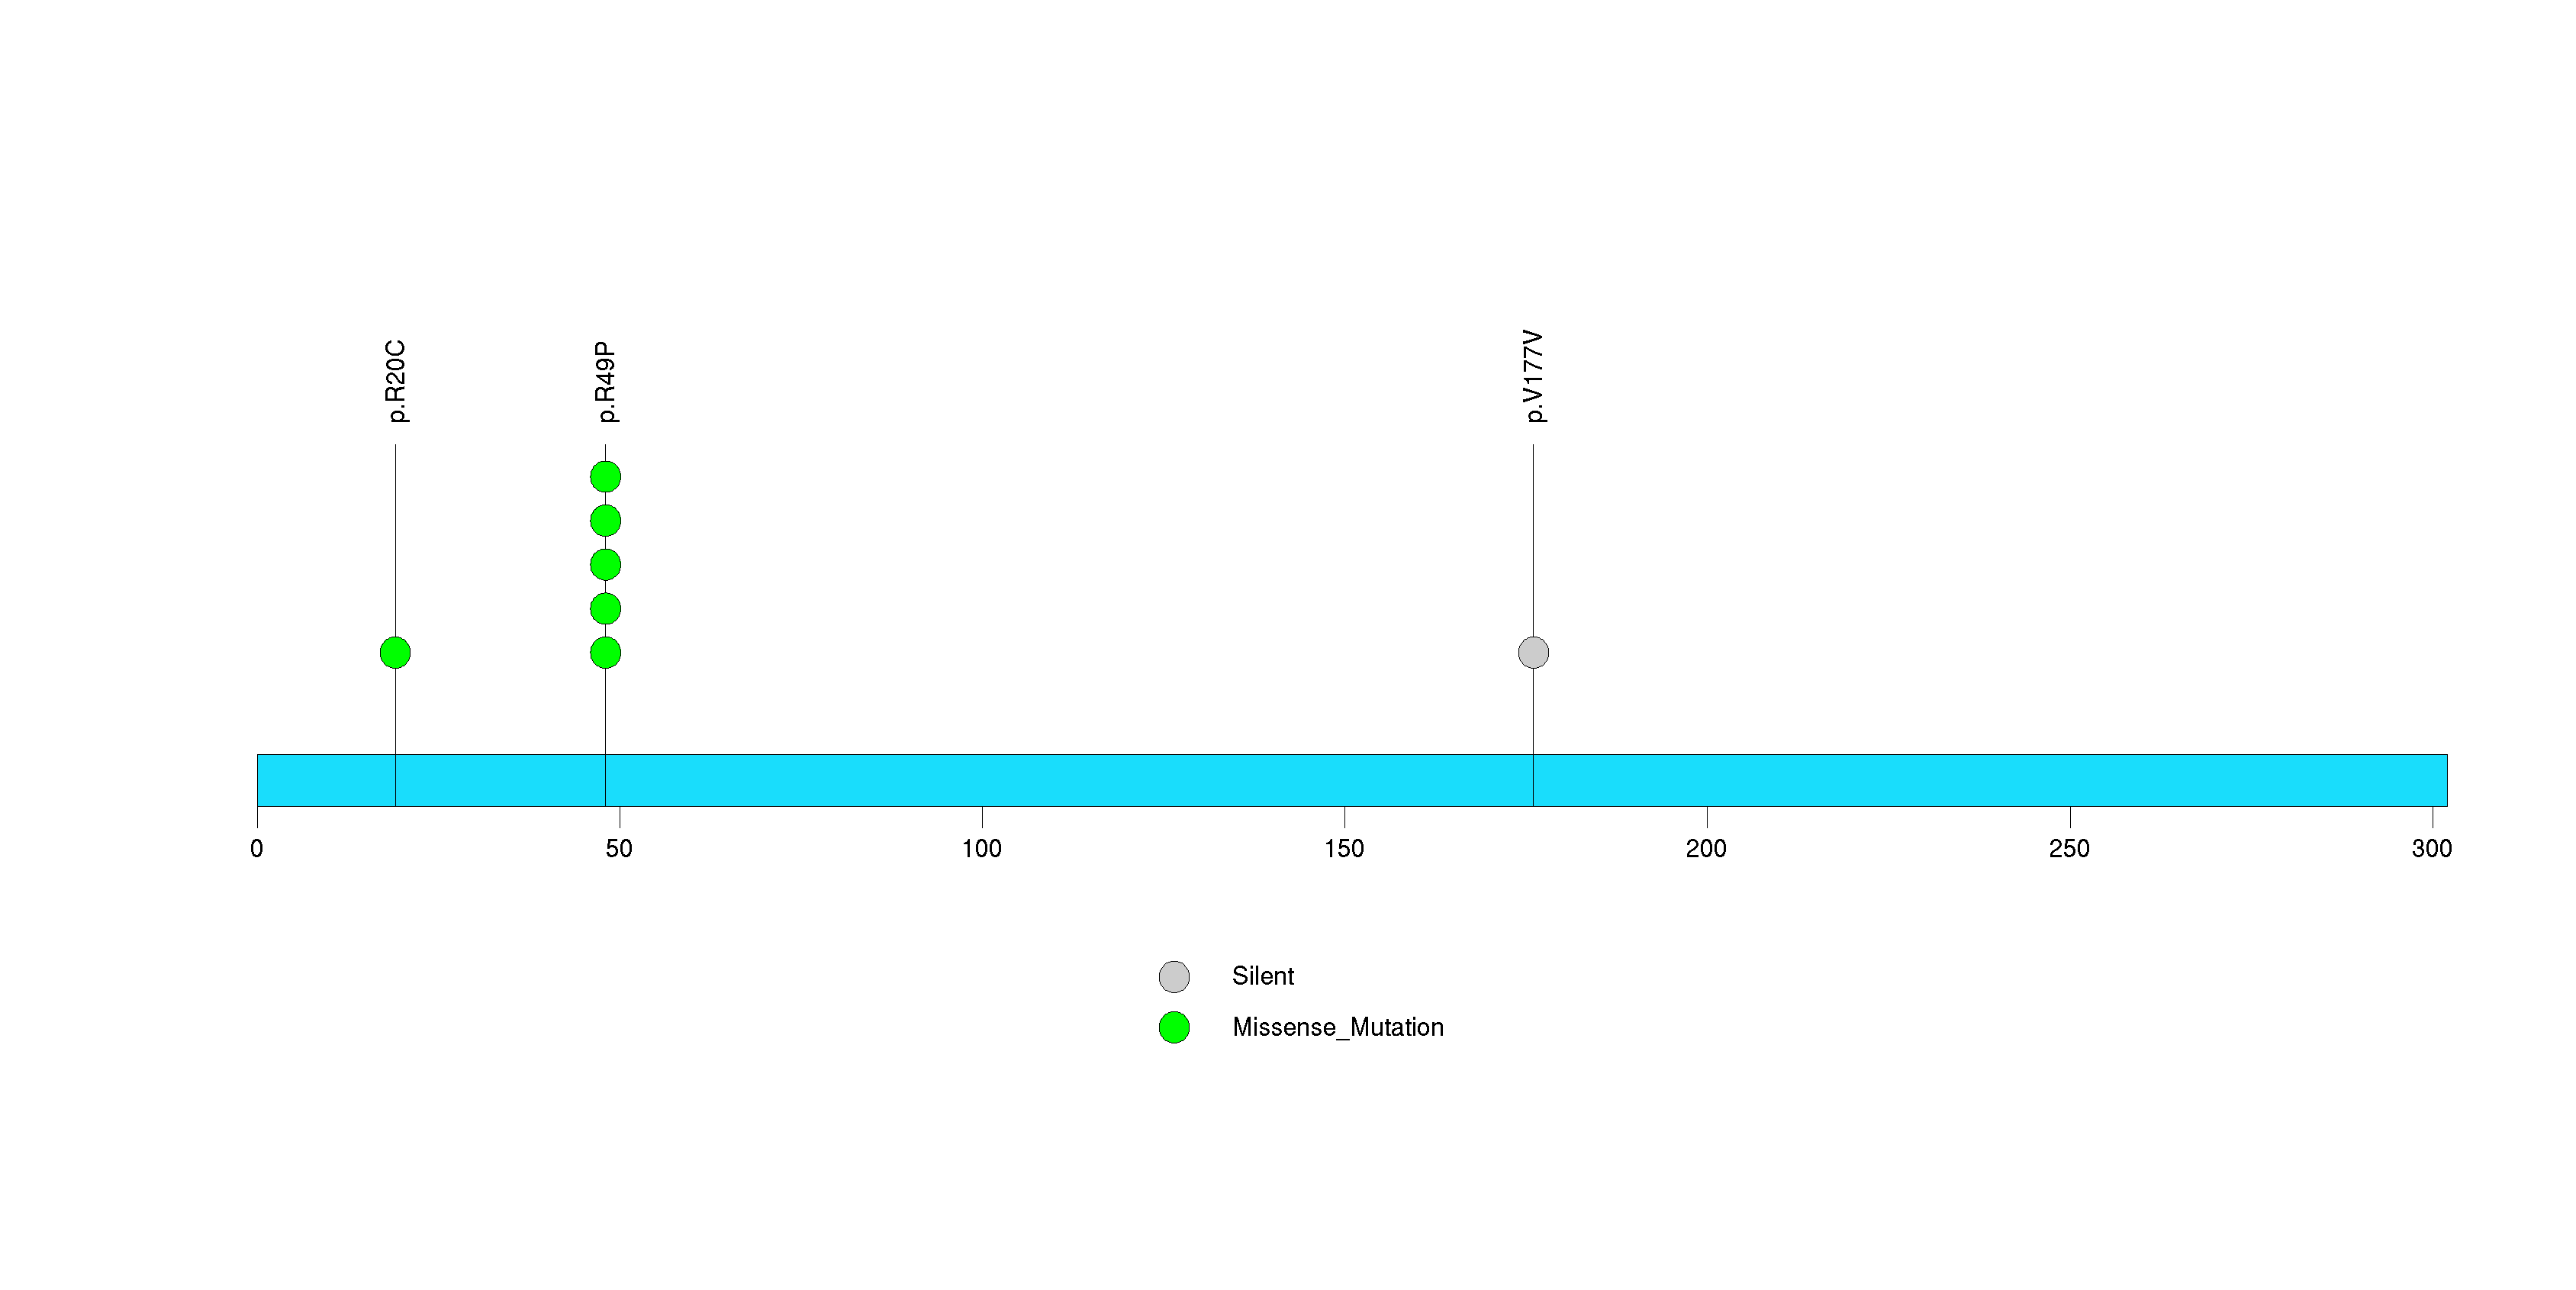
Figure S33. This figure depicts the distribution of mutations and mutation types across the KDSR significant gene.
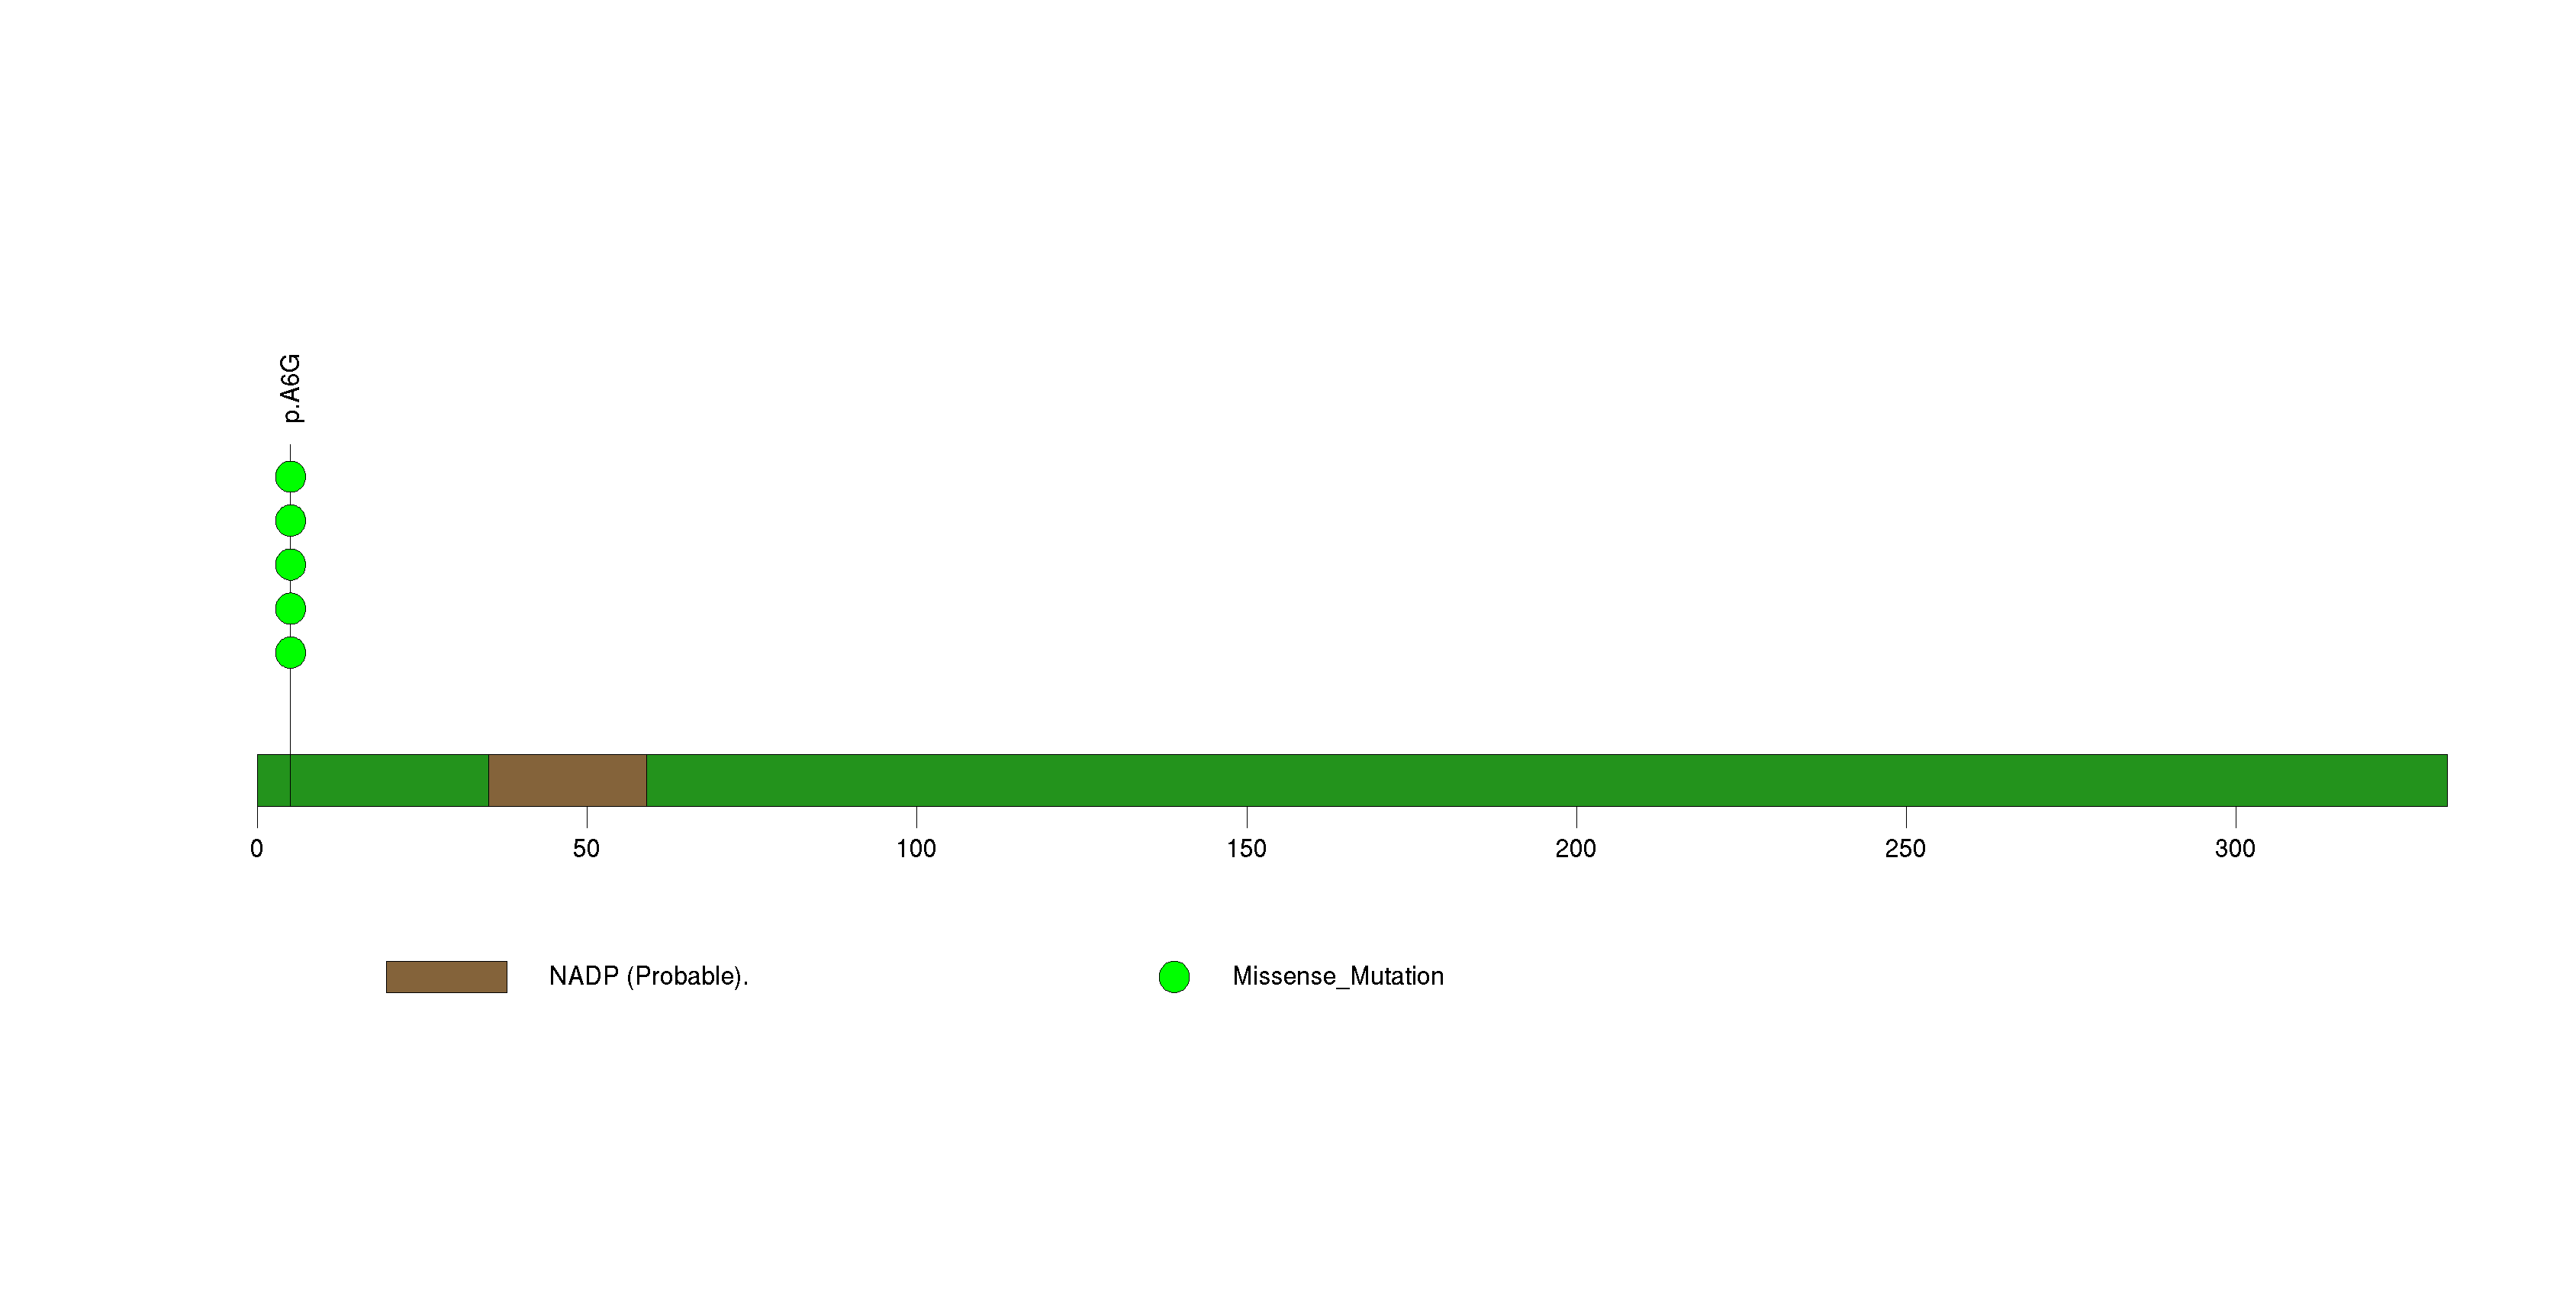
Figure S34. This figure depicts the distribution of mutations and mutation types across the TMEM45A significant gene.
In this analysis, COSMIC is used as a filter to increase power by restricting the territory of each gene. Cosmic version: v48.
Table 4. Get Full Table Significantly mutated genes (COSMIC territory only). To access the database please go to: COSMIC. Number of significant genes found: 55. Number of genes displayed: 10
| rank | gene | description | n | cos | n_cos | N_cos | cos_ev | p | q |
|---|---|---|---|---|---|---|---|---|---|
| 1 | IDH1 | isocitrate dehydrogenase 1 (NADP+), soluble | 15 | 3 | 15 | 828 | 22380 | 0 | 0 |
| 2 | PIK3R1 | phosphoinositide-3-kinase, regulatory subunit 1 (alpha) | 17 | 33 | 9 | 9108 | 20 | 0 | 0 |
| 3 | EGFR | epidermal growth factor receptor (erythroblastic leukemia viral (v-erb-b) oncogene homolog, avian) | 58 | 218 | 46 | 60168 | 640 | 0 | 0 |
| 4 | PTEN | phosphatase and tensin homolog (mutated in multiple advanced cancers 1) | 80 | 728 | 79 | 200928 | 2714 | 0 | 0 |
| 5 | TP53 | tumor protein p53 | 89 | 823 | 89 | 227148 | 26312 | 0 | 0 |
| 6 | PIK3CA | phosphoinositide-3-kinase, catalytic, alpha polypeptide | 19 | 184 | 15 | 50784 | 3911 | 0 | 0 |
| 7 | RB1 | retinoblastoma 1 (including osteosarcoma) | 21 | 267 | 11 | 73692 | 30 | 0 | 0 |
| 8 | NF1 | neurofibromin 1 (neurofibromatosis, von Recklinghausen disease, Watson disease) | 31 | 285 | 10 | 78660 | 18 | 0 | 0 |
| 9 | PTPN11 | protein tyrosine phosphatase, non-receptor type 11 (Noonan syndrome 1) | 6 | 31 | 4 | 8556 | 16 | 3.6e-08 | 0.000018 |
| 10 | BRAF | v-raf murine sarcoma viral oncogene homolog B1 | 6 | 88 | 5 | 24288 | 42058 | 3.9e-08 | 0.000018 |
Note:
n - number of (nonsilent) mutations in this gene across the individual set.
cos = number of unique mutated sites in this gene in COSMIC
n_cos = overlap between n and cos.
N_cos = number of individuals times cos.
cos_ev = total evidence: number of reports in COSMIC for mutations seen in this gene.
p = p-value for seeing the observed amount of overlap in this gene)
q = q-value, False Discovery Rate (Benjamini-Hochberg procedure)
Table 5. Get Full Table Genes with Clustered Mutations
| num | gene | desc | n | mindist | nmuts0 | nmuts3 | nmuts12 | npairs0 | npairs3 | npairs12 |
|---|---|---|---|---|---|---|---|---|---|---|
| 2969 | EGFR | epidermal growth factor receptor (erythroblastic leukemia viral (v-erb-b) oncogene homolog, avian) | 58 | 0 | 158 | 172 | 199 | 158 | 172 | 199 |
| 4509 | IDH1 | isocitrate dehydrogenase 1 (NADP+), soluble | 15 | 0 | 105 | 105 | 105 | 105 | 105 | 105 |
| 10131 | TP53 | tumor protein p53 | 89 | 0 | 69 | 161 | 418 | 69 | 161 | 418 |
| 3613 | FOXRED1 | FAD-dependent oxidoreductase domain containing 1 | 9 | 0 | 36 | 36 | 36 | 36 | 36 | 36 |
| 7921 | PTEN | phosphatase and tensin homolog (mutated in multiple advanced cancers 1) | 80 | 0 | 25 | 74 | 157 | 25 | 74 | 157 |
| 5448 | LPHN1 | latrophilin 1 | 10 | 0 | 16 | 16 | 18 | 16 | 16 | 18 |
| 879 | BBS1 | Bardet-Biedl syndrome 1 | 8 | 0 | 15 | 15 | 15 | 15 | 15 | 15 |
| 2208 | COL5A3 | collagen, type V, alpha 3 | 11 | 0 | 15 | 15 | 15 | 15 | 15 | 15 |
| 2221 | COMMD4 | COMM domain containing 4 | 6 | 0 | 15 | 15 | 15 | 15 | 15 | 15 |
| 2851 | DSCAM | Down syndrome cell adhesion molecule | 10 | 0 | 15 | 15 | 15 | 15 | 15 | 15 |
Note:
n - number of mutations in this gene in the individual set.
mindist - distance (in aa) between closest pair of mutations in this gene
npairs3 - how many pairs of mutations are within 3 aa of each other.
npairs12 - how many pairs of mutations are within 12 aa of each other.
Table 6. Get Full Table A Ranked List of Significantly Mutated Genesets. (Source: MSigDB GSEA Cannonical Pathway Set).Number of significant genesets found: 164. Number of genesets displayed: 10
| rank | geneset | description | genes | N_genes | mut_tally | N | n | npat | nsite | nsil | n1 | n2 | n3 | n4 | n5 | n6 | p | q |
|---|---|---|---|---|---|---|---|---|---|---|---|---|---|---|---|---|---|---|
| 1 | HSA04010_MAPK_SIGNALING_PATHWAY | Genes involved in MAPK signaling pathway | ACVR1B, ACVR1C, AKT1, AKT2, AKT3, ARRB1, ARRB2, ATF2, ATF4, BDNF, BRAF, CACNA1A, CACNA1B, CACNA1C, CACNA1D, CACNA1E, CACNA1F, CACNA1G, CACNA1H, CACNA1I, CACNA1S, CACNA2D1, CACNA2D2, CACNA2D3, CACNA2D4, CACNB1, CACNB2, CACNB3, CACNB4, CACNG1, CACNG2, CACNG3, CACNG4, CACNG5, CACNG6, CACNG7, CACNG8, CASP3, CD14, CDC25B, CDC42, CHP, CHUK, CRK, CRKL, DAXX, DDIT3, DUSP1, DUSP10, DUSP14, DUSP16, DUSP2, DUSP3, DUSP4, DUSP5, DUSP6, DUSP7, DUSP8, DUSP9, ECSIT, EGF, EGFR, ELK1, ELK4, EVI1, FAS, FASLG, FGF1, FGF10, FGF11, FGF12, FGF13, FGF14, FGF16, FGF17, FGF18, FGF19, FGF2, FGF20, FGF21, FGF22, FGF23, FGF3, FGF4, FGF5, FGF6, FGF7, FGF8, FGF9, FGFR1, FGFR2, FGFR3, FGFR4, FLNA, FLNB, FLNC, FOS, GADD45A, GADD45B, GADD45G, GNA12, GNG12, GRB2, HRAS, IKBKB, IKBKG, IL1A, IL1B, IL1R1, IL1R2, JUN, JUND, KRAS, LOC653852, MAP2K1, MAP2K1IP1, MAP2K2, MAP2K3, MAP2K4, MAP2K5, MAP2K6, MAP2K7, MAP3K1, MAP3K10, MAP3K12, MAP3K13, MAP3K14, MAP3K2, MAP3K3, MAP3K4, MAP3K5, MAP3K6, MAP3K7, MAP3K7IP1, MAP3K7IP2, MAP3K8, MAP4K1, MAP4K2, MAP4K3, MAP4K4, MAPK1, MAPK10, MAPK11, MAPK12, MAPK13, MAPK14, MAPK3, MAPK7, MAPK8, MAPK8IP1, MAPK8IP2, MAPK8IP3, MAPK9, MAPKAPK2, MAPKAPK3, MAPKAPK5, MAPT, MAX, MEF2C, MKNK1, MKNK2, MOS, MRAS, MYC, NF1, NFATC2, NFATC4, NFKB1, NFKB2, NGFB, NLK, NR4A1, NRAS, NTF3, NTF5, NTRK1, NTRK2, PAK1, PAK2, PDGFA, PDGFB, PDGFRA, PDGFRB, PLA2G10, PLA2G12A, PLA2G12B, PLA2G1B, PLA2G2A, PLA2G2D, PLA2G2E, PLA2G2F, PLA2G3, PLA2G4A, PLA2G5, PLA2G6, PPM1A, PPM1B, PPP3CA, PPP3CB, PPP3CC, PPP3R1, PPP3R2, PPP5C, PRKACA, PRKACB, PRKACG, PRKCA, PRKCB1, PRKCG, PRKX, PRKY, PTPN5, PTPN7, PTPRR, RAC1, RAC2, RAC3, RAF1, RAP1A, RAP1B, RAPGEF2, RASA1, RASA2, RASGRF1, RASGRF2, RASGRP1, RASGRP2, RASGRP3, RASGRP4, RPS6KA1, RPS6KA2, RPS6KA3, RPS6KA4, RPS6KA5, RPS6KA6, RRAS, RRAS2, SOS1, SOS2, SRF, STK3, STK4, STMN1, TAOK1, TAOK2, TAOK3, TGFB1, TGFB2, TGFB3, TGFBR1, TGFBR2, TNF, TNFRSF1A, TP53, TRAF2, TRAF6, ZAK | 246 | ACVR1C(2), AKT1(1), AKT2(1), AKT3(1), ATF2(1), ATF4(1), BDNF(1), BRAF(6), CACNA1A(4), CACNA1B(7), CACNA1C(5), CACNA1D(9), CACNA1E(9), CACNA1F(10), CACNA1G(6), CACNA1H(9), CACNA1I(5), CACNA1S(12), CACNA2D1(8), CACNA2D2(1), CACNA2D3(3), CACNA2D4(1), CACNB2(1), CACNB3(1), CACNG1(1), CACNG2(1), CACNG3(4), CACNG6(1), CACNG7(1), CACNG8(1), CD14(2), CDC25B(1), CHUK(4), DAXX(4), DDIT3(1), DUSP10(1), DUSP14(1), DUSP16(1), DUSP2(2), DUSP4(3), DUSP8(1), DUSP9(1), EGF(3), EGFR(58), ELK1(1), ELK4(1), FGF10(1), FGF13(1), FGF14(2), FGF18(1), FGF2(1), FGF20(2), FGF21(1), FGF23(3), FGF3(1), FGF6(3), FGF9(1), FGFR1(3), FGFR2(3), FGFR3(2), FGFR4(3), FLNA(14), FLNB(4), FLNC(6), FOS(1), GADD45B(1), GNA12(2), IKBKB(2), IL1R1(2), KRAS(1), MAP2K1(1), MAP2K2(1), MAP2K3(1), MAP2K5(1), MAP2K7(1), MAP3K1(5), MAP3K10(3), MAP3K12(5), MAP3K13(2), MAP3K14(2), MAP3K2(1), MAP3K3(4), MAP3K4(2), MAP3K5(1), MAP3K6(5), MAP3K7(2), MAP4K1(1), MAP4K2(1), MAP4K3(1), MAP4K4(5), MAPK1(3), MAPK13(1), MAPK14(1), MAPK3(2), MAPK7(3), MAPK8IP1(3), MAPK8IP2(3), MAPK8IP3(5), MAPK9(2), MAPKAPK2(1), MAPKAPK3(1), MAPT(1), MAX(2), MEF2C(1), MKNK1(1), NF1(31), NFATC2(1), NFATC4(2), NFKB1(1), NFKB2(1), NR4A1(3), NRAS(1), NTF3(1), NTRK1(4), NTRK2(1), PAK1(2), PDGFRA(10), PDGFRB(5), PLA2G12A(3), PLA2G2A(5), PLA2G2F(2), PLA2G3(2), PLA2G4A(4), PLA2G5(1), PLA2G6(3), PPM1B(1), PPP3CB(1), PPP3R1(1), PPP3R2(1), PPP5C(1), PRKACG(1), PRKCA(3), PRKCG(1), PRKX(2), PTPRR(2), RAP1B(2), RAPGEF2(4), RASA2(1), RASGRF1(5), RASGRF2(6), RASGRP1(1), RASGRP2(2), RASGRP3(2), RASGRP4(3), RPS6KA2(2), RPS6KA3(5), RRAS2(3), SOS1(1), SOS2(4), SRF(2), STK3(2), STK4(1), STMN1(1), TAOK1(1), TAOK2(2), TAOK3(2), TGFB1(1), TGFB2(1), TGFBR1(1), TGFBR2(5), TNFRSF1A(2), TP53(89), TRAF2(2), ZAK(1) | 111569559 | 586 | 213 | 518 | 148 | 184 | 87 | 111 | 98 | 100 | 6 | <1.00e-15 | <5.60e-14 |
| 2 | TELPATHWAY | Telomerase is a ribonucleotide protein that adds telomeric repeats to the 3' ends of chromosomes. | AKT1, BCL2, EGFR, G22P1, HSPCA, IGF1R, KRAS2, MYC, POLR2A, PPP2CA, PRKCA, RB1, TEP1, TERF1, TERT, TNKS, TP53, XRCC5 | 15 | AKT1(1), BCL2(3), EGFR(58), IGF1R(2), POLR2A(2), PPP2CA(1), PRKCA(3), RB1(21), TEP1(4), TERT(8), TNKS(4), TP53(89), XRCC5(1) | 11328048 | 197 | 139 | 135 | 11 | 45 | 40 | 42 | 22 | 46 | 2 | <1.00e-15 | <5.60e-14 |
| 3 | SIG_INSULIN_RECEPTOR_PATHWAY_IN_CARDIAC_MYOCYTES | Genes related to the insulin receptor pathway | AKT1, AKT2, AKT3, BRD4, CAP1, CBL, CDC42, CDKN2A, F2RL2, FLOT1, FLOT2, FOXO1A, GRB2, GSK3A, GSK3B, IGFBP1, INPPL1, IRS1, IRS2, IRS4, LNPEP, MAPK1, MAPK3, PARD3, PARD6A, PDK1, PIK3CA, PIK3CD, PIK3R1, PPYR1, PSCD3, PTEN, PTPN1, RAF1, RPS6KA1, RPS6KA2, RPS6KA3, RPS6KB1, SERPINB6, SFN, SHC1, SLC2A4, SORBS1, SOS1, SOS2, YWHAB, YWHAE, YWHAG, YWHAH, YWHAQ, YWHAZ | 48 | AKT1(1), AKT2(1), AKT3(1), BRD4(7), CBL(1), CDKN2A(3), FLOT1(2), GSK3B(1), IGFBP1(1), INPPL1(4), IRS1(4), IRS4(3), LNPEP(2), MAPK1(3), MAPK3(2), PARD3(2), PARD6A(1), PIK3CA(19), PIK3CD(2), PIK3R1(17), PPYR1(2), PTEN(80), PTPN1(1), RPS6KA2(2), RPS6KA3(5), RPS6KB1(1), SERPINB6(1), SLC2A4(3), SORBS1(2), SOS1(1), SOS2(4), YWHAB(1), YWHAE(2) | 23158627 | 182 | 128 | 162 | 32 | 30 | 35 | 21 | 36 | 60 | 0 | <1.00e-15 | <5.60e-14 |
| 4 | MTORPATHWAY | Mammalian target of rapamycin (mTOR) senses mitogenic factors and nutrients, including ATP, and induces cell proliferation. | AKT1, EIF3S10, EIF4A1, EIF4A2, EIF4B, EIF4E, EIF4EBP1, EIF4G1, EIF4G2, EIF4G3, FKBP1A, FRAP1, MKNK1, PDK2, PDPK1, PIK3CA, PIK3R1, PPP2CA, PTEN, RPS6, RPS6KB1, TSC1, TSC2 | 21 | AKT1(1), EIF4A1(4), EIF4B(3), EIF4E(2), EIF4G1(2), EIF4G2(2), EIF4G3(1), FKBP1A(1), MKNK1(1), PIK3CA(19), PIK3R1(17), PPP2CA(1), PTEN(80), RPS6KB1(1), TSC1(4), TSC2(2) | 10941579 | 141 | 117 | 121 | 5 | 15 | 30 | 17 | 25 | 54 | 0 | <1.00e-15 | <5.60e-14 |
| 5 | ARFPATHWAY | Cyclin-dependent kinase inhibitor 2A is a tumor suppressor that induces G1 arrest and can activate the p53 pathway, leading to G2/M arrest. | ABL1, CDKN2A, E2F1, MDM2, MYC, PIK3CA, PIK3R1, POLR1A, POLR1B, POLR1C, POLR1D, RAC1, RB1, TBX2, TP53, TWIST1 | 16 | ABL1(1), CDKN2A(3), MDM2(1), PIK3CA(19), PIK3R1(17), POLR1A(3), POLR1B(1), POLR1C(1), RB1(21), TBX2(1), TP53(89) | 8040458 | 157 | 113 | 124 | 13 | 28 | 28 | 20 | 25 | 54 | 2 | <1.00e-15 | <5.60e-14 |
| 6 | SA_PTEN_PATHWAY | PTEN is a tumor suppressor that dephosphorylates the lipid messenger phosphatidylinositol triphosphate. | AKT1, AKT2, AKT3, BPNT1, GRB2, ILK, MAPK1, MAPK3, PDK1, PIK3CA, PIK3CD, PIP3-E, PTEN, PTK2B, RBL2, SHC1, SOS1 | 16 | AKT1(1), AKT2(1), AKT3(1), BPNT1(1), ILK(2), MAPK1(3), MAPK3(2), PIK3CA(19), PIK3CD(2), PTEN(80), PTK2B(1), RBL2(1), SOS1(1) | 8079012 | 115 | 104 | 98 | 7 | 14 | 26 | 13 | 24 | 38 | 0 | <1.00e-15 | <5.60e-14 |
| 7 | G1PATHWAY | CDK4/6-cyclin D and CDK2-cyclin E phosphorylate Rb, which allows the transcription of genes needed for the G1/S cell cycle transition. | ABL1, ATM, ATR, CCNA1, CCND1, CCNE1, CDC2, CDC25A, CDK2, CDK4, CDK6, CDKN1A, CDKN1B, CDKN2A, CDKN2B, DHFR, E2F1, GSK3B, HDAC1, MADH3, MADH4, RB1, SKP2, TFDP1, TGFB1, TGFB2, TGFB3, TP53 | 25 | ABL1(1), ATM(7), ATR(9), CCNA1(1), CCNE1(1), CDKN1A(1), CDKN1B(3), CDKN2A(3), CDKN2B(1), DHFR(1), GSK3B(1), HDAC1(1), RB1(21), TGFB1(1), TGFB2(1), TP53(89) | 12112046 | 142 | 96 | 114 | 11 | 30 | 24 | 19 | 17 | 50 | 2 | <1.00e-15 | <5.60e-14 |
| 8 | TERTPATHWAY | hTERC, the RNA subunit of telomerase, and hTERT, the catalytic protein subunit, are required for telomerase activity and are overexpressed in many cancers. | HDAC1, MAX, MYC, SP1, SP3, TP53, WT1, ZNF42 | 7 | HDAC1(1), MAX(2), SP1(6), SP3(1), TP53(89), WT1(3) | 2849491 | 102 | 86 | 76 | 2 | 27 | 17 | 14 | 14 | 28 | 2 | <1.00e-15 | <5.60e-14 |
| 9 | P53HYPOXIAPATHWAY | Hypoxia induces p53 accumulation and consequent apoptosis with p53-mediated cell cycle arrest, which is present under conditions of DNA damage. | ABCB1, AKT1, ATM, BAX, CDKN1A, CPB2, CSNK1A1, CSNK1D, FHL2, GADD45A, HIC1, HIF1A, HSPA1A, HSPCA, IGFBP3, MAPK8, MDM2, NFKBIB, NQO1, TP53 | 17 | ABCB1(4), AKT1(1), ATM(7), CDKN1A(1), CPB2(1), FHL2(1), HIF1A(1), IGFBP3(1), MDM2(1), NFKBIB(1), TP53(89) | 8064819 | 108 | 83 | 82 | 5 | 29 | 22 | 13 | 16 | 26 | 2 | <1.00e-15 | <5.60e-14 |
| 10 | EGFR_SMRTEPATHWAY | EGF receptor activation inhibits SMRT, a transcriptional co-repressor that interacts with transcription factor complexes and gene silencers. | EGF, EGFR, MAP2K1, MAP3K1, MAPK14, NCOR2, RARA, RXRA, THRA, THRB, ZNF145 | 10 | EGF(3), EGFR(58), MAP2K1(1), MAP3K1(5), MAPK14(1), NCOR2(5), RARA(5), RXRA(3), THRA(1) | 6703510 | 82 | 66 | 48 | 13 | 14 | 24 | 25 | 14 | 5 | 0 | <1.00e-15 | <5.60e-14 |
Table 7. Get Full Table A Ranked List of Significantly Mutated Genesets (Excluding Significantly Mutated Genes). Number of significant genesets found: 0. Number of genesets displayed: 10
| rank | geneset | description | genes | N_genes | mut_tally | N | n | npat | nsite | nsil | n1 | n2 | n3 | n4 | n5 | n6 | p | q |
|---|---|---|---|---|---|---|---|---|---|---|---|---|---|---|---|---|---|---|
| 1 | HSA00040_PENTOSE_AND_GLUCURONATE_INTERCONVERSIONS | Genes involved in pentose and glucuronate interconversions | AKR1B1, DCXR, GUSB, RPE, UGDH, UGP2, UGT1A1, UGT1A10, UGT1A3, UGT1A4, UGT1A5, UGT1A6, UGT1A7, UGT1A8, UGT1A9, UGT2A1, UGT2A3, UGT2B10, UGT2B11, UGT2B15, UGT2B17, UGT2B28, UGT2B4, UGT2B7, XYLB | 24 | GUSB(3), RPE(1), UGP2(1), UGT1A1(1), UGT1A10(1), UGT1A3(1), UGT1A5(2), UGT1A6(2), UGT1A9(1), UGT2A1(5), UGT2A3(3), UGT2B10(1), UGT2B11(3), UGT2B17(1), UGT2B28(5), UGT2B4(5), UGT2B7(3), XYLB(4) | 9832004 | 43 | 32 | 42 | 16 | 12 | 6 | 11 | 10 | 4 | 0 | 0.0013 | 0.32 |
| 2 | FXRPATHWAY | The nuclear receptor transcription factors FXR and LXR are activated by cholesterol metabolites and regulate cholesterol homeostasis. | FABP6, LDLR, NR0B2, NR1H3, NR1H4, RXRA | 6 | LDLR(4), NR0B2(3), NR1H3(1), NR1H4(3), RXRA(3) | 2161711 | 14 | 15 | 15 | 3 | 3 | 2 | 4 | 3 | 2 | 0 | 0.002 | 0.32 |
| 3 | HSA04640_HEMATOPOIETIC_CELL_LINEAGE | Genes involved in hematopoietic cell lineage | ANPEP, CD14, CD19, CD1A, CD1B, CD1C, CD1D, CD1E, CD2, CD22, CD24, CD33, CD34, CD36, CD37, CD38, CD3D, CD3E, CD3G, CD4, CD44, CD5, CD55, CD59, CD7, CD8A, CD8B, CD9, CR1, CR2, CSF1, CSF1R, CSF2, CSF2RA, CSF3, CSF3R, DNTT, EPO, EPOR, FCER2, FCGR1A, FLT3, FLT3LG, GP1BA, GP1BB, GP5, GP9, GYPA, HLA-DRA, HLA-DRB1, HLA-DRB3, HLA-DRB4, HLA-DRB5, IL11, IL11RA, IL1A, IL1B, IL1R1, IL1R2, IL2RA, IL3, IL3RA, IL4, IL4R, IL5, IL5RA, IL6, IL6R, IL7, IL7R, IL9R, ITGA1, ITGA2, ITGA2B, ITGA3, ITGA4, ITGA5, ITGA6, ITGAM, ITGB3, KIT, KITLG, MME, MS4A1, TFRC, THPO, TNF, TPO | 79 | ANPEP(3), CD14(2), CD19(2), CD1B(1), CD1D(2), CD1E(1), CD22(5), CD33(3), CD34(2), CD36(2), CD38(2), CD3E(1), CD3G(1), CD44(4), CD5(2), CD55(2), CD7(2), CD8A(1), CD8B(1), CD9(2), CR1(5), CR2(6), CSF1R(3), CSF3R(2), DNTT(2), EPO(1), EPOR(1), FLT3(7), FLT3LG(1), GP9(1), GYPA(1), HLA-DRA(1), HLA-DRB1(2), HLA-DRB5(2), IL1R1(2), IL2RA(3), IL4(1), IL4R(6), IL5RA(1), IL6(2), IL6R(2), IL7(1), IL7R(1), ITGA1(1), ITGA2(4), ITGA2B(2), ITGA3(2), ITGA4(7), ITGA5(1), ITGA6(2), ITGAM(8), ITGB3(1), KIT(3), KITLG(2), MS4A1(2), TFRC(2), THPO(1), TPO(4) | 31351365 | 137 | 76 | 135 | 51 | 54 | 23 | 28 | 20 | 12 | 0 | 0.002 | 0.32 |
| 4 | TYROSINE_METABOLISM | ABP1, ADH1A, ADH1A, ADH1B, ADH1C, ADH1B, ADH1C, ADH4, ADH6, ADH7, ADHFE1, ALDH1A3, ALDH3A1, ALDH3B1, ALDH3B2, AOC2, AOC3, AOX1, COMT, DBH, DCT, DDC, FAH, GOT1, GOT2, GSTZ1, HGD, HPD, MAOA, MAOB, PNMT, TAT, TH, TPO, TYR | 31 | ABP1(9), ADH1A(4), ADH1B(3), ADH1C(3), ADH6(2), ADH7(1), ALDH1A3(1), ALDH3A1(3), ALDH3B1(2), ALDH3B2(1), AOC2(2), AOC3(2), AOX1(7), COMT(2), DBH(6), DDC(1), FAH(1), GOT1(1), HPD(1), MAOB(1), PNMT(1), TAT(3), TPO(4), TYR(5) | 12332970 | 66 | 42 | 65 | 14 | 35 | 9 | 9 | 13 | 0 | 0 | 0.0021 | 0.32 | |
| 5 | HSA00980_METABOLISM_OF_XENOBIOTICS_BY_CYTOCHROME_P450 | Genes involved in metabolism of xenobiotics by cytochrome P450 | ADH1A, ADH1B, ADH1C, ADH4, ADH5, ADH6, ADH7, ADHFE1, AKR1C1, AKR1C2, AKR1C3, AKR1C4, ALDH1A3, ALDH3A1, ALDH3B1, ALDH3B2, CYP1A1, CYP1A2, CYP1B1, CYP2B6, CYP2C18, CYP2C19, CYP2C8, CYP2C9, CYP2E1, CYP2F1, CYP2S1, CYP3A4, CYP3A43, CYP3A5, CYP3A7, DHDH, EPHX1, GSTA1, GSTA2, GSTA3, GSTA4, GSTA5, GSTK1, GSTM1, GSTM2, GSTM3, GSTM4, GSTM5, GSTO2, GSTP1, GSTT1, GSTT2, GSTZ1, MGST1, MGST2, MGST3, UGT1A1, UGT1A10, UGT1A3, UGT1A4, UGT1A5, UGT1A6, UGT1A7, UGT1A8, UGT1A9, UGT2A1, UGT2A3, UGT2B10, UGT2B11, UGT2B15, UGT2B17, UGT2B28, UGT2B4, UGT2B7 | 68 | ADH1A(4), ADH1B(3), ADH1C(3), ADH6(2), ADH7(1), AKR1C1(3), AKR1C4(2), ALDH1A3(1), ALDH3A1(3), ALDH3B1(2), ALDH3B2(1), CYP1A1(1), CYP1B1(4), CYP2B6(2), CYP2C18(1), CYP2C8(2), CYP2C9(2), CYP2E1(4), CYP2S1(1), CYP3A4(3), CYP3A43(2), CYP3A7(3), DHDH(1), GSTA1(2), GSTA4(2), GSTA5(1), GSTK1(2), GSTM1(1), GSTM3(1), GSTP1(1), GSTT1(1), MGST1(1), MGST3(1), UGT1A1(1), UGT1A10(1), UGT1A3(1), UGT1A5(2), UGT1A6(2), UGT1A9(1), UGT2A1(5), UGT2A3(3), UGT2B10(1), UGT2B11(3), UGT2B17(1), UGT2B28(5), UGT2B4(5), UGT2B7(3) | 21984496 | 98 | 57 | 98 | 32 | 38 | 8 | 24 | 25 | 3 | 0 | 0.0043 | 0.51 |
| 6 | BLOOD_CLOTTING_CASCADE | F10, F11, F12, F13B, F2, F5, F7, F8, F8A1, F9, FGA, FGB, FGG, LPA, PLG, PLAT, PLAU, PLG, SERPINB2, SERPINE1, SERPINF2, VWF | 19 | F10(1), F13B(2), F2(1), F5(9), F7(1), F8(8), FGA(3), FGB(1), FGG(4), LPA(6), PLAU(2), PLG(2), SERPINB2(2), SERPINE1(1), SERPINF2(1), VWF(10) | 13638969 | 54 | 40 | 54 | 22 | 19 | 9 | 11 | 5 | 10 | 0 | 0.0053 | 0.51 | |
| 7 | HSA01430_CELL_COMMUNICATION | Genes involved in cell communication | ACTB, ACTG1, CHAD, COL11A1, COL11A2, COL17A1, COL1A1, COL1A2, COL2A1, COL3A1, COL4A1, COL4A2, COL4A4, COL4A6, COL5A1, COL5A2, COL5A3, COL6A1, COL6A2, COL6A3, COL6A6, COMP, DES, DSC1, DSC2, DSC3, DSG1, DSG2, DSG3, DSG4, FN1, GJA1, GJA10, GJA3, GJA4, GJA5, GJA8, GJA9, GJB1, GJB2, GJB3, GJB4, GJB5, GJB6, GJB7, GJC1, GJC2, GJC3, GJD2, GJD3, GJD4, IBSP, INA, ITGA6, ITGB4, KRT1, KRT10, KRT12, KRT13, KRT14, KRT15, KRT16, KRT17, KRT18, KRT19, KRT2, KRT20, KRT23, KRT24, KRT25, KRT27, KRT28, KRT3, KRT31, KRT32, KRT33A, KRT33B, KRT34, KRT35, KRT36, KRT37, KRT38, KRT39, KRT4, KRT40, KRT5, KRT6A, KRT6B, KRT6C, KRT7, KRT71, KRT72, KRT73, KRT74, KRT75, KRT76, KRT77, KRT78, KRT79, KRT8, KRT81, KRT82, KRT83, KRT84, KRT85, KRT86, KRT9, LAMA1, LAMA2, LAMA3, LAMA4, LAMA5, LAMB1, LAMB2, LAMB3, LAMB4, LAMC1, LAMC2, LAMC3, LMNA, LMNB1, LMNB2, LOC728760, NES, PRPH, RELN, SPP1, THBS1, THBS2, THBS3, THBS4, TNC, TNN, TNR, TNXB, VIM, VTN, VWF | 129 | ACTB(1), CHAD(1), COL11A1(8), COL11A2(9), COL17A1(3), COL1A1(4), COL1A2(9), COL2A1(2), COL3A1(5), COL4A1(4), COL4A2(8), COL4A4(4), COL4A6(5), COL5A1(3), COL5A2(5), COL6A1(5), COL6A2(3), COL6A6(7), COMP(1), DES(3), DSC1(5), DSC2(2), DSC3(2), DSG1(4), DSG2(1), DSG3(8), DSG4(10), FN1(3), GJA1(1), GJA10(1), GJA8(1), GJA9(1), GJB3(2), GJB5(2), GJB6(1), GJB7(1), GJC1(1), GJC2(1), GJC3(1), INA(2), ITGA6(2), ITGB4(5), KRT1(2), KRT10(1), KRT12(3), KRT14(3), KRT15(1), KRT16(4), KRT17(3), KRT18(3), KRT19(5), KRT2(3), KRT20(1), KRT23(8), KRT24(1), KRT25(3), KRT28(3), KRT3(1), KRT31(3), KRT32(2), KRT33A(3), KRT33B(2), KRT34(3), KRT36(4), KRT37(2), KRT38(2), KRT4(2), KRT5(1), KRT6A(1), KRT6B(2), KRT6C(1), KRT7(3), KRT72(1), KRT73(1), KRT74(3), KRT75(2), KRT76(2), KRT77(2), KRT78(1), KRT79(2), KRT8(3), KRT81(1), KRT82(1), KRT83(2), KRT84(2), KRT85(2), KRT9(3), LAMA1(17), LAMA2(12), LAMA3(7), LAMA4(4), LAMA5(9), LAMB1(4), LAMB2(3), LAMB3(4), LAMB4(10), LAMC1(2), LAMC2(6), LAMC3(5), LMNB1(1), LMNB2(3), NES(3), RELN(20), SPP1(1), THBS1(3), THBS2(5), THBS3(1), THBS4(2), TNC(7), TNN(5), TNR(2), TNXB(6), VIM(1), VWF(10) | 91828164 | 404 | 152 | 402 | 167 | 153 | 79 | 71 | 45 | 55 | 1 | 0.0058 | 0.51 |
| 8 | NEUROTRANSMITTERSPATHWAY | Biosynthesis of neurotransmitters | DBH, GAD1, HDC, PNMT, TH, TPH1 | 6 | DBH(6), GAD1(4), HDC(3), PNMT(1), TPH1(3) | 2333567 | 17 | 13 | 17 | 6 | 10 | 4 | 2 | 1 | 0 | 0 | 0.0066 | 0.51 |
| 9 | CTLPATHWAY | Cytotoxic T lymphocytes induce apoptosis in infected cells presenting antigen-MHC-I complexes via the perforin and Fas/Fas ligand pathways. | B2M, CD3D, CD3E, CD3G, CD3Z, GZMB, HLA-A, ICAM1, ITGAL, ITGB2, PRF1, TNFRSF6, TNFSF6, TRA@, TRB@ | 10 | B2M(2), CD3E(1), CD3G(1), GZMB(3), HLA-A(1), ITGAL(4), ITGB2(5), PRF1(3) | 3417489 | 20 | 15 | 20 | 14 | 6 | 1 | 4 | 1 | 8 | 0 | 0.0074 | 0.51 |
| 10 | PEPTIDE_GPCRS | AGTR1, AGTR2, ATP8A1, AVPR1A, AVPR1B, AVPR2, BDKRB1, BDKRB2, BLR1, BRS3, C3AR1, C5R1, CCKAR, CCKBR, CCR1, CCR10, CCR2, CCR3, CCR4, CCR5, CCR6, CCR7, CCR8, CX3CR1, CXCR3, CXCR4, CXCR6, EDNRA, EDNRB, ELA3A, FPR1, FPRL1, FPRL2, FSHR, FY, GALR1, GALR2, GALR3, GALT, GHSR, GNB2L1, GNRHR, GPR77, GRPR, IL8RA, IL8RB, LHCGR, MC1R, MC2R, MC3R, MC4R, MC5R, NMBR, NPY1R, NPY2R, NPY5R, NPY6R, NTSR1, NTSR2, OPRD1, OPRK1, OPRL1, OPRM1, OXTR, PPYR1, SSTR1, SSTR2, SSTR3, SSTR4, TAC4, TACR1, TACR2, TACR3, TRHR, TSHR | 63 | AGTR1(2), AGTR2(1), ATP8A1(3), AVPR1A(3), AVPR1B(1), BDKRB1(1), BDKRB2(3), BRS3(2), C3AR1(1), CCKAR(3), CCKBR(2), CCR1(2), CCR10(1), CCR3(2), CCR4(1), CCR6(2), CCR7(2), CCR8(1), CX3CR1(2), CXCR3(2), CXCR6(1), EDNRA(1), EDNRB(1), FPR1(1), FSHR(1), GALR1(3), GALR2(1), GALT(1), GHSR(4), GNB2L1(1), GRPR(1), LHCGR(1), MC2R(1), MC3R(6), MC4R(3), MC5R(2), NPY5R(4), NTSR1(2), OPRK1(1), OPRL1(2), OXTR(2), PPYR1(2), SSTR2(1), SSTR3(2), SSTR4(4), TACR1(1), TACR3(4), TRHR(2), TSHR(1) | 19529660 | 94 | 54 | 94 | 38 | 39 | 19 | 18 | 14 | 4 | 0 | 0.0097 | 0.6 |
In brief, we tabulate the number of mutations and the number of covered bases for each gene. The counts are broken down by mutation context category: four context categories that are discovered by MutSig, and one for indel and 'null' mutations, which include indels, nonsense mutations, splice-site mutations, and non-stop (read-through) mutations. For each gene, we calculate the probability of seeing the observed constellation of mutations, i.e. the product P1 x P2 x ... x Pm, or a more extreme one, given the background mutation rates calculated across the dataset. [1]
This is an experimental feature. The full results of the analysis summarized in this report can be downloaded from the TCGA Data Coordination Center.