This pipeline uses various statistical tests to identify mRNAs whose expression levels correlated to selected clinical features.
Testing the association between 18388 genes and 8 clinical features across 302 samples, statistically thresholded by Q value < 0.05, 4 clinical features related to at least one genes.
-
11 genes correlated to 'Time to Death'.
-
CYB5B|80777 , FGD3|89846 , TOMM34|10953 , LOC728989|728989 , TP53INP1|94241 , ...
-
33 genes correlated to 'GENDER'.
-
XIST|7503 , ZFY|7544 , PRKY|5616 , RPS4Y1|6192 , DDX3Y|8653 , ...
-
2 genes correlated to 'PATHOLOGY.T'.
-
LRRC8A|56262 , MSL3|10943
-
24 genes correlated to 'PATHOLOGY.N'.
-
SPRR2F|6705 , TGM1|7051 , SPOCK1|6695 , CRCT1|54544 , PTDSS1|9791 , ...
-
No genes correlated to 'AGE', 'TUMOR.STAGE', 'RADIATIONS.RADIATION.REGIMENINDICATION', and 'NEOADJUVANT.THERAPY'.
Complete statistical result table is provided in Supplement Table 1
Table 1. Get Full Table This table shows the clinical features, statistical methods used, and the number of genes that are significantly associated with each clinical feature at Q value < 0.05.
| Clinical feature | Statistical test | Significant genes | Associated with | Associated with | ||
|---|---|---|---|---|---|---|
| Time to Death | Cox regression test | N=11 | shorter survival | N=4 | longer survival | N=7 |
| AGE | Spearman correlation test | N=0 | ||||
| GENDER | t test | N=33 | male | N=13 | female | N=20 |
| PATHOLOGY T | Spearman correlation test | N=2 | higher pT | N=1 | lower pT | N=1 |
| PATHOLOGY N | Spearman correlation test | N=24 | higher pN | N=11 | lower pN | N=13 |
| TUMOR STAGE | Spearman correlation test | N=0 | ||||
| RADIATIONS RADIATION REGIMENINDICATION | t test | N=0 | ||||
| NEOADJUVANT THERAPY | t test | N=0 |
Table S1. Basic characteristics of clinical feature: 'Time to Death'
| Time to Death | Duration (Months) | 0.1-210.9 (median=14.8) |
| censored | N = 179 | |
| death | N = 120 | |
| Significant markers | N = 11 | |
| associated with shorter survival | 4 | |
| associated with longer survival | 7 |
Table S2. Get Full Table List of top 10 genes significantly associated with 'Time to Death' by Cox regression test
| HazardRatio | Wald_P | Q | C_index | |
|---|---|---|---|---|
| CYB5B|80777 | 2.5 | 2.596e-08 | 0.00048 | 0.63 |
| FGD3|89846 | 0.63 | 7.256e-08 | 0.0013 | 0.335 |
| TOMM34|10953 | 2.3 | 1.419e-07 | 0.0026 | 0.647 |
| LOC728989|728989 | 0.64 | 3.834e-07 | 0.007 | 0.331 |
| TP53INP1|94241 | 0.64 | 7.673e-07 | 0.014 | 0.357 |
| FRMD5|84978 | 1.27 | 7.696e-07 | 0.014 | 0.658 |
| ZNF266|10781 | 0.45 | 1.229e-06 | 0.023 | 0.362 |
| SLC35E2|728661 | 0.57 | 1.757e-06 | 0.032 | 0.381 |
| SLC25A45|283130 | 0.6 | 1.966e-06 | 0.036 | 0.362 |
| POLR2C|5432 | 2.6 | 2.524e-06 | 0.046 | 0.613 |
Figure S1. Get High-res Image As an example, this figure shows the association of CYB5B|80777 to 'Time to Death'. four curves present the cumulative survival rates of 4 quartile subsets of patients. P value = 2.6e-08 with univariate Cox regression analysis using continuous log-2 expression values.

Table S3. Basic characteristics of clinical feature: 'AGE'
| AGE | Mean (SD) | 61.05 (12) |
| Significant markers | N = 0 |
Table S4. Basic characteristics of clinical feature: 'GENDER'
| GENDER | Labels | N |
| FEMALE | 81 | |
| MALE | 221 | |
| Significant markers | N = 33 | |
| Higher in MALE | 13 | |
| Higher in FEMALE | 20 |
Table S5. Get Full Table List of top 10 genes differentially expressed by 'GENDER'
| T(pos if higher in 'MALE') | ttestP | Q | AUC | |
|---|---|---|---|---|
| XIST|7503 | -37.97 | 2.279e-89 | 4.19e-85 | 0.9902 |
| ZFY|7544 | 32.66 | 4.429e-61 | 8.14e-57 | 0.9861 |
| PRKY|5616 | 24.88 | 4.176e-53 | 7.68e-49 | 0.9837 |
| RPS4Y1|6192 | 30.52 | 5.776e-49 | 1.06e-44 | 0.988 |
| DDX3Y|8653 | 27.13 | 1.771e-36 | 3.26e-32 | 0.9802 |
| TSIX|9383 | -17.02 | 4.528e-36 | 8.32e-32 | 0.9642 |
| USP9Y|8287 | 21.72 | 1.36e-26 | 2.5e-22 | 0.9798 |
| KDM5D|8284 | 21.37 | 6.579e-25 | 1.21e-20 | 0.9779 |
| NLGN4Y|22829 | 17.46 | 2.222e-22 | 4.08e-18 | 0.9683 |
| UTY|7404 | 18.71 | 3.739e-21 | 6.87e-17 | 0.9726 |
Figure S2. Get High-res Image As an example, this figure shows the association of XIST|7503 to 'GENDER'. P value = 2.28e-89 with T-test analysis.
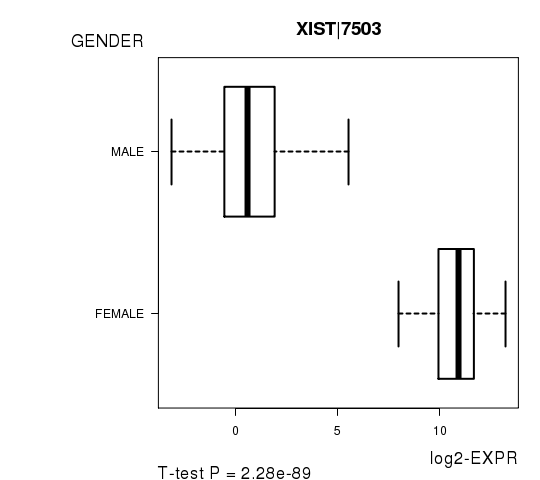
Table S6. Basic characteristics of clinical feature: 'PATHOLOGY.T'
| PATHOLOGY.T | Mean (SD) | 2.91 (1) |
| N | ||
| T1 | 23 | |
| T2 | 78 | |
| T3 | 60 | |
| T4 | 101 | |
| Significant markers | N = 2 | |
| pos. correlated | 1 | |
| neg. correlated | 1 |
Table S7. Get Full Table List of 2 genes significantly correlated to 'PATHOLOGY.T' by Spearman correlation test
| SpearmanCorr | corrP | Q | |
|---|---|---|---|
| LRRC8A|56262 | 0.3223 | 9.538e-08 | 0.00175 |
| MSL3|10943 | -0.2969 | 9.869e-07 | 0.0181 |
Figure S3. Get High-res Image As an example, this figure shows the association of LRRC8A|56262 to 'PATHOLOGY.T'. P value = 9.54e-08 with Spearman correlation analysis.

Table S8. Basic characteristics of clinical feature: 'PATHOLOGY.N'
| PATHOLOGY.N | Mean (SD) | 1.03 (0.96) |
| N | ||
| N0 | 100 | |
| N1 | 32 | |
| N2 | 97 | |
| N3 | 5 | |
| Significant markers | N = 24 | |
| pos. correlated | 11 | |
| neg. correlated | 13 |
Table S9. Get Full Table List of top 10 genes significantly correlated to 'PATHOLOGY.N' by Spearman correlation test
| SpearmanCorr | corrP | Q | |
|---|---|---|---|
| SPRR2F|6705 | -0.3585 | 2.219e-08 | 0.000408 |
| TGM1|7051 | -0.3517 | 3.22e-08 | 0.000592 |
| SPOCK1|6695 | 0.3427 | 7.526e-08 | 0.00138 |
| CRCT1|54544 | -0.3389 | 1.382e-07 | 0.00254 |
| PTDSS1|9791 | 0.3357 | 1.426e-07 | 0.00262 |
| MPZL2|10205 | -0.331 | 2.184e-07 | 0.00401 |
| CNIH3|149111 | 0.3218 | 4.885e-07 | 0.00898 |
| TRMT12|55039 | 0.3215 | 5.019e-07 | 0.00923 |
| SDS|10993 | 0.3196 | 5.892e-07 | 0.0108 |
| ARL4C|10123 | 0.3194 | 5.998e-07 | 0.011 |
Figure S4. Get High-res Image As an example, this figure shows the association of SPRR2F|6705 to 'PATHOLOGY.N'. P value = 2.22e-08 with Spearman correlation analysis.
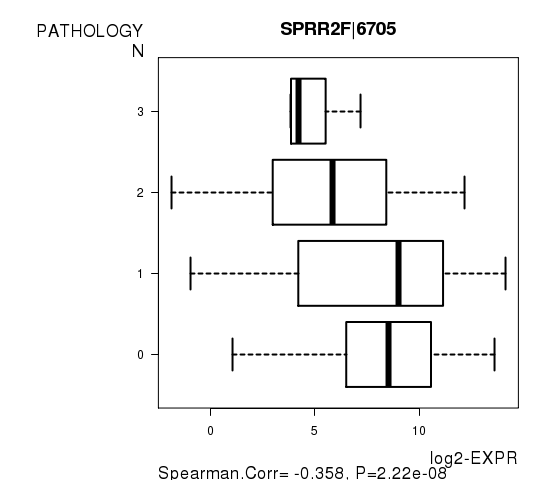
Table S10. Basic characteristics of clinical feature: 'TUMOR.STAGE'
| TUMOR.STAGE | Mean (SD) | 3.29 (0.97) |
| N | ||
| Stage 1 | 16 | |
| Stage 2 | 47 | |
| Stage 3 | 41 | |
| Stage 4 | 153 | |
| Significant markers | N = 0 |
No gene related to 'RADIATIONS.RADIATION.REGIMENINDICATION'.
Table S11. Basic characteristics of clinical feature: 'RADIATIONS.RADIATION.REGIMENINDICATION'
| RADIATIONS.RADIATION.REGIMENINDICATION | Labels | N |
| NO | 75 | |
| YES | 227 | |
| Significant markers | N = 0 |
-
Expresson data file = HNSC.uncv2.mRNAseq_RSEM_normalized_log2.txt
-
Clinical data file = HNSC.clin.merged.picked.txt
-
Number of patients = 302
-
Number of genes = 18388
-
Number of clinical features = 8
For survival clinical features, Wald's test in univariate Cox regression analysis with proportional hazards model (Andersen and Gill 1982) was used to estimate the P values using the 'coxph' function in R. Kaplan-Meier survival curves were plot using the four quartile subgroups of patients based on expression levels
For continuous numerical clinical features, Spearman's rank correlation coefficients (Spearman 1904) and two-tailed P values were estimated using 'cor.test' function in R
For two-class clinical features, two-tailed Student's t test with unequal variance (Lehmann and Romano 2005) was applied to compare the log2-expression levels between the two clinical classes using 't.test' function in R
For multiple hypothesis correction, Q value is the False Discovery Rate (FDR) analogue of the P value (Benjamini and Hochberg 1995), defined as the minimum FDR at which the test may be called significant. We used the 'Benjamini and Hochberg' method of 'p.adjust' function in R to convert P values into Q values.
This is an experimental feature. The full results of the analysis summarized in this report can be downloaded from the TCGA Data Coordination Center.