This pipeline uses various statistical tests to identify genes whose promoter methylation levels correlated to selected clinical features.
Testing the association between 17419 genes and 8 clinical features across 299 samples, statistically thresholded by Q value < 0.05, 6 clinical features related to at least one genes.
-
2 genes correlated to 'Time to Death'.
-
ZNF266 , WIPI1
-
4 genes correlated to 'AGE'.
-
SLC35D3 , HAND1 , XKR6 , PRSS27
-
5 genes correlated to 'GENDER'.
-
KIF4B , FRG1B , SLC22A3 , NLRP2 , RPA1
-
7 genes correlated to 'PATHOLOGY.N'.
-
SLC47A2 , AVPI1 , FAM185A , ARHGAP27 , ESRRA , ...
-
7 genes correlated to 'RADIATIONS.RADIATION.REGIMENINDICATION'.
-
FLII , ZCCHC17 , RTN4IP1 , CKS2 , RPL7L1 , ...
-
3 genes correlated to 'NEOADJUVANT.THERAPY'.
-
ASRGL1 , ZCCHC17 , BMP6
-
No genes correlated to 'PATHOLOGY.T', and 'TUMOR.STAGE'.
Complete statistical result table is provided in Supplement Table 1
Table 1. Get Full Table This table shows the clinical features, statistical methods used, and the number of genes that are significantly associated with each clinical feature at Q value < 0.05.
| Clinical feature | Statistical test | Significant genes | Associated with | Associated with | ||
|---|---|---|---|---|---|---|
| Time to Death | Cox regression test | N=2 | shorter survival | N=1 | longer survival | N=1 |
| AGE | Spearman correlation test | N=4 | older | N=4 | younger | N=0 |
| GENDER | t test | N=5 | male | N=2 | female | N=3 |
| PATHOLOGY T | Spearman correlation test | N=0 | ||||
| PATHOLOGY N | Spearman correlation test | N=7 | higher pN | N=7 | lower pN | N=0 |
| TUMOR STAGE | Spearman correlation test | N=0 | ||||
| RADIATIONS RADIATION REGIMENINDICATION | t test | N=7 | yes | N=1 | no | N=6 |
| NEOADJUVANT THERAPY | t test | N=3 | yes | N=2 | no | N=1 |
Table S1. Basic characteristics of clinical feature: 'Time to Death'
| Time to Death | Duration (Months) | 0.1-210.9 (median=14.8) |
| censored | N = 179 | |
| death | N = 117 | |
| Significant markers | N = 2 | |
| associated with shorter survival | 1 | |
| associated with longer survival | 1 |
Table S2. Get Full Table List of 2 genes significantly associated with 'Time to Death' by Cox regression test
| HazardRatio | Wald_P | Q | C_index | |
|---|---|---|---|---|
| ZNF266 | 8001 | 2.455e-07 | 0.0043 | 0.608 |
| WIPI1 | 0 | 7.547e-07 | 0.013 | 0.454 |
Figure S1. Get High-res Image As an example, this figure shows the association of ZNF266 to 'Time to Death'. four curves present the cumulative survival rates of 4 quartile subsets of patients. P value = 2.46e-07 with univariate Cox regression analysis using continuous log-2 expression values.
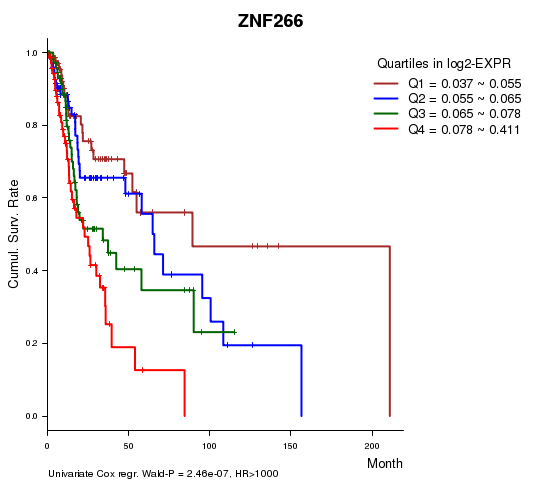
Table S3. Basic characteristics of clinical feature: 'AGE'
| AGE | Mean (SD) | 61.14 (12) |
| Significant markers | N = 4 | |
| pos. correlated | 4 | |
| neg. correlated | 0 |
Table S4. Get Full Table List of 4 genes significantly correlated to 'AGE' by Spearman correlation test
| SpearmanCorr | corrP | Q | |
|---|---|---|---|
| SLC35D3 | 0.3072 | 5.932e-08 | 0.00103 |
| HAND1 | 0.2824 | 6.878e-07 | 0.012 |
| XKR6 | 0.2808 | 8.002e-07 | 0.0139 |
| PRSS27 | 0.2672 | 2.774e-06 | 0.0483 |
Figure S2. Get High-res Image As an example, this figure shows the association of SLC35D3 to 'AGE'. P value = 5.93e-08 with Spearman correlation analysis. The straight line presents the best linear regression.

Table S5. Basic characteristics of clinical feature: 'GENDER'
| GENDER | Labels | N |
| FEMALE | 81 | |
| MALE | 218 | |
| Significant markers | N = 5 | |
| Higher in MALE | 2 | |
| Higher in FEMALE | 3 |
Table S6. Get Full Table List of 5 genes differentially expressed by 'GENDER'
| T(pos if higher in 'MALE') | ttestP | Q | AUC | |
|---|---|---|---|---|
| KIF4B | -11.42 | 1.288e-21 | 2.24e-17 | 0.8553 |
| FRG1B | -5.97 | 2.708e-08 | 0.000472 | 0.7198 |
| SLC22A3 | 5.3 | 2.257e-07 | 0.00393 | 0.5962 |
| NLRP2 | 5.07 | 1.269e-06 | 0.0221 | 0.6906 |
| RPA1 | -4.91 | 1.524e-06 | 0.0265 | 0.5609 |
Figure S3. Get High-res Image As an example, this figure shows the association of KIF4B to 'GENDER'. P value = 1.29e-21 with T-test analysis.

Table S7. Basic characteristics of clinical feature: 'PATHOLOGY.T'
| PATHOLOGY.T | Mean (SD) | 2.92 (1) |
| N | ||
| T1 | 23 | |
| T2 | 77 | |
| T3 | 59 | |
| T4 | 101 | |
| Significant markers | N = 0 |
Table S8. Basic characteristics of clinical feature: 'PATHOLOGY.N'
| PATHOLOGY.N | Mean (SD) | 1.03 (0.96) |
| N | ||
| N0 | 99 | |
| N1 | 32 | |
| N2 | 96 | |
| N3 | 5 | |
| Significant markers | N = 7 | |
| pos. correlated | 7 | |
| neg. correlated | 0 |
Table S9. Get Full Table List of 7 genes significantly correlated to 'PATHOLOGY.N' by Spearman correlation test
| SpearmanCorr | corrP | Q | |
|---|---|---|---|
| SLC47A2 | 0.356 | 2.457e-08 | 0.000428 |
| AVPI1 | 0.3295 | 2.805e-07 | 0.00489 |
| FAM185A | 0.3168 | 8.333e-07 | 0.0145 |
| ARHGAP27 | 0.3158 | 9.112e-07 | 0.0159 |
| ESRRA | 0.3039 | 2.415e-06 | 0.0421 |
| VAMP8 | 0.3031 | 2.559e-06 | 0.0446 |
| BTNL8 | 0.3018 | 2.853e-06 | 0.0497 |
Figure S4. Get High-res Image As an example, this figure shows the association of SLC47A2 to 'PATHOLOGY.N'. P value = 2.46e-08 with Spearman correlation analysis.

Table S10. Basic characteristics of clinical feature: 'TUMOR.STAGE'
| TUMOR.STAGE | Mean (SD) | 3.29 (0.98) |
| N | ||
| Stage 1 | 16 | |
| Stage 2 | 47 | |
| Stage 3 | 40 | |
| Stage 4 | 152 | |
| Significant markers | N = 0 |
7 genes related to 'RADIATIONS.RADIATION.REGIMENINDICATION'.
Table S11. Basic characteristics of clinical feature: 'RADIATIONS.RADIATION.REGIMENINDICATION'
| RADIATIONS.RADIATION.REGIMENINDICATION | Labels | N |
| NO | 75 | |
| YES | 224 | |
| Significant markers | N = 7 | |
| Higher in YES | 1 | |
| Higher in NO | 6 |
Table S12. Get Full Table List of 7 genes differentially expressed by 'RADIATIONS.RADIATION.REGIMENINDICATION'
| T(pos if higher in 'YES') | ttestP | Q | AUC | |
|---|---|---|---|---|
| FLII | 5.7 | 4.461e-08 | 0.000777 | 0.693 |
| ZCCHC17 | -5.65 | 1.054e-07 | 0.00184 | 0.7057 |
| RTN4IP1 | -5.29 | 4.899e-07 | 0.00853 | 0.6849 |
| CKS2 | -5.17 | 8.851e-07 | 0.0154 | 0.6911 |
| RPL7L1 | -5.08 | 1.176e-06 | 0.0205 | 0.6839 |
| EHMT2 | -5.02 | 1.234e-06 | 0.0215 | 0.6693 |
| TMEM57 | -5.01 | 1.786e-06 | 0.0311 | 0.6988 |
Figure S5. Get High-res Image As an example, this figure shows the association of FLII to 'RADIATIONS.RADIATION.REGIMENINDICATION'. P value = 4.46e-08 with T-test analysis.
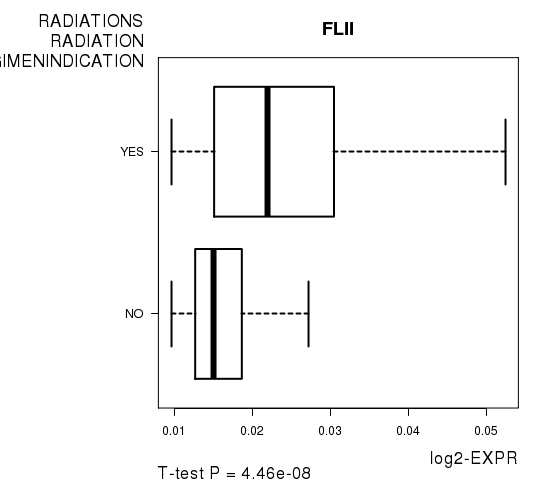
Table S13. Basic characteristics of clinical feature: 'NEOADJUVANT.THERAPY'
| NEOADJUVANT.THERAPY | Labels | N |
| NO | 45 | |
| YES | 254 | |
| Significant markers | N = 3 | |
| Higher in YES | 2 | |
| Higher in NO | 1 |
Table S14. Get Full Table List of 3 genes differentially expressed by 'NEOADJUVANT.THERAPY'
| T(pos if higher in 'YES') | ttestP | Q | AUC | |
|---|---|---|---|---|
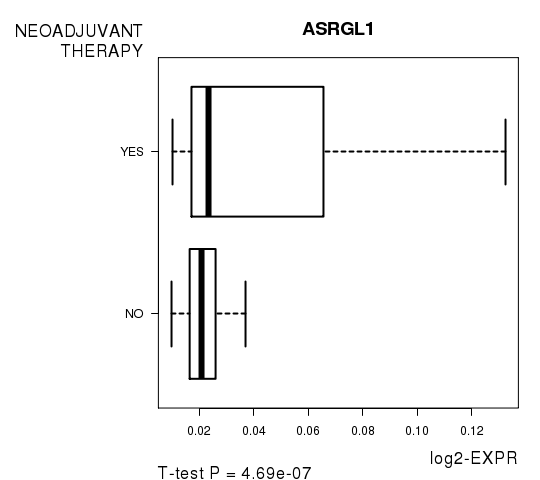
| ASRGL1 | 5.21 | 4.688e-07 | 0.00817 | 0.5897 |
| ZCCHC17 | -5.57 | 6.503e-07 | 0.0113 | 0.7435 |
| BMP6 | 4.93 | 1.496e-06 | 0.0261 | 0.5795 |
Figure S6. Get High-res Image As an example, this figure shows the association of ASRGL1 to 'NEOADJUVANT.THERAPY'. P value = 4.69e-07 with T-test analysis.
-
Expresson data file = HNSC.meth.for_correlation.filtered_data.txt
-
Clinical data file = HNSC.clin.merged.picked.txt
-
Number of patients = 299
-
Number of genes = 17419
-
Number of clinical features = 8
For survival clinical features, Wald's test in univariate Cox regression analysis with proportional hazards model (Andersen and Gill 1982) was used to estimate the P values using the 'coxph' function in R. Kaplan-Meier survival curves were plot using the four quartile subgroups of patients based on expression levels
For continuous numerical clinical features, Spearman's rank correlation coefficients (Spearman 1904) and two-tailed P values were estimated using 'cor.test' function in R
For two-class clinical features, two-tailed Student's t test with unequal variance (Lehmann and Romano 2005) was applied to compare the log2-expression levels between the two clinical classes using 't.test' function in R
For multiple hypothesis correction, Q value is the False Discovery Rate (FDR) analogue of the P value (Benjamini and Hochberg 1995), defined as the minimum FDR at which the test may be called significant. We used the 'Benjamini and Hochberg' method of 'p.adjust' function in R to convert P values into Q values.
This is an experimental feature. The full results of the analysis summarized in this report can be downloaded from the TCGA Data Coordination Center.