This pipeline uses various statistical tests to identify miRs whose expression levels correlated to selected clinical features.
Testing the association between 501 genes and 8 clinical features across 95 samples, statistically thresholded by Q value < 0.05, 5 clinical features related to at least one genes.
-
3 genes correlated to 'Time to Death'.
-
HSA-MIR-141 , HSA-MIR-200C , HSA-MIR-937
-
1 gene correlated to 'GENDER'.
-
HSA-MIR-607
-
9 genes correlated to 'PATHOLOGY.T'.
-
HSA-MIR-217 , HSA-MIR-216A , HSA-MIR-200A , HSA-MIR-452 , HSA-MIR-224 , ...
-
4 genes correlated to 'PATHOLOGICSPREAD(M)'.
-
HSA-MIR-3607 , HSA-MIR-3647 , HSA-MIR-1245 , HSA-MIR-1248
-
10 genes correlated to 'TUMOR.STAGE'.
-
HSA-MIR-200A , HSA-MIR-224 , HSA-MIR-452 , HSA-MIR-216A , HSA-MIR-200B , ...
-
No genes correlated to 'AGE', 'KARNOFSKY.PERFORMANCE.SCORE', and 'PATHOLOGY.N'.
Complete statistical result table is provided in Supplement Table 1
Table 1. Get Full Table This table shows the clinical features, statistical methods used, and the number of genes that are significantly associated with each clinical feature at Q value < 0.05.
| Clinical feature | Statistical test | Significant genes | Associated with | Associated with | ||
|---|---|---|---|---|---|---|
| Time to Death | Cox regression test | N=3 | shorter survival | N=3 | longer survival | N=0 |
| AGE | Spearman correlation test | N=0 | ||||
| GENDER | t test | N=1 | male | N=1 | female | N=0 |
| KARNOFSKY PERFORMANCE SCORE | Spearman correlation test | N=0 | ||||
| PATHOLOGY T | Spearman correlation test | N=9 | higher pT | N=7 | lower pT | N=2 |
| PATHOLOGY N | Spearman correlation test | N=0 | ||||
| PATHOLOGICSPREAD(M) | ANOVA test | N=4 | ||||
| TUMOR STAGE | Spearman correlation test | N=10 | higher stage | N=7 | lower stage | N=3 |
Table S1. Basic characteristics of clinical feature: 'Time to Death'
| Time to Death | Duration (Months) | 0-182.7 (median=15.7) |
| censored | N = 74 | |
| death | N = 14 | |
| Significant markers | N = 3 | |
| associated with shorter survival | 3 | |
| associated with longer survival | 0 |
Table S2. Get Full Table List of 3 genes significantly associated with 'Time to Death' by Cox regression test
| HazardRatio | Wald_P | Q | C_index | |
|---|---|---|---|---|
| HSA-MIR-141 | 1.66 | 1.874e-05 | 0.0094 | 0.764 |
| HSA-MIR-200C | 1.55 | 3.4e-05 | 0.017 | 0.75 |
| HSA-MIR-937 | 4 | 9.431e-05 | 0.047 | 0.849 |
Figure S1. Get High-res Image As an example, this figure shows the association of HSA-MIR-141 to 'Time to Death'. four curves present the cumulative survival rates of 4 quartile subsets of patients. P value = 1.87e-05 with univariate Cox regression analysis using continuous log-2 expression values.
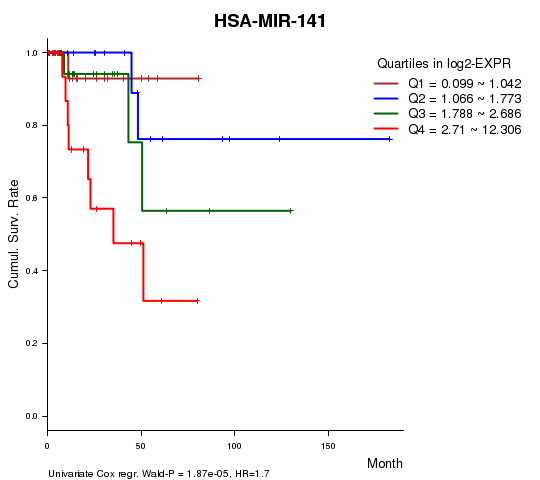
Table S3. Basic characteristics of clinical feature: 'AGE'
| AGE | Mean (SD) | 60.07 (12) |
| Significant markers | N = 0 |
Table S4. Basic characteristics of clinical feature: 'GENDER'
| GENDER | Labels | N |
| FEMALE | 28 | |
| MALE | 67 | |
| Significant markers | N = 1 | |
| Higher in MALE | 1 | |
| Higher in FEMALE | 0 |
Table S5. Get Full Table List of one gene differentially expressed by 'GENDER'
| T(pos if higher in 'MALE') | ttestP | Q | AUC | |
|---|---|---|---|---|
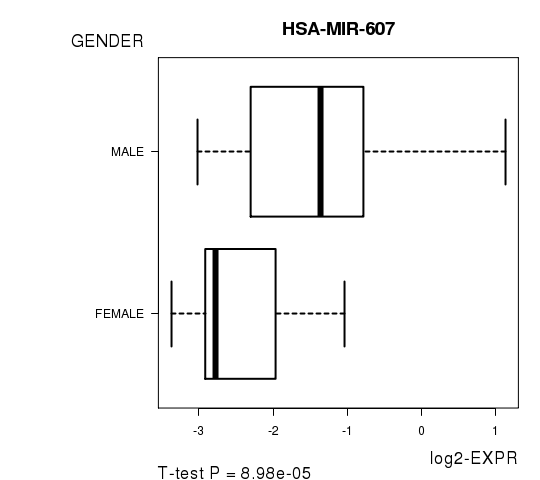
| HSA-MIR-607 | 4.29 | 8.98e-05 | 0.045 | 0.8083 |
Figure S2. Get High-res Image As an example, this figure shows the association of HSA-MIR-607 to 'GENDER'. P value = 8.98e-05 with T-test analysis.
No gene related to 'KARNOFSKY.PERFORMANCE.SCORE'.
Table S6. Basic characteristics of clinical feature: 'KARNOFSKY.PERFORMANCE.SCORE'
| KARNOFSKY.PERFORMANCE.SCORE | Mean (SD) | 87.5 (24) |
| Score | N | |
| 0 | 1 | |
| 40 | 1 | |
| 90 | 9 | |
| 100 | 9 | |
| Significant markers | N = 0 |
Table S7. Basic characteristics of clinical feature: 'PATHOLOGY.T'
| PATHOLOGY.T | Mean (SD) | 1.77 (0.94) |
| N | ||
| T1 | 54 | |
| T2 | 10 | |
| T3 | 30 | |
| T4 | 1 | |
| Significant markers | N = 9 | |
| pos. correlated | 7 | |
| neg. correlated | 2 |
Table S8. Get Full Table List of 9 genes significantly correlated to 'PATHOLOGY.T' by Spearman correlation test
| SpearmanCorr | corrP | Q | |
|---|---|---|---|
| HSA-MIR-217 | 0.5035 | 5.741e-07 | 0.000288 |
| HSA-MIR-216A | 0.6072 | 8.853e-07 | 0.000443 |
| HSA-MIR-200A | -0.4681 | 1.725e-06 | 0.000861 |
| HSA-MIR-452 | 0.4581 | 3.044e-06 | 0.00152 |
| HSA-MIR-224 | 0.4531 | 4.521e-06 | 0.00225 |
| HSA-MIR-1293 | 0.4892 | 7.311e-06 | 0.00363 |
| HSA-MIR-200B | -0.4362 | 9.915e-06 | 0.00491 |
| HSA-MIR-92A-2 | 0.4171 | 2.609e-05 | 0.0129 |
| HSA-MIR-184 | 0.4567 | 9.037e-05 | 0.0446 |
Figure S3. Get High-res Image As an example, this figure shows the association of HSA-MIR-217 to 'PATHOLOGY.T'. P value = 5.74e-07 with Spearman correlation analysis.
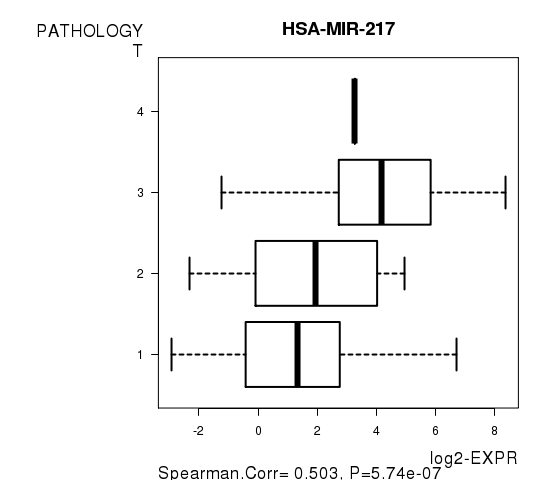
Table S9. Basic characteristics of clinical feature: 'PATHOLOGY.N'
| PATHOLOGY.N | Mean (SD) | 0.55 (0.71) |
| N | ||
| N0 | 19 | |
| N1 | 10 | |
| N2 | 4 | |
| Significant markers | N = 0 |
Table S10. Basic characteristics of clinical feature: 'PATHOLOGICSPREAD(M)'
| PATHOLOGICSPREAD(M) | Labels | N |
| M0 | 54 | |
| M1 | 5 | |
| MX | 27 | |
| Significant markers | N = 4 |
Table S11. Get Full Table List of 4 genes differentially expressed by 'PATHOLOGICSPREAD(M)'
| ANOVA_P | Q | |
|---|---|---|
| HSA-MIR-3607 | 1.475e-06 | 0.000739 |
| HSA-MIR-3647 | 4.108e-06 | 0.00205 |
| HSA-MIR-1245 | 9.513e-06 | 0.00475 |
| HSA-MIR-1248 | 6.129e-05 | 0.0305 |
Figure S4. Get High-res Image As an example, this figure shows the association of HSA-MIR-3607 to 'PATHOLOGICSPREAD(M)'. P value = 1.48e-06 with ANOVA analysis.
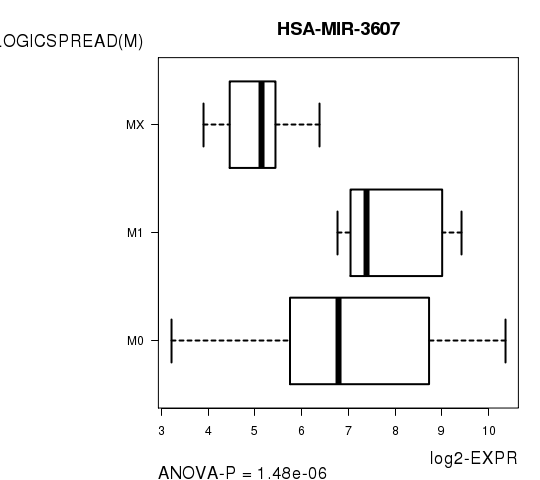
Table S12. Basic characteristics of clinical feature: 'TUMOR.STAGE'
| TUMOR.STAGE | Mean (SD) | 1.89 (1.1) |
| N | ||
| Stage 1 | 49 | |
| Stage 2 | 5 | |
| Stage 3 | 22 | |
| Stage 4 | 9 | |
| Significant markers | N = 10 | |
| pos. correlated | 7 | |
| neg. correlated | 3 |
Table S13. Get Full Table List of 10 genes significantly correlated to 'TUMOR.STAGE' by Spearman correlation test
| SpearmanCorr | corrP | Q | |
|---|---|---|---|
| HSA-MIR-200A | -0.5464 | 6.305e-08 | 3.16e-05 |
| HSA-MIR-224 | 0.5374 | 1.355e-07 | 6.78e-05 |
| HSA-MIR-452 | 0.5274 | 2.143e-07 | 0.000107 |
| HSA-MIR-216A | 0.6346 | 3.347e-07 | 0.000167 |
| HSA-MIR-200B | -0.5037 | 8.929e-07 | 0.000444 |
| HSA-MIR-217 | 0.5102 | 9.735e-07 | 0.000483 |
| HSA-MIR-429 | -0.461 | 8.988e-06 | 0.00445 |
| HSA-MIR-92A-2 | 0.4565 | 1.129e-05 | 0.00558 |
| HSA-MIR-1293 | 0.4674 | 5.141e-05 | 0.0253 |
| HSA-MIR-1269 | 0.449 | 6.006e-05 | 0.0296 |
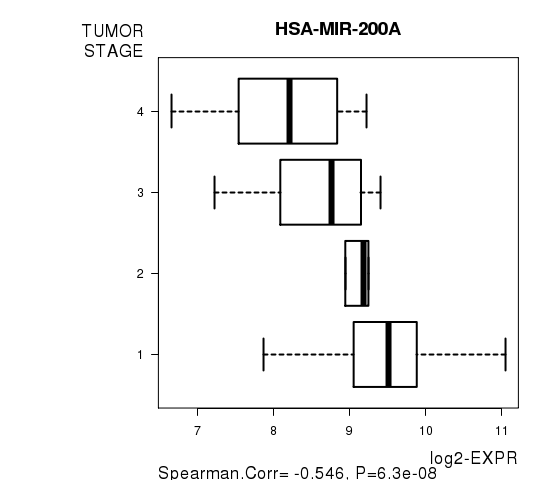
Figure S5. Get High-res Image As an example, this figure shows the association of HSA-MIR-200A to 'TUMOR.STAGE'. P value = 6.3e-08 with Spearman correlation analysis.
-
Expresson data file = KIRP.miRseq_RPKM_log2.txt
-
Clinical data file = KIRP.clin.merged.picked.txt
-
Number of patients = 95
-
Number of genes = 501
-
Number of clinical features = 8
For survival clinical features, Wald's test in univariate Cox regression analysis with proportional hazards model (Andersen and Gill 1982) was used to estimate the P values using the 'coxph' function in R. Kaplan-Meier survival curves were plot using the four quartile subgroups of patients based on expression levels
For continuous numerical clinical features, Spearman's rank correlation coefficients (Spearman 1904) and two-tailed P values were estimated using 'cor.test' function in R
For two-class clinical features, two-tailed Student's t test with unequal variance (Lehmann and Romano 2005) was applied to compare the log2-expression levels between the two clinical classes using 't.test' function in R
For multi-class clinical features (ordinal or nominal), one-way analysis of variance (Howell 2002) was applied to compare the log2-expression levels between different clinical classes using 'anova' function in R
For multiple hypothesis correction, Q value is the False Discovery Rate (FDR) analogue of the P value (Benjamini and Hochberg 1995), defined as the minimum FDR at which the test may be called significant. We used the 'Benjamini and Hochberg' method of 'p.adjust' function in R to convert P values into Q values.
This is an experimental feature. The full results of the analysis summarized in this report can be downloaded from the TCGA Data Coordination Center.