This pipeline computes the correlation between significant arm-level copy number variations (cnvs) and selected clinical features.
Testing the association between copy number variation 49 arm-level results and 7 clinical features across 160 patients, 12 significant findings detected with Q value < 0.25.
-
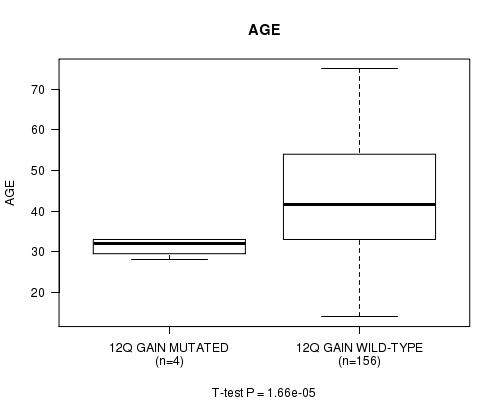
12q gain cnv correlated to 'AGE'.
-
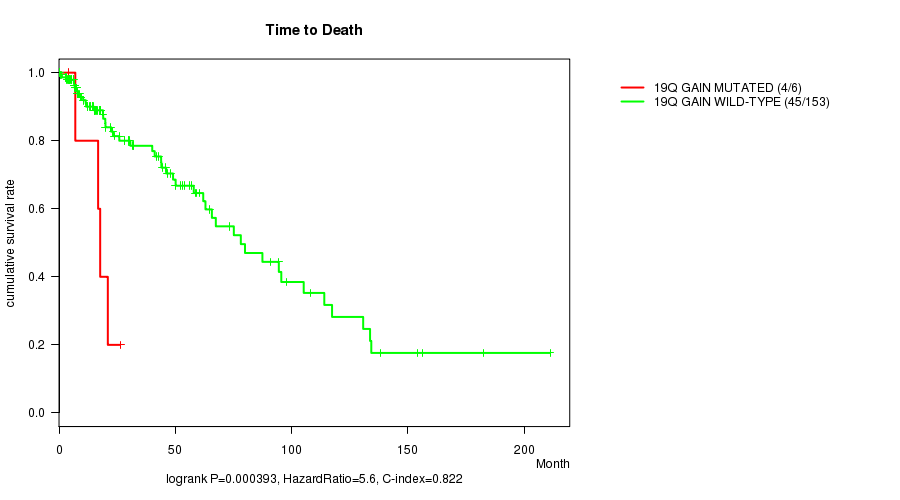
19q gain cnv correlated to 'Time to Death'.
-
20p gain cnv correlated to 'Time to Death'.
-
20q gain cnv correlated to 'Time to Death'.
-
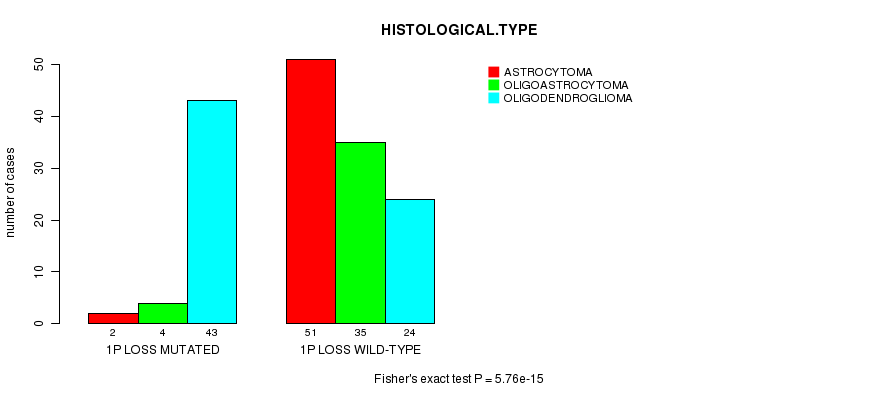
1p loss cnv correlated to 'HISTOLOGICAL.TYPE'.
-
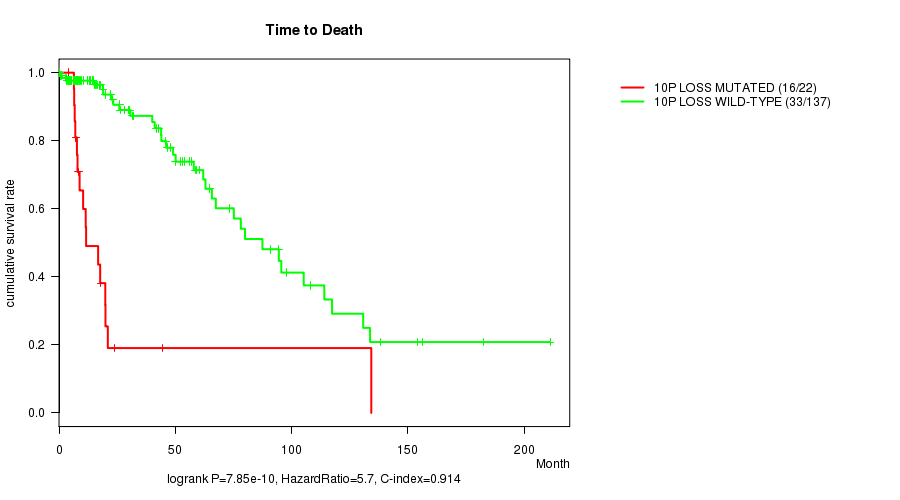
10p loss cnv correlated to 'Time to Death' and 'AGE'.
-
10q loss cnv correlated to 'Time to Death' and 'AGE'.
-
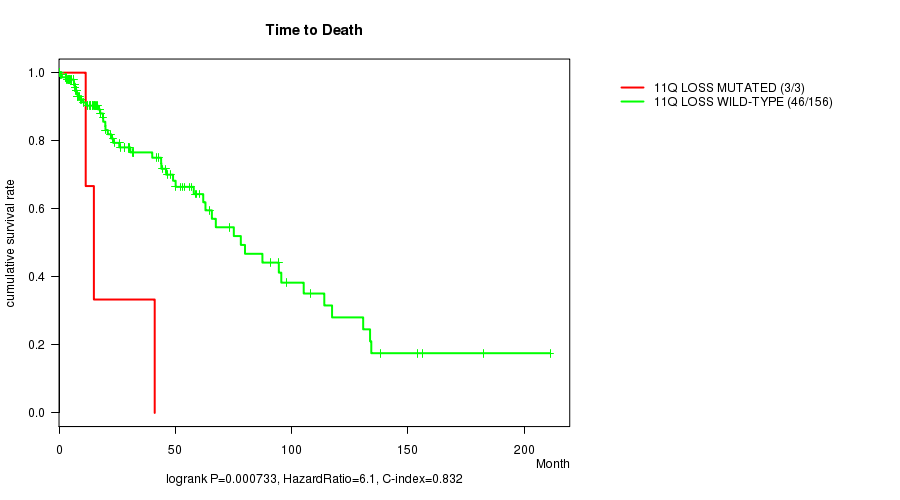
11q loss cnv correlated to 'Time to Death'.
-
19q loss cnv correlated to 'HISTOLOGICAL.TYPE'.
-
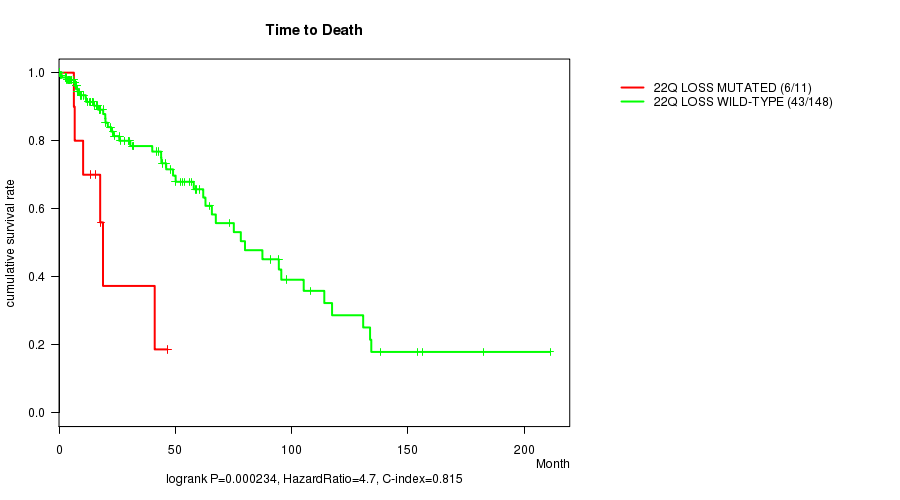
22q loss cnv correlated to 'Time to Death'.
Table 1. Get Full Table Overview of the association between significant copy number variation of 49 arm-level results and 7 clinical features. Shown in the table are P values (Q values). Thresholded by Q value < 0.25, 12 significant findings detected.
|
Clinical Features |
Time to Death |
AGE | GENDER |
KARNOFSKY PERFORMANCE SCORE |
HISTOLOGICAL TYPE |
RADIATIONS RADIATION REGIMENINDICATION |
NEOADJUVANT THERAPY |
||
| nCNV (%) | nWild-Type | logrank test | t-test | Fisher's exact test | t-test | Fisher's exact test | Fisher's exact test | Fisher's exact test | |
| 10p loss | 22 (14%) | 138 |
7.85e-10 (2.54e-07) |
1.93e-05 (0.00619) |
0.25 (1.00) |
0.513 (1.00) |
0.0123 (1.00) |
0.485 (1.00) |
0.648 (1.00) |
| 10q loss | 23 (14%) | 137 |
1.66e-09 (5.36e-07) |
1.05e-05 (0.00337) |
0.173 (1.00) |
0.552 (1.00) |
0.00706 (1.00) |
0.361 (1.00) |
0.501 (1.00) |
| 12q gain | 4 (2%) | 156 |
0.189 (1.00) |
1.66e-05 (0.00532) |
0.137 (1.00) |
0.822 (1.00) |
1 (1.00) |
0.121 (1.00) |
|
| 19q gain | 6 (4%) | 154 |
0.000393 (0.124) |
0.0614 (1.00) |
0.242 (1.00) |
0.298 (1.00) |
0.382 (1.00) |
0.402 (1.00) |
0.682 (1.00) |
| 20p gain | 14 (9%) | 146 |
0.000114 (0.0365) |
0.0595 (1.00) |
0.27 (1.00) |
0.72 (1.00) |
0.221 (1.00) |
0.404 (1.00) |
0.583 (1.00) |
| 20q gain | 12 (8%) | 148 |
0.000285 (0.0903) |
0.107 (1.00) |
0.363 (1.00) |
0.594 (1.00) |
0.355 (1.00) |
0.763 (1.00) |
1 (1.00) |
| 1p loss | 49 (31%) | 111 |
0.158 (1.00) |
0.0127 (1.00) |
0.863 (1.00) |
0.806 (1.00) |
5.76e-15 (1.88e-12) |
0.000802 (0.252) |
0.864 (1.00) |
| 11q loss | 3 (2%) | 157 |
0.000733 (0.231) |
0.212 (1.00) |
0.575 (1.00) |
0.0495 (1.00) |
0.272 (1.00) |
0.613 (1.00) |
|
| 19q loss | 57 (36%) | 103 |
0.215 (1.00) |
0.0245 (1.00) |
0.74 (1.00) |
0.697 (1.00) |
1.09e-10 (3.54e-08) |
0.00415 (1.00) |
0.742 (1.00) |
| 22q loss | 11 (7%) | 149 |
0.000234 (0.0743) |
0.679 (1.00) |
1 (1.00) |
0.223 (1.00) |
0.00357 (1.00) |
0.356 (1.00) |
0.762 (1.00) |
| 1p gain | 5 (3%) | 155 |
0.00534 (1.00) |
0.345 (1.00) |
0.164 (1.00) |
0.00434 (1.00) |
1 (1.00) |
0.202 (1.00) |
|
| 1q gain | 7 (4%) | 153 |
0.263 (1.00) |
0.0159 (1.00) |
0.459 (1.00) |
0.479 (1.00) |
0.484 (1.00) |
0.702 (1.00) |
0.268 (1.00) |
| 7p gain | 28 (18%) | 132 |
0.00929 (1.00) |
0.0576 (1.00) |
0.0955 (1.00) |
0.815 (1.00) |
0.136 (1.00) |
0.0893 (1.00) |
0.837 (1.00) |
| 7q gain | 39 (24%) | 121 |
0.0146 (1.00) |
0.00142 (0.443) |
0.457 (1.00) |
0.747 (1.00) |
0.291 (1.00) |
0.19 (1.00) |
0.717 (1.00) |
| 8p gain | 12 (8%) | 148 |
0.684 (1.00) |
0.827 (1.00) |
0.56 (1.00) |
0.557 (1.00) |
0.355 (1.00) |
0.125 (1.00) |
0.239 (1.00) |
| 8q gain | 15 (9%) | 145 |
0.914 (1.00) |
0.404 (1.00) |
1 (1.00) |
0.7 (1.00) |
0.134 (1.00) |
0.284 (1.00) |
0.179 (1.00) |
| 9p gain | 3 (2%) | 157 |
0.13 (1.00) |
0.0216 (1.00) |
0.575 (1.00) |
0.339 (1.00) |
1 (1.00) |
0.613 (1.00) |
|
| 9q gain | 3 (2%) | 157 |
0.0486 (1.00) |
0.26 (1.00) |
0.575 (1.00) |
0.0495 (1.00) |
0.272 (1.00) |
0.613 (1.00) |
|
| 10p gain | 18 (11%) | 142 |
0.468 (1.00) |
0.0216 (1.00) |
0.213 (1.00) |
0.155 (1.00) |
0.388 (1.00) |
0.312 (1.00) |
1 (1.00) |
| 11p gain | 8 (5%) | 152 |
0.569 (1.00) |
0.407 (1.00) |
1 (1.00) |
0.0922 (1.00) |
0.372 (1.00) |
1 (1.00) |
0.487 (1.00) |
| 11q gain | 13 (8%) | 147 |
0.746 (1.00) |
0.199 (1.00) |
0.399 (1.00) |
0.522 (1.00) |
0.76 (1.00) |
1 (1.00) |
0.777 (1.00) |
| 12p gain | 8 (5%) | 152 |
0.781 (1.00) |
0.00468 (1.00) |
0.0213 (1.00) |
0.53 (1.00) |
1 (1.00) |
0.278 (1.00) |
|
| 18p gain | 3 (2%) | 157 |
0.515 (1.00) |
0.808 (1.00) |
0.575 (1.00) |
0.0495 (1.00) |
0.567 (1.00) |
0.613 (1.00) |
|
| 19p gain | 8 (5%) | 152 |
0.171 (1.00) |
0.0128 (1.00) |
0.468 (1.00) |
0.0818 (1.00) |
0.329 (1.00) |
0.144 (1.00) |
0.487 (1.00) |
| 21q gain | 4 (2%) | 156 |
0.284 (1.00) |
0.948 (1.00) |
0.637 (1.00) |
0.46 (1.00) |
0.647 (1.00) |
0.621 (1.00) |
|
| 1q loss | 7 (4%) | 153 |
0.504 (1.00) |
0.0388 (1.00) |
0.459 (1.00) |
0.122 (1.00) |
0.00499 (1.00) |
1 (1.00) |
1 (1.00) |
| 2p loss | 3 (2%) | 157 |
0.0173 (1.00) |
0.999 (1.00) |
1 (1.00) |
0.109 (1.00) |
1 (1.00) |
1 (1.00) |
|
| 2q loss | 3 (2%) | 157 |
0.522 (1.00) |
0.178 (1.00) |
0.262 (1.00) |
0.109 (1.00) |
0.567 (1.00) |
1 (1.00) |
|
| 3p loss | 3 (2%) | 157 |
0.943 (1.00) |
0.00131 (0.411) |
1 (1.00) |
0.109 (1.00) |
0.0652 (1.00) |
1 (1.00) |
|
| 3q loss | 7 (4%) | 153 |
0.574 (1.00) |
0.852 (1.00) |
0.7 (1.00) |
0.492 (1.00) |
0.29 (1.00) |
1 (1.00) |
0.715 (1.00) |
| 4p loss | 14 (9%) | 146 |
0.125 (1.00) |
0.215 (1.00) |
0.155 (1.00) |
0.513 (1.00) |
0.065 (1.00) |
0.255 (1.00) |
0.583 (1.00) |
| 4q loss | 22 (14%) | 138 |
0.098 (1.00) |
0.722 (1.00) |
0.355 (1.00) |
0.508 (1.00) |
0.516 (1.00) |
0.167 (1.00) |
0.361 (1.00) |
| 5p loss | 10 (6%) | 150 |
0.229 (1.00) |
0.952 (1.00) |
0.519 (1.00) |
0.19 (1.00) |
0.00394 (1.00) |
0.741 (1.00) |
0.527 (1.00) |
| 5q loss | 7 (4%) | 153 |
0.0126 (1.00) |
0.783 (1.00) |
0.459 (1.00) |
0.349 (1.00) |
0.484 (1.00) |
0.242 (1.00) |
1 (1.00) |
| 6p loss | 3 (2%) | 157 |
0.0274 (1.00) |
0.745 (1.00) |
1 (1.00) |
0.862 (1.00) |
0.339 (1.00) |
0.272 (1.00) |
1 (1.00) |
| 6q loss | 17 (11%) | 143 |
0.0288 (1.00) |
0.13 (1.00) |
0.439 (1.00) |
0.217 (1.00) |
0.0234 (1.00) |
0.00139 (0.434) |
0.203 (1.00) |
| 9p loss | 31 (19%) | 129 |
0.00632 (1.00) |
0.0913 (1.00) |
0.689 (1.00) |
0.687 (1.00) |
0.0541 (1.00) |
0.00202 (0.625) |
0.161 (1.00) |
| 9q loss | 4 (2%) | 156 |
0.891 (1.00) |
0.123 (1.00) |
1 (1.00) |
1 (1.00) |
1 (1.00) |
0.621 (1.00) |
|
| 11p loss | 16 (10%) | 144 |
0.116 (1.00) |
0.0518 (1.00) |
1 (1.00) |
1 (1.00) |
0.00152 (0.471) |
0.283 (1.00) |
0.603 (1.00) |
| 12q loss | 7 (4%) | 153 |
0.443 (1.00) |
0.313 (1.00) |
1 (1.00) |
0.0766 (1.00) |
0.702 (1.00) |
1 (1.00) |
|
| 13q loss | 21 (13%) | 139 |
0.364 (1.00) |
0.633 (1.00) |
0.814 (1.00) |
0.976 (1.00) |
0.915 (1.00) |
0.102 (1.00) |
0.486 (1.00) |
| 14q loss | 19 (12%) | 141 |
0.0073 (1.00) |
0.0619 (1.00) |
0.0815 (1.00) |
0.539 (1.00) |
0.315 (1.00) |
0.321 (1.00) |
1 (1.00) |
| 15q loss | 10 (6%) | 150 |
0.541 (1.00) |
0.761 (1.00) |
0.192 (1.00) |
0.0407 (1.00) |
0.0917 (1.00) |
1 (1.00) |
|
| 16q loss | 4 (2%) | 156 |
0.939 (1.00) |
0.192 (1.00) |
1 (1.00) |
0.822 (1.00) |
0.147 (1.00) |
1 (1.00) |
|
| 18p loss | 12 (8%) | 148 |
0.95 (1.00) |
0.386 (1.00) |
1 (1.00) |
0.588 (1.00) |
0.114 (1.00) |
1 (1.00) |
1 (1.00) |
| 18q loss | 14 (9%) | 146 |
0.476 (1.00) |
0.548 (1.00) |
0.582 (1.00) |
0.891 (1.00) |
0.0326 (1.00) |
0.782 (1.00) |
1 (1.00) |
| 19p loss | 6 (4%) | 154 |
0.89 (1.00) |
0.592 (1.00) |
0.7 (1.00) |
0.122 (1.00) |
0.437 (1.00) |
0.688 (1.00) |
1 (1.00) |
| 21q loss | 5 (3%) | 155 |
0.94 (1.00) |
0.812 (1.00) |
1 (1.00) |
0.447 (1.00) |
1 (1.00) |
0.676 (1.00) |
|
| Xq loss | 4 (2%) | 156 |
0.319 (1.00) |
0.592 (1.00) |
1 (1.00) |
0.789 (1.00) |
0.147 (1.00) |
0.358 (1.00) |
P value = 1.66e-05 (t-test), Q value = 0.0053
Table S1. Gene #13: '12q gain mutation analysis' versus Clinical Feature #2: 'AGE'
| nPatients | Mean (Std.Dev) | |
|---|---|---|
| ALL | 160 | 43.3 (13.4) |
| 12Q GAIN MUTATED | 4 | 31.2 (2.4) |
| 12Q GAIN WILD-TYPE | 156 | 43.6 (13.4) |
Figure S1. Get High-res Image Gene #13: '12q gain mutation analysis' versus Clinical Feature #2: 'AGE'
P value = 0.000393 (logrank test), Q value = 0.12
Table S2. Gene #16: '19q gain mutation analysis' versus Clinical Feature #1: 'Time to Death'
| nPatients | nDeath | Duration Range (Median), Month | |
|---|---|---|---|
| ALL | 159 | 49 | 0.0 - 211.2 (17.4) |
| 19Q GAIN MUTATED | 6 | 4 | 4.1 - 26.3 (17.2) |
| 19Q GAIN WILD-TYPE | 153 | 45 | 0.0 - 211.2 (17.4) |
Figure S2. Get High-res Image Gene #16: '19q gain mutation analysis' versus Clinical Feature #1: 'Time to Death'
P value = 0.000114 (logrank test), Q value = 0.037
Table S3. Gene #17: '20p gain mutation analysis' versus Clinical Feature #1: 'Time to Death'
| nPatients | nDeath | Duration Range (Median), Month | |
|---|---|---|---|
| ALL | 159 | 49 | 0.0 - 211.2 (17.4) |
| 20P GAIN MUTATED | 14 | 7 | 3.8 - 41.1 (17.2) |
| 20P GAIN WILD-TYPE | 145 | 42 | 0.0 - 211.2 (17.4) |
Figure S3. Get High-res Image Gene #17: '20p gain mutation analysis' versus Clinical Feature #1: 'Time to Death'

P value = 0.000285 (logrank test), Q value = 0.09
Table S4. Gene #18: '20q gain mutation analysis' versus Clinical Feature #1: 'Time to Death'
| nPatients | nDeath | Duration Range (Median), Month | |
|---|---|---|---|
| ALL | 159 | 49 | 0.0 - 211.2 (17.4) |
| 20Q GAIN MUTATED | 12 | 6 | 4.7 - 41.1 (16.1) |
| 20Q GAIN WILD-TYPE | 147 | 43 | 0.0 - 211.2 (17.5) |
Figure S4. Get High-res Image Gene #18: '20q gain mutation analysis' versus Clinical Feature #1: 'Time to Death'

P value = 5.76e-15 (Fisher's exact test), Q value = 1.9e-12
Table S5. Gene #20: '1p loss mutation analysis' versus Clinical Feature #5: 'HISTOLOGICAL.TYPE'
| nPatients | ASTROCYTOMA | OLIGOASTROCYTOMA | OLIGODENDROGLIOMA |
|---|---|---|---|
| ALL | 53 | 39 | 67 |
| 1P LOSS MUTATED | 2 | 4 | 43 |
| 1P LOSS WILD-TYPE | 51 | 35 | 24 |
Figure S5. Get High-res Image Gene #20: '1p loss mutation analysis' versus Clinical Feature #5: 'HISTOLOGICAL.TYPE'
P value = 7.85e-10 (logrank test), Q value = 2.5e-07
Table S6. Gene #34: '10p loss mutation analysis' versus Clinical Feature #1: 'Time to Death'
| nPatients | nDeath | Duration Range (Median), Month | |
|---|---|---|---|
| ALL | 159 | 49 | 0.0 - 211.2 (17.4) |
| 10P LOSS MUTATED | 22 | 16 | 4.1 - 134.3 (10.9) |
| 10P LOSS WILD-TYPE | 137 | 33 | 0.0 - 211.2 (17.9) |
Figure S6. Get High-res Image Gene #34: '10p loss mutation analysis' versus Clinical Feature #1: 'Time to Death'
P value = 1.93e-05 (t-test), Q value = 0.0062
Table S7. Gene #34: '10p loss mutation analysis' versus Clinical Feature #2: 'AGE'
| nPatients | Mean (Std.Dev) | |
|---|---|---|
| ALL | 160 | 43.3 (13.4) |
| 10P LOSS MUTATED | 22 | 54.6 (11.0) |
| 10P LOSS WILD-TYPE | 138 | 41.5 (12.9) |
Figure S7. Get High-res Image Gene #34: '10p loss mutation analysis' versus Clinical Feature #2: 'AGE'

P value = 1.66e-09 (logrank test), Q value = 5.4e-07
Table S8. Gene #35: '10q loss mutation analysis' versus Clinical Feature #1: 'Time to Death'
| nPatients | nDeath | Duration Range (Median), Month | |
|---|---|---|---|
| ALL | 159 | 49 | 0.0 - 211.2 (17.4) |
| 10Q LOSS MUTATED | 23 | 16 | 4.1 - 134.3 (11.5) |
| 10Q LOSS WILD-TYPE | 136 | 33 | 0.0 - 211.2 (18.4) |
Figure S8. Get High-res Image Gene #35: '10q loss mutation analysis' versus Clinical Feature #1: 'Time to Death'

P value = 1.05e-05 (t-test), Q value = 0.0034
Table S9. Gene #35: '10q loss mutation analysis' versus Clinical Feature #2: 'AGE'
| nPatients | Mean (Std.Dev) | |
|---|---|---|
| ALL | 160 | 43.3 (13.4) |
| 10Q LOSS MUTATED | 23 | 54.4 (10.8) |
| 10Q LOSS WILD-TYPE | 137 | 41.5 (12.9) |
Figure S9. Get High-res Image Gene #35: '10q loss mutation analysis' versus Clinical Feature #2: 'AGE'

P value = 0.000733 (logrank test), Q value = 0.23
Table S10. Gene #37: '11q loss mutation analysis' versus Clinical Feature #1: 'Time to Death'
| nPatients | nDeath | Duration Range (Median), Month | |
|---|---|---|---|
| ALL | 159 | 49 | 0.0 - 211.2 (17.4) |
| 11Q LOSS MUTATED | 3 | 3 | 11.5 - 41.1 (15.0) |
| 11Q LOSS WILD-TYPE | 156 | 46 | 0.0 - 211.2 (17.4) |
Figure S10. Get High-res Image Gene #37: '11q loss mutation analysis' versus Clinical Feature #1: 'Time to Death'
P value = 1.09e-10 (Fisher's exact test), Q value = 3.5e-08
Table S11. Gene #46: '19q loss mutation analysis' versus Clinical Feature #5: 'HISTOLOGICAL.TYPE'
| nPatients | ASTROCYTOMA | OLIGOASTROCYTOMA | OLIGODENDROGLIOMA |
|---|---|---|---|
| ALL | 53 | 39 | 67 |
| 19Q LOSS MUTATED | 8 | 5 | 44 |
| 19Q LOSS WILD-TYPE | 45 | 34 | 23 |
Figure S11. Get High-res Image Gene #46: '19q loss mutation analysis' versus Clinical Feature #5: 'HISTOLOGICAL.TYPE'

P value = 0.000234 (logrank test), Q value = 0.074
Table S12. Gene #48: '22q loss mutation analysis' versus Clinical Feature #1: 'Time to Death'
| nPatients | nDeath | Duration Range (Median), Month | |
|---|---|---|---|
| ALL | 159 | 49 | 0.0 - 211.2 (17.4) |
| 22Q LOSS MUTATED | 11 | 6 | 0.1 - 46.6 (15.8) |
| 22Q LOSS WILD-TYPE | 148 | 43 | 0.0 - 211.2 (17.4) |
Figure S12. Get High-res Image Gene #48: '22q loss mutation analysis' versus Clinical Feature #1: 'Time to Death'
-
Mutation data file = broad_values_by_arm.mutsig.cluster.txt
-
Clinical data file = LGG.clin.merged.picked.txt
-
Number of patients = 160
-
Number of significantly arm-level cnvs = 49
-
Number of selected clinical features = 7
-
Exclude genes that fewer than K tumors have mutations, K = 3
For survival clinical features, the Kaplan-Meier survival curves of tumors with and without gene mutations were plotted and the statistical significance P values were estimated by logrank test (Bland and Altman 2004) using the 'survdiff' function in R
For continuous numerical clinical features, two-tailed Student's t test with unequal variance (Lehmann and Romano 2005) was applied to compare the clinical values between tumors with and without gene mutations using 't.test' function in R
For binary or multi-class clinical features (nominal or ordinal), two-tailed Fisher's exact tests (Fisher 1922) were used to estimate the P values using the 'fisher.test' function in R
For multiple hypothesis correction, Q value is the False Discovery Rate (FDR) analogue of the P value (Benjamini and Hochberg 1995), defined as the minimum FDR at which the test may be called significant. We used the 'Benjamini and Hochberg' method of 'p.adjust' function in R to convert P values into Q values.
This is an experimental feature. The full results of the analysis summarized in this report can be downloaded from the TCGA Data Coordination Center.