This pipeline computes the correlation between cancer subtypes identified by different molecular patterns and selected clinical features.
Testing the association between subtypes identified by 8 different clustering approaches and 7 clinical features across 161 patients, 21 significant findings detected with P value < 0.05.
-
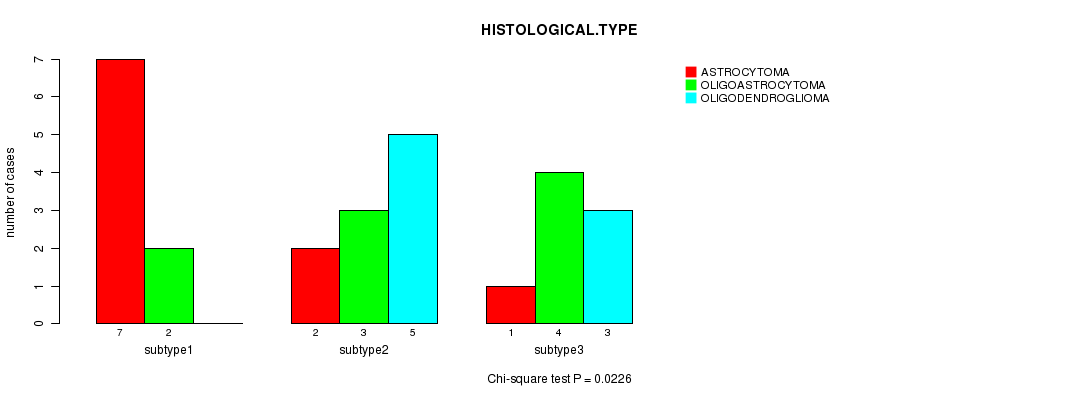
CNMF clustering analysis on array-based mRNA expression data identified 3 subtypes that correlate to 'HISTOLOGICAL.TYPE'.
-
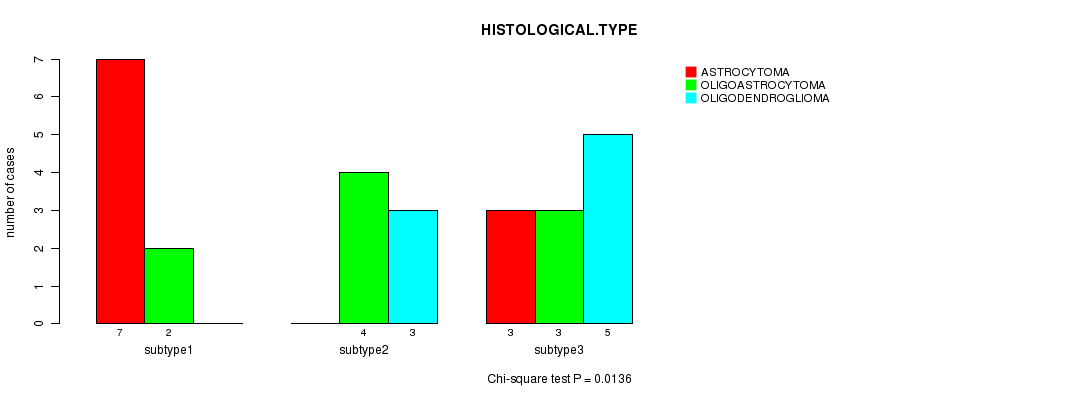
Consensus hierarchical clustering analysis on array-based mRNA expression data identified 3 subtypes that correlate to 'HISTOLOGICAL.TYPE'.
-
3 subtypes identified in current cancer cohort by 'CN CNMF'. These subtypes correlate to 'Time to Death', 'HISTOLOGICAL.TYPE', and 'RADIATIONS.RADIATION.REGIMENINDICATION'.
-
4 subtypes identified in current cancer cohort by 'METHLYATION CNMF'. These subtypes correlate to 'Time to Death', 'AGE', 'HISTOLOGICAL.TYPE', and 'RADIATIONS.RADIATION.REGIMENINDICATION'.
-
CNMF clustering analysis on sequencing-based mRNA expression data identified 4 subtypes that correlate to 'Time to Death', 'HISTOLOGICAL.TYPE', and 'RADIATIONS.RADIATION.REGIMENINDICATION'.
-
Consensus hierarchical clustering analysis on sequencing-based mRNA expression data identified 4 subtypes that correlate to 'Time to Death', 'AGE', 'HISTOLOGICAL.TYPE', and 'RADIATIONS.RADIATION.REGIMENINDICATION'.
-
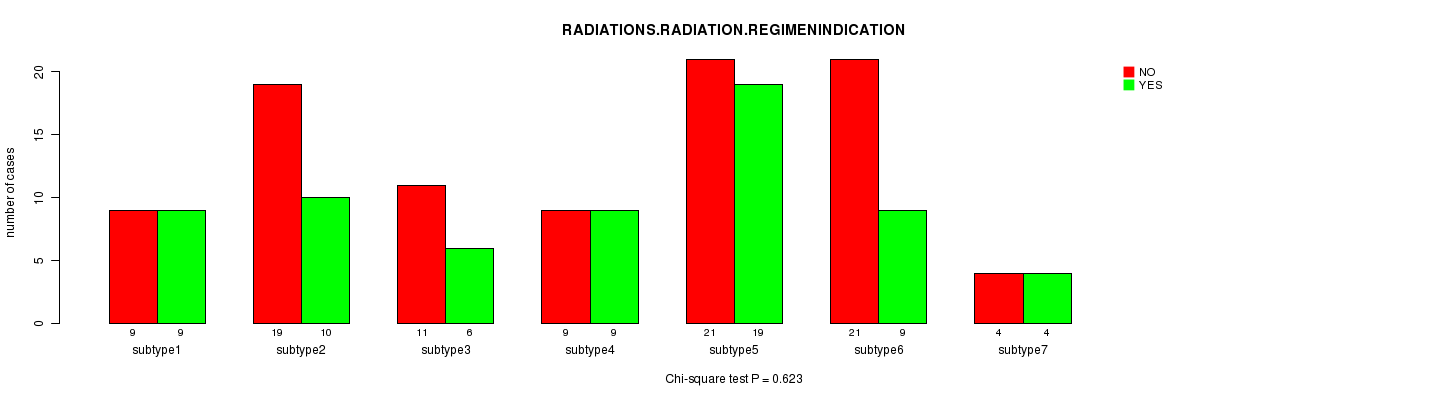
CNMF clustering analysis on sequencing-based miR expression data identified 7 subtypes that correlate to 'Time to Death', 'AGE', and 'HISTOLOGICAL.TYPE'.
-
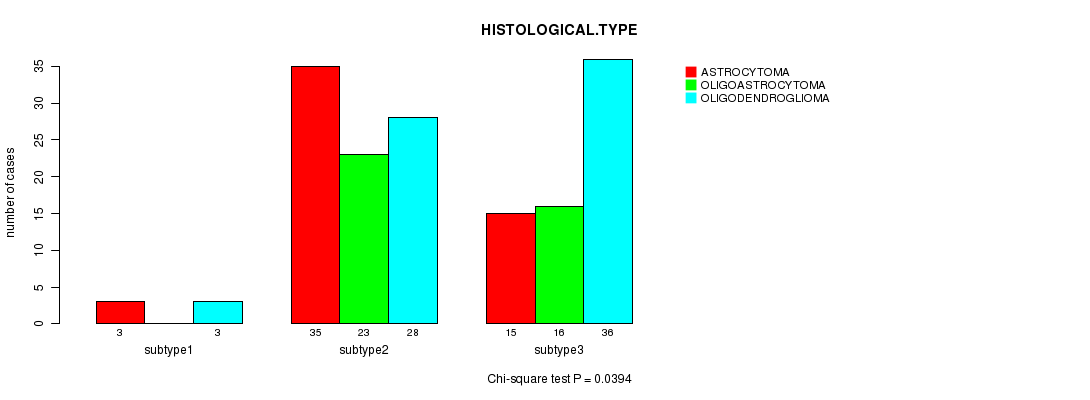
Consensus hierarchical clustering analysis on sequencing-based miR expression data identified 3 subtypes that correlate to 'Time to Death' and 'HISTOLOGICAL.TYPE'.
Table 1. Get Full Table Overview of the association between subtypes identified by 8 different clustering approaches and 7 clinical features. Shown in the table are P values from statistical tests. Thresholded by P value < 0.05, 21 significant findings detected.
|
Clinical Features |
Time to Death |
AGE | GENDER |
KARNOFSKY PERFORMANCE SCORE |
HISTOLOGICAL TYPE |
RADIATIONS RADIATION REGIMENINDICATION |
NEOADJUVANT THERAPY |
| Statistical Tests | logrank test | ANOVA | Fisher's exact test | ANOVA | Chi-square test | Fisher's exact test | Fisher's exact test |
| mRNA CNMF subtypes | 0.0944 | 0.326 | 0.101 | 0.441 | 0.0226 | 0.384 | 0.883 |
| mRNA cHierClus subtypes | 0.126 | 0.467 | 0.172 | 0.441 | 0.0136 | 0.757 | 0.685 |
| CN CNMF | 0.00501 | 0.373 | 0.121 | 0.0563 | 0.000158 | 0.0233 | 0.435 |
| METHLYATION CNMF | 2e-06 | 0.000192 | 0.0538 | 0.563 | 1.25e-11 | 0.0011 | 1 |
| RNAseq CNMF subtypes | 2.47e-05 | 0.0677 | 0.294 | 0.204 | 4.12e-06 | 0.00271 | 0.321 |
| RNAseq cHierClus subtypes | 1.53e-05 | 0.0059 | 0.127 | 0.361 | 1.22e-05 | 0.0151 | 0.621 |
| MIRseq CNMF subtypes | 0.0238 | 0.0342 | 0.241 | 0.122 | 0.00124 | 0.623 | 0.109 |
| MIRseq cHierClus subtypes | 0.0122 | 0.858 | 1 | 0.935 | 0.0394 | 0.162 | 0.187 |
Table S1. Get Full Table Description of clustering approach #1: 'mRNA CNMF subtypes'
| Cluster Labels | 1 | 2 | 3 |
|---|---|---|---|
| Number of samples | 9 | 10 | 8 |
P value = 0.0944 (logrank test)
Table S2. Clustering Approach #1: 'mRNA CNMF subtypes' versus Clinical Feature #1: 'Time to Death'
| nPatients | nDeath | Duration Range (Median), Month | |
|---|---|---|---|
| ALL | 27 | 9 | 0.1 - 134.3 (46.6) |
| subtype1 | 9 | 4 | 10.6 - 130.8 (43.9) |
| subtype2 | 10 | 3 | 0.1 - 78.2 (36.5) |
| subtype3 | 8 | 2 | 14.4 - 134.3 (51.3) |
Figure S1. Get High-res Image Clustering Approach #1: 'mRNA CNMF subtypes' versus Clinical Feature #1: 'Time to Death'

P value = 0.326 (ANOVA)
Table S3. Clustering Approach #1: 'mRNA CNMF subtypes' versus Clinical Feature #2: 'AGE'
| nPatients | Mean (Std.Dev) | |
|---|---|---|
| ALL | 27 | 39.3 (9.1) |
| subtype1 | 9 | 39.2 (6.2) |
| subtype2 | 10 | 42.3 (7.6) |
| subtype3 | 8 | 35.8 (12.6) |
Figure S2. Get High-res Image Clustering Approach #1: 'mRNA CNMF subtypes' versus Clinical Feature #2: 'AGE'

P value = 0.101 (Fisher's exact test)
Table S4. Clustering Approach #1: 'mRNA CNMF subtypes' versus Clinical Feature #3: 'GENDER'
| nPatients | FEMALE | MALE |
|---|---|---|
| ALL | 9 | 18 |
| subtype1 | 2 | 7 |
| subtype2 | 6 | 4 |
| subtype3 | 1 | 7 |
Figure S3. Get High-res Image Clustering Approach #1: 'mRNA CNMF subtypes' versus Clinical Feature #3: 'GENDER'

P value = 0.441 (ANOVA)
Table S5. Clustering Approach #1: 'mRNA CNMF subtypes' versus Clinical Feature #4: 'KARNOFSKY.PERFORMANCE.SCORE'
| nPatients | Mean (Std.Dev) | |
|---|---|---|
| ALL | 17 | 88.8 (12.2) |
| subtype1 | 7 | 84.3 (16.2) |
| subtype2 | 7 | 92.9 (7.6) |
| subtype3 | 3 | 90.0 (10.0) |
Figure S4. Get High-res Image Clustering Approach #1: 'mRNA CNMF subtypes' versus Clinical Feature #4: 'KARNOFSKY.PERFORMANCE.SCORE'

P value = 0.0226 (Chi-square test)
Table S6. Clustering Approach #1: 'mRNA CNMF subtypes' versus Clinical Feature #5: 'HISTOLOGICAL.TYPE'
| nPatients | ASTROCYTOMA | OLIGOASTROCYTOMA | OLIGODENDROGLIOMA |
|---|---|---|---|
| ALL | 10 | 9 | 8 |
| subtype1 | 7 | 2 | 0 |
| subtype2 | 2 | 3 | 5 |
| subtype3 | 1 | 4 | 3 |
Figure S5. Get High-res Image Clustering Approach #1: 'mRNA CNMF subtypes' versus Clinical Feature #5: 'HISTOLOGICAL.TYPE'
P value = 0.384 (Fisher's exact test)
Table S7. Clustering Approach #1: 'mRNA CNMF subtypes' versus Clinical Feature #6: 'RADIATIONS.RADIATION.REGIMENINDICATION'
| nPatients | NO | YES |
|---|---|---|
| ALL | 19 | 8 |
| subtype1 | 7 | 2 |
| subtype2 | 8 | 2 |
| subtype3 | 4 | 4 |
Figure S6. Get High-res Image Clustering Approach #1: 'mRNA CNMF subtypes' versus Clinical Feature #6: 'RADIATIONS.RADIATION.REGIMENINDICATION'

P value = 0.883 (Fisher's exact test)
Table S8. Clustering Approach #1: 'mRNA CNMF subtypes' versus Clinical Feature #7: 'NEOADJUVANT.THERAPY'
| nPatients | NO | YES |
|---|---|---|
| ALL | 17 | 10 |
| subtype1 | 5 | 4 |
| subtype2 | 7 | 3 |
| subtype3 | 5 | 3 |
Figure S7. Get High-res Image Clustering Approach #1: 'mRNA CNMF subtypes' versus Clinical Feature #7: 'NEOADJUVANT.THERAPY'

Table S9. Get Full Table Description of clustering approach #2: 'mRNA cHierClus subtypes'
| Cluster Labels | 1 | 2 | 3 |
|---|---|---|---|
| Number of samples | 9 | 7 | 11 |
P value = 0.126 (logrank test)
Table S10. Clustering Approach #2: 'mRNA cHierClus subtypes' versus Clinical Feature #1: 'Time to Death'
| nPatients | nDeath | Duration Range (Median), Month | |
|---|---|---|---|
| ALL | 27 | 9 | 0.1 - 134.3 (46.6) |
| subtype1 | 9 | 4 | 10.6 - 130.8 (43.9) |
| subtype2 | 7 | 2 | 14.4 - 134.3 (52.4) |
| subtype3 | 11 | 3 | 0.1 - 78.2 (41.1) |
Figure S8. Get High-res Image Clustering Approach #2: 'mRNA cHierClus subtypes' versus Clinical Feature #1: 'Time to Death'

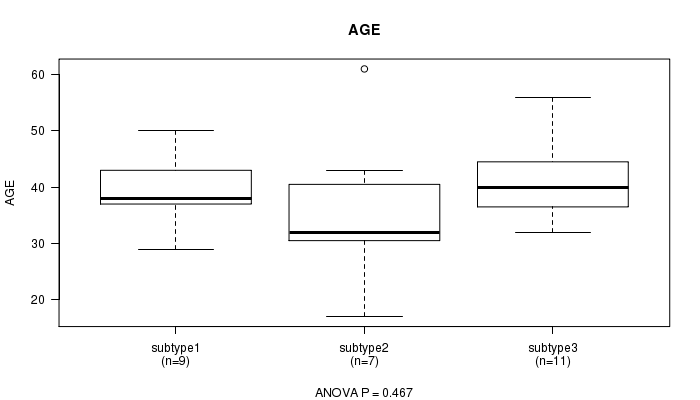
P value = 0.467 (ANOVA)
Table S11. Clustering Approach #2: 'mRNA cHierClus subtypes' versus Clinical Feature #2: 'AGE'
| nPatients | Mean (Std.Dev) | |
|---|---|---|
| ALL | 27 | 39.3 (9.1) |
| subtype1 | 9 | 39.2 (6.2) |
| subtype2 | 7 | 36.0 (13.6) |
| subtype3 | 11 | 41.5 (7.6) |
Figure S9. Get High-res Image Clustering Approach #2: 'mRNA cHierClus subtypes' versus Clinical Feature #2: 'AGE'
P value = 0.172 (Fisher's exact test)
Table S12. Clustering Approach #2: 'mRNA cHierClus subtypes' versus Clinical Feature #3: 'GENDER'
| nPatients | FEMALE | MALE |
|---|---|---|
| ALL | 9 | 18 |
| subtype1 | 2 | 7 |
| subtype2 | 1 | 6 |
| subtype3 | 6 | 5 |
Figure S10. Get High-res Image Clustering Approach #2: 'mRNA cHierClus subtypes' versus Clinical Feature #3: 'GENDER'

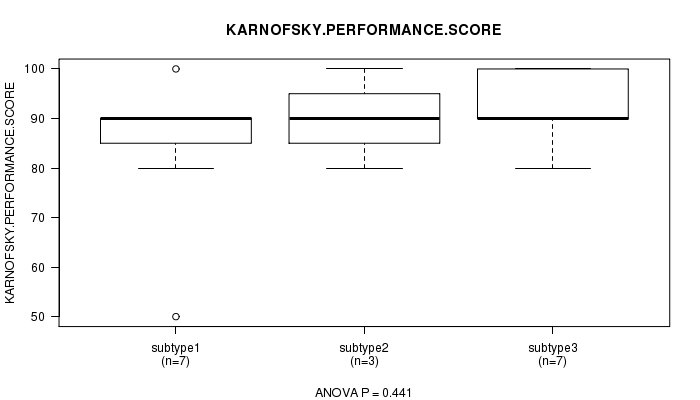
P value = 0.441 (ANOVA)
Table S13. Clustering Approach #2: 'mRNA cHierClus subtypes' versus Clinical Feature #4: 'KARNOFSKY.PERFORMANCE.SCORE'
| nPatients | Mean (Std.Dev) | |
|---|---|---|
| ALL | 17 | 88.8 (12.2) |
| subtype1 | 7 | 84.3 (16.2) |
| subtype2 | 3 | 90.0 (10.0) |
| subtype3 | 7 | 92.9 (7.6) |
Figure S11. Get High-res Image Clustering Approach #2: 'mRNA cHierClus subtypes' versus Clinical Feature #4: 'KARNOFSKY.PERFORMANCE.SCORE'
P value = 0.0136 (Chi-square test)
Table S14. Clustering Approach #2: 'mRNA cHierClus subtypes' versus Clinical Feature #5: 'HISTOLOGICAL.TYPE'
| nPatients | ASTROCYTOMA | OLIGOASTROCYTOMA | OLIGODENDROGLIOMA |
|---|---|---|---|
| ALL | 10 | 9 | 8 |
| subtype1 | 7 | 2 | 0 |
| subtype2 | 0 | 4 | 3 |
| subtype3 | 3 | 3 | 5 |
Figure S12. Get High-res Image Clustering Approach #2: 'mRNA cHierClus subtypes' versus Clinical Feature #5: 'HISTOLOGICAL.TYPE'
P value = 0.757 (Fisher's exact test)
Table S15. Clustering Approach #2: 'mRNA cHierClus subtypes' versus Clinical Feature #6: 'RADIATIONS.RADIATION.REGIMENINDICATION'
| nPatients | NO | YES |
|---|---|---|
| ALL | 19 | 8 |
| subtype1 | 7 | 2 |
| subtype2 | 4 | 3 |
| subtype3 | 8 | 3 |
Figure S13. Get High-res Image Clustering Approach #2: 'mRNA cHierClus subtypes' versus Clinical Feature #6: 'RADIATIONS.RADIATION.REGIMENINDICATION'

P value = 0.685 (Fisher's exact test)
Table S16. Clustering Approach #2: 'mRNA cHierClus subtypes' versus Clinical Feature #7: 'NEOADJUVANT.THERAPY'
| nPatients | NO | YES |
|---|---|---|
| ALL | 17 | 10 |
| subtype1 | 5 | 4 |
| subtype2 | 4 | 3 |
| subtype3 | 8 | 3 |
Figure S14. Get High-res Image Clustering Approach #2: 'mRNA cHierClus subtypes' versus Clinical Feature #7: 'NEOADJUVANT.THERAPY'
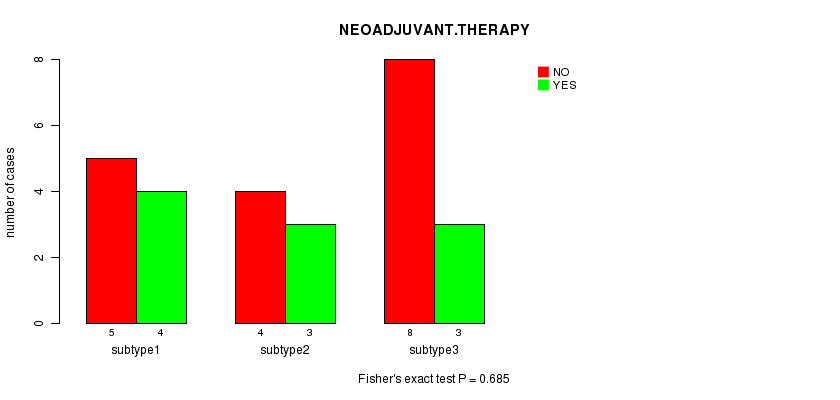
Table S17. Get Full Table Description of clustering approach #3: 'CN CNMF'
| Cluster Labels | 1 | 2 | 3 |
|---|---|---|---|
| Number of samples | 52 | 45 | 63 |
P value = 0.00501 (logrank test)
Table S18. Clustering Approach #3: 'CN CNMF' versus Clinical Feature #1: 'Time to Death'
| nPatients | nDeath | Duration Range (Median), Month | |
|---|---|---|---|
| ALL | 159 | 49 | 0.0 - 211.2 (17.4) |
| subtype1 | 52 | 21 | 0.1 - 211.2 (11.6) |
| subtype2 | 45 | 17 | 1.2 - 156.2 (19.0) |
| subtype3 | 62 | 11 | 0.0 - 182.3 (16.9) |
Figure S15. Get High-res Image Clustering Approach #3: 'CN CNMF' versus Clinical Feature #1: 'Time to Death'

P value = 0.373 (ANOVA)
Table S19. Clustering Approach #3: 'CN CNMF' versus Clinical Feature #2: 'AGE'
| nPatients | Mean (Std.Dev) | |
|---|---|---|
| ALL | 160 | 43.3 (13.4) |
| subtype1 | 52 | 45.5 (13.0) |
| subtype2 | 45 | 42.5 (12.9) |
| subtype3 | 63 | 42.1 (14.0) |
Figure S16. Get High-res Image Clustering Approach #3: 'CN CNMF' versus Clinical Feature #2: 'AGE'

P value = 0.121 (Fisher's exact test)
Table S20. Clustering Approach #3: 'CN CNMF' versus Clinical Feature #3: 'GENDER'
| nPatients | FEMALE | MALE |
|---|---|---|
| ALL | 68 | 92 |
| subtype1 | 28 | 24 |
| subtype2 | 18 | 27 |
| subtype3 | 22 | 41 |
Figure S17. Get High-res Image Clustering Approach #3: 'CN CNMF' versus Clinical Feature #3: 'GENDER'

P value = 0.0563 (ANOVA)
Table S21. Clustering Approach #3: 'CN CNMF' versus Clinical Feature #4: 'KARNOFSKY.PERFORMANCE.SCORE'
| nPatients | Mean (Std.Dev) | |
|---|---|---|
| ALL | 81 | 88.9 (10.6) |
| subtype1 | 29 | 91.7 (6.6) |
| subtype2 | 26 | 85.0 (13.6) |
| subtype3 | 26 | 89.6 (10.0) |
Figure S18. Get High-res Image Clustering Approach #3: 'CN CNMF' versus Clinical Feature #4: 'KARNOFSKY.PERFORMANCE.SCORE'

P value = 0.000158 (Chi-square test)
Table S22. Clustering Approach #3: 'CN CNMF' versus Clinical Feature #5: 'HISTOLOGICAL.TYPE'
| nPatients | ASTROCYTOMA | OLIGOASTROCYTOMA | OLIGODENDROGLIOMA |
|---|---|---|---|
| ALL | 53 | 39 | 67 |
| subtype1 | 26 | 15 | 10 |
| subtype2 | 16 | 11 | 18 |
| subtype3 | 11 | 13 | 39 |
Figure S19. Get High-res Image Clustering Approach #3: 'CN CNMF' versus Clinical Feature #5: 'HISTOLOGICAL.TYPE'

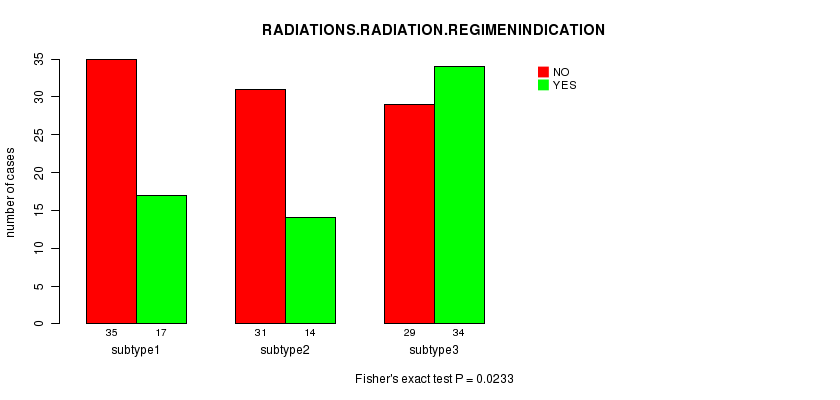
P value = 0.0233 (Fisher's exact test)
Table S23. Clustering Approach #3: 'CN CNMF' versus Clinical Feature #6: 'RADIATIONS.RADIATION.REGIMENINDICATION'
| nPatients | NO | YES |
|---|---|---|
| ALL | 95 | 65 |
| subtype1 | 35 | 17 |
| subtype2 | 31 | 14 |
| subtype3 | 29 | 34 |
Figure S20. Get High-res Image Clustering Approach #3: 'CN CNMF' versus Clinical Feature #6: 'RADIATIONS.RADIATION.REGIMENINDICATION'
P value = 0.435 (Fisher's exact test)
Table S24. Clustering Approach #3: 'CN CNMF' versus Clinical Feature #7: 'NEOADJUVANT.THERAPY'
| nPatients | NO | YES |
|---|---|---|
| ALL | 78 | 82 |
| subtype1 | 22 | 30 |
| subtype2 | 25 | 20 |
| subtype3 | 31 | 32 |
Figure S21. Get High-res Image Clustering Approach #3: 'CN CNMF' versus Clinical Feature #7: 'NEOADJUVANT.THERAPY'
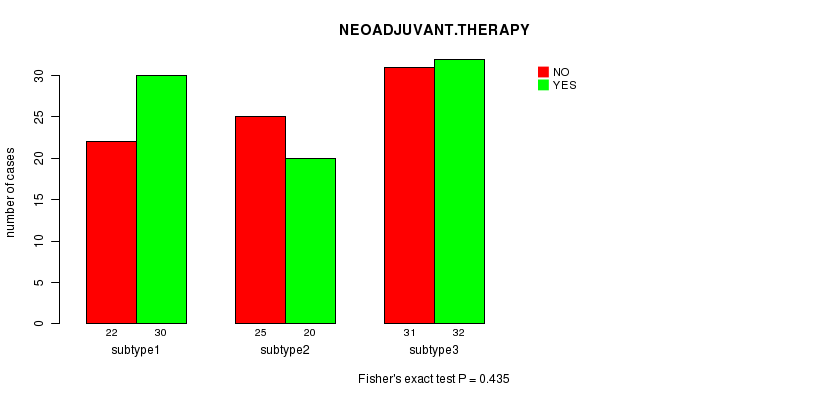
Table S25. Get Full Table Description of clustering approach #4: 'METHLYATION CNMF'
| Cluster Labels | 1 | 2 | 3 | 4 |
|---|---|---|---|---|
| Number of samples | 76 | 25 | 11 | 44 |
P value = 2e-06 (logrank test)
Table S26. Clustering Approach #4: 'METHLYATION CNMF' versus Clinical Feature #1: 'Time to Death'
| nPatients | nDeath | Duration Range (Median), Month | |
|---|---|---|---|
| ALL | 155 | 45 | 0.0 - 211.2 (17.3) |
| subtype1 | 76 | 20 | 0.0 - 156.2 (19.0) |
| subtype2 | 25 | 15 | 0.1 - 211.2 (10.4) |
| subtype3 | 11 | 2 | 0.1 - 97.9 (14.3) |
| subtype4 | 43 | 8 | 0.1 - 182.3 (16.2) |
Figure S22. Get High-res Image Clustering Approach #4: 'METHLYATION CNMF' versus Clinical Feature #1: 'Time to Death'

P value = 0.000192 (ANOVA)
Table S27. Clustering Approach #4: 'METHLYATION CNMF' versus Clinical Feature #2: 'AGE'
| nPatients | Mean (Std.Dev) | |
|---|---|---|
| ALL | 156 | 43.2 (13.4) |
| subtype1 | 76 | 39.3 (12.0) |
| subtype2 | 25 | 50.1 (14.3) |
| subtype3 | 11 | 38.3 (13.7) |
| subtype4 | 44 | 47.3 (12.5) |
Figure S23. Get High-res Image Clustering Approach #4: 'METHLYATION CNMF' versus Clinical Feature #2: 'AGE'

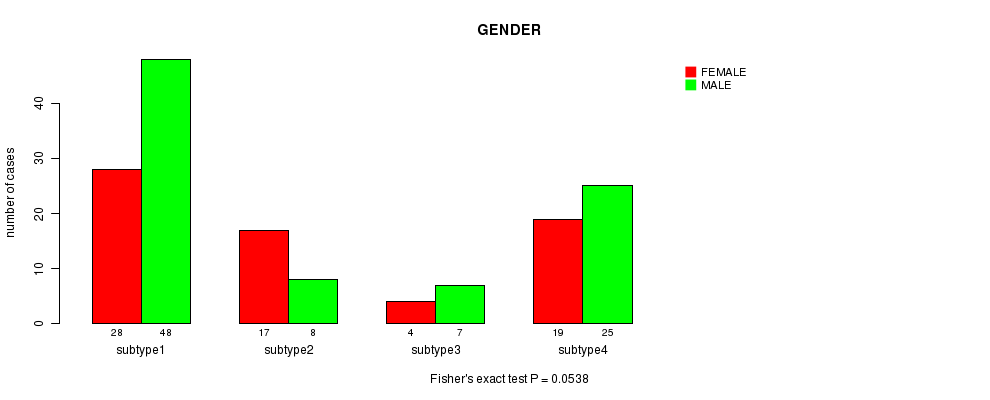
P value = 0.0538 (Fisher's exact test)
Table S28. Clustering Approach #4: 'METHLYATION CNMF' versus Clinical Feature #3: 'GENDER'
| nPatients | FEMALE | MALE |
|---|---|---|
| ALL | 68 | 88 |
| subtype1 | 28 | 48 |
| subtype2 | 17 | 8 |
| subtype3 | 4 | 7 |
| subtype4 | 19 | 25 |
Figure S24. Get High-res Image Clustering Approach #4: 'METHLYATION CNMF' versus Clinical Feature #3: 'GENDER'
P value = 0.563 (ANOVA)
Table S29. Clustering Approach #4: 'METHLYATION CNMF' versus Clinical Feature #4: 'KARNOFSKY.PERFORMANCE.SCORE'
| nPatients | Mean (Std.Dev) | |
|---|---|---|
| ALL | 80 | 89.0 (10.6) |
| subtype1 | 43 | 89.3 (10.8) |
| subtype2 | 14 | 87.9 (5.8) |
| subtype3 | 4 | 82.5 (9.6) |
| subtype4 | 19 | 90.5 (13.1) |
Figure S25. Get High-res Image Clustering Approach #4: 'METHLYATION CNMF' versus Clinical Feature #4: 'KARNOFSKY.PERFORMANCE.SCORE'

P value = 1.25e-11 (Chi-square test)
Table S30. Clustering Approach #4: 'METHLYATION CNMF' versus Clinical Feature #5: 'HISTOLOGICAL.TYPE'
| nPatients | ASTROCYTOMA | OLIGOASTROCYTOMA | OLIGODENDROGLIOMA |
|---|---|---|---|
| ALL | 52 | 38 | 65 |
| subtype1 | 31 | 26 | 18 |
| subtype2 | 16 | 6 | 3 |
| subtype3 | 4 | 2 | 5 |
| subtype4 | 1 | 4 | 39 |
Figure S26. Get High-res Image Clustering Approach #4: 'METHLYATION CNMF' versus Clinical Feature #5: 'HISTOLOGICAL.TYPE'

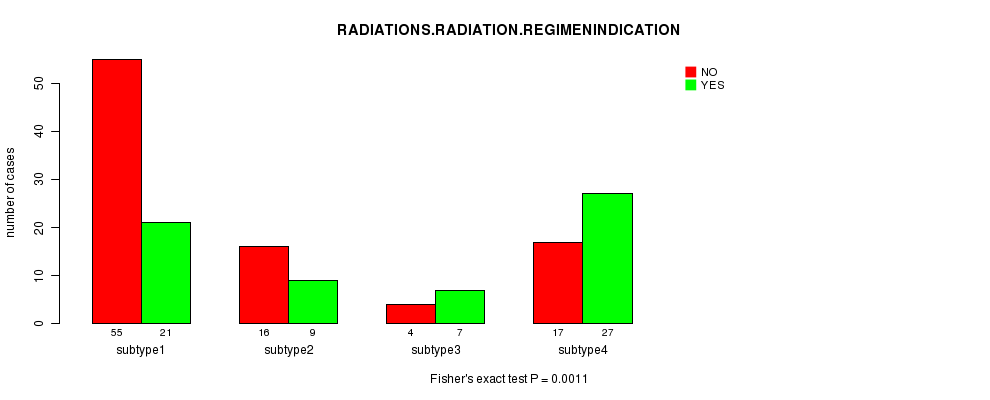
P value = 0.0011 (Fisher's exact test)
Table S31. Clustering Approach #4: 'METHLYATION CNMF' versus Clinical Feature #6: 'RADIATIONS.RADIATION.REGIMENINDICATION'
| nPatients | NO | YES |
|---|---|---|
| ALL | 92 | 64 |
| subtype1 | 55 | 21 |
| subtype2 | 16 | 9 |
| subtype3 | 4 | 7 |
| subtype4 | 17 | 27 |
Figure S27. Get High-res Image Clustering Approach #4: 'METHLYATION CNMF' versus Clinical Feature #6: 'RADIATIONS.RADIATION.REGIMENINDICATION'
P value = 1 (Fisher's exact test)
Table S32. Clustering Approach #4: 'METHLYATION CNMF' versus Clinical Feature #7: 'NEOADJUVANT.THERAPY'
| nPatients | NO | YES |
|---|---|---|
| ALL | 77 | 79 |
| subtype1 | 38 | 38 |
| subtype2 | 12 | 13 |
| subtype3 | 5 | 6 |
| subtype4 | 22 | 22 |
Figure S28. Get High-res Image Clustering Approach #4: 'METHLYATION CNMF' versus Clinical Feature #7: 'NEOADJUVANT.THERAPY'
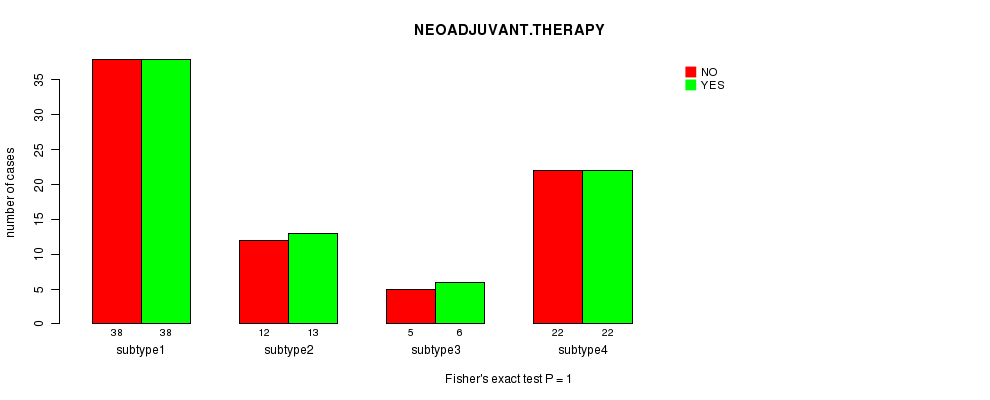
Table S33. Get Full Table Description of clustering approach #5: 'RNAseq CNMF subtypes'
| Cluster Labels | 1 | 2 | 3 | 4 |
|---|---|---|---|---|
| Number of samples | 23 | 29 | 24 | 34 |
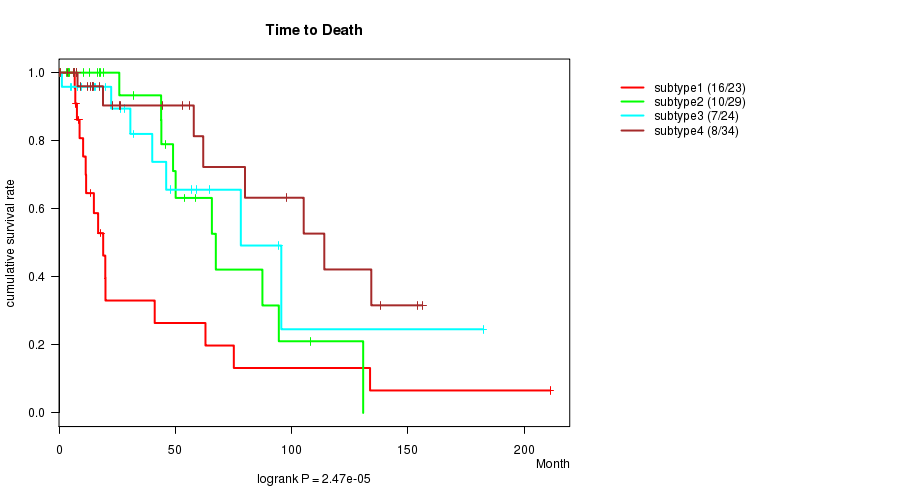
P value = 2.47e-05 (logrank test)
Table S34. Clustering Approach #5: 'RNAseq CNMF subtypes' versus Clinical Feature #1: 'Time to Death'
| nPatients | nDeath | Duration Range (Median), Month | |
|---|---|---|---|
| ALL | 110 | 41 | 0.0 - 211.2 (19.0) |
| subtype1 | 23 | 16 | 4.1 - 211.2 (13.4) |
| subtype2 | 29 | 10 | 0.0 - 130.8 (25.9) |
| subtype3 | 24 | 7 | 1.2 - 182.3 (29.4) |
| subtype4 | 34 | 8 | 0.1 - 156.2 (18.2) |
Figure S29. Get High-res Image Clustering Approach #5: 'RNAseq CNMF subtypes' versus Clinical Feature #1: 'Time to Death'
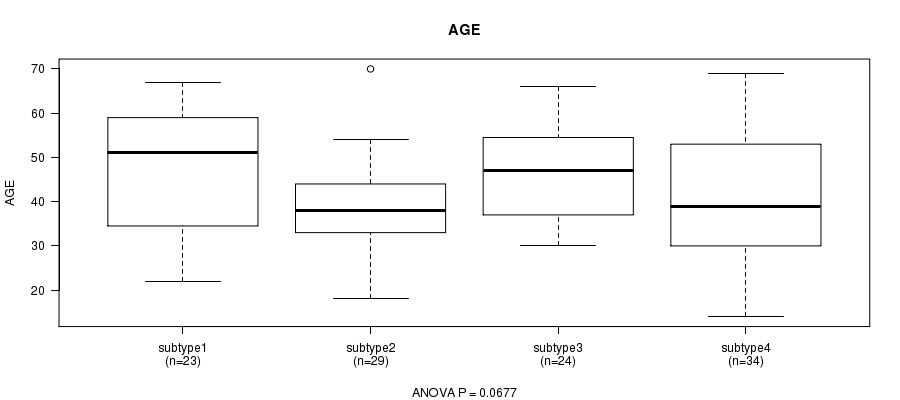
P value = 0.0677 (ANOVA)
Table S35. Clustering Approach #5: 'RNAseq CNMF subtypes' versus Clinical Feature #2: 'AGE'
| nPatients | Mean (Std.Dev) | |
|---|---|---|
| ALL | 110 | 42.9 (12.9) |
| subtype1 | 23 | 46.8 (14.3) |
| subtype2 | 29 | 39.5 (10.3) |
| subtype3 | 24 | 46.6 (10.8) |
| subtype4 | 34 | 40.7 (14.3) |
Figure S30. Get High-res Image Clustering Approach #5: 'RNAseq CNMF subtypes' versus Clinical Feature #2: 'AGE'
P value = 0.294 (Fisher's exact test)
Table S36. Clustering Approach #5: 'RNAseq CNMF subtypes' versus Clinical Feature #3: 'GENDER'
| nPatients | FEMALE | MALE |
|---|---|---|
| ALL | 50 | 60 |
| subtype1 | 14 | 9 |
| subtype2 | 11 | 18 |
| subtype3 | 12 | 12 |
| subtype4 | 13 | 21 |
Figure S31. Get High-res Image Clustering Approach #5: 'RNAseq CNMF subtypes' versus Clinical Feature #3: 'GENDER'

P value = 0.204 (ANOVA)
Table S37. Clustering Approach #5: 'RNAseq CNMF subtypes' versus Clinical Feature #4: 'KARNOFSKY.PERFORMANCE.SCORE'
| nPatients | Mean (Std.Dev) | |
|---|---|---|
| ALL | 58 | 88.6 (11.0) |
| subtype1 | 14 | 88.6 (5.3) |
| subtype2 | 17 | 92.9 (5.9) |
| subtype3 | 13 | 84.6 (18.1) |
| subtype4 | 14 | 87.1 (10.7) |
Figure S32. Get High-res Image Clustering Approach #5: 'RNAseq CNMF subtypes' versus Clinical Feature #4: 'KARNOFSKY.PERFORMANCE.SCORE'

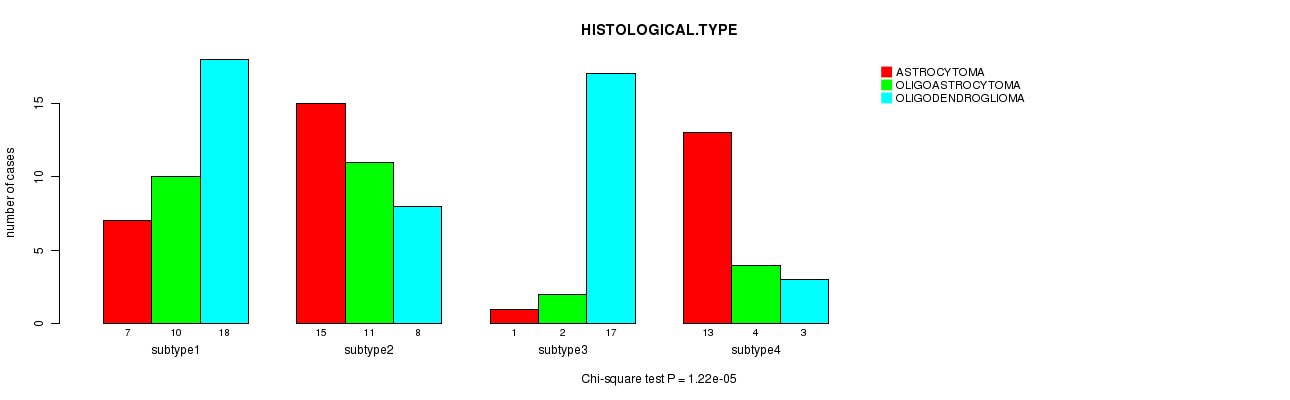
P value = 4.12e-06 (Chi-square test)
Table S38. Clustering Approach #5: 'RNAseq CNMF subtypes' versus Clinical Feature #5: 'HISTOLOGICAL.TYPE'
| nPatients | ASTROCYTOMA | OLIGOASTROCYTOMA | OLIGODENDROGLIOMA |
|---|---|---|---|
| ALL | 36 | 27 | 46 |
| subtype1 | 15 | 5 | 3 |
| subtype2 | 13 | 9 | 7 |
| subtype3 | 1 | 3 | 20 |
| subtype4 | 7 | 10 | 16 |
Figure S33. Get High-res Image Clustering Approach #5: 'RNAseq CNMF subtypes' versus Clinical Feature #5: 'HISTOLOGICAL.TYPE'

P value = 0.00271 (Fisher's exact test)
Table S39. Clustering Approach #5: 'RNAseq CNMF subtypes' versus Clinical Feature #6: 'RADIATIONS.RADIATION.REGIMENINDICATION'
| nPatients | NO | YES |
|---|---|---|
| ALL | 66 | 44 |
| subtype1 | 17 | 6 |
| subtype2 | 23 | 6 |
| subtype3 | 8 | 16 |
| subtype4 | 18 | 16 |
Figure S34. Get High-res Image Clustering Approach #5: 'RNAseq CNMF subtypes' versus Clinical Feature #6: 'RADIATIONS.RADIATION.REGIMENINDICATION'

P value = 0.321 (Fisher's exact test)
Table S40. Clustering Approach #5: 'RNAseq CNMF subtypes' versus Clinical Feature #7: 'NEOADJUVANT.THERAPY'
| nPatients | NO | YES |
|---|---|---|
| ALL | 54 | 56 |
| subtype1 | 12 | 11 |
| subtype2 | 10 | 19 |
| subtype3 | 14 | 10 |
| subtype4 | 18 | 16 |
Figure S35. Get High-res Image Clustering Approach #5: 'RNAseq CNMF subtypes' versus Clinical Feature #7: 'NEOADJUVANT.THERAPY'
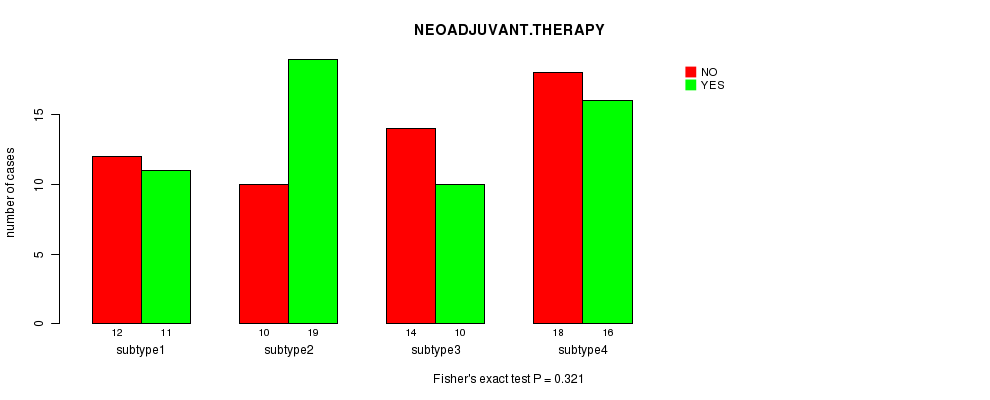
Table S41. Get Full Table Description of clustering approach #6: 'RNAseq cHierClus subtypes'
| Cluster Labels | 1 | 2 | 3 | 4 |
|---|---|---|---|---|
| Number of samples | 35 | 35 | 20 | 20 |
P value = 1.53e-05 (logrank test)
Table S42. Clustering Approach #6: 'RNAseq cHierClus subtypes' versus Clinical Feature #1: 'Time to Death'
| nPatients | nDeath | Duration Range (Median), Month | |
|---|---|---|---|
| ALL | 110 | 41 | 0.0 - 211.2 (19.0) |
| subtype1 | 35 | 8 | 0.1 - 156.2 (17.4) |
| subtype2 | 35 | 12 | 0.0 - 130.8 (25.9) |
| subtype3 | 20 | 7 | 4.8 - 182.3 (31.2) |
| subtype4 | 20 | 14 | 4.1 - 211.2 (12.5) |
Figure S36. Get High-res Image Clustering Approach #6: 'RNAseq cHierClus subtypes' versus Clinical Feature #1: 'Time to Death'

P value = 0.0059 (ANOVA)
Table S43. Clustering Approach #6: 'RNAseq cHierClus subtypes' versus Clinical Feature #2: 'AGE'
| nPatients | Mean (Std.Dev) | |
|---|---|---|
| ALL | 110 | 42.9 (12.9) |
| subtype1 | 35 | 42.8 (14.3) |
| subtype2 | 35 | 37.7 (10.5) |
| subtype3 | 20 | 45.9 (10.6) |
| subtype4 | 20 | 49.5 (13.2) |
Figure S37. Get High-res Image Clustering Approach #6: 'RNAseq cHierClus subtypes' versus Clinical Feature #2: 'AGE'

P value = 0.127 (Fisher's exact test)
Table S44. Clustering Approach #6: 'RNAseq cHierClus subtypes' versus Clinical Feature #3: 'GENDER'
| nPatients | FEMALE | MALE |
|---|---|---|
| ALL | 50 | 60 |
| subtype1 | 13 | 22 |
| subtype2 | 13 | 22 |
| subtype3 | 11 | 9 |
| subtype4 | 13 | 7 |
Figure S38. Get High-res Image Clustering Approach #6: 'RNAseq cHierClus subtypes' versus Clinical Feature #3: 'GENDER'

P value = 0.361 (ANOVA)
Table S45. Clustering Approach #6: 'RNAseq cHierClus subtypes' versus Clinical Feature #4: 'KARNOFSKY.PERFORMANCE.SCORE'
| nPatients | Mean (Std.Dev) | |
|---|---|---|
| ALL | 58 | 88.6 (11.0) |
| subtype1 | 14 | 84.3 (14.5) |
| subtype2 | 20 | 90.5 (11.0) |
| subtype3 | 12 | 90.8 (10.0) |
| subtype4 | 12 | 88.3 (5.8) |
Figure S39. Get High-res Image Clustering Approach #6: 'RNAseq cHierClus subtypes' versus Clinical Feature #4: 'KARNOFSKY.PERFORMANCE.SCORE'

P value = 1.22e-05 (Chi-square test)
Table S46. Clustering Approach #6: 'RNAseq cHierClus subtypes' versus Clinical Feature #5: 'HISTOLOGICAL.TYPE'
| nPatients | ASTROCYTOMA | OLIGOASTROCYTOMA | OLIGODENDROGLIOMA |
|---|---|---|---|
| ALL | 36 | 27 | 46 |
| subtype1 | 7 | 10 | 18 |
| subtype2 | 15 | 11 | 8 |
| subtype3 | 1 | 2 | 17 |
| subtype4 | 13 | 4 | 3 |
Figure S40. Get High-res Image Clustering Approach #6: 'RNAseq cHierClus subtypes' versus Clinical Feature #5: 'HISTOLOGICAL.TYPE'
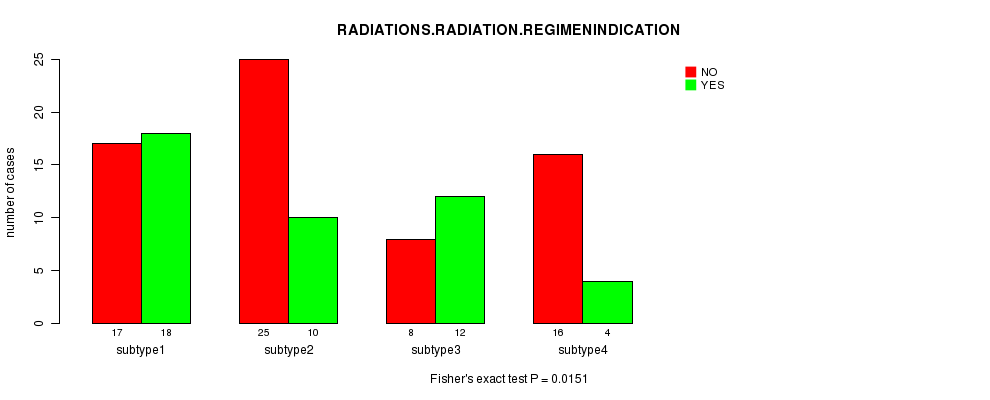
P value = 0.0151 (Fisher's exact test)
Table S47. Clustering Approach #6: 'RNAseq cHierClus subtypes' versus Clinical Feature #6: 'RADIATIONS.RADIATION.REGIMENINDICATION'
| nPatients | NO | YES |
|---|---|---|
| ALL | 66 | 44 |
| subtype1 | 17 | 18 |
| subtype2 | 25 | 10 |
| subtype3 | 8 | 12 |
| subtype4 | 16 | 4 |
Figure S41. Get High-res Image Clustering Approach #6: 'RNAseq cHierClus subtypes' versus Clinical Feature #6: 'RADIATIONS.RADIATION.REGIMENINDICATION'
P value = 0.621 (Fisher's exact test)
Table S48. Clustering Approach #6: 'RNAseq cHierClus subtypes' versus Clinical Feature #7: 'NEOADJUVANT.THERAPY'
| nPatients | NO | YES |
|---|---|---|
| ALL | 54 | 56 |
| subtype1 | 18 | 17 |
| subtype2 | 14 | 21 |
| subtype3 | 11 | 9 |
| subtype4 | 11 | 9 |
Figure S42. Get High-res Image Clustering Approach #6: 'RNAseq cHierClus subtypes' versus Clinical Feature #7: 'NEOADJUVANT.THERAPY'

Table S49. Get Full Table Description of clustering approach #7: 'MIRseq CNMF subtypes'
| Cluster Labels | 1 | 2 | 3 | 4 | 5 | 6 | 7 |
|---|---|---|---|---|---|---|---|
| Number of samples | 18 | 29 | 17 | 18 | 40 | 30 | 8 |
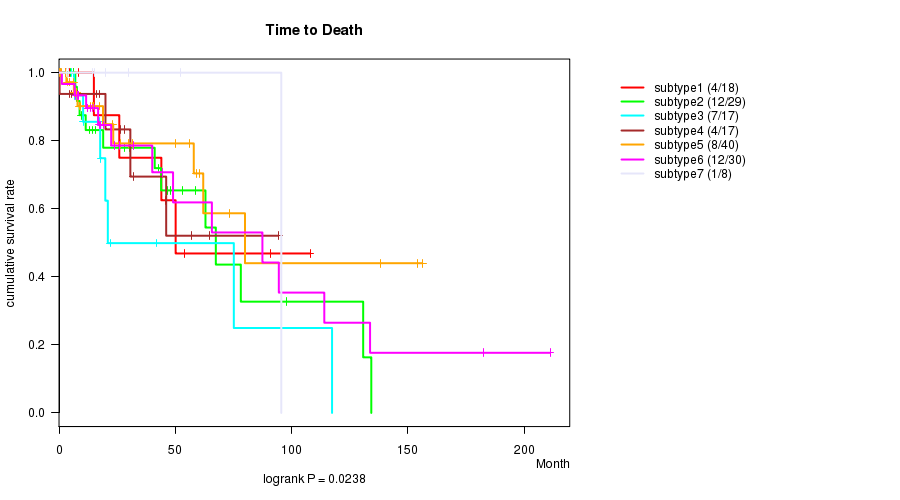
P value = 0.0238 (logrank test)
Table S50. Clustering Approach #7: 'MIRseq CNMF subtypes' versus Clinical Feature #1: 'Time to Death'
| nPatients | nDeath | Duration Range (Median), Month | |
|---|---|---|---|
| ALL | 159 | 48 | 0.0 - 211.2 (17.4) |
| subtype1 | 18 | 4 | 0.0 - 107.9 (7.2) |
| subtype2 | 29 | 12 | 0.1 - 134.3 (28.2) |
| subtype3 | 17 | 7 | 0.8 - 117.4 (17.5) |
| subtype4 | 17 | 4 | 0.1 - 94.3 (20.0) |
| subtype5 | 40 | 8 | 0.1 - 156.2 (14.0) |
| subtype6 | 30 | 12 | 1.2 - 211.2 (18.4) |
| subtype7 | 8 | 1 | 3.1 - 95.6 (17.7) |
Figure S43. Get High-res Image Clustering Approach #7: 'MIRseq CNMF subtypes' versus Clinical Feature #1: 'Time to Death'
P value = 0.0342 (ANOVA)
Table S51. Clustering Approach #7: 'MIRseq CNMF subtypes' versus Clinical Feature #2: 'AGE'
| nPatients | Mean (Std.Dev) | |
|---|---|---|
| ALL | 160 | 43.5 (13.3) |
| subtype1 | 18 | 37.9 (12.1) |
| subtype2 | 29 | 42.0 (11.3) |
| subtype3 | 17 | 47.4 (13.1) |
| subtype4 | 18 | 49.7 (13.6) |
| subtype5 | 40 | 41.5 (13.6) |
| subtype6 | 30 | 46.6 (14.0) |
| subtype7 | 8 | 36.8 (11.8) |
Figure S44. Get High-res Image Clustering Approach #7: 'MIRseq CNMF subtypes' versus Clinical Feature #2: 'AGE'

P value = 0.241 (Chi-square test)
Table S52. Clustering Approach #7: 'MIRseq CNMF subtypes' versus Clinical Feature #3: 'GENDER'
| nPatients | FEMALE | MALE |
|---|---|---|
| ALL | 68 | 92 |
| subtype1 | 5 | 13 |
| subtype2 | 8 | 21 |
| subtype3 | 9 | 8 |
| subtype4 | 9 | 9 |
| subtype5 | 17 | 23 |
| subtype6 | 17 | 13 |
| subtype7 | 3 | 5 |
Figure S45. Get High-res Image Clustering Approach #7: 'MIRseq CNMF subtypes' versus Clinical Feature #3: 'GENDER'

P value = 0.122 (ANOVA)
Table S53. Clustering Approach #7: 'MIRseq CNMF subtypes' versus Clinical Feature #4: 'KARNOFSKY.PERFORMANCE.SCORE'
| nPatients | Mean (Std.Dev) | |
|---|---|---|
| ALL | 80 | 89.0 (10.6) |
| subtype1 | 10 | 95.0 (5.3) |
| subtype2 | 16 | 86.9 (12.0) |
| subtype3 | 9 | 93.3 (5.0) |
| subtype4 | 8 | 92.5 (7.1) |
| subtype5 | 17 | 85.9 (10.0) |
| subtype6 | 18 | 87.8 (12.2) |
| subtype7 | 2 | 80.0 (28.3) |
Figure S46. Get High-res Image Clustering Approach #7: 'MIRseq CNMF subtypes' versus Clinical Feature #4: 'KARNOFSKY.PERFORMANCE.SCORE'

P value = 0.00124 (Chi-square test)
Table S54. Clustering Approach #7: 'MIRseq CNMF subtypes' versus Clinical Feature #5: 'HISTOLOGICAL.TYPE'
| nPatients | ASTROCYTOMA | OLIGOASTROCYTOMA | OLIGODENDROGLIOMA |
|---|---|---|---|
| ALL | 53 | 39 | 67 |
| subtype1 | 9 | 6 | 3 |
| subtype2 | 17 | 6 | 6 |
| subtype3 | 8 | 6 | 3 |
| subtype4 | 2 | 3 | 13 |
| subtype5 | 9 | 10 | 20 |
| subtype6 | 7 | 7 | 16 |
| subtype7 | 1 | 1 | 6 |
Figure S47. Get High-res Image Clustering Approach #7: 'MIRseq CNMF subtypes' versus Clinical Feature #5: 'HISTOLOGICAL.TYPE'

P value = 0.623 (Chi-square test)
Table S55. Clustering Approach #7: 'MIRseq CNMF subtypes' versus Clinical Feature #6: 'RADIATIONS.RADIATION.REGIMENINDICATION'
| nPatients | NO | YES |
|---|---|---|
| ALL | 94 | 66 |
| subtype1 | 9 | 9 |
| subtype2 | 19 | 10 |
| subtype3 | 11 | 6 |
| subtype4 | 9 | 9 |
| subtype5 | 21 | 19 |
| subtype6 | 21 | 9 |
| subtype7 | 4 | 4 |
Figure S48. Get High-res Image Clustering Approach #7: 'MIRseq CNMF subtypes' versus Clinical Feature #6: 'RADIATIONS.RADIATION.REGIMENINDICATION'
P value = 0.109 (Chi-square test)
Table S56. Clustering Approach #7: 'MIRseq CNMF subtypes' versus Clinical Feature #7: 'NEOADJUVANT.THERAPY'
| nPatients | NO | YES |
|---|---|---|
| ALL | 78 | 82 |
| subtype1 | 6 | 12 |
| subtype2 | 18 | 11 |
| subtype3 | 4 | 13 |
| subtype4 | 7 | 11 |
| subtype5 | 21 | 19 |
| subtype6 | 17 | 13 |
| subtype7 | 5 | 3 |
Figure S49. Get High-res Image Clustering Approach #7: 'MIRseq CNMF subtypes' versus Clinical Feature #7: 'NEOADJUVANT.THERAPY'
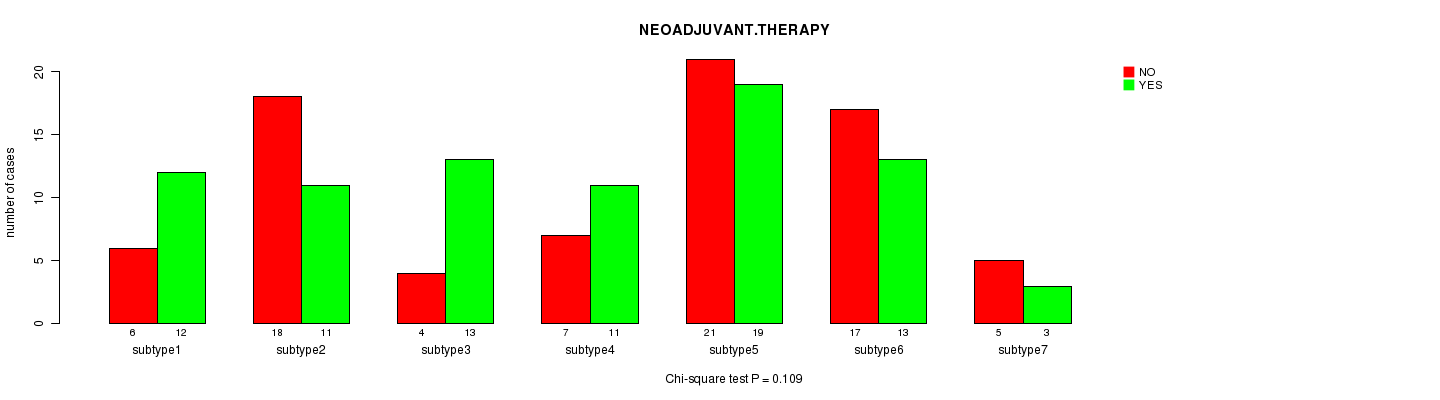
Table S57. Get Full Table Description of clustering approach #8: 'MIRseq cHierClus subtypes'
| Cluster Labels | 1 | 2 | 3 |
|---|---|---|---|
| Number of samples | 6 | 87 | 67 |
P value = 0.0122 (logrank test)
Table S58. Clustering Approach #8: 'MIRseq cHierClus subtypes' versus Clinical Feature #1: 'Time to Death'
| nPatients | nDeath | Duration Range (Median), Month | |
|---|---|---|---|
| ALL | 159 | 48 | 0.0 - 211.2 (17.4) |
| subtype1 | 6 | 1 | 7.2 - 21.0 (13.8) |
| subtype2 | 87 | 33 | 0.0 - 182.3 (17.7) |
| subtype3 | 66 | 14 | 0.1 - 211.2 (14.9) |
Figure S50. Get High-res Image Clustering Approach #8: 'MIRseq cHierClus subtypes' versus Clinical Feature #1: 'Time to Death'

P value = 0.858 (ANOVA)
Table S59. Clustering Approach #8: 'MIRseq cHierClus subtypes' versus Clinical Feature #2: 'AGE'
| nPatients | Mean (Std.Dev) | |
|---|---|---|
| ALL | 160 | 43.5 (13.3) |
| subtype1 | 6 | 43.2 (13.4) |
| subtype2 | 87 | 43.0 (13.2) |
| subtype3 | 67 | 44.2 (13.6) |
Figure S51. Get High-res Image Clustering Approach #8: 'MIRseq cHierClus subtypes' versus Clinical Feature #2: 'AGE'

P value = 1 (Fisher's exact test)
Table S60. Clustering Approach #8: 'MIRseq cHierClus subtypes' versus Clinical Feature #3: 'GENDER'
| nPatients | FEMALE | MALE |
|---|---|---|
| ALL | 68 | 92 |
| subtype1 | 2 | 4 |
| subtype2 | 37 | 50 |
| subtype3 | 29 | 38 |
Figure S52. Get High-res Image Clustering Approach #8: 'MIRseq cHierClus subtypes' versus Clinical Feature #3: 'GENDER'

P value = 0.935 (ANOVA)
Table S61. Clustering Approach #8: 'MIRseq cHierClus subtypes' versus Clinical Feature #4: 'KARNOFSKY.PERFORMANCE.SCORE'
| nPatients | Mean (Std.Dev) | |
|---|---|---|
| ALL | 80 | 89.0 (10.6) |
| subtype1 | 4 | 87.5 (5.0) |
| subtype2 | 44 | 89.3 (10.2) |
| subtype3 | 32 | 88.8 (11.8) |
Figure S53. Get High-res Image Clustering Approach #8: 'MIRseq cHierClus subtypes' versus Clinical Feature #4: 'KARNOFSKY.PERFORMANCE.SCORE'

P value = 0.0394 (Chi-square test)
Table S62. Clustering Approach #8: 'MIRseq cHierClus subtypes' versus Clinical Feature #5: 'HISTOLOGICAL.TYPE'
| nPatients | ASTROCYTOMA | OLIGOASTROCYTOMA | OLIGODENDROGLIOMA |
|---|---|---|---|
| ALL | 53 | 39 | 67 |
| subtype1 | 3 | 0 | 3 |
| subtype2 | 35 | 23 | 28 |
| subtype3 | 15 | 16 | 36 |
Figure S54. Get High-res Image Clustering Approach #8: 'MIRseq cHierClus subtypes' versus Clinical Feature #5: 'HISTOLOGICAL.TYPE'
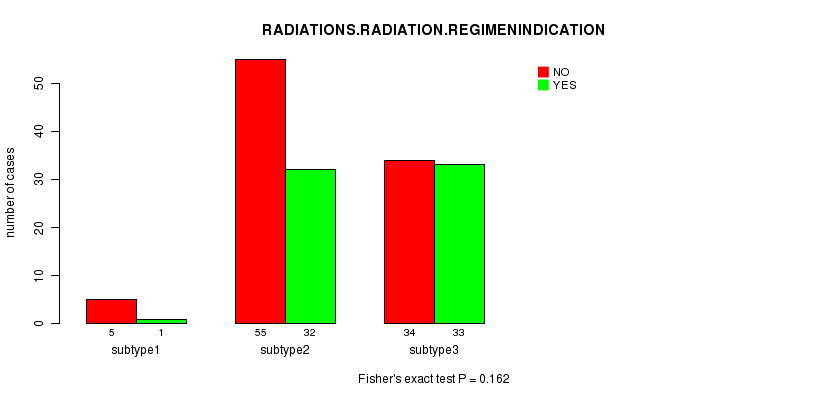
P value = 0.162 (Fisher's exact test)
Table S63. Clustering Approach #8: 'MIRseq cHierClus subtypes' versus Clinical Feature #6: 'RADIATIONS.RADIATION.REGIMENINDICATION'
| nPatients | NO | YES |
|---|---|---|
| ALL | 94 | 66 |
| subtype1 | 5 | 1 |
| subtype2 | 55 | 32 |
| subtype3 | 34 | 33 |
Figure S55. Get High-res Image Clustering Approach #8: 'MIRseq cHierClus subtypes' versus Clinical Feature #6: 'RADIATIONS.RADIATION.REGIMENINDICATION'
P value = 0.187 (Fisher's exact test)
Table S64. Clustering Approach #8: 'MIRseq cHierClus subtypes' versus Clinical Feature #7: 'NEOADJUVANT.THERAPY'
| nPatients | NO | YES |
|---|---|---|
| ALL | 78 | 82 |
| subtype1 | 4 | 2 |
| subtype2 | 37 | 50 |
| subtype3 | 37 | 30 |
Figure S56. Get High-res Image Clustering Approach #8: 'MIRseq cHierClus subtypes' versus Clinical Feature #7: 'NEOADJUVANT.THERAPY'

-
Cluster data file = LGG.mergedcluster.txt
-
Clinical data file = LGG.clin.merged.picked.txt
-
Number of patients = 161
-
Number of clustering approaches = 8
-
Number of selected clinical features = 7
-
Exclude small clusters that include fewer than K patients, K = 3
consensus non-negative matrix factorization clustering approach (Brunet et al. 2004)
Resampling-based clustering method (Monti et al. 2003)
For survival clinical features, the Kaplan-Meier survival curves of tumors with and without gene mutations were plotted and the statistical significance P values were estimated by logrank test (Bland and Altman 2004) using the 'survdiff' function in R
For continuous numerical clinical features, one-way analysis of variance (Howell 2002) was applied to compare the clinical values between tumor subtypes using 'anova' function in R
For binary clinical features, two-tailed Fisher's exact tests (Fisher 1922) were used to estimate the P values using the 'fisher.test' function in R
For multi-class clinical features (nominal or ordinal), Chi-square tests (Greenwood and Nikulin 1996) were used to estimate the P values using the 'chisq.test' function in R
This is an experimental feature. The full results of the analysis summarized in this report can be downloaded from the TCGA Data Coordination Center.