This pipeline computes the correlation between significant arm-level copy number variations (cnvs) and selected clinical features.
Testing the association between copy number variation 80 arm-level results and 7 clinical features across 554 patients, 8 significant findings detected with Q value < 0.25.
-
2p gain cnv correlated to 'AGE'.
-
3q gain cnv correlated to 'AGE'.
-
10p gain cnv correlated to 'AGE'.
-
12p gain cnv correlated to 'AGE'.
-
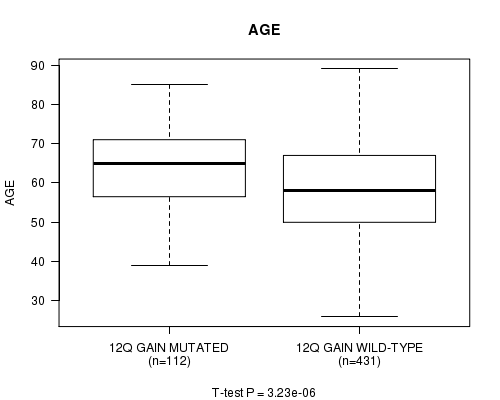
12q gain cnv correlated to 'AGE'.
-
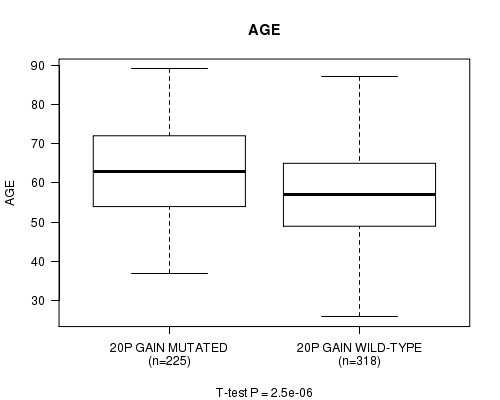
20p gain cnv correlated to 'AGE'.
-
20q gain cnv correlated to 'AGE'.
-
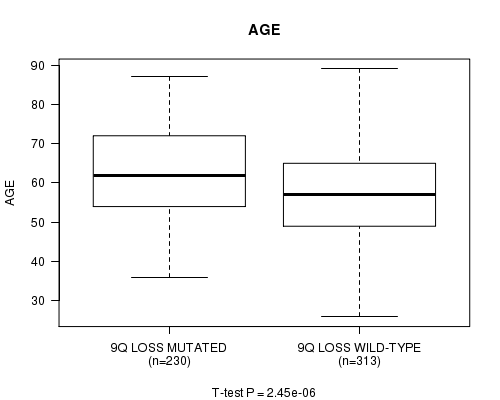
9q loss cnv correlated to 'AGE'.
Table 1. Get Full Table Overview of the association between significant copy number variation of 80 arm-level results and 7 clinical features. Shown in the table are P values (Q values). Thresholded by Q value < 0.25, 8 significant findings detected.
|
Clinical Features |
Time to Death |
AGE |
PRIMARY SITE OF DISEASE |
KARNOFSKY PERFORMANCE SCORE |
TUMOR STAGE |
RADIATIONS RADIATION REGIMENINDICATION |
NEOADJUVANT THERAPY |
||
| nCNV (%) | nWild-Type | logrank test | t-test | Fisher's exact test | t-test | Fisher's exact test | Fisher's exact test | Fisher's exact test | |
| 2p gain | 124 (22%) | 430 |
0.0314 (1.00) |
2.19e-07 (0.000121) |
1 (1.00) |
0.956 (1.00) |
0.966 (1.00) |
0.533 (1.00) |
0.696 (1.00) |
| 3q gain | 204 (37%) | 350 |
0.596 (1.00) |
1.56e-06 (0.000863) |
0.127 (1.00) |
0.671 (1.00) |
0.493 (1.00) |
0.301 (1.00) |
0.143 (1.00) |
| 10p gain | 133 (24%) | 421 |
0.163 (1.00) |
3.74e-05 (0.0205) |
0.111 (1.00) |
0.152 (1.00) |
0.794 (1.00) |
1 (1.00) |
0.128 (1.00) |
| 12p gain | 201 (36%) | 353 |
0.277 (1.00) |
3e-08 (1.67e-05) |
0.124 (1.00) |
0.0302 (1.00) |
0.00495 (1.00) |
1 (1.00) |
0.0416 (1.00) |
| 12q gain | 116 (21%) | 438 |
0.137 (1.00) |
3.23e-06 (0.00177) |
0.61 (1.00) |
0.0312 (1.00) |
0.0712 (1.00) |
0.507 (1.00) |
0.285 (1.00) |
| 20p gain | 229 (41%) | 325 |
0.157 (1.00) |
2.5e-06 (0.00137) |
1 (1.00) |
0.105 (1.00) |
0.196 (1.00) |
0.572 (1.00) |
0.272 (1.00) |
| 20q gain | 266 (48%) | 288 |
0.114 (1.00) |
7.92e-07 (0.000438) |
1 (1.00) |
0.229 (1.00) |
0.0879 (1.00) |
0.61 (1.00) |
0.515 (1.00) |
| 9q loss | 236 (43%) | 318 |
0.518 (1.00) |
2.45e-06 (0.00135) |
0.152 (1.00) |
0.779 (1.00) |
0.244 (1.00) |
0.578 (1.00) |
0.742 (1.00) |
| 1p gain | 103 (19%) | 451 |
0.246 (1.00) |
0.681 (1.00) |
0.159 (1.00) |
0.126 (1.00) |
0.261 (1.00) |
0.0903 (1.00) |
0.889 (1.00) |
| 1q gain | 154 (28%) | 400 |
0.351 (1.00) |
0.024 (1.00) |
0.0673 (1.00) |
0.0331 (1.00) |
0.217 (1.00) |
1 (1.00) |
0.809 (1.00) |
| 2q gain | 98 (18%) | 456 |
0.11 (1.00) |
0.000479 (0.262) |
1 (1.00) |
0.69 (1.00) |
0.66 (1.00) |
0.0823 (1.00) |
0.477 (1.00) |
| 3p gain | 107 (19%) | 447 |
0.49 (1.00) |
0.0546 (1.00) |
0.577 (1.00) |
0.73 (1.00) |
0.811 (1.00) |
1 (1.00) |
0.274 (1.00) |
| 4p gain | 30 (5%) | 524 |
0.28 (1.00) |
0.568 (1.00) |
1 (1.00) |
0.921 (1.00) |
0.781 (1.00) |
1 (1.00) |
0.145 (1.00) |
| 4q gain | 17 (3%) | 537 |
0.528 (1.00) |
0.0825 (1.00) |
1 (1.00) |
0.921 (1.00) |
0.389 (1.00) |
1 (1.00) |
0.0254 (1.00) |
| 5p gain | 139 (25%) | 415 |
0.384 (1.00) |
0.294 (1.00) |
0.121 (1.00) |
0.791 (1.00) |
0.871 (1.00) |
1 (1.00) |
0.707 (1.00) |
| 5q gain | 31 (6%) | 523 |
0.307 (1.00) |
0.927 (1.00) |
0.206 (1.00) |
0.137 (1.00) |
0.852 (1.00) |
1 (1.00) |
1 (1.00) |
| 6p gain | 121 (22%) | 433 |
0.37 (1.00) |
0.00538 (1.00) |
0.628 (1.00) |
0.0337 (1.00) |
0.0697 (1.00) |
1 (1.00) |
0.598 (1.00) |
| 6q gain | 61 (11%) | 493 |
0.501 (1.00) |
0.0798 (1.00) |
1 (1.00) |
0.195 (1.00) |
0.0138 (1.00) |
1 (1.00) |
0.862 (1.00) |
| 7p gain | 121 (22%) | 433 |
0.175 (1.00) |
0.00094 (0.513) |
1 (1.00) |
0.292 (1.00) |
0.41 (1.00) |
1 (1.00) |
0.188 (1.00) |
| 7q gain | 144 (26%) | 410 |
0.246 (1.00) |
0.00699 (1.00) |
0.701 (1.00) |
0.276 (1.00) |
0.281 (1.00) |
0.572 (1.00) |
0.106 (1.00) |
| 8p gain | 86 (16%) | 468 |
0.0817 (1.00) |
0.699 (1.00) |
1 (1.00) |
0.894 (1.00) |
0.416 (1.00) |
0.398 (1.00) |
0.372 (1.00) |
| 8q gain | 203 (37%) | 351 |
0.168 (1.00) |
0.596 (1.00) |
0.25 (1.00) |
0.946 (1.00) |
0.223 (1.00) |
1 (1.00) |
0.0546 (1.00) |
| 9p gain | 59 (11%) | 495 |
0.74 (1.00) |
0.788 (1.00) |
1 (1.00) |
0.95 (1.00) |
0.686 (1.00) |
1 (1.00) |
0.597 (1.00) |
| 9q gain | 26 (5%) | 528 |
0.943 (1.00) |
0.742 (1.00) |
1 (1.00) |
0.43 (1.00) |
1 (1.00) |
1 (1.00) |
|
| 10q gain | 69 (12%) | 485 |
0.383 (1.00) |
0.0268 (1.00) |
0.414 (1.00) |
0.32 (1.00) |
0.37 (1.00) |
1 (1.00) |
0.0308 (1.00) |
| 11p gain | 40 (7%) | 514 |
0.574 (1.00) |
0.86 (1.00) |
1 (1.00) |
0.852 (1.00) |
0.117 (1.00) |
1 (1.00) |
0.033 (1.00) |
| 11q gain | 60 (11%) | 494 |
0.265 (1.00) |
0.376 (1.00) |
1 (1.00) |
0.657 (1.00) |
0.265 (1.00) |
1 (1.00) |
0.219 (1.00) |
| 13q gain | 38 (7%) | 516 |
0.719 (1.00) |
0.0339 (1.00) |
1 (1.00) |
0.333 (1.00) |
0.192 (1.00) |
0.279 (1.00) |
|
| 14q gain | 33 (6%) | 521 |
0.311 (1.00) |
0.78 (1.00) |
1 (1.00) |
0.497 (1.00) |
0.537 (1.00) |
0.169 (1.00) |
0.818 (1.00) |
| 15q gain | 24 (4%) | 530 |
0.855 (1.00) |
0.348 (1.00) |
1 (1.00) |
0.0315 (1.00) |
1 (1.00) |
0.424 (1.00) |
|
| 16p gain | 32 (6%) | 522 |
0.61 (1.00) |
0.511 (1.00) |
1 (1.00) |
0.232 (1.00) |
0.198 (1.00) |
1 (1.00) |
0.485 (1.00) |
| 16q gain | 16 (3%) | 538 |
0.666 (1.00) |
0.756 (1.00) |
1 (1.00) |
0.357 (1.00) |
1 (1.00) |
0.748 (1.00) |
|
| 17p gain | 10 (2%) | 544 |
0.161 (1.00) |
0.0805 (1.00) |
1 (1.00) |
0.767 (1.00) |
0.562 (1.00) |
1 (1.00) |
0.221 (1.00) |
| 17q gain | 23 (4%) | 531 |
0.0947 (1.00) |
0.182 (1.00) |
1 (1.00) |
0.614 (1.00) |
0.574 (1.00) |
1 (1.00) |
0.28 (1.00) |
| 18p gain | 75 (14%) | 479 |
0.165 (1.00) |
0.16 (1.00) |
1 (1.00) |
0.341 (1.00) |
0.0077 (1.00) |
1 (1.00) |
0.114 (1.00) |
| 18q gain | 41 (7%) | 513 |
0.261 (1.00) |
0.332 (1.00) |
1 (1.00) |
0.252 (1.00) |
0.0727 (1.00) |
0.206 (1.00) |
0.0598 (1.00) |
| 19p gain | 97 (18%) | 457 |
0.33 (1.00) |
0.0138 (1.00) |
1 (1.00) |
0.996 (1.00) |
0.26 (1.00) |
0.439 (1.00) |
0.474 (1.00) |
| 19q gain | 90 (16%) | 464 |
0.146 (1.00) |
0.0138 (1.00) |
1 (1.00) |
0.649 (1.00) |
0.282 (1.00) |
0.413 (1.00) |
0.768 (1.00) |
| 21q gain | 68 (12%) | 486 |
0.00788 (1.00) |
0.0129 (1.00) |
0.409 (1.00) |
0.566 (1.00) |
0.676 (1.00) |
1 (1.00) |
0.74 (1.00) |
| 22q gain | 9 (2%) | 545 |
0.6 (1.00) |
0.29 (1.00) |
1 (1.00) |
0.39 (1.00) |
1 (1.00) |
0.38 (1.00) |
|
| Xq gain | 33 (6%) | 521 |
0.0955 (1.00) |
0.348 (1.00) |
1 (1.00) |
0.137 (1.00) |
0.974 (1.00) |
1 (1.00) |
0.651 (1.00) |
| 1p loss | 34 (6%) | 520 |
0.838 (1.00) |
0.409 (1.00) |
1 (1.00) |
0.296 (1.00) |
0.708 (1.00) |
0.173 (1.00) |
0.496 (1.00) |
| 1q loss | 22 (4%) | 532 |
0.333 (1.00) |
0.0871 (1.00) |
1 (1.00) |
0.22 (1.00) |
0.359 (1.00) |
0.115 (1.00) |
0.0465 (1.00) |
| 2p loss | 26 (5%) | 528 |
0.579 (1.00) |
0.847 (1.00) |
1 (1.00) |
0.0731 (1.00) |
0.472 (1.00) |
1 (1.00) |
0.8 (1.00) |
| 2q loss | 30 (5%) | 524 |
0.72 (1.00) |
0.452 (1.00) |
0.2 (1.00) |
0.0731 (1.00) |
0.343 (1.00) |
1 (1.00) |
0.477 (1.00) |
| 3p loss | 58 (10%) | 496 |
0.178 (1.00) |
0.162 (1.00) |
0.358 (1.00) |
0.321 (1.00) |
0.682 (1.00) |
0.283 (1.00) |
0.286 (1.00) |
| 3q loss | 23 (4%) | 531 |
0.136 (1.00) |
0.847 (1.00) |
0.156 (1.00) |
0.607 (1.00) |
0.171 (1.00) |
0.12 (1.00) |
0.784 (1.00) |
| 4p loss | 251 (45%) | 303 |
0.248 (1.00) |
0.302 (1.00) |
0.165 (1.00) |
0.106 (1.00) |
0.469 (1.00) |
0.593 (1.00) |
1 (1.00) |
| 4q loss | 292 (53%) | 262 |
0.398 (1.00) |
0.172 (1.00) |
0.751 (1.00) |
0.952 (1.00) |
0.338 (1.00) |
1 (1.00) |
0.586 (1.00) |
| 5p loss | 82 (15%) | 472 |
0.229 (1.00) |
0.0152 (1.00) |
0.474 (1.00) |
0.227 (1.00) |
0.334 (1.00) |
1 (1.00) |
0.878 (1.00) |
| 5q loss | 167 (30%) | 387 |
0.555 (1.00) |
0.0843 (1.00) |
0.351 (1.00) |
0.42 (1.00) |
0.287 (1.00) |
1 (1.00) |
0.0759 (1.00) |
| 6p loss | 120 (22%) | 434 |
0.0993 (1.00) |
0.00325 (1.00) |
0.624 (1.00) |
0.647 (1.00) |
0.45 (1.00) |
0.52 (1.00) |
0.895 (1.00) |
| 6q loss | 188 (34%) | 366 |
0.401 (1.00) |
0.00682 (1.00) |
0.114 (1.00) |
0.309 (1.00) |
0.371 (1.00) |
1 (1.00) |
1 (1.00) |
| 7p loss | 90 (16%) | 464 |
0.098 (1.00) |
0.999 (1.00) |
0.509 (1.00) |
0.0336 (1.00) |
0.276 (1.00) |
1 (1.00) |
0.659 (1.00) |
| 7q loss | 49 (9%) | 505 |
0.0253 (1.00) |
0.248 (1.00) |
0.31 (1.00) |
0.00339 (1.00) |
0.953 (1.00) |
0.243 (1.00) |
0.565 (1.00) |
| 8p loss | 226 (41%) | 328 |
0.375 (1.00) |
0.0218 (1.00) |
0.144 (1.00) |
0.0388 (1.00) |
0.455 (1.00) |
1 (1.00) |
0.825 (1.00) |
| 8q loss | 60 (11%) | 494 |
0.587 (1.00) |
0.0177 (1.00) |
1 (1.00) |
0.331 (1.00) |
0.0266 (1.00) |
1 (1.00) |
0.73 (1.00) |
| 9p loss | 208 (38%) | 346 |
0.641 (1.00) |
0.0321 (1.00) |
0.13 (1.00) |
0.479 (1.00) |
0.484 (1.00) |
0.56 (1.00) |
0.144 (1.00) |
| 10p loss | 61 (11%) | 493 |
0.693 (1.00) |
0.0863 (1.00) |
1 (1.00) |
0.753 (1.00) |
0.893 (1.00) |
0.296 (1.00) |
0.729 (1.00) |
| 10q loss | 86 (16%) | 468 |
0.899 (1.00) |
0.245 (1.00) |
1 (1.00) |
0.72 (1.00) |
0.412 (1.00) |
0.00363 (1.00) |
0.233 (1.00) |
| 11p loss | 140 (25%) | 414 |
0.685 (1.00) |
0.0258 (1.00) |
1 (1.00) |
0.741 (1.00) |
0.345 (1.00) |
1 (1.00) |
0.454 (1.00) |
| 11q loss | 107 (19%) | 447 |
0.818 (1.00) |
0.147 (1.00) |
0.577 (1.00) |
0.17 (1.00) |
0.34 (1.00) |
0.475 (1.00) |
0.679 (1.00) |
| 12p loss | 49 (9%) | 505 |
0.813 (1.00) |
0.12 (1.00) |
1 (1.00) |
0.113 (1.00) |
0.0214 (1.00) |
1 (1.00) |
0.126 (1.00) |
| 12q loss | 72 (13%) | 482 |
0.294 (1.00) |
0.446 (1.00) |
1 (1.00) |
0.695 (1.00) |
0.0055 (1.00) |
1 (1.00) |
0.194 (1.00) |
| 13q loss | 251 (45%) | 303 |
0.307 (1.00) |
0.84 (1.00) |
0.457 (1.00) |
0.496 (1.00) |
0.207 (1.00) |
1 (1.00) |
0.444 (1.00) |
| 14q loss | 160 (29%) | 394 |
0.413 (1.00) |
0.0967 (1.00) |
1 (1.00) |
0.706 (1.00) |
0.0456 (1.00) |
0.561 (1.00) |
0.633 (1.00) |
| 15q loss | 213 (38%) | 341 |
0.89 (1.00) |
0.0447 (1.00) |
0.273 (1.00) |
0.65 (1.00) |
0.113 (1.00) |
0.562 (1.00) |
0.182 (1.00) |
| 16p loss | 258 (47%) | 296 |
0.122 (1.00) |
0.94 (1.00) |
0.467 (1.00) |
0.259 (1.00) |
0.226 (1.00) |
0.6 (1.00) |
0.232 (1.00) |
| 16q loss | 346 (62%) | 208 |
0.192 (1.00) |
0.00304 (1.00) |
0.779 (1.00) |
0.0536 (1.00) |
0.391 (1.00) |
1 (1.00) |
0.18 (1.00) |
| 17p loss | 416 (75%) | 138 |
0.919 (1.00) |
0.0213 (1.00) |
0.26 (1.00) |
0.883 (1.00) |
0.155 (1.00) |
1 (1.00) |
0.802 (1.00) |
| 17q loss | 320 (58%) | 234 |
0.358 (1.00) |
0.0657 (1.00) |
1 (1.00) |
0.0547 (1.00) |
0.674 (1.00) |
0.267 (1.00) |
0.0481 (1.00) |
| 18p loss | 179 (32%) | 375 |
0.533 (1.00) |
0.815 (1.00) |
0.791 (1.00) |
0.752 (1.00) |
0.108 (1.00) |
0.245 (1.00) |
0.0271 (1.00) |
| 18q loss | 225 (41%) | 329 |
0.53 (1.00) |
0.838 (1.00) |
0.767 (1.00) |
0.65 (1.00) |
0.386 (1.00) |
0.569 (1.00) |
0.0461 (1.00) |
| 19p loss | 138 (25%) | 416 |
0.952 (1.00) |
0.115 (1.00) |
0.683 (1.00) |
0.549 (1.00) |
0.52 (1.00) |
1 (1.00) |
0.451 (1.00) |
| 19q loss | 138 (25%) | 416 |
0.691 (1.00) |
0.73 (1.00) |
0.683 (1.00) |
0.482 (1.00) |
0.681 (1.00) |
1 (1.00) |
0.315 (1.00) |
| 20p loss | 35 (6%) | 519 |
0.0308 (1.00) |
0.22 (1.00) |
1 (1.00) |
0.00339 (1.00) |
0.765 (1.00) |
0.178 (1.00) |
0.122 (1.00) |
| 20q loss | 21 (4%) | 533 |
0.0397 (1.00) |
0.796 (1.00) |
1 (1.00) |
0.00339 (1.00) |
0.656 (1.00) |
1 (1.00) |
0.779 (1.00) |
| 21q loss | 145 (26%) | 409 |
0.654 (1.00) |
0.955 (1.00) |
1 (1.00) |
0.508 (1.00) |
0.524 (1.00) |
1 (1.00) |
0.265 (1.00) |
| 22q loss | 376 (68%) | 178 |
0.281 (1.00) |
0.179 (1.00) |
0.386 (1.00) |
0.954 (1.00) |
0.188 (1.00) |
0.555 (1.00) |
1 (1.00) |
| Xq loss | 100 (18%) | 454 |
0.261 (1.00) |
0.761 (1.00) |
0.55 (1.00) |
0.485 (1.00) |
0.868 (1.00) |
1 (1.00) |
0.673 (1.00) |
P value = 2.19e-07 (t-test), Q value = 0.00012
Table S1. Gene #3: '2p gain mutation analysis' versus Clinical Feature #2: 'AGE'
| nPatients | Mean (Std.Dev) | |
|---|---|---|
| ALL | 543 | 59.8 (11.6) |
| 2P GAIN MUTATED | 122 | 64.5 (11.0) |
| 2P GAIN WILD-TYPE | 421 | 58.4 (11.4) |
Figure S1. Get High-res Image Gene #3: '2p gain mutation analysis' versus Clinical Feature #2: 'AGE'

P value = 1.56e-06 (t-test), Q value = 0.00086
Table S2. Gene #6: '3q gain mutation analysis' versus Clinical Feature #2: 'AGE'
| nPatients | Mean (Std.Dev) | |
|---|---|---|
| ALL | 543 | 59.8 (11.6) |
| 3Q GAIN MUTATED | 201 | 62.8 (11.1) |
| 3Q GAIN WILD-TYPE | 342 | 58.0 (11.5) |
Figure S2. Get High-res Image Gene #6: '3q gain mutation analysis' versus Clinical Feature #2: 'AGE'

P value = 3.74e-05 (t-test), Q value = 0.02
Table S3. Gene #19: '10p gain mutation analysis' versus Clinical Feature #2: 'AGE'
| nPatients | Mean (Std.Dev) | |
|---|---|---|
| ALL | 543 | 59.8 (11.6) |
| 10P GAIN MUTATED | 129 | 63.3 (10.7) |
| 10P GAIN WILD-TYPE | 414 | 58.7 (11.7) |
Figure S3. Get High-res Image Gene #19: '10p gain mutation analysis' versus Clinical Feature #2: 'AGE'

P value = 3e-08 (t-test), Q value = 1.7e-05
Table S4. Gene #23: '12p gain mutation analysis' versus Clinical Feature #2: 'AGE'
| nPatients | Mean (Std.Dev) | |
|---|---|---|
| ALL | 543 | 59.8 (11.6) |
| 12P GAIN MUTATED | 196 | 63.4 (11.2) |
| 12P GAIN WILD-TYPE | 347 | 57.7 (11.4) |
Figure S4. Get High-res Image Gene #23: '12p gain mutation analysis' versus Clinical Feature #2: 'AGE'

P value = 3.23e-06 (t-test), Q value = 0.0018
Table S5. Gene #24: '12q gain mutation analysis' versus Clinical Feature #2: 'AGE'
| nPatients | Mean (Std.Dev) | |
|---|---|---|
| ALL | 543 | 59.8 (11.6) |
| 12Q GAIN MUTATED | 112 | 64.1 (10.5) |
| 12Q GAIN WILD-TYPE | 431 | 58.6 (11.6) |
Figure S5. Get High-res Image Gene #24: '12q gain mutation analysis' versus Clinical Feature #2: 'AGE'
P value = 2.5e-06 (t-test), Q value = 0.0014
Table S6. Gene #36: '20p gain mutation analysis' versus Clinical Feature #2: 'AGE'
| nPatients | Mean (Std.Dev) | |
|---|---|---|
| ALL | 543 | 59.8 (11.6) |
| 20P GAIN MUTATED | 225 | 62.5 (11.4) |
| 20P GAIN WILD-TYPE | 318 | 57.8 (11.4) |
Figure S6. Get High-res Image Gene #36: '20p gain mutation analysis' versus Clinical Feature #2: 'AGE'
P value = 7.92e-07 (t-test), Q value = 0.00044
Table S7. Gene #37: '20q gain mutation analysis' versus Clinical Feature #2: 'AGE'
| nPatients | Mean (Std.Dev) | |
|---|---|---|
| ALL | 543 | 59.8 (11.6) |
| 20Q GAIN MUTATED | 261 | 62.3 (11.7) |
| 20Q GAIN WILD-TYPE | 282 | 57.4 (11.0) |
Figure S7. Get High-res Image Gene #37: '20q gain mutation analysis' versus Clinical Feature #2: 'AGE'

P value = 2.45e-06 (t-test), Q value = 0.0014
Table S8. Gene #58: '9q loss mutation analysis' versus Clinical Feature #2: 'AGE'
| nPatients | Mean (Std.Dev) | |
|---|---|---|
| ALL | 543 | 59.8 (11.6) |
| 9Q LOSS MUTATED | 230 | 62.5 (11.3) |
| 9Q LOSS WILD-TYPE | 313 | 57.8 (11.5) |
Figure S8. Get High-res Image Gene #58: '9q loss mutation analysis' versus Clinical Feature #2: 'AGE'
-
Mutation data file = broad_values_by_arm.mutsig.cluster.txt
-
Clinical data file = OV.clin.merged.picked.txt
-
Number of patients = 554
-
Number of significantly arm-level cnvs = 80
-
Number of selected clinical features = 7
-
Exclude genes that fewer than K tumors have mutations, K = 3
For survival clinical features, the Kaplan-Meier survival curves of tumors with and without gene mutations were plotted and the statistical significance P values were estimated by logrank test (Bland and Altman 2004) using the 'survdiff' function in R
For continuous numerical clinical features, two-tailed Student's t test with unequal variance (Lehmann and Romano 2005) was applied to compare the clinical values between tumors with and without gene mutations using 't.test' function in R
For binary or multi-class clinical features (nominal or ordinal), two-tailed Fisher's exact tests (Fisher 1922) were used to estimate the P values using the 'fisher.test' function in R
For multiple hypothesis correction, Q value is the False Discovery Rate (FDR) analogue of the P value (Benjamini and Hochberg 1995), defined as the minimum FDR at which the test may be called significant. We used the 'Benjamini and Hochberg' method of 'p.adjust' function in R to convert P values into Q values.
This is an experimental feature. The full results of the analysis summarized in this report can be downloaded from the TCGA Data Coordination Center.