This pipeline uses various statistical tests to identify mRNAs whose expression levels correlated to selected clinical features.
Testing the association between 18566 genes and 5 clinical features across 263 samples, statistically thresholded by Q value < 0.05, 3 clinical features related to at least one genes.
-
1 gene correlated to 'Time to Death'.
-
KRTCAP3|200634
-
56 genes correlated to 'AGE'.
-
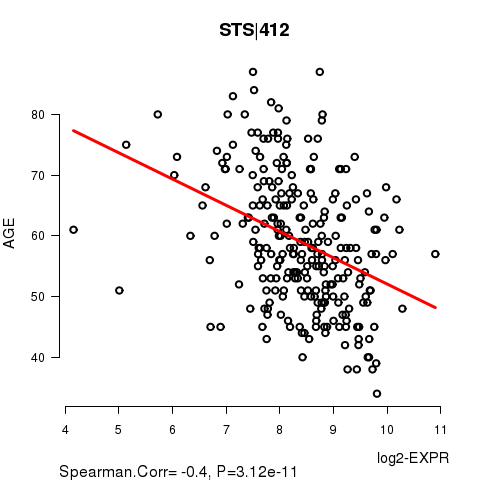
STS|412 , LRP6|4040 , C8ORF55|51337 , EIF4E3|317649 , PDHA1|5160 , ...
-
1 gene correlated to 'TUMOR.STAGE'.
-
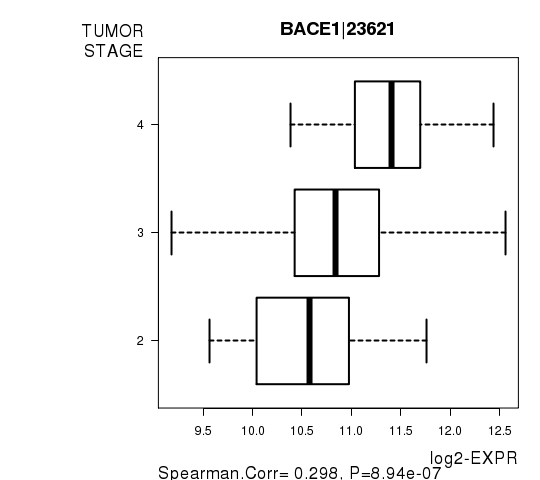
BACE1|23621
-
No genes correlated to 'KARNOFSKY.PERFORMANCE.SCORE', and 'NEOADJUVANT.THERAPY'.
Complete statistical result table is provided in Supplement Table 1
Table 1. Get Full Table This table shows the clinical features, statistical methods used, and the number of genes that are significantly associated with each clinical feature at Q value < 0.05.
| Clinical feature | Statistical test | Significant genes | Associated with | Associated with | ||
|---|---|---|---|---|---|---|
| Time to Death | Cox regression test | N=1 | shorter survival | N=0 | longer survival | N=1 |
| AGE | Spearman correlation test | N=56 | older | N=30 | younger | N=26 |
| KARNOFSKY PERFORMANCE SCORE | Spearman correlation test | N=0 | ||||
| TUMOR STAGE | Spearman correlation test | N=1 | higher stage | N=1 | lower stage | N=0 |
| NEOADJUVANT THERAPY | t test | N=0 |
Table S1. Basic characteristics of clinical feature: 'Time to Death'
| Time to Death | Duration (Months) | 0.3-180.2 (median=28.2) |
| censored | N = 114 | |
| death | N = 147 | |
| Significant markers | N = 1 | |
| associated with shorter survival | 0 | |
| associated with longer survival | 1 |
Table S2. Get Full Table List of one gene significantly associated with 'Time to Death' by Cox regression test
| HazardRatio | Wald_P | Q | C_index | |
|---|---|---|---|---|
| KRTCAP3|200634 | 0.68 | 7.03e-07 | 0.013 | 0.399 |
Figure S1. Get High-res Image As an example, this figure shows the association of KRTCAP3|200634 to 'Time to Death'. four curves present the cumulative survival rates of 4 quartile subsets of patients. P value = 7.03e-07 with univariate Cox regression analysis using continuous log-2 expression values.
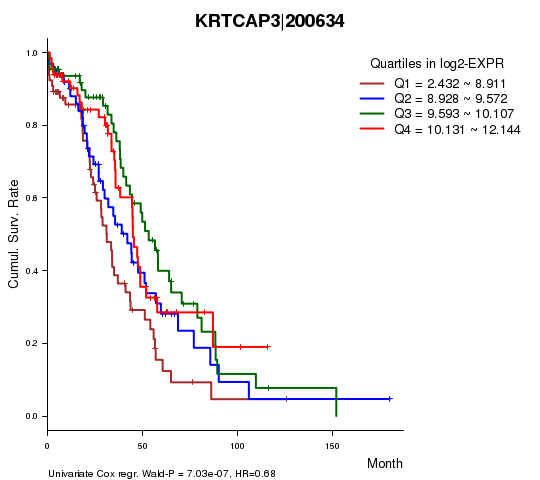
Table S3. Basic characteristics of clinical feature: 'AGE'
| AGE | Mean (SD) | 59.06 (11) |
| Significant markers | N = 56 | |
| pos. correlated | 30 | |
| neg. correlated | 26 |
Table S4. Get Full Table List of top 10 genes significantly correlated to 'AGE' by Spearman correlation test
| SpearmanCorr | corrP | Q | |
|---|---|---|---|
| STS|412 | -0.3996 | 3.117e-11 | 5.79e-07 |
| LRP6|4040 | 0.3592 | 3.268e-09 | 6.07e-05 |
| C8ORF55|51337 | -0.3585 | 3.519e-09 | 6.53e-05 |
| EIF4E3|317649 | -0.3552 | 4.985e-09 | 9.25e-05 |
| PDHA1|5160 | -0.3489 | 9.635e-09 | 0.000179 |
| C12ORF4|57102 | 0.3472 | 1.15e-08 | 0.000213 |
| GREB1|9687 | -0.3456 | 1.362e-08 | 0.000253 |
| APPL2|55198 | 0.3397 | 2.466e-08 | 0.000458 |
| ADAM15|8751 | -0.3394 | 2.556e-08 | 0.000474 |
| DEPDC6|64798 | -0.3373 | 3.152e-08 | 0.000585 |
Figure S2. Get High-res Image As an example, this figure shows the association of STS|412 to 'AGE'. P value = 3.12e-11 with Spearman correlation analysis. The straight line presents the best linear regression.
No gene related to 'KARNOFSKY.PERFORMANCE.SCORE'.
Table S5. Basic characteristics of clinical feature: 'KARNOFSKY.PERFORMANCE.SCORE'
| KARNOFSKY.PERFORMANCE.SCORE | Mean (SD) | 74.67 (12) |
| Score | N | |
| 60 | 5 | |
| 80 | 9 | |
| 100 | 1 | |
| Significant markers | N = 0 |
Table S6. Basic characteristics of clinical feature: 'TUMOR.STAGE'
| TUMOR.STAGE | Mean (SD) | 3.06 (0.44) |
| N | ||
| Stage 2 | 18 | |
| Stage 3 | 211 | |
| Stage 4 | 33 | |
| Significant markers | N = 1 | |
| pos. correlated | 1 | |
| neg. correlated | 0 |
Table S7. Get Full Table List of one gene significantly correlated to 'TUMOR.STAGE' by Spearman correlation test
| SpearmanCorr | corrP | Q | |
|---|---|---|---|
| BACE1|23621 | 0.2981 | 8.941e-07 | 0.0166 |
Figure S3. Get High-res Image As an example, this figure shows the association of BACE1|23621 to 'TUMOR.STAGE'. P value = 8.94e-07 with Spearman correlation analysis.
-
Expresson data file = OV.uncv2.mRNAseq_RSEM_normalized_log2.txt
-
Clinical data file = OV.clin.merged.picked.txt
-
Number of patients = 263
-
Number of genes = 18566
-
Number of clinical features = 5
For survival clinical features, Wald's test in univariate Cox regression analysis with proportional hazards model (Andersen and Gill 1982) was used to estimate the P values using the 'coxph' function in R. Kaplan-Meier survival curves were plot using the four quartile subgroups of patients based on expression levels
For continuous numerical clinical features, Spearman's rank correlation coefficients (Spearman 1904) and two-tailed P values were estimated using 'cor.test' function in R
For two-class clinical features, two-tailed Student's t test with unequal variance (Lehmann and Romano 2005) was applied to compare the log2-expression levels between the two clinical classes using 't.test' function in R
For multiple hypothesis correction, Q value is the False Discovery Rate (FDR) analogue of the P value (Benjamini and Hochberg 1995), defined as the minimum FDR at which the test may be called significant. We used the 'Benjamini and Hochberg' method of 'p.adjust' function in R to convert P values into Q values.
This is an experimental feature. The full results of the analysis summarized in this report can be downloaded from the TCGA Data Coordination Center.