This pipeline uses various statistical tests to identify genes whose promoter methylation levels correlated to selected clinical features.
Testing the association between 12114 genes and 5 clinical features across 262 samples, statistically thresholded by Q value < 0.05, 2 clinical features related to at least one genes.
-
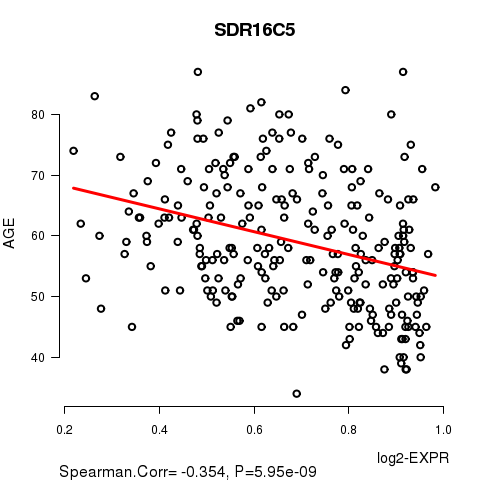
13 genes correlated to 'AGE'.
-
SDR16C5 , PCDHGB7 , GRM2 , KLK12 , PDZK1 , ...
-
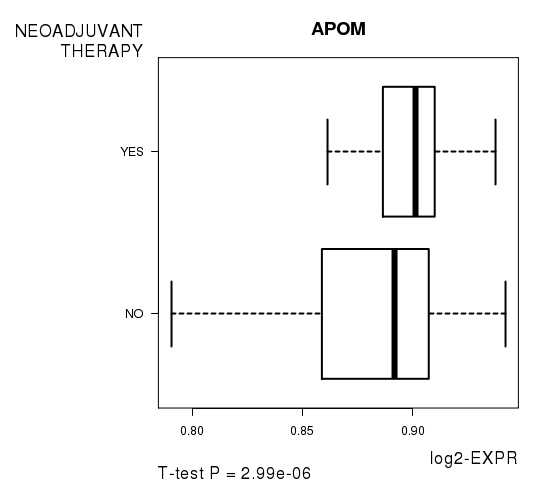
1 gene correlated to 'NEOADJUVANT.THERAPY'.
-
APOM
-
No genes correlated to 'Time to Death', 'KARNOFSKY.PERFORMANCE.SCORE', and 'TUMOR.STAGE'.
Complete statistical result table is provided in Supplement Table 1
Table 1. Get Full Table This table shows the clinical features, statistical methods used, and the number of genes that are significantly associated with each clinical feature at Q value < 0.05.
| Clinical feature | Statistical test | Significant genes | Associated with | Associated with | ||
|---|---|---|---|---|---|---|
| Time to Death | Cox regression test | N=0 | ||||
| AGE | Spearman correlation test | N=13 | older | N=1 | younger | N=12 |
| KARNOFSKY PERFORMANCE SCORE | Spearman correlation test | N=0 | ||||
| TUMOR STAGE | Spearman correlation test | N=0 | ||||
| NEOADJUVANT THERAPY | t test | N=1 | yes | N=1 | no | N=0 |
Table S1. Basic characteristics of clinical feature: 'Time to Death'
| Time to Death | Duration (Months) | 0.3-180.2 (median=28) |
| censored | N = 113 | |
| death | N = 147 | |
| Significant markers | N = 0 |
Table S2. Basic characteristics of clinical feature: 'AGE'
| AGE | Mean (SD) | 59.02 (11) |
| Significant markers | N = 13 | |
| pos. correlated | 1 | |
| neg. correlated | 12 |
Table S3. Get Full Table List of top 10 genes significantly correlated to 'AGE' by Spearman correlation test
| SpearmanCorr | corrP | Q | |
|---|---|---|---|
| SDR16C5 | -0.3542 | 5.95e-09 | 7.21e-05 |
| PCDHGB7 | 0.3096 | 4.566e-07 | 0.00553 |
| GRM2 | -0.3057 | 6.435e-07 | 0.00779 |
| KLK12 | -0.3044 | 7.204e-07 | 0.00873 |
| PDZK1 | -0.3015 | 9.309e-07 | 0.0113 |
| KCNIP1 | -0.2986 | 1.198e-06 | 0.0145 |
| ITGBL1 | -0.2984 | 1.219e-06 | 0.0148 |
| NRM | -0.2949 | 1.638e-06 | 0.0198 |
| ZNF280A | -0.2934 | 1.959e-06 | 0.0237 |
| KCNMB3 | -0.2888 | 2.731e-06 | 0.0331 |
Figure S1. Get High-res Image As an example, this figure shows the association of SDR16C5 to 'AGE'. P value = 5.95e-09 with Spearman correlation analysis. The straight line presents the best linear regression.
No gene related to 'KARNOFSKY.PERFORMANCE.SCORE'.
Table S4. Basic characteristics of clinical feature: 'KARNOFSKY.PERFORMANCE.SCORE'
| KARNOFSKY.PERFORMANCE.SCORE | Mean (SD) | 74.29 (12) |
| Score | N | |
| 60 | 5 | |
| 80 | 8 | |
| 100 | 1 | |
| Significant markers | N = 0 |
Table S5. Basic characteristics of clinical feature: 'TUMOR.STAGE'
| TUMOR.STAGE | Mean (SD) | 3.06 (0.44) |
| N | ||
| Stage 2 | 18 | |
| Stage 3 | 210 | |
| Stage 4 | 33 | |
| Significant markers | N = 0 |
Table S6. Basic characteristics of clinical feature: 'NEOADJUVANT.THERAPY'
| NEOADJUVANT.THERAPY | Labels | N |
| NO | 210 | |
| YES | 52 | |
| Significant markers | N = 1 | |
| Higher in YES | 1 | |
| Higher in NO | 0 |
Table S7. Get Full Table List of one gene differentially expressed by 'NEOADJUVANT.THERAPY'
| T(pos if higher in 'YES') | ttestP | Q | AUC | |
|---|---|---|---|---|
| APOM | 4.83 | 2.99e-06 | 0.0362 | 0.6278 |
Figure S2. Get High-res Image As an example, this figure shows the association of APOM to 'NEOADJUVANT.THERAPY'. P value = 2.99e-06 with T-test analysis.
-
Expresson data file = OV.meth.for_correlation.filtered_data.txt
-
Clinical data file = OV.clin.merged.picked.txt
-
Number of patients = 262
-
Number of genes = 12114
-
Number of clinical features = 5
For survival clinical features, Wald's test in univariate Cox regression analysis with proportional hazards model (Andersen and Gill 1982) was used to estimate the P values using the 'coxph' function in R. Kaplan-Meier survival curves were plot using the four quartile subgroups of patients based on expression levels
For continuous numerical clinical features, Spearman's rank correlation coefficients (Spearman 1904) and two-tailed P values were estimated using 'cor.test' function in R
For two-class clinical features, two-tailed Student's t test with unequal variance (Lehmann and Romano 2005) was applied to compare the log2-expression levels between the two clinical classes using 't.test' function in R
For multiple hypothesis correction, Q value is the False Discovery Rate (FDR) analogue of the P value (Benjamini and Hochberg 1995), defined as the minimum FDR at which the test may be called significant. We used the 'Benjamini and Hochberg' method of 'p.adjust' function in R to convert P values into Q values.
This is an experimental feature. The full results of the analysis summarized in this report can be downloaded from the TCGA Data Coordination Center.