This pipeline computes the correlation between cancer subtypes identified by different molecular patterns and selected clinical features.
Testing the association between subtypes identified by 12 different clustering approaches and 7 clinical features across 569 patients, 15 significant findings detected with P value < 0.05.
-
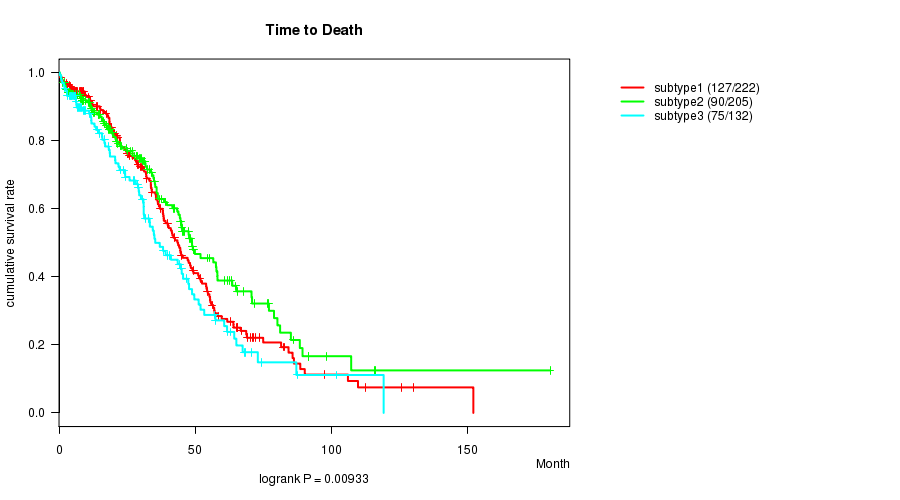
CNMF clustering analysis on array-based mRNA expression data identified 3 subtypes that correlate to 'Time to Death' and 'TUMOR.STAGE'.
-
Consensus hierarchical clustering analysis on array-based mRNA expression data identified 3 subtypes that correlate to 'Time to Death', 'AGE', 'TUMOR.STAGE', and 'NEOADJUVANT.THERAPY'.
-
CNMF clustering analysis on array-based miR expression data identified 3 subtypes that correlate to 'Time to Death'.
-
Consensus hierarchical clustering analysis on array-based miR expression data identified 3 subtypes that correlate to 'Time to Death'.
-
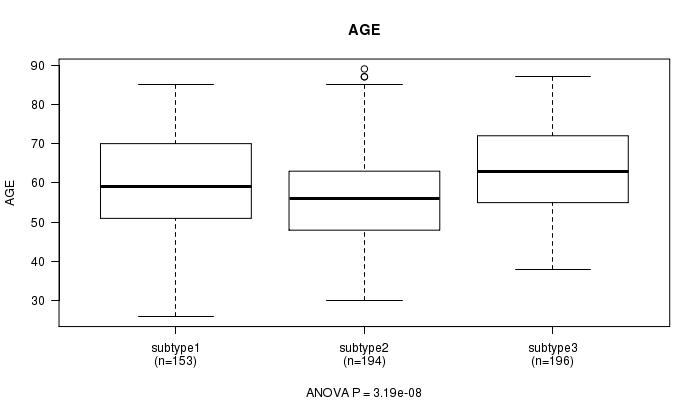
3 subtypes identified in current cancer cohort by 'CN CNMF'. These subtypes correlate to 'AGE'.
-
4 subtypes identified in current cancer cohort by 'METHLYATION CNMF'. These subtypes correlate to 'AGE'.
-
CNMF clustering analysis on RPPA data identified 3 subtypes that correlate to 'Time to Death'.
-
Consensus hierarchical clustering analysis on RPPA data identified 4 subtypes that correlate to 'Time to Death' and 'AGE'.
-
CNMF clustering analysis on sequencing-based mRNA expression data identified 3 subtypes that correlate to 'AGE'.
-
Consensus hierarchical clustering analysis on sequencing-based mRNA expression data identified 3 subtypes that do not correlate to any clinical features.
-
CNMF clustering analysis on sequencing-based miR expression data identified 3 subtypes that correlate to 'Time to Death'.
-
Consensus hierarchical clustering analysis on sequencing-based miR expression data identified 3 subtypes that do not correlate to any clinical features.
Table 1. Get Full Table Overview of the association between subtypes identified by 12 different clustering approaches and 7 clinical features. Shown in the table are P values from statistical tests. Thresholded by P value < 0.05, 15 significant findings detected.
|
Clinical Features |
Time to Death |
AGE |
PRIMARY SITE OF DISEASE |
KARNOFSKY PERFORMANCE SCORE |
TUMOR STAGE |
RADIATIONS RADIATION REGIMENINDICATION |
NEOADJUVANT THERAPY |
| Statistical Tests | logrank test | ANOVA | Chi-square test | ANOVA | Chi-square test | Fisher's exact test | Fisher's exact test |
| mRNA CNMF subtypes | 0.00933 | 0.06 | 0.555 | 0.147 | 0.031 | 0.793 | 0.371 |
| mRNA cHierClus subtypes | 0.00116 | 0.00679 | 0.588 | 0.241 | 0.0228 | 0.619 | 0.0475 |
| miR CNMF subtypes | 0.00559 | 0.698 | 0.201 | 0.677 | 0.11 | 0.265 | 0.275 |
| miR cHierClus subtypes | 0.0418 | 0.504 | 0.0908 | 0.547 | 0.0541 | 0.533 | 0.641 |
| CN CNMF | 0.0985 | 3.19e-08 | 0.323 | 0.253 | 0.181 | 0.505 | 0.0759 |
| METHLYATION CNMF | 0.251 | 1.3e-11 | 0.656 | 0.509 | 0.0557 | 0.189 | 0.281 |
| RPPA CNMF subtypes | 0.00128 | 0.58 | 0.885 | 0.61 | 0.333 | 0.129 | 0.586 |
| RPPA cHierClus subtypes | 0.0258 | 0.0408 | 0.676 | 0.68 | 0.181 | 0.823 | 0.201 |
| RNAseq CNMF subtypes | 0.124 | 0.00539 | 1 | 0.104 | 0.648 | 1 | 0.449 |
| RNAseq cHierClus subtypes | 0.122 | 0.128 | 0.536 | 0.104 | 0.119 | 0.618 | 0.47 |
| MIRseq CNMF subtypes | 0.0121 | 0.594 | 0.0583 | 0.207 | 0.193 | 0.476 | 0.546 |
| MIRseq cHierClus subtypes | 0.284 | 0.757 | 0.812 | 0.577 | 0.49 | 0.281 | 0.753 |
Table S1. Get Full Table Description of clustering approach #1: 'mRNA CNMF subtypes'
| Cluster Labels | 1 | 2 | 3 |
|---|---|---|---|
| Number of samples | 225 | 207 | 132 |
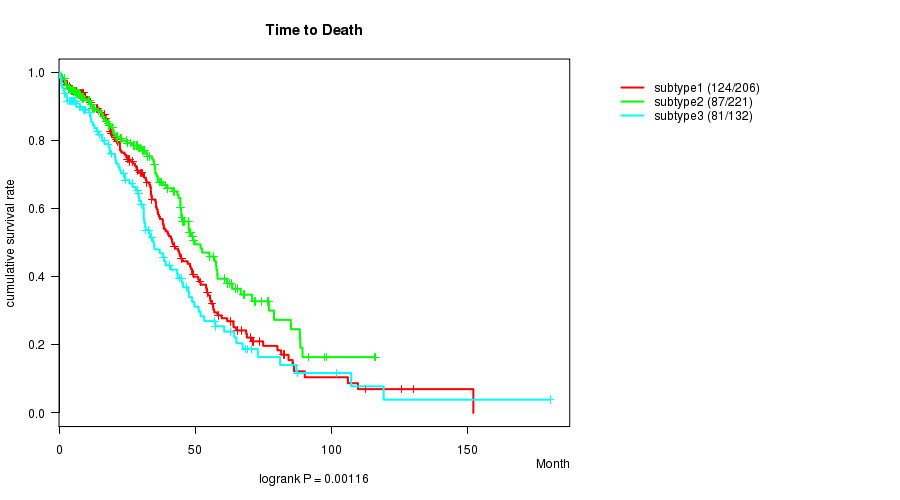
P value = 0.00933 (logrank test)
Table S2. Clustering Approach #1: 'mRNA CNMF subtypes' versus Clinical Feature #1: 'Time to Death'
| nPatients | nDeath | Duration Range (Median), Month | |
|---|---|---|---|
| ALL | 559 | 292 | 0.3 - 180.2 (28.3) |
| subtype1 | 222 | 127 | 0.3 - 152.0 (29.1) |
| subtype2 | 205 | 90 | 0.4 - 180.2 (27.9) |
| subtype3 | 132 | 75 | 0.3 - 119.1 (26.7) |
Figure S1. Get High-res Image Clustering Approach #1: 'mRNA CNMF subtypes' versus Clinical Feature #1: 'Time to Death'
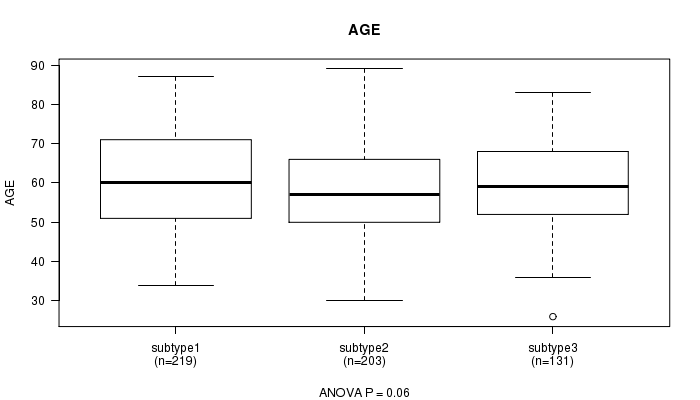
P value = 0.06 (ANOVA)
Table S3. Clustering Approach #1: 'mRNA CNMF subtypes' versus Clinical Feature #2: 'AGE'
| nPatients | Mean (Std.Dev) | |
|---|---|---|
| ALL | 553 | 59.7 (11.6) |
| subtype1 | 219 | 61.0 (11.6) |
| subtype2 | 203 | 58.4 (11.3) |
| subtype3 | 131 | 59.5 (11.9) |
Figure S2. Get High-res Image Clustering Approach #1: 'mRNA CNMF subtypes' versus Clinical Feature #2: 'AGE'
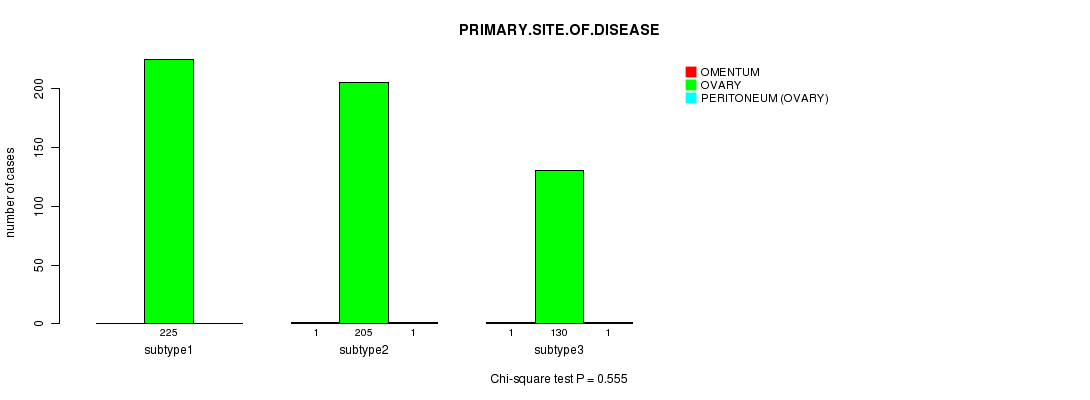
P value = 0.555 (Chi-square test)
Table S4. Clustering Approach #1: 'mRNA CNMF subtypes' versus Clinical Feature #3: 'PRIMARY.SITE.OF.DISEASE'
| nPatients | OMENTUM | OVARY | PERITONEUM (OVARY) |
|---|---|---|---|
| ALL | 2 | 560 | 2 |
| subtype1 | 0 | 225 | 0 |
| subtype2 | 1 | 205 | 1 |
| subtype3 | 1 | 130 | 1 |
Figure S3. Get High-res Image Clustering Approach #1: 'mRNA CNMF subtypes' versus Clinical Feature #3: 'PRIMARY.SITE.OF.DISEASE'
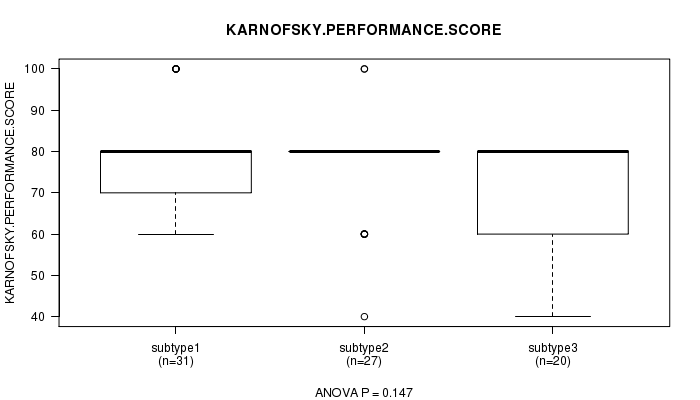
P value = 0.147 (ANOVA)
Table S5. Clustering Approach #1: 'mRNA CNMF subtypes' versus Clinical Feature #4: 'KARNOFSKY.PERFORMANCE.SCORE'
| nPatients | Mean (Std.Dev) | |
|---|---|---|
| ALL | 78 | 75.6 (12.8) |
| subtype1 | 31 | 78.1 (13.0) |
| subtype2 | 27 | 76.3 (12.4) |
| subtype3 | 20 | 71.0 (12.1) |
Figure S4. Get High-res Image Clustering Approach #1: 'mRNA CNMF subtypes' versus Clinical Feature #4: 'KARNOFSKY.PERFORMANCE.SCORE'
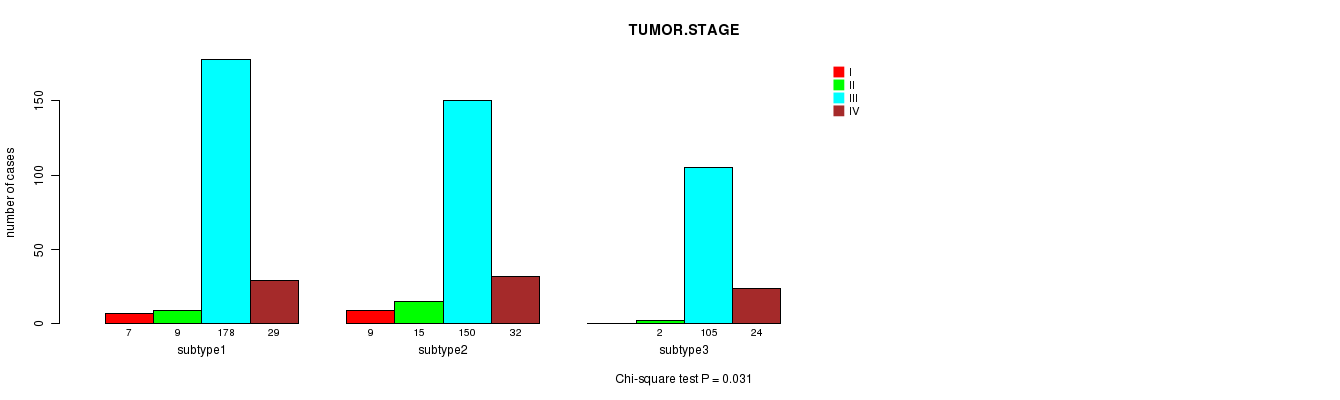
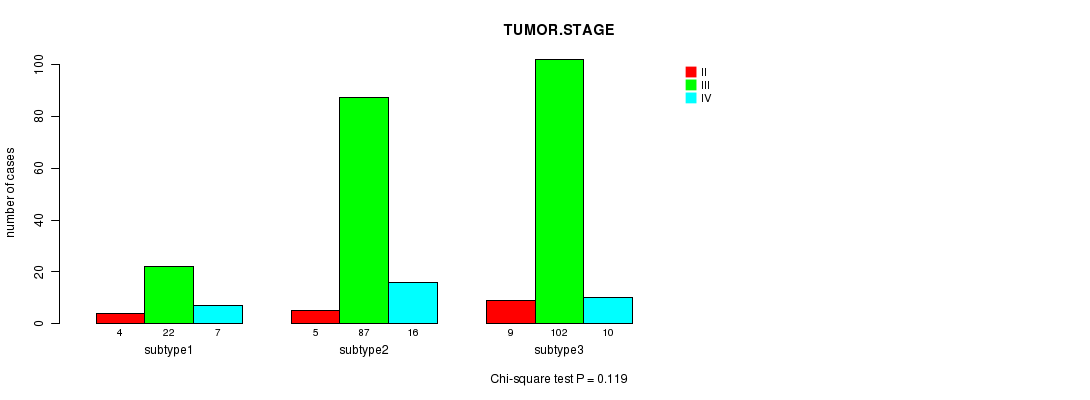
P value = 0.031 (Chi-square test)
Table S6. Clustering Approach #1: 'mRNA CNMF subtypes' versus Clinical Feature #5: 'TUMOR.STAGE'
| nPatients | I | II | III | IV |
|---|---|---|---|---|
| ALL | 16 | 26 | 433 | 85 |
| subtype1 | 7 | 9 | 178 | 29 |
| subtype2 | 9 | 15 | 150 | 32 |
| subtype3 | 0 | 2 | 105 | 24 |
Figure S5. Get High-res Image Clustering Approach #1: 'mRNA CNMF subtypes' versus Clinical Feature #5: 'TUMOR.STAGE'
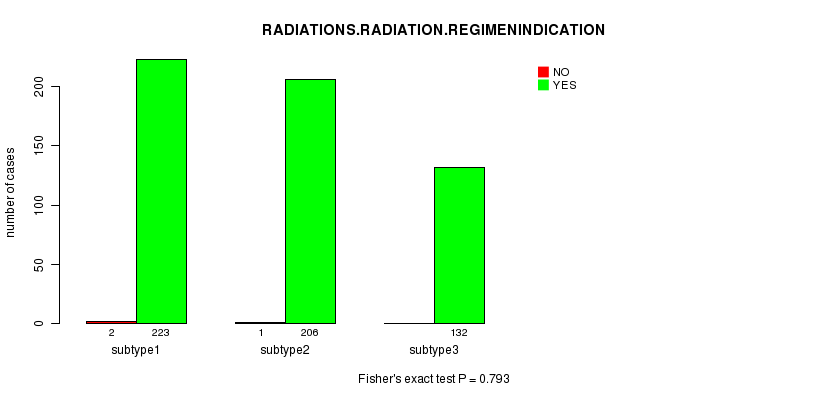
P value = 0.793 (Fisher's exact test)
Table S7. Clustering Approach #1: 'mRNA CNMF subtypes' versus Clinical Feature #6: 'RADIATIONS.RADIATION.REGIMENINDICATION'
| nPatients | NO | YES |
|---|---|---|
| ALL | 3 | 561 |
| subtype1 | 2 | 223 |
| subtype2 | 1 | 206 |
| subtype3 | 0 | 132 |
Figure S6. Get High-res Image Clustering Approach #1: 'mRNA CNMF subtypes' versus Clinical Feature #6: 'RADIATIONS.RADIATION.REGIMENINDICATION'
P value = 0.371 (Fisher's exact test)
Table S8. Clustering Approach #1: 'mRNA CNMF subtypes' versus Clinical Feature #7: 'NEOADJUVANT.THERAPY'
| nPatients | NO | YES |
|---|---|---|
| ALL | 456 | 108 |
| subtype1 | 176 | 49 |
| subtype2 | 173 | 34 |
| subtype3 | 107 | 25 |
Figure S7. Get High-res Image Clustering Approach #1: 'mRNA CNMF subtypes' versus Clinical Feature #7: 'NEOADJUVANT.THERAPY'
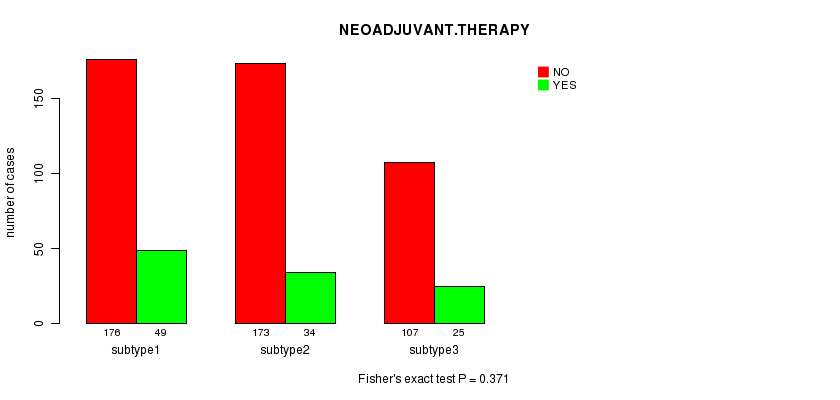
Table S9. Get Full Table Description of clustering approach #2: 'mRNA cHierClus subtypes'
| Cluster Labels | 1 | 2 | 3 |
|---|---|---|---|
| Number of samples | 209 | 223 | 132 |
P value = 0.00116 (logrank test)
Table S10. Clustering Approach #2: 'mRNA cHierClus subtypes' versus Clinical Feature #1: 'Time to Death'
| nPatients | nDeath | Duration Range (Median), Month | |
|---|---|---|---|
| ALL | 559 | 292 | 0.3 - 180.2 (28.3) |
| subtype1 | 206 | 124 | 0.3 - 152.0 (29.6) |
| subtype2 | 221 | 87 | 0.5 - 116.1 (27.5) |
| subtype3 | 132 | 81 | 0.3 - 180.2 (27.6) |
Figure S8. Get High-res Image Clustering Approach #2: 'mRNA cHierClus subtypes' versus Clinical Feature #1: 'Time to Death'
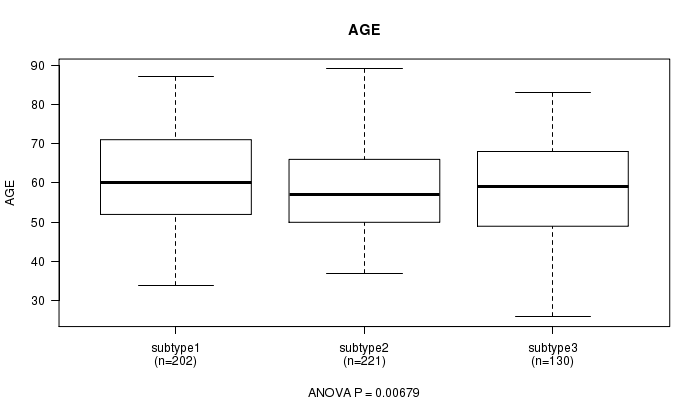
P value = 0.00679 (ANOVA)
Table S11. Clustering Approach #2: 'mRNA cHierClus subtypes' versus Clinical Feature #2: 'AGE'
| nPatients | Mean (Std.Dev) | |
|---|---|---|
| ALL | 553 | 59.7 (11.6) |
| subtype1 | 202 | 61.7 (11.5) |
| subtype2 | 221 | 58.5 (11.0) |
| subtype3 | 130 | 58.6 (12.4) |
Figure S9. Get High-res Image Clustering Approach #2: 'mRNA cHierClus subtypes' versus Clinical Feature #2: 'AGE'
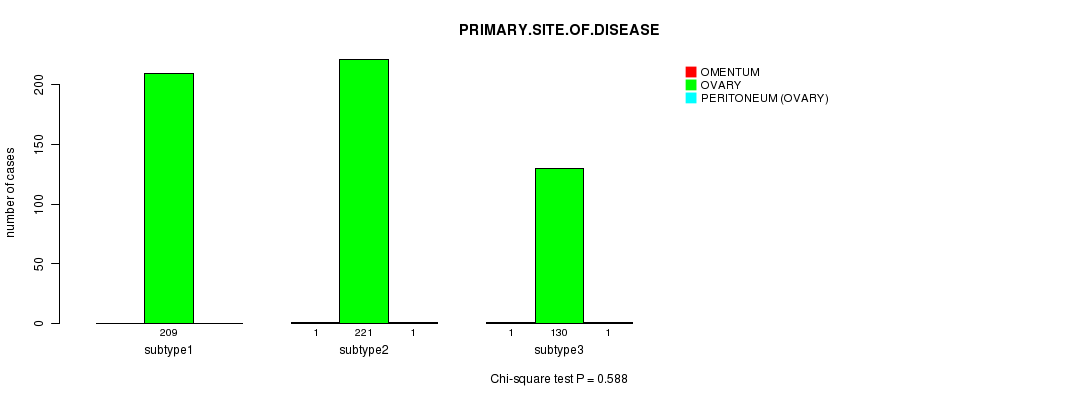
P value = 0.588 (Chi-square test)
Table S12. Clustering Approach #2: 'mRNA cHierClus subtypes' versus Clinical Feature #3: 'PRIMARY.SITE.OF.DISEASE'
| nPatients | OMENTUM | OVARY | PERITONEUM (OVARY) |
|---|---|---|---|
| ALL | 2 | 560 | 2 |
| subtype1 | 0 | 209 | 0 |
| subtype2 | 1 | 221 | 1 |
| subtype3 | 1 | 130 | 1 |
Figure S10. Get High-res Image Clustering Approach #2: 'mRNA cHierClus subtypes' versus Clinical Feature #3: 'PRIMARY.SITE.OF.DISEASE'
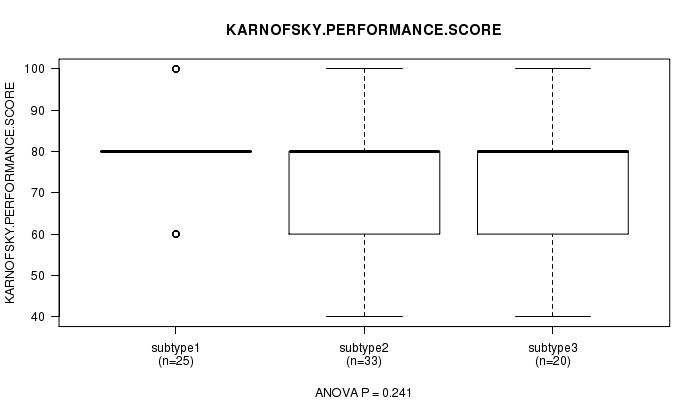
P value = 0.241 (ANOVA)
Table S13. Clustering Approach #2: 'mRNA cHierClus subtypes' versus Clinical Feature #4: 'KARNOFSKY.PERFORMANCE.SCORE'
| nPatients | Mean (Std.Dev) | |
|---|---|---|
| ALL | 78 | 75.6 (12.8) |
| subtype1 | 25 | 79.2 (13.5) |
| subtype2 | 33 | 73.9 (11.7) |
| subtype3 | 20 | 74.0 (13.1) |
Figure S11. Get High-res Image Clustering Approach #2: 'mRNA cHierClus subtypes' versus Clinical Feature #4: 'KARNOFSKY.PERFORMANCE.SCORE'
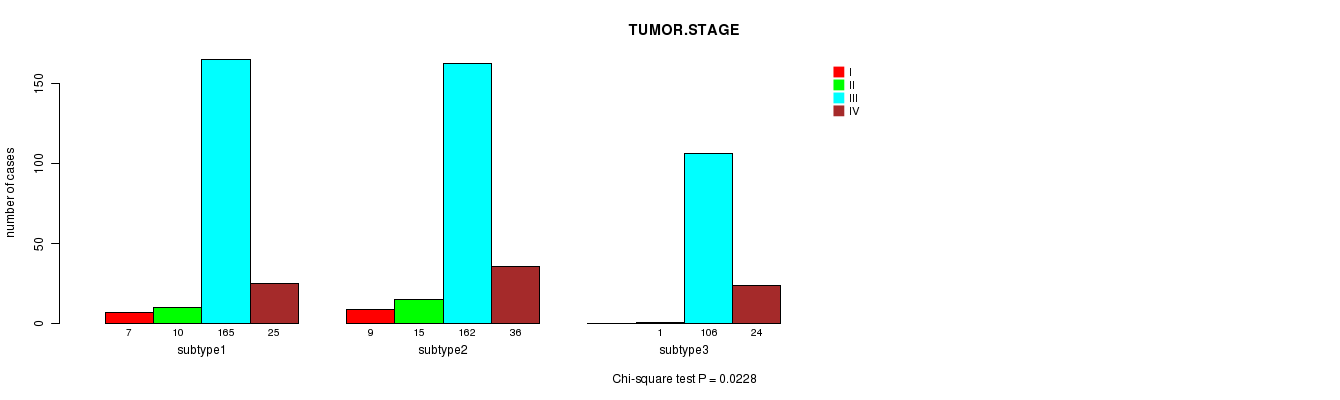
P value = 0.0228 (Chi-square test)
Table S14. Clustering Approach #2: 'mRNA cHierClus subtypes' versus Clinical Feature #5: 'TUMOR.STAGE'
| nPatients | I | II | III | IV |
|---|---|---|---|---|
| ALL | 16 | 26 | 433 | 85 |
| subtype1 | 7 | 10 | 165 | 25 |
| subtype2 | 9 | 15 | 162 | 36 |
| subtype3 | 0 | 1 | 106 | 24 |
Figure S12. Get High-res Image Clustering Approach #2: 'mRNA cHierClus subtypes' versus Clinical Feature #5: 'TUMOR.STAGE'
P value = 0.619 (Fisher's exact test)
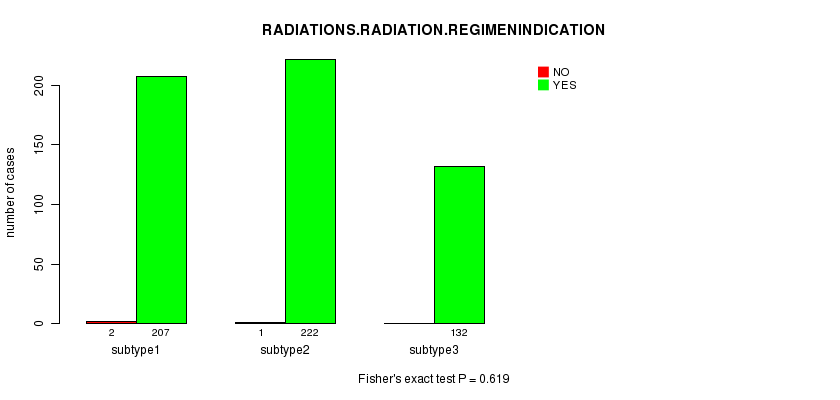
Table S15. Clustering Approach #2: 'mRNA cHierClus subtypes' versus Clinical Feature #6: 'RADIATIONS.RADIATION.REGIMENINDICATION'
| nPatients | NO | YES |
|---|---|---|
| ALL | 3 | 561 |
| subtype1 | 2 | 207 |
| subtype2 | 1 | 222 |
| subtype3 | 0 | 132 |
Figure S13. Get High-res Image Clustering Approach #2: 'mRNA cHierClus subtypes' versus Clinical Feature #6: 'RADIATIONS.RADIATION.REGIMENINDICATION'
P value = 0.0475 (Fisher's exact test)
Table S16. Clustering Approach #2: 'mRNA cHierClus subtypes' versus Clinical Feature #7: 'NEOADJUVANT.THERAPY'
| nPatients | NO | YES |
|---|---|---|
| ALL | 456 | 108 |
| subtype1 | 160 | 49 |
| subtype2 | 191 | 32 |
| subtype3 | 105 | 27 |
Figure S14. Get High-res Image Clustering Approach #2: 'mRNA cHierClus subtypes' versus Clinical Feature #7: 'NEOADJUVANT.THERAPY'
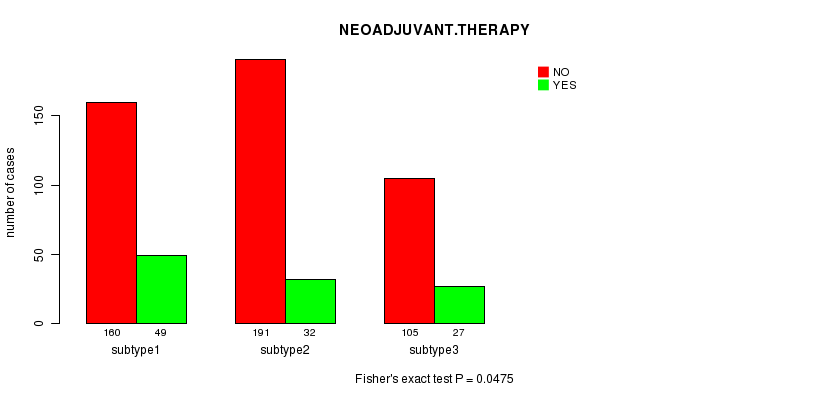
Table S17. Get Full Table Description of clustering approach #3: 'miR CNMF subtypes'
| Cluster Labels | 1 | 2 | 3 |
|---|---|---|---|
| Number of samples | 159 | 163 | 240 |
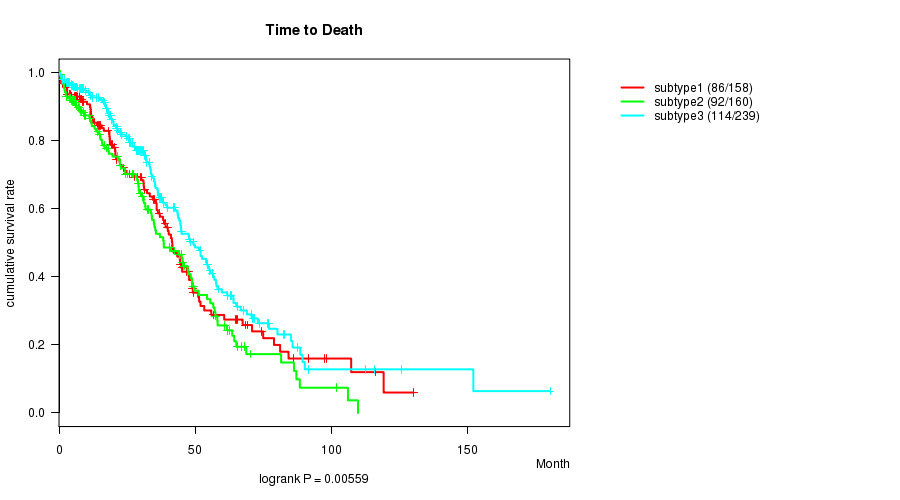
P value = 0.00559 (logrank test)
Table S18. Clustering Approach #3: 'miR CNMF subtypes' versus Clinical Feature #1: 'Time to Death'
| nPatients | nDeath | Duration Range (Median), Month | |
|---|---|---|---|
| ALL | 557 | 292 | 0.3 - 180.2 (28.2) |
| subtype1 | 158 | 86 | 0.3 - 130.0 (25.5) |
| subtype2 | 160 | 92 | 0.3 - 109.7 (24.7) |
| subtype3 | 239 | 114 | 0.3 - 180.2 (30.1) |
Figure S15. Get High-res Image Clustering Approach #3: 'miR CNMF subtypes' versus Clinical Feature #1: 'Time to Death'
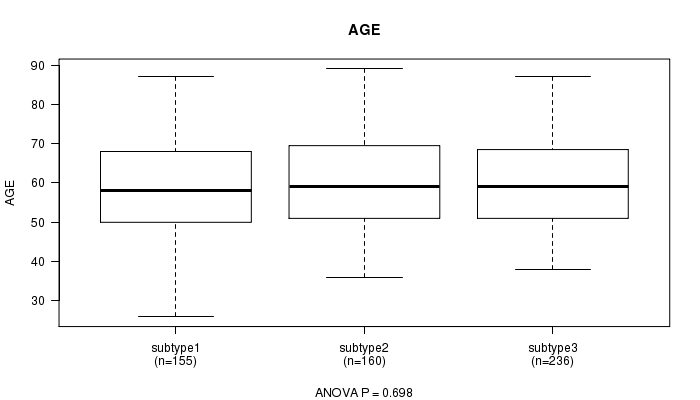
P value = 0.698 (ANOVA)
Table S19. Clustering Approach #3: 'miR CNMF subtypes' versus Clinical Feature #2: 'AGE'
| nPatients | Mean (Std.Dev) | |
|---|---|---|
| ALL | 551 | 59.7 (11.6) |
| subtype1 | 155 | 59.0 (12.3) |
| subtype2 | 160 | 59.8 (11.8) |
| subtype3 | 236 | 60.1 (11.1) |
Figure S16. Get High-res Image Clustering Approach #3: 'miR CNMF subtypes' versus Clinical Feature #2: 'AGE'
P value = 0.201 (Chi-square test)
Table S20. Clustering Approach #3: 'miR CNMF subtypes' versus Clinical Feature #3: 'PRIMARY.SITE.OF.DISEASE'
| nPatients | OMENTUM | OVARY | PERITONEUM (OVARY) |
|---|---|---|---|
| ALL | 2 | 558 | 2 |
| subtype1 | 0 | 157 | 2 |
| subtype2 | 1 | 162 | 0 |
| subtype3 | 1 | 239 | 0 |
Figure S17. Get High-res Image Clustering Approach #3: 'miR CNMF subtypes' versus Clinical Feature #3: 'PRIMARY.SITE.OF.DISEASE'

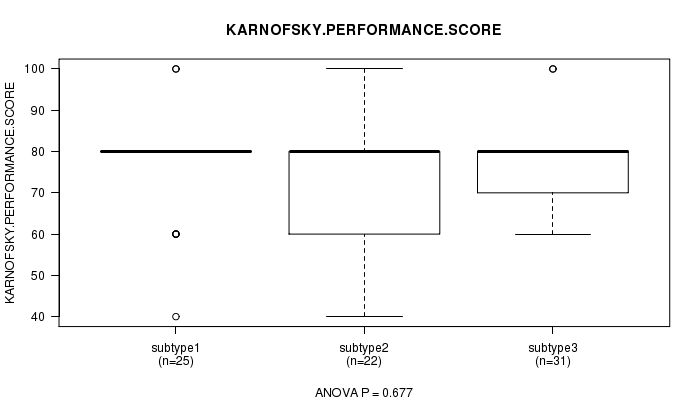
P value = 0.677 (ANOVA)
Table S21. Clustering Approach #3: 'miR CNMF subtypes' versus Clinical Feature #4: 'KARNOFSKY.PERFORMANCE.SCORE'
| nPatients | Mean (Std.Dev) | |
|---|---|---|
| ALL | 78 | 75.6 (12.8) |
| subtype1 | 25 | 76.8 (12.5) |
| subtype2 | 22 | 73.6 (15.6) |
| subtype3 | 31 | 76.1 (10.9) |
Figure S18. Get High-res Image Clustering Approach #3: 'miR CNMF subtypes' versus Clinical Feature #4: 'KARNOFSKY.PERFORMANCE.SCORE'
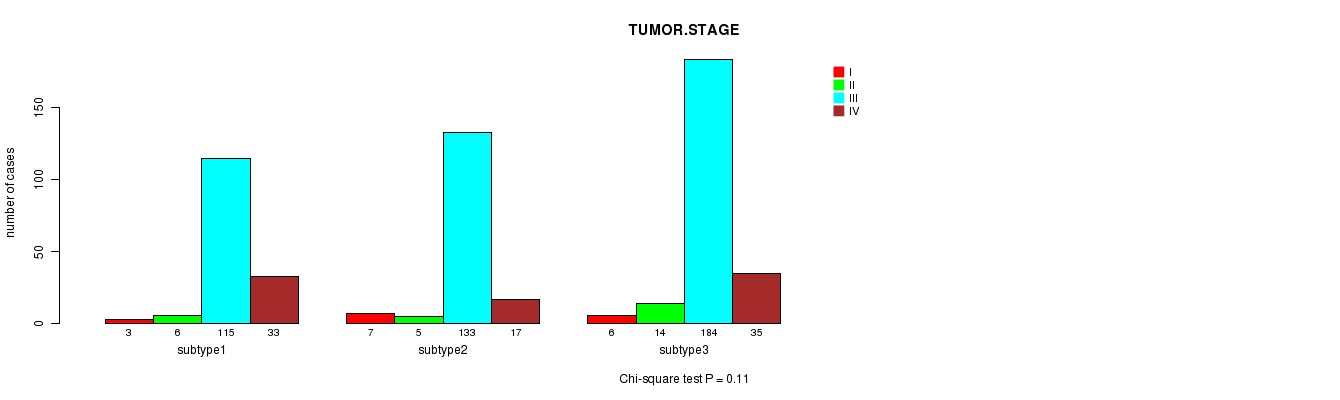
P value = 0.11 (Chi-square test)
Table S22. Clustering Approach #3: 'miR CNMF subtypes' versus Clinical Feature #5: 'TUMOR.STAGE'
| nPatients | I | II | III | IV |
|---|---|---|---|---|
| ALL | 16 | 25 | 432 | 85 |
| subtype1 | 3 | 6 | 115 | 33 |
| subtype2 | 7 | 5 | 133 | 17 |
| subtype3 | 6 | 14 | 184 | 35 |
Figure S19. Get High-res Image Clustering Approach #3: 'miR CNMF subtypes' versus Clinical Feature #5: 'TUMOR.STAGE'
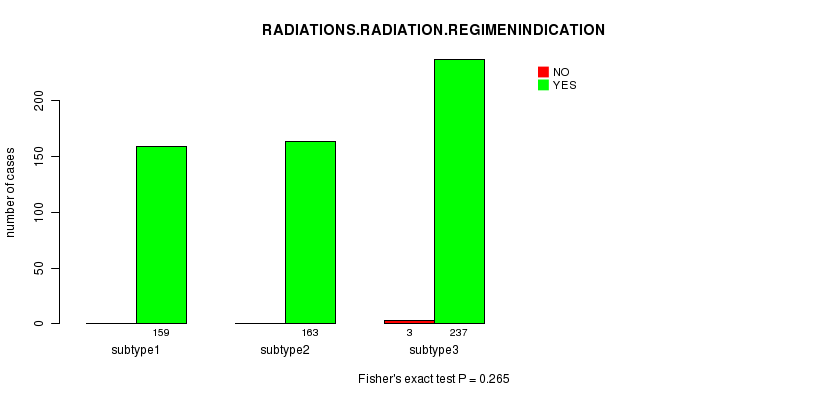
P value = 0.265 (Fisher's exact test)
Table S23. Clustering Approach #3: 'miR CNMF subtypes' versus Clinical Feature #6: 'RADIATIONS.RADIATION.REGIMENINDICATION'
| nPatients | NO | YES |
|---|---|---|
| ALL | 3 | 559 |
| subtype1 | 0 | 159 |
| subtype2 | 0 | 163 |
| subtype3 | 3 | 237 |
Figure S20. Get High-res Image Clustering Approach #3: 'miR CNMF subtypes' versus Clinical Feature #6: 'RADIATIONS.RADIATION.REGIMENINDICATION'
P value = 0.275 (Fisher's exact test)
Table S24. Clustering Approach #3: 'miR CNMF subtypes' versus Clinical Feature #7: 'NEOADJUVANT.THERAPY'
| nPatients | NO | YES |
|---|---|---|
| ALL | 454 | 108 |
| subtype1 | 130 | 29 |
| subtype2 | 125 | 38 |
| subtype3 | 199 | 41 |
Figure S21. Get High-res Image Clustering Approach #3: 'miR CNMF subtypes' versus Clinical Feature #7: 'NEOADJUVANT.THERAPY'
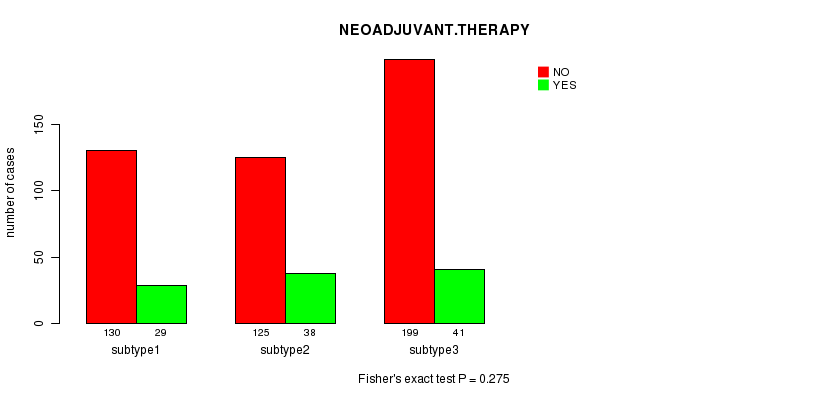
Table S25. Get Full Table Description of clustering approach #4: 'miR cHierClus subtypes'
| Cluster Labels | 1 | 2 | 3 |
|---|---|---|---|
| Number of samples | 200 | 186 | 176 |
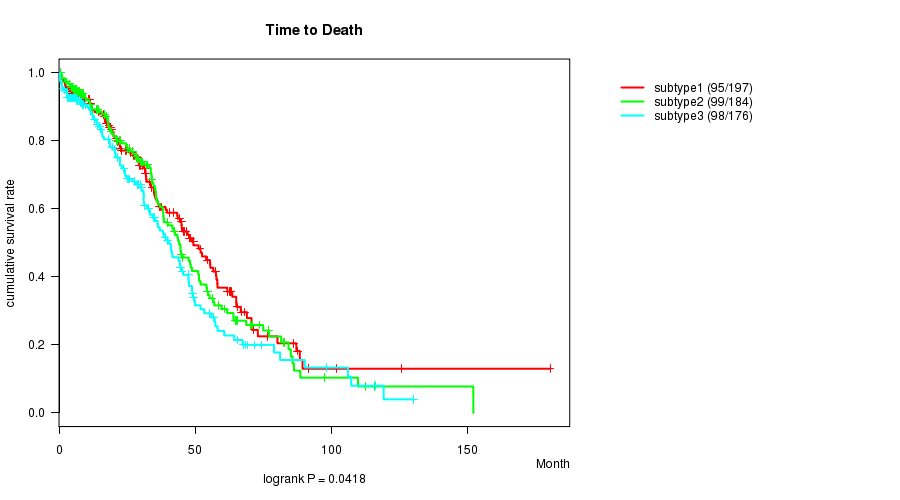
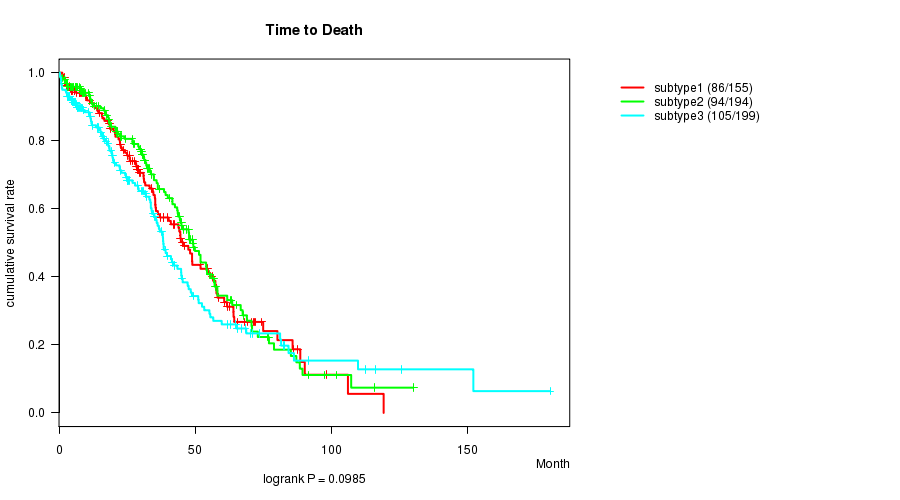
P value = 0.0418 (logrank test)
Table S26. Clustering Approach #4: 'miR cHierClus subtypes' versus Clinical Feature #1: 'Time to Death'
| nPatients | nDeath | Duration Range (Median), Month | |
|---|---|---|---|
| ALL | 557 | 292 | 0.3 - 180.2 (28.2) |
| subtype1 | 197 | 95 | 0.3 - 180.2 (29.0) |
| subtype2 | 184 | 99 | 0.5 - 152.0 (29.0) |
| subtype3 | 176 | 98 | 0.3 - 130.0 (24.6) |
Figure S22. Get High-res Image Clustering Approach #4: 'miR cHierClus subtypes' versus Clinical Feature #1: 'Time to Death'
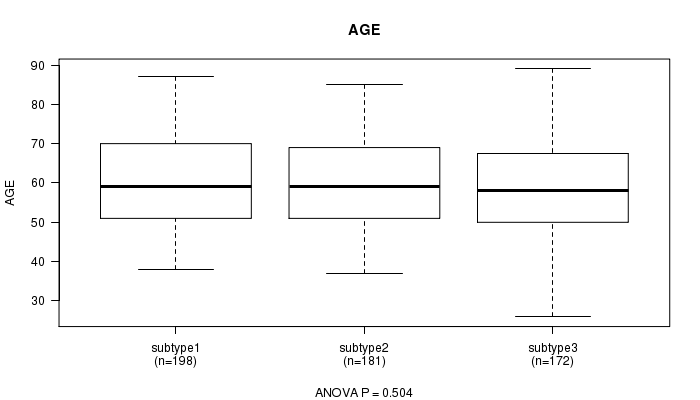
P value = 0.504 (ANOVA)
Table S27. Clustering Approach #4: 'miR cHierClus subtypes' versus Clinical Feature #2: 'AGE'
| nPatients | Mean (Std.Dev) | |
|---|---|---|
| ALL | 551 | 59.7 (11.6) |
| subtype1 | 198 | 60.0 (11.8) |
| subtype2 | 181 | 60.2 (11.0) |
| subtype3 | 172 | 58.8 (12.2) |
Figure S23. Get High-res Image Clustering Approach #4: 'miR cHierClus subtypes' versus Clinical Feature #2: 'AGE'
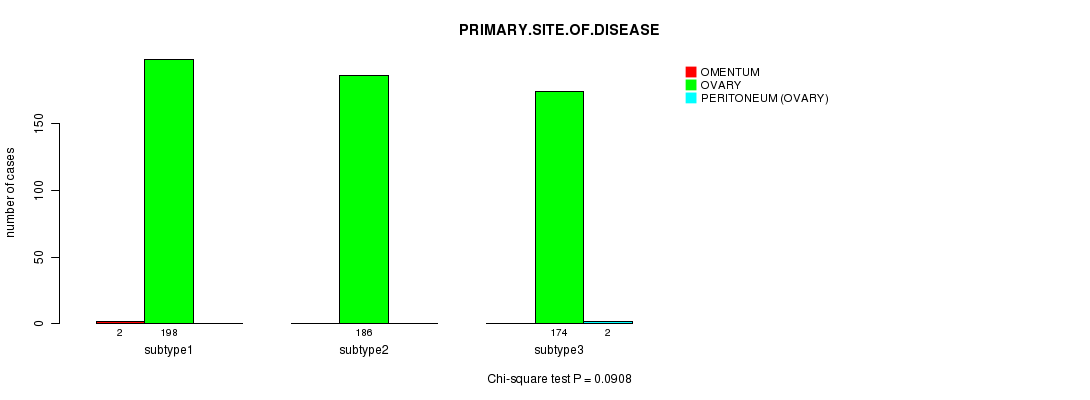
P value = 0.0908 (Chi-square test)
Table S28. Clustering Approach #4: 'miR cHierClus subtypes' versus Clinical Feature #3: 'PRIMARY.SITE.OF.DISEASE'
| nPatients | OMENTUM | OVARY | PERITONEUM (OVARY) |
|---|---|---|---|
| ALL | 2 | 558 | 2 |
| subtype1 | 2 | 198 | 0 |
| subtype2 | 0 | 186 | 0 |
| subtype3 | 0 | 174 | 2 |
Figure S24. Get High-res Image Clustering Approach #4: 'miR cHierClus subtypes' versus Clinical Feature #3: 'PRIMARY.SITE.OF.DISEASE'
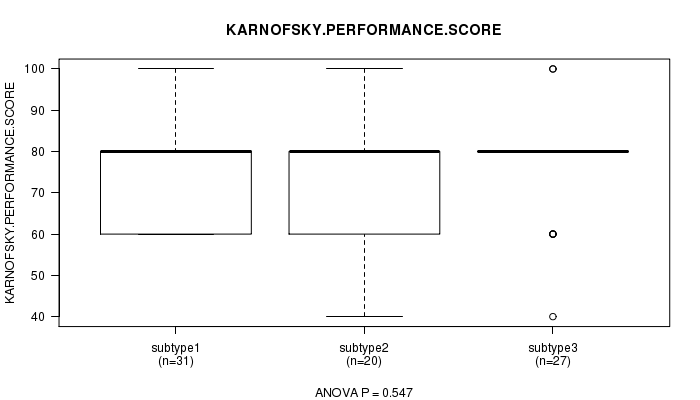
P value = 0.547 (ANOVA)
Table S29. Clustering Approach #4: 'miR cHierClus subtypes' versus Clinical Feature #4: 'KARNOFSKY.PERFORMANCE.SCORE'
| nPatients | Mean (Std.Dev) | |
|---|---|---|
| ALL | 78 | 75.6 (12.8) |
| subtype1 | 31 | 76.1 (13.1) |
| subtype2 | 20 | 73.0 (13.4) |
| subtype3 | 27 | 77.0 (12.0) |
Figure S25. Get High-res Image Clustering Approach #4: 'miR cHierClus subtypes' versus Clinical Feature #4: 'KARNOFSKY.PERFORMANCE.SCORE'
P value = 0.0541 (Chi-square test)
Table S30. Clustering Approach #4: 'miR cHierClus subtypes' versus Clinical Feature #5: 'TUMOR.STAGE'
| nPatients | I | II | III | IV |
|---|---|---|---|---|
| ALL | 16 | 25 | 432 | 85 |
| subtype1 | 4 | 9 | 152 | 33 |
| subtype2 | 9 | 10 | 149 | 17 |
| subtype3 | 3 | 6 | 131 | 35 |
Figure S26. Get High-res Image Clustering Approach #4: 'miR cHierClus subtypes' versus Clinical Feature #5: 'TUMOR.STAGE'
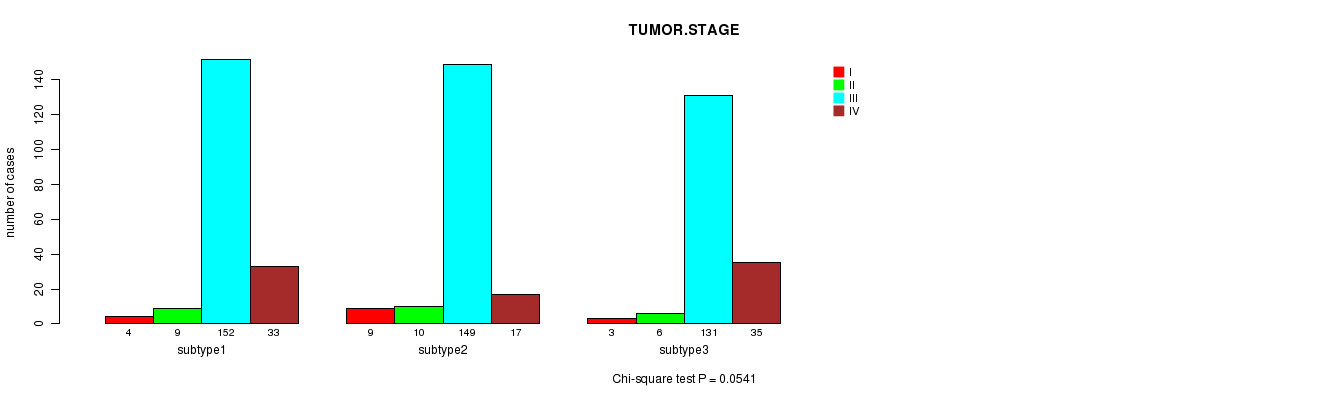
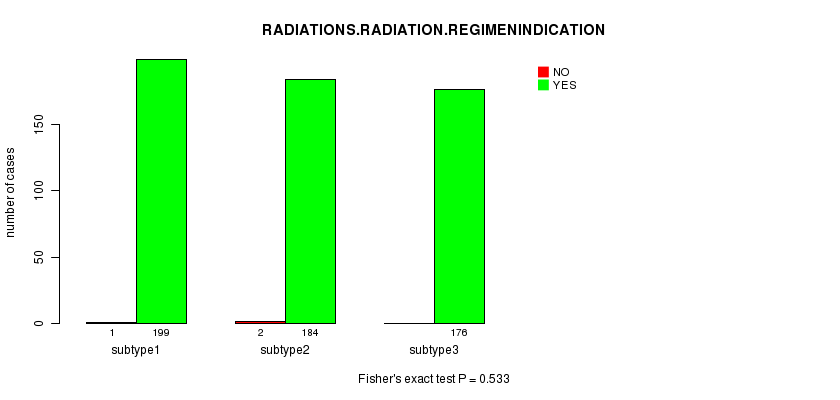
P value = 0.533 (Fisher's exact test)
Table S31. Clustering Approach #4: 'miR cHierClus subtypes' versus Clinical Feature #6: 'RADIATIONS.RADIATION.REGIMENINDICATION'
| nPatients | NO | YES |
|---|---|---|
| ALL | 3 | 559 |
| subtype1 | 1 | 199 |
| subtype2 | 2 | 184 |
| subtype3 | 0 | 176 |
Figure S27. Get High-res Image Clustering Approach #4: 'miR cHierClus subtypes' versus Clinical Feature #6: 'RADIATIONS.RADIATION.REGIMENINDICATION'
P value = 0.641 (Fisher's exact test)
Table S32. Clustering Approach #4: 'miR cHierClus subtypes' versus Clinical Feature #7: 'NEOADJUVANT.THERAPY'
| nPatients | NO | YES |
|---|---|---|
| ALL | 454 | 108 |
| subtype1 | 164 | 36 |
| subtype2 | 146 | 40 |
| subtype3 | 144 | 32 |
Figure S28. Get High-res Image Clustering Approach #4: 'miR cHierClus subtypes' versus Clinical Feature #7: 'NEOADJUVANT.THERAPY'
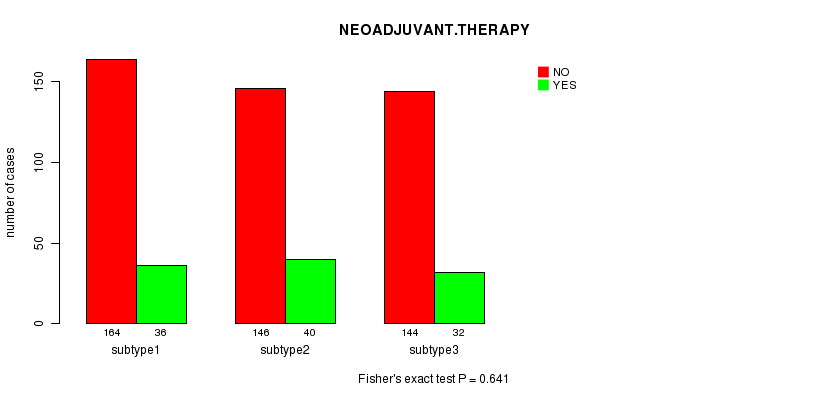
Table S33. Get Full Table Description of clustering approach #5: 'CN CNMF'
| Cluster Labels | 1 | 2 | 3 |
|---|---|---|---|
| Number of samples | 157 | 195 | 202 |
P value = 0.0985 (logrank test)
Table S34. Clustering Approach #5: 'CN CNMF' versus Clinical Feature #1: 'Time to Death'
| nPatients | nDeath | Duration Range (Median), Month | |
|---|---|---|---|
| ALL | 548 | 285 | 0.3 - 180.2 (28.3) |
| subtype1 | 155 | 86 | 1.2 - 119.1 (29.5) |
| subtype2 | 194 | 94 | 0.3 - 130.0 (30.2) |
| subtype3 | 199 | 105 | 0.3 - 180.2 (22.3) |
Figure S29. Get High-res Image Clustering Approach #5: 'CN CNMF' versus Clinical Feature #1: 'Time to Death'
P value = 3.19e-08 (ANOVA)
Table S35. Clustering Approach #5: 'CN CNMF' versus Clinical Feature #2: 'AGE'
| nPatients | Mean (Std.Dev) | |
|---|---|---|
| ALL | 543 | 59.8 (11.6) |
| subtype1 | 153 | 59.6 (12.4) |
| subtype2 | 194 | 56.4 (11.0) |
| subtype3 | 196 | 63.2 (10.6) |
Figure S30. Get High-res Image Clustering Approach #5: 'CN CNMF' versus Clinical Feature #2: 'AGE'
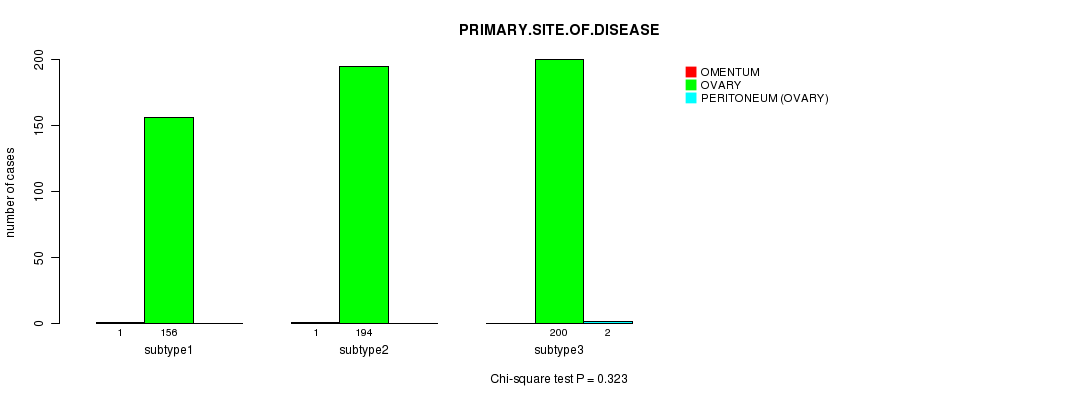
P value = 0.323 (Chi-square test)
Table S36. Clustering Approach #5: 'CN CNMF' versus Clinical Feature #3: 'PRIMARY.SITE.OF.DISEASE'
| nPatients | OMENTUM | OVARY | PERITONEUM (OVARY) |
|---|---|---|---|
| ALL | 2 | 550 | 2 |
| subtype1 | 1 | 156 | 0 |
| subtype2 | 1 | 194 | 0 |
| subtype3 | 0 | 200 | 2 |
Figure S31. Get High-res Image Clustering Approach #5: 'CN CNMF' versus Clinical Feature #3: 'PRIMARY.SITE.OF.DISEASE'
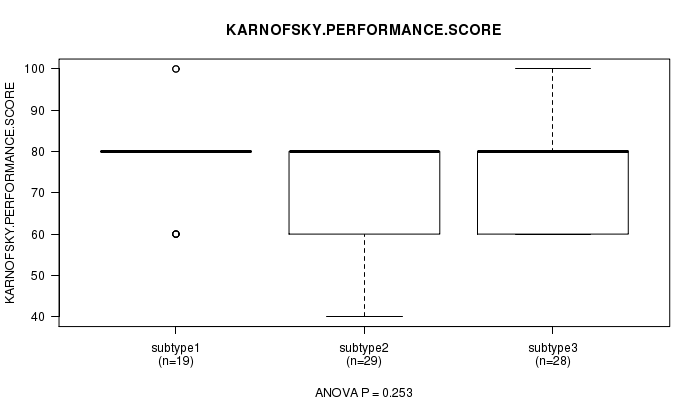
P value = 0.253 (ANOVA)
Table S37. Clustering Approach #5: 'CN CNMF' versus Clinical Feature #4: 'KARNOFSKY.PERFORMANCE.SCORE'
| nPatients | Mean (Std.Dev) | |
|---|---|---|
| ALL | 76 | 75.5 (12.9) |
| subtype1 | 19 | 77.9 (11.3) |
| subtype2 | 29 | 72.4 (12.4) |
| subtype3 | 28 | 77.1 (14.1) |
Figure S32. Get High-res Image Clustering Approach #5: 'CN CNMF' versus Clinical Feature #4: 'KARNOFSKY.PERFORMANCE.SCORE'
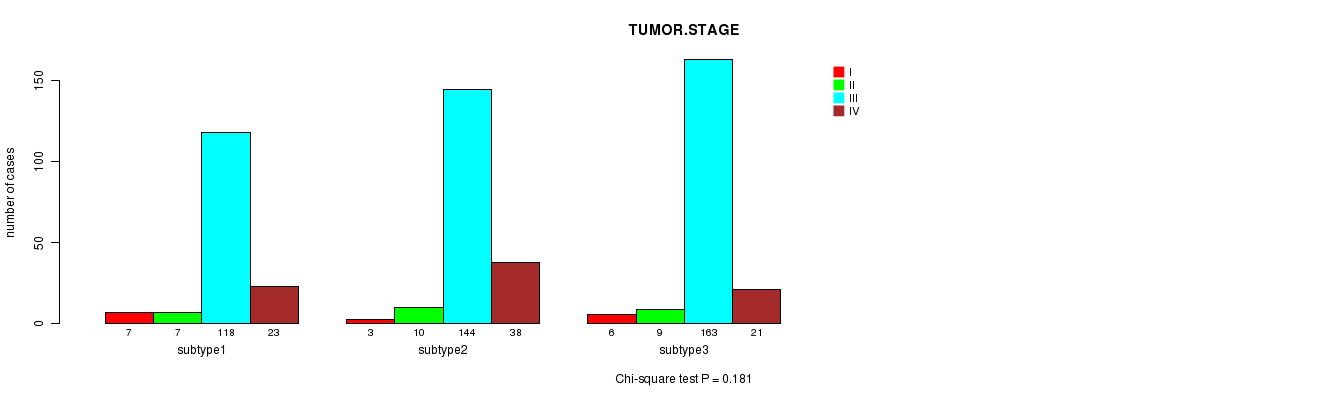
P value = 0.181 (Chi-square test)
Table S38. Clustering Approach #5: 'CN CNMF' versus Clinical Feature #5: 'TUMOR.STAGE'
| nPatients | I | II | III | IV |
|---|---|---|---|---|
| ALL | 16 | 26 | 425 | 82 |
| subtype1 | 7 | 7 | 118 | 23 |
| subtype2 | 3 | 10 | 144 | 38 |
| subtype3 | 6 | 9 | 163 | 21 |
Figure S33. Get High-res Image Clustering Approach #5: 'CN CNMF' versus Clinical Feature #5: 'TUMOR.STAGE'
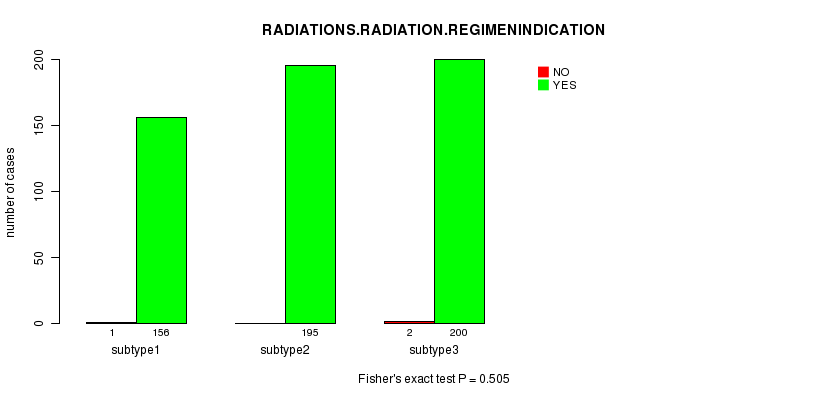
P value = 0.505 (Fisher's exact test)
Table S39. Clustering Approach #5: 'CN CNMF' versus Clinical Feature #6: 'RADIATIONS.RADIATION.REGIMENINDICATION'
| nPatients | NO | YES |
|---|---|---|
| ALL | 3 | 551 |
| subtype1 | 1 | 156 |
| subtype2 | 0 | 195 |
| subtype3 | 2 | 200 |
Figure S34. Get High-res Image Clustering Approach #5: 'CN CNMF' versus Clinical Feature #6: 'RADIATIONS.RADIATION.REGIMENINDICATION'
P value = 0.0759 (Fisher's exact test)
Table S40. Clustering Approach #5: 'CN CNMF' versus Clinical Feature #7: 'NEOADJUVANT.THERAPY'
| nPatients | NO | YES |
|---|---|---|
| ALL | 450 | 104 |
| subtype1 | 128 | 29 |
| subtype2 | 167 | 28 |
| subtype3 | 155 | 47 |
Figure S35. Get High-res Image Clustering Approach #5: 'CN CNMF' versus Clinical Feature #7: 'NEOADJUVANT.THERAPY'
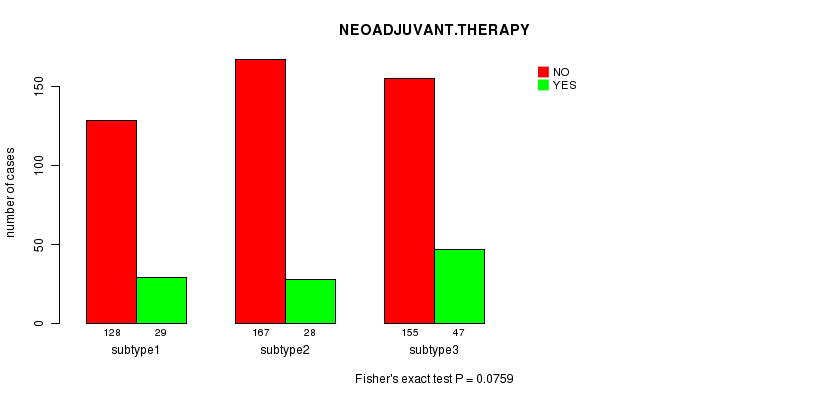
Table S41. Get Full Table Description of clustering approach #6: 'METHLYATION CNMF'
| Cluster Labels | 1 | 2 | 3 | 4 |
|---|---|---|---|---|
| Number of samples | 105 | 137 | 151 | 156 |
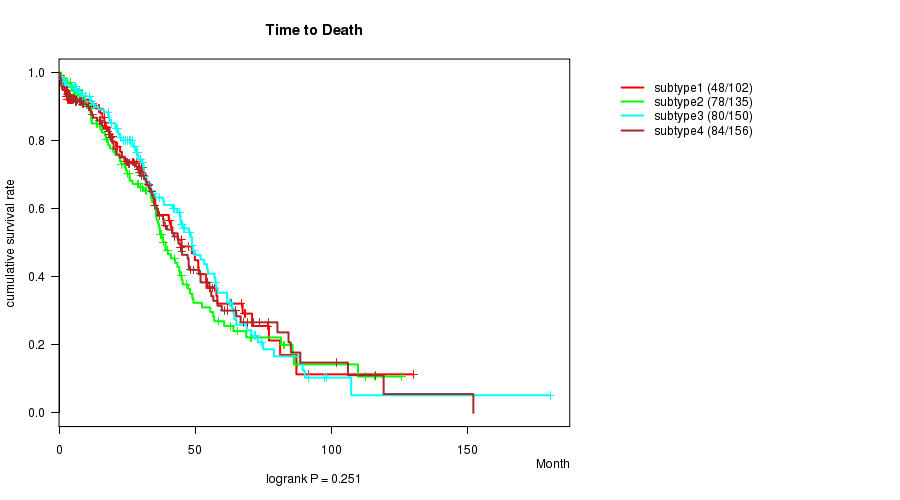
P value = 0.251 (logrank test)
Table S42. Clustering Approach #6: 'METHLYATION CNMF' versus Clinical Feature #1: 'Time to Death'
| nPatients | nDeath | Duration Range (Median), Month | |
|---|---|---|---|
| ALL | 543 | 290 | 0.3 - 180.2 (29.0) |
| subtype1 | 102 | 48 | 0.4 - 130.0 (23.5) |
| subtype2 | 135 | 78 | 0.8 - 125.7 (29.1) |
| subtype3 | 150 | 80 | 0.3 - 180.2 (30.3) |
| subtype4 | 156 | 84 | 0.3 - 152.0 (29.4) |
Figure S36. Get High-res Image Clustering Approach #6: 'METHLYATION CNMF' versus Clinical Feature #1: 'Time to Death'
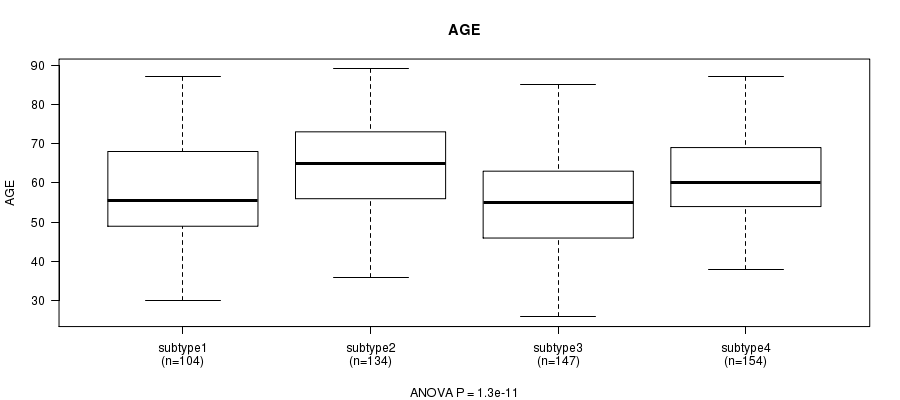
P value = 1.3e-11 (ANOVA)
Table S43. Clustering Approach #6: 'METHLYATION CNMF' versus Clinical Feature #2: 'AGE'
| nPatients | Mean (Std.Dev) | |
|---|---|---|
| ALL | 539 | 59.7 (11.7) |
| subtype1 | 104 | 58.3 (12.5) |
| subtype2 | 134 | 64.5 (11.0) |
| subtype3 | 147 | 54.9 (11.2) |
| subtype4 | 154 | 61.1 (10.2) |
Figure S37. Get High-res Image Clustering Approach #6: 'METHLYATION CNMF' versus Clinical Feature #2: 'AGE'
P value = 0.656 (Chi-square test)
Table S44. Clustering Approach #6: 'METHLYATION CNMF' versus Clinical Feature #3: 'PRIMARY.SITE.OF.DISEASE'
| nPatients | OMENTUM | OVARY | PERITONEUM (OVARY) |
|---|---|---|---|
| ALL | 2 | 545 | 2 |
| subtype1 | 1 | 104 | 0 |
| subtype2 | 0 | 136 | 1 |
| subtype3 | 0 | 151 | 0 |
| subtype4 | 1 | 154 | 1 |
Figure S38. Get High-res Image Clustering Approach #6: 'METHLYATION CNMF' versus Clinical Feature #3: 'PRIMARY.SITE.OF.DISEASE'

P value = 0.509 (ANOVA)
Table S45. Clustering Approach #6: 'METHLYATION CNMF' versus Clinical Feature #4: 'KARNOFSKY.PERFORMANCE.SCORE'
| nPatients | Mean (Std.Dev) | |
|---|---|---|
| ALL | 78 | 75.6 (12.8) |
| subtype1 | 19 | 72.6 (13.7) |
| subtype2 | 19 | 75.8 (15.7) |
| subtype3 | 19 | 78.9 (8.1) |
| subtype4 | 21 | 75.2 (12.5) |
Figure S39. Get High-res Image Clustering Approach #6: 'METHLYATION CNMF' versus Clinical Feature #4: 'KARNOFSKY.PERFORMANCE.SCORE'
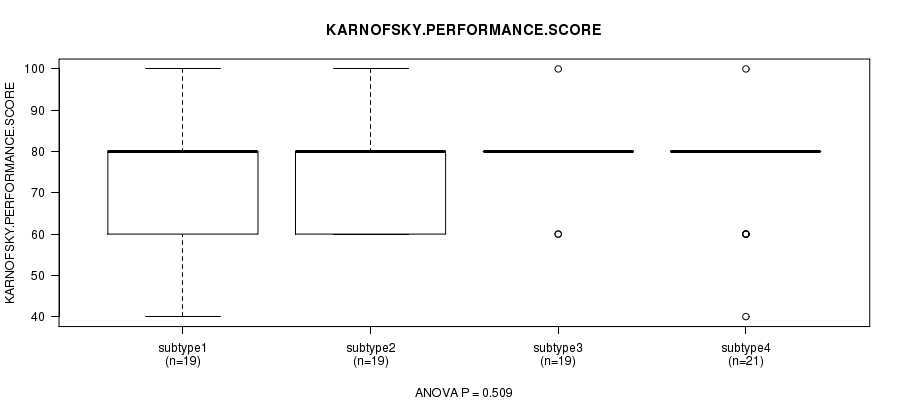
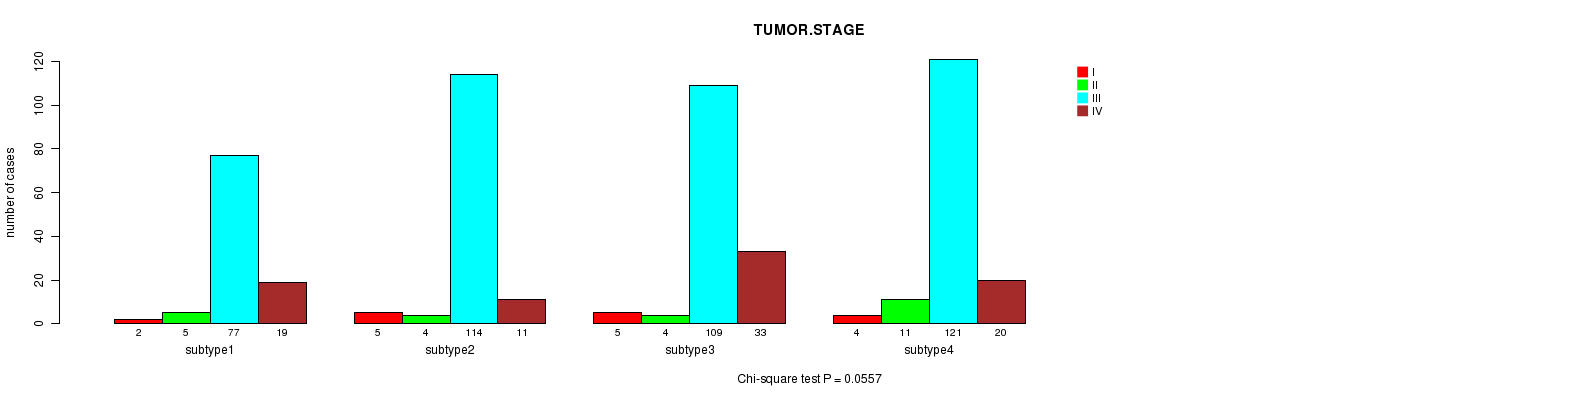
P value = 0.0557 (Chi-square test)
Table S46. Clustering Approach #6: 'METHLYATION CNMF' versus Clinical Feature #5: 'TUMOR.STAGE'
| nPatients | I | II | III | IV |
|---|---|---|---|---|
| ALL | 16 | 24 | 421 | 83 |
| subtype1 | 2 | 5 | 77 | 19 |
| subtype2 | 5 | 4 | 114 | 11 |
| subtype3 | 5 | 4 | 109 | 33 |
| subtype4 | 4 | 11 | 121 | 20 |
Figure S40. Get High-res Image Clustering Approach #6: 'METHLYATION CNMF' versus Clinical Feature #5: 'TUMOR.STAGE'
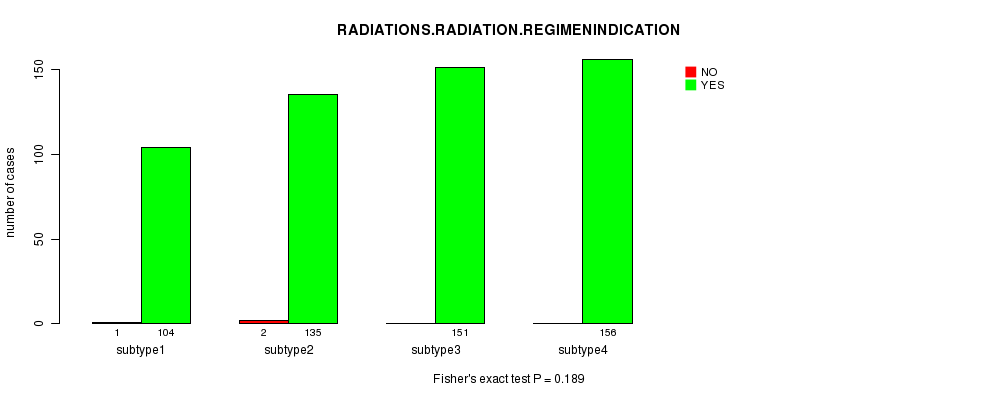
P value = 0.189 (Fisher's exact test)
Table S47. Clustering Approach #6: 'METHLYATION CNMF' versus Clinical Feature #6: 'RADIATIONS.RADIATION.REGIMENINDICATION'
| nPatients | NO | YES |
|---|---|---|
| ALL | 3 | 546 |
| subtype1 | 1 | 104 |
| subtype2 | 2 | 135 |
| subtype3 | 0 | 151 |
| subtype4 | 0 | 156 |
Figure S41. Get High-res Image Clustering Approach #6: 'METHLYATION CNMF' versus Clinical Feature #6: 'RADIATIONS.RADIATION.REGIMENINDICATION'
P value = 0.281 (Fisher's exact test)
Table S48. Clustering Approach #6: 'METHLYATION CNMF' versus Clinical Feature #7: 'NEOADJUVANT.THERAPY'
| nPatients | NO | YES |
|---|---|---|
| ALL | 441 | 108 |
| subtype1 | 84 | 21 |
| subtype2 | 106 | 31 |
| subtype3 | 129 | 22 |
| subtype4 | 122 | 34 |
Figure S42. Get High-res Image Clustering Approach #6: 'METHLYATION CNMF' versus Clinical Feature #7: 'NEOADJUVANT.THERAPY'

Table S49. Get Full Table Description of clustering approach #7: 'RPPA CNMF subtypes'
| Cluster Labels | 1 | 2 | 3 |
|---|---|---|---|
| Number of samples | 128 | 207 | 72 |
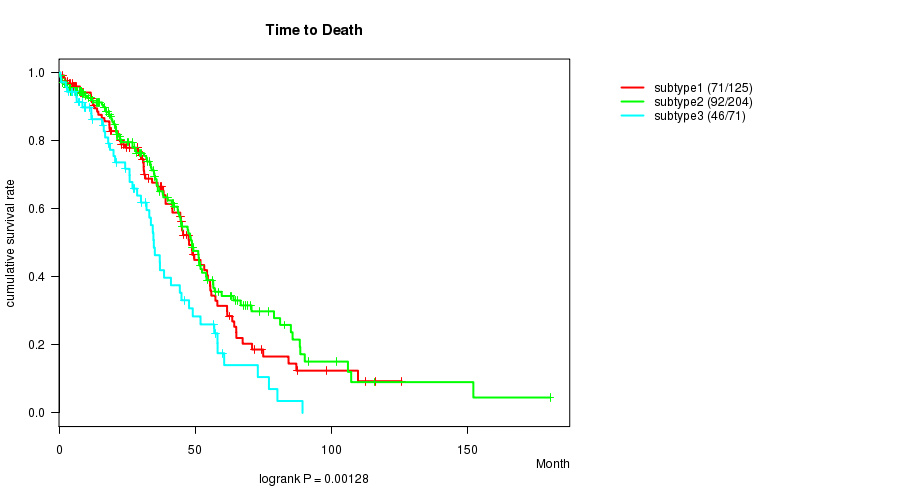
P value = 0.00128 (logrank test)
Table S50. Clustering Approach #7: 'RPPA CNMF subtypes' versus Clinical Feature #1: 'Time to Death'
| nPatients | nDeath | Duration Range (Median), Month | |
|---|---|---|---|
| ALL | 400 | 209 | 0.3 - 180.2 (28.6) |
| subtype1 | 125 | 71 | 0.4 - 125.7 (31.1) |
| subtype2 | 204 | 92 | 0.3 - 180.2 (25.2) |
| subtype3 | 71 | 46 | 0.5 - 89.3 (25.9) |
Figure S43. Get High-res Image Clustering Approach #7: 'RPPA CNMF subtypes' versus Clinical Feature #1: 'Time to Death'
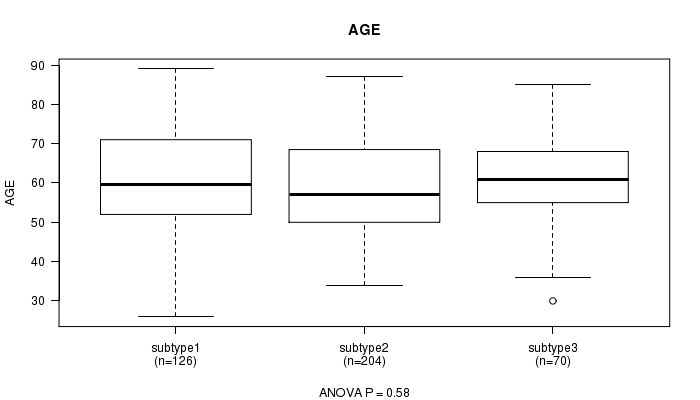
P value = 0.58 (ANOVA)
Table S51. Clustering Approach #7: 'RPPA CNMF subtypes' versus Clinical Feature #2: 'AGE'
| nPatients | Mean (Std.Dev) | |
|---|---|---|
| ALL | 400 | 59.7 (11.8) |
| subtype1 | 126 | 60.0 (12.3) |
| subtype2 | 204 | 59.1 (11.7) |
| subtype3 | 70 | 60.7 (11.3) |
Figure S44. Get High-res Image Clustering Approach #7: 'RPPA CNMF subtypes' versus Clinical Feature #2: 'AGE'
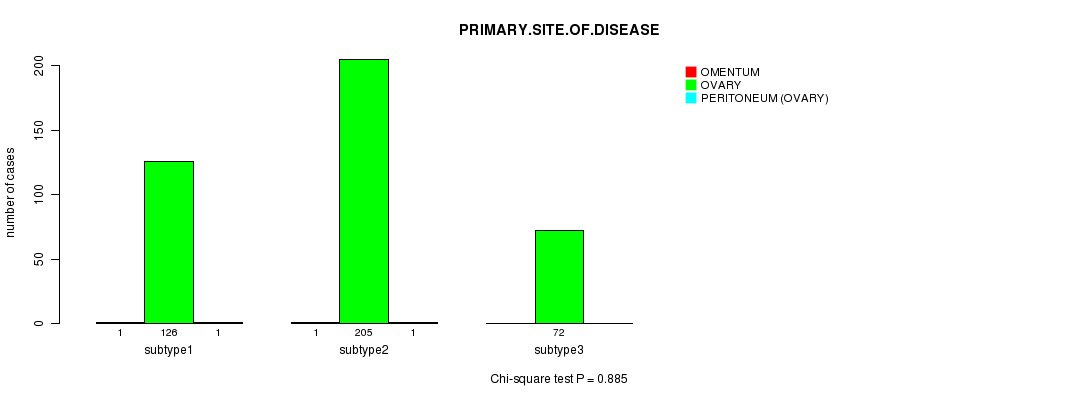
P value = 0.885 (Chi-square test)
Table S52. Clustering Approach #7: 'RPPA CNMF subtypes' versus Clinical Feature #3: 'PRIMARY.SITE.OF.DISEASE'
| nPatients | OMENTUM | OVARY | PERITONEUM (OVARY) |
|---|---|---|---|
| ALL | 2 | 403 | 2 |
| subtype1 | 1 | 126 | 1 |
| subtype2 | 1 | 205 | 1 |
| subtype3 | 0 | 72 | 0 |
Figure S45. Get High-res Image Clustering Approach #7: 'RPPA CNMF subtypes' versus Clinical Feature #3: 'PRIMARY.SITE.OF.DISEASE'
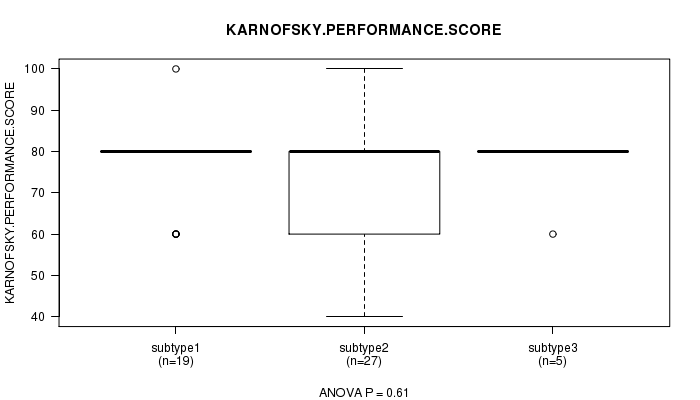
P value = 0.61 (ANOVA)
Table S53. Clustering Approach #7: 'RPPA CNMF subtypes' versus Clinical Feature #4: 'KARNOFSKY.PERFORMANCE.SCORE'
| nPatients | Mean (Std.Dev) | |
|---|---|---|
| ALL | 51 | 74.9 (11.9) |
| subtype1 | 19 | 76.8 (10.0) |
| subtype2 | 27 | 73.3 (13.6) |
| subtype3 | 5 | 76.0 (8.9) |
Figure S46. Get High-res Image Clustering Approach #7: 'RPPA CNMF subtypes' versus Clinical Feature #4: 'KARNOFSKY.PERFORMANCE.SCORE'
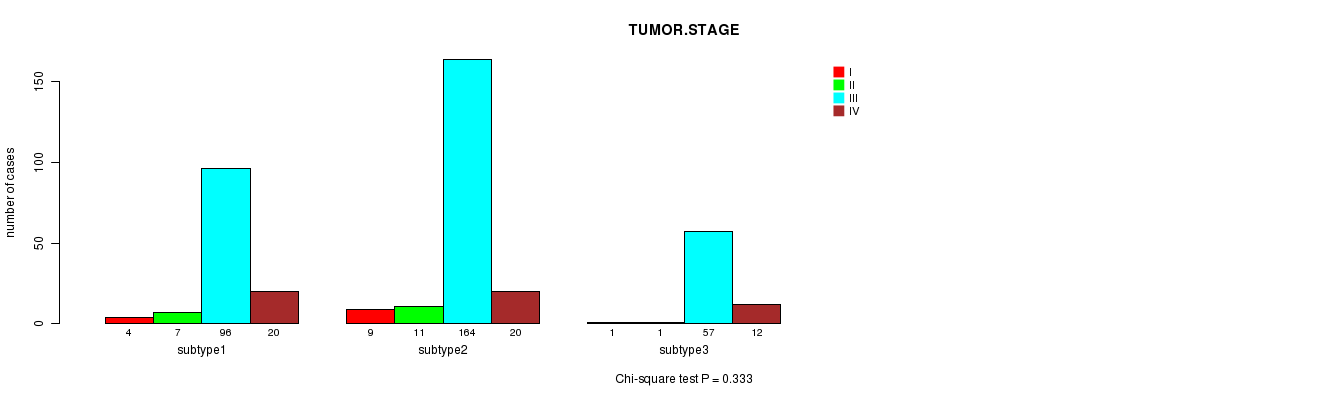
P value = 0.333 (Chi-square test)
Table S54. Clustering Approach #7: 'RPPA CNMF subtypes' versus Clinical Feature #5: 'TUMOR.STAGE'
| nPatients | I | II | III | IV |
|---|---|---|---|---|
| ALL | 14 | 19 | 317 | 52 |
| subtype1 | 4 | 7 | 96 | 20 |
| subtype2 | 9 | 11 | 164 | 20 |
| subtype3 | 1 | 1 | 57 | 12 |
Figure S47. Get High-res Image Clustering Approach #7: 'RPPA CNMF subtypes' versus Clinical Feature #5: 'TUMOR.STAGE'
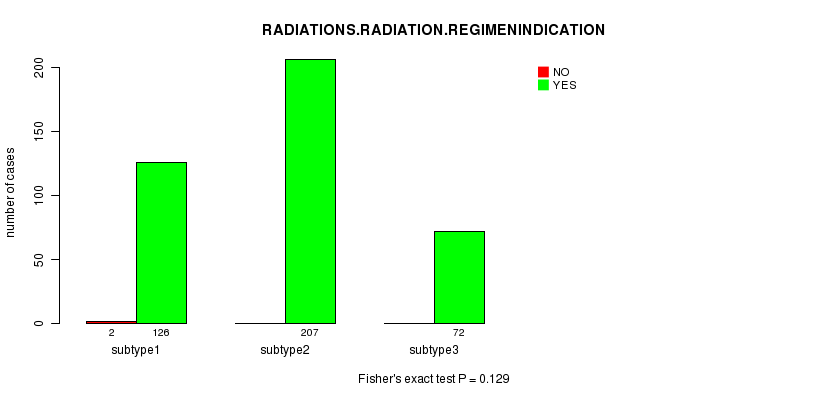
P value = 0.129 (Fisher's exact test)
Table S55. Clustering Approach #7: 'RPPA CNMF subtypes' versus Clinical Feature #6: 'RADIATIONS.RADIATION.REGIMENINDICATION'
| nPatients | NO | YES |
|---|---|---|
| ALL | 2 | 405 |
| subtype1 | 2 | 126 |
| subtype2 | 0 | 207 |
| subtype3 | 0 | 72 |
Figure S48. Get High-res Image Clustering Approach #7: 'RPPA CNMF subtypes' versus Clinical Feature #6: 'RADIATIONS.RADIATION.REGIMENINDICATION'
P value = 0.586 (Fisher's exact test)
Table S56. Clustering Approach #7: 'RPPA CNMF subtypes' versus Clinical Feature #7: 'NEOADJUVANT.THERAPY'
| nPatients | NO | YES |
|---|---|---|
| ALL | 334 | 73 |
| subtype1 | 106 | 22 |
| subtype2 | 172 | 35 |
| subtype3 | 56 | 16 |
Figure S49. Get High-res Image Clustering Approach #7: 'RPPA CNMF subtypes' versus Clinical Feature #7: 'NEOADJUVANT.THERAPY'
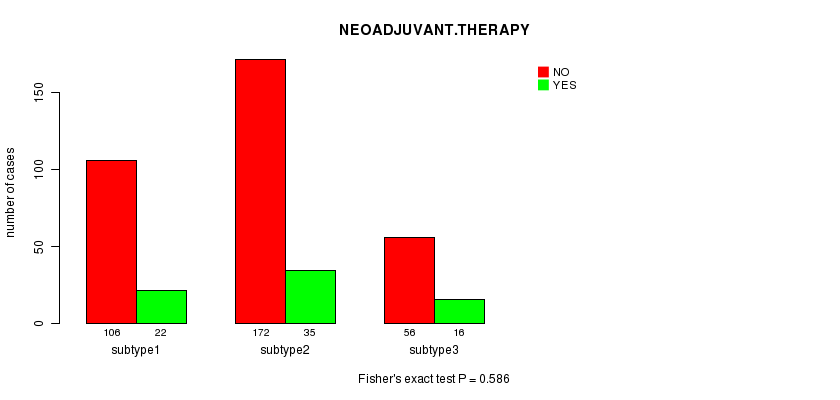
Table S57. Get Full Table Description of clustering approach #8: 'RPPA cHierClus subtypes'
| Cluster Labels | 1 | 2 | 3 | 4 |
|---|---|---|---|---|
| Number of samples | 101 | 68 | 145 | 93 |
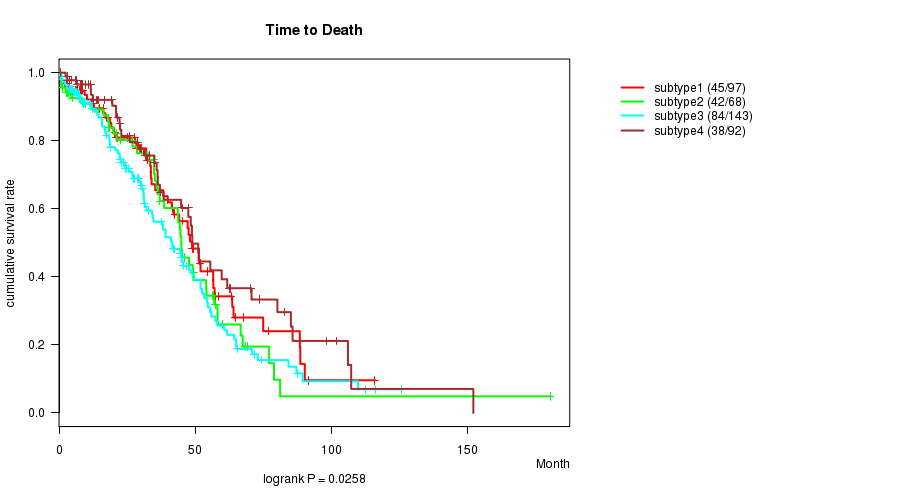
P value = 0.0258 (logrank test)
Table S58. Clustering Approach #8: 'RPPA cHierClus subtypes' versus Clinical Feature #1: 'Time to Death'
| nPatients | nDeath | Duration Range (Median), Month | |
|---|---|---|---|
| ALL | 400 | 209 | 0.3 - 180.2 (28.6) |
| subtype1 | 97 | 45 | 0.3 - 115.9 (28.5) |
| subtype2 | 68 | 42 | 0.8 - 180.2 (35.5) |
| subtype3 | 143 | 84 | 0.4 - 125.7 (27.5) |
| subtype4 | 92 | 38 | 0.5 - 152.0 (22.6) |
Figure S50. Get High-res Image Clustering Approach #8: 'RPPA cHierClus subtypes' versus Clinical Feature #1: 'Time to Death'
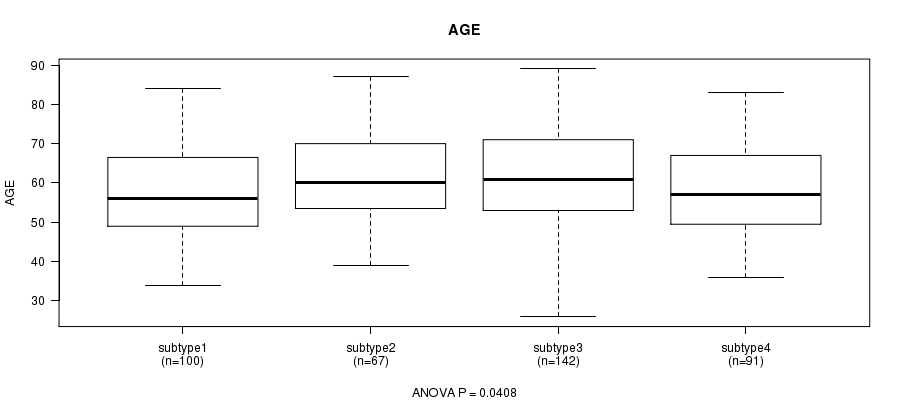
P value = 0.0408 (ANOVA)
Table S59. Clustering Approach #8: 'RPPA cHierClus subtypes' versus Clinical Feature #2: 'AGE'
| nPatients | Mean (Std.Dev) | |
|---|---|---|
| ALL | 400 | 59.7 (11.8) |
| subtype1 | 100 | 57.7 (11.8) |
| subtype2 | 67 | 61.5 (11.1) |
| subtype3 | 142 | 61.2 (12.1) |
| subtype4 | 91 | 58.2 (11.6) |
Figure S51. Get High-res Image Clustering Approach #8: 'RPPA cHierClus subtypes' versus Clinical Feature #2: 'AGE'
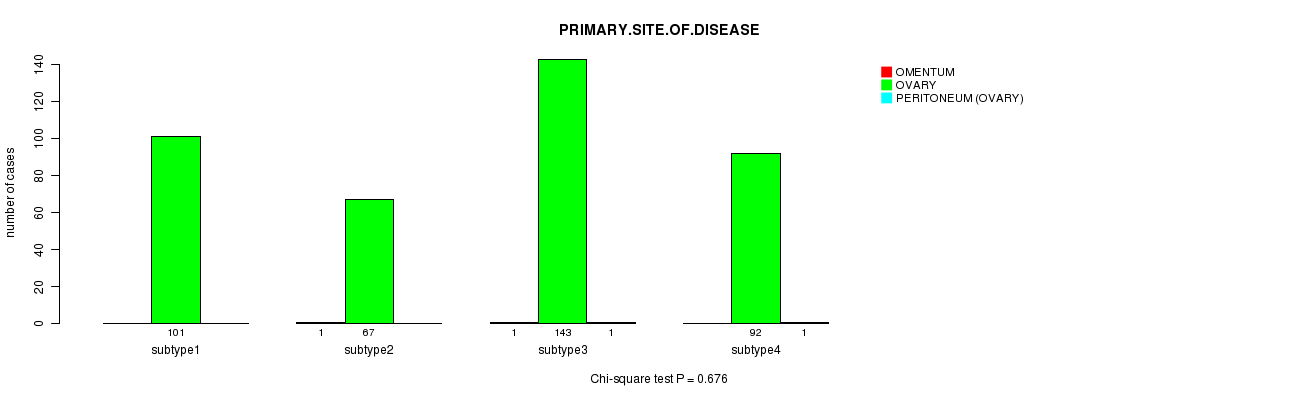
P value = 0.676 (Chi-square test)
Table S60. Clustering Approach #8: 'RPPA cHierClus subtypes' versus Clinical Feature #3: 'PRIMARY.SITE.OF.DISEASE'
| nPatients | OMENTUM | OVARY | PERITONEUM (OVARY) |
|---|---|---|---|
| ALL | 2 | 403 | 2 |
| subtype1 | 0 | 101 | 0 |
| subtype2 | 1 | 67 | 0 |
| subtype3 | 1 | 143 | 1 |
| subtype4 | 0 | 92 | 1 |
Figure S52. Get High-res Image Clustering Approach #8: 'RPPA cHierClus subtypes' versus Clinical Feature #3: 'PRIMARY.SITE.OF.DISEASE'
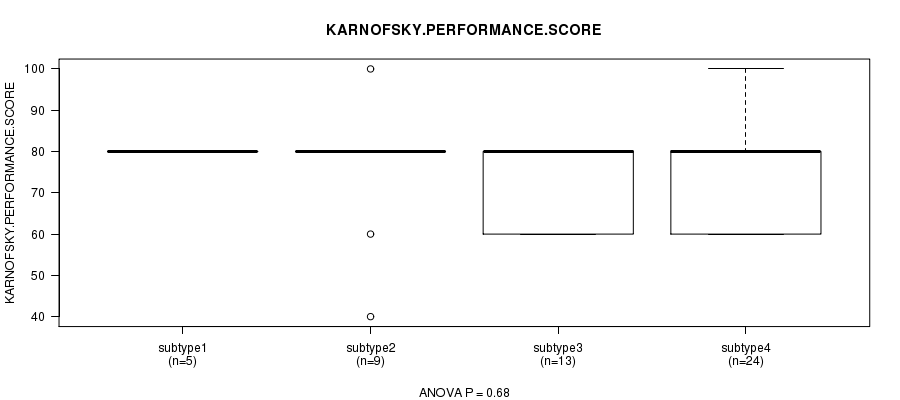
P value = 0.68 (ANOVA)
Table S61. Clustering Approach #8: 'RPPA cHierClus subtypes' versus Clinical Feature #4: 'KARNOFSKY.PERFORMANCE.SCORE'
| nPatients | Mean (Std.Dev) | |
|---|---|---|
| ALL | 51 | 74.9 (11.9) |
| subtype1 | 5 | 80.0 (0.0) |
| subtype2 | 9 | 75.6 (16.7) |
| subtype3 | 13 | 72.3 (10.1) |
| subtype4 | 24 | 75.0 (12.2) |
Figure S53. Get High-res Image Clustering Approach #8: 'RPPA cHierClus subtypes' versus Clinical Feature #4: 'KARNOFSKY.PERFORMANCE.SCORE'
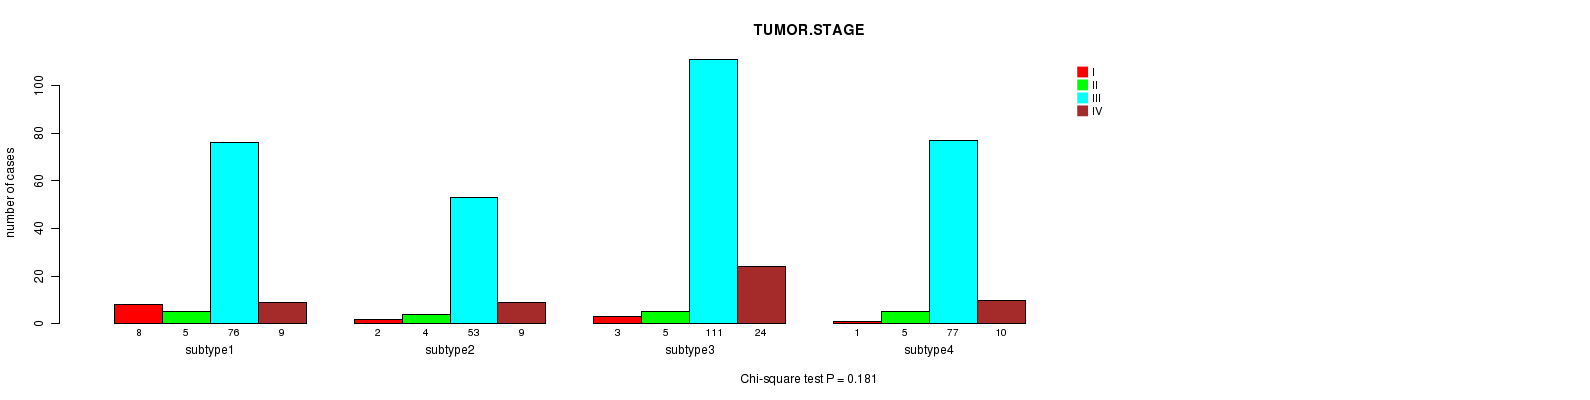
P value = 0.181 (Chi-square test)
Table S62. Clustering Approach #8: 'RPPA cHierClus subtypes' versus Clinical Feature #5: 'TUMOR.STAGE'
| nPatients | I | II | III | IV |
|---|---|---|---|---|
| ALL | 14 | 19 | 317 | 52 |
| subtype1 | 8 | 5 | 76 | 9 |
| subtype2 | 2 | 4 | 53 | 9 |
| subtype3 | 3 | 5 | 111 | 24 |
| subtype4 | 1 | 5 | 77 | 10 |
Figure S54. Get High-res Image Clustering Approach #8: 'RPPA cHierClus subtypes' versus Clinical Feature #5: 'TUMOR.STAGE'
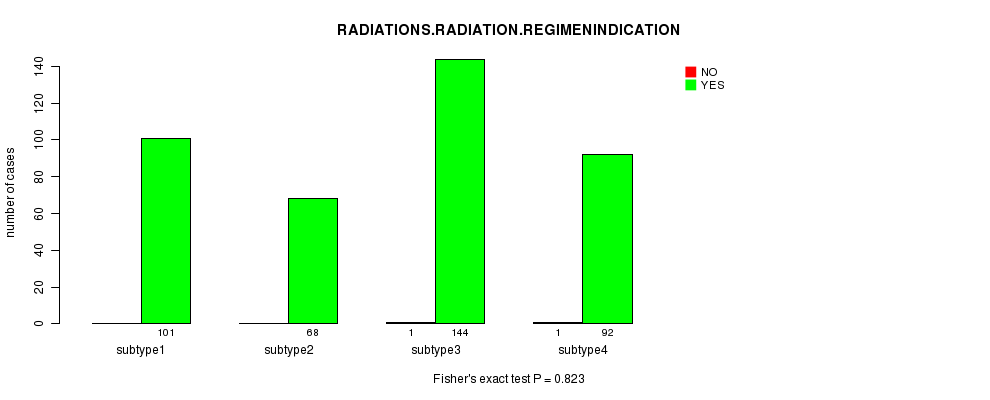
P value = 0.823 (Fisher's exact test)
Table S63. Clustering Approach #8: 'RPPA cHierClus subtypes' versus Clinical Feature #6: 'RADIATIONS.RADIATION.REGIMENINDICATION'
| nPatients | NO | YES |
|---|---|---|
| ALL | 2 | 405 |
| subtype1 | 0 | 101 |
| subtype2 | 0 | 68 |
| subtype3 | 1 | 144 |
| subtype4 | 1 | 92 |
Figure S55. Get High-res Image Clustering Approach #8: 'RPPA cHierClus subtypes' versus Clinical Feature #6: 'RADIATIONS.RADIATION.REGIMENINDICATION'
P value = 0.201 (Fisher's exact test)
Table S64. Clustering Approach #8: 'RPPA cHierClus subtypes' versus Clinical Feature #7: 'NEOADJUVANT.THERAPY'
| nPatients | NO | YES |
|---|---|---|
| ALL | 334 | 73 |
| subtype1 | 80 | 21 |
| subtype2 | 54 | 14 |
| subtype3 | 117 | 28 |
| subtype4 | 83 | 10 |
Figure S56. Get High-res Image Clustering Approach #8: 'RPPA cHierClus subtypes' versus Clinical Feature #7: 'NEOADJUVANT.THERAPY'
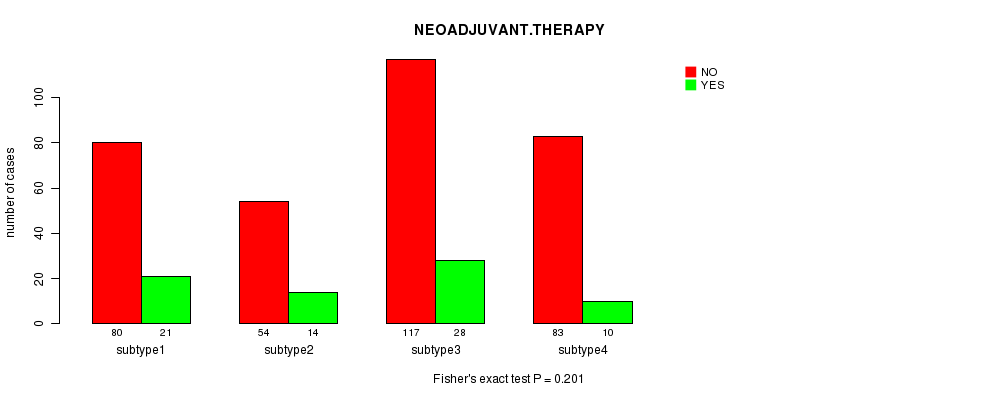
Table S65. Get Full Table Description of clustering approach #9: 'RNAseq CNMF subtypes'
| Cluster Labels | 1 | 2 | 3 |
|---|---|---|---|
| Number of samples | 103 | 69 | 91 |
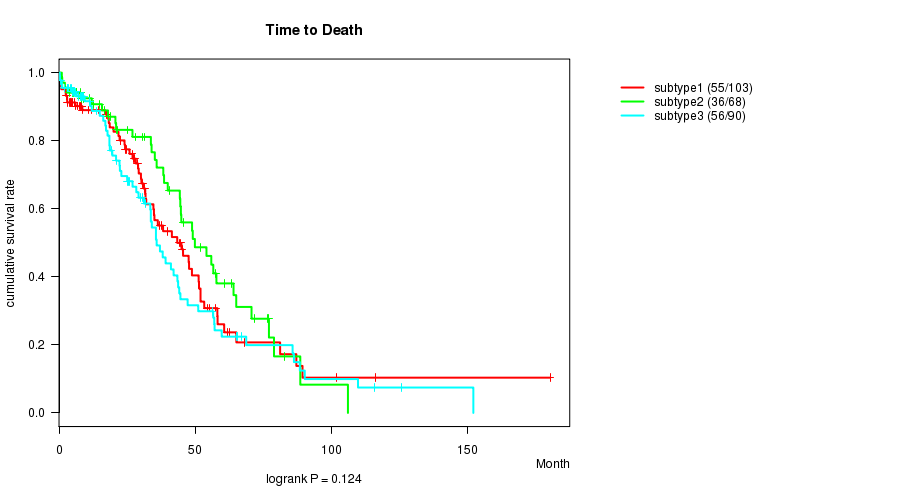
P value = 0.124 (logrank test)
Table S66. Clustering Approach #9: 'RNAseq CNMF subtypes' versus Clinical Feature #1: 'Time to Death'
| nPatients | nDeath | Duration Range (Median), Month | |
|---|---|---|---|
| ALL | 261 | 147 | 0.3 - 180.2 (28.2) |
| subtype1 | 103 | 55 | 0.4 - 180.2 (28.2) |
| subtype2 | 68 | 36 | 1.0 - 106.0 (34.6) |
| subtype3 | 90 | 56 | 0.3 - 152.0 (25.0) |
Figure S57. Get High-res Image Clustering Approach #9: 'RNAseq CNMF subtypes' versus Clinical Feature #1: 'Time to Death'
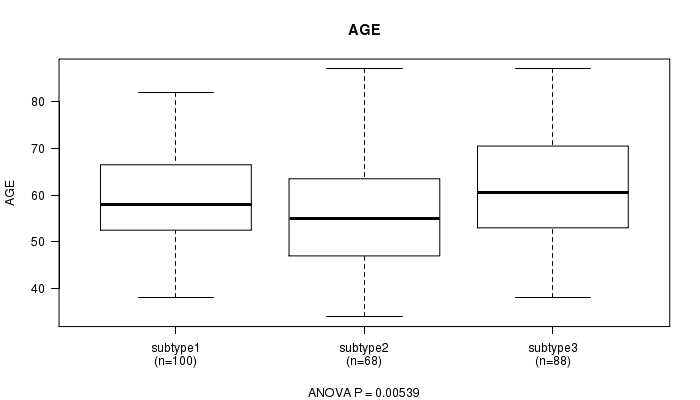
P value = 0.00539 (ANOVA)
Table S67. Clustering Approach #9: 'RNAseq CNMF subtypes' versus Clinical Feature #2: 'AGE'
| nPatients | Mean (Std.Dev) | |
|---|---|---|
| ALL | 256 | 59.1 (10.8) |
| subtype1 | 100 | 59.2 (10.3) |
| subtype2 | 68 | 55.8 (10.9) |
| subtype3 | 88 | 61.4 (10.9) |
Figure S58. Get High-res Image Clustering Approach #9: 'RNAseq CNMF subtypes' versus Clinical Feature #2: 'AGE'
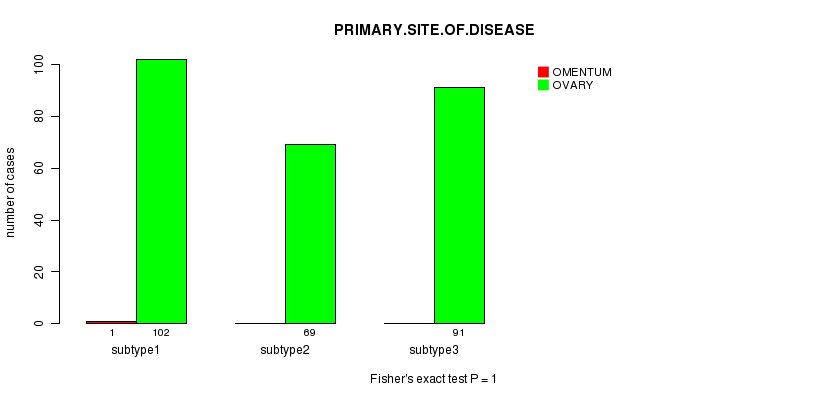
P value = 1 (Fisher's exact test)
Table S68. Clustering Approach #9: 'RNAseq CNMF subtypes' versus Clinical Feature #3: 'PRIMARY.SITE.OF.DISEASE'
| nPatients | OMENTUM | OVARY |
|---|---|---|
| ALL | 1 | 262 |
| subtype1 | 1 | 102 |
| subtype2 | 0 | 69 |
| subtype3 | 0 | 91 |
Figure S59. Get High-res Image Clustering Approach #9: 'RNAseq CNMF subtypes' versus Clinical Feature #3: 'PRIMARY.SITE.OF.DISEASE'
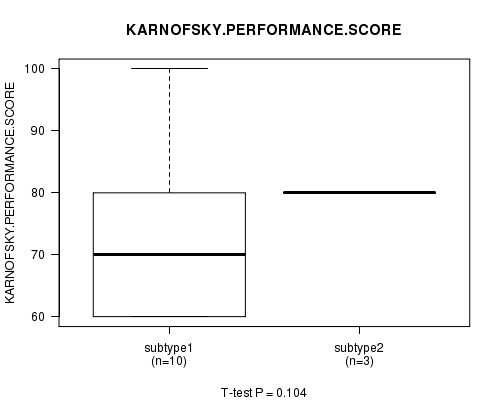
P value = 0.104 (ANOVA)
Table S69. Clustering Approach #9: 'RNAseq CNMF subtypes' versus Clinical Feature #4: 'KARNOFSKY.PERFORMANCE.SCORE'
| nPatients | Mean (Std.Dev) | |
|---|---|---|
| ALL | 15 | 74.7 (11.9) |
| subtype1 | 10 | 72.0 (14.0) |
| subtype2 | 3 | 80.0 (0.0) |
| subtype3 | 2 | 80.0 (0.0) |
Figure S60. Get High-res Image Clustering Approach #9: 'RNAseq CNMF subtypes' versus Clinical Feature #4: 'KARNOFSKY.PERFORMANCE.SCORE'
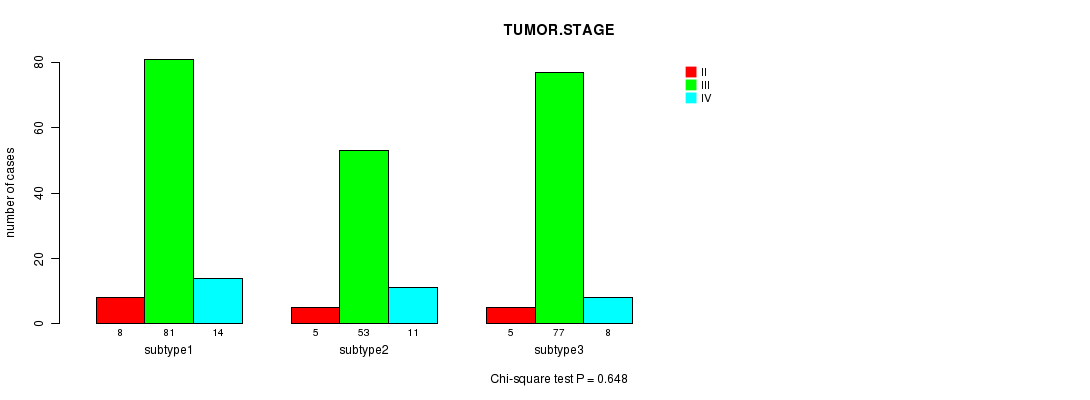
P value = 0.648 (Chi-square test)
Table S70. Clustering Approach #9: 'RNAseq CNMF subtypes' versus Clinical Feature #5: 'TUMOR.STAGE'
| nPatients | II | III | IV |
|---|---|---|---|
| ALL | 18 | 211 | 33 |
| subtype1 | 8 | 81 | 14 |
| subtype2 | 5 | 53 | 11 |
| subtype3 | 5 | 77 | 8 |
Figure S61. Get High-res Image Clustering Approach #9: 'RNAseq CNMF subtypes' versus Clinical Feature #5: 'TUMOR.STAGE'
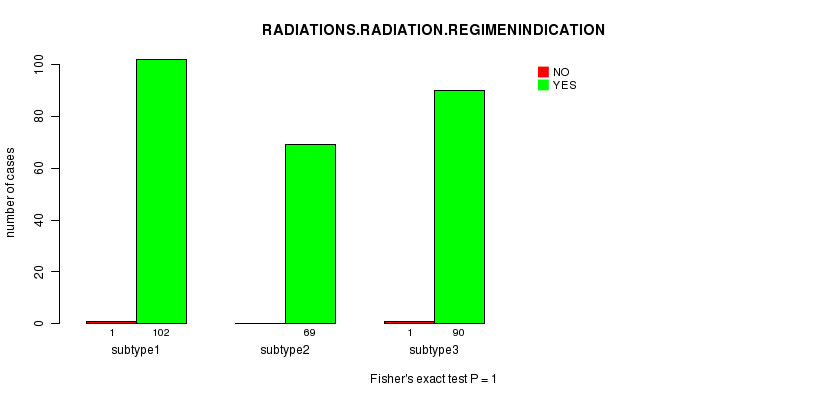
P value = 1 (Fisher's exact test)
Table S71. Clustering Approach #9: 'RNAseq CNMF subtypes' versus Clinical Feature #6: 'RADIATIONS.RADIATION.REGIMENINDICATION'
| nPatients | NO | YES |
|---|---|---|
| ALL | 2 | 261 |
| subtype1 | 1 | 102 |
| subtype2 | 0 | 69 |
| subtype3 | 1 | 90 |
Figure S62. Get High-res Image Clustering Approach #9: 'RNAseq CNMF subtypes' versus Clinical Feature #6: 'RADIATIONS.RADIATION.REGIMENINDICATION'
P value = 0.449 (Fisher's exact test)
Table S72. Clustering Approach #9: 'RNAseq CNMF subtypes' versus Clinical Feature #7: 'NEOADJUVANT.THERAPY'
| nPatients | NO | YES |
|---|---|---|
| ALL | 211 | 52 |
| subtype1 | 83 | 20 |
| subtype2 | 52 | 17 |
| subtype3 | 76 | 15 |
Figure S63. Get High-res Image Clustering Approach #9: 'RNAseq CNMF subtypes' versus Clinical Feature #7: 'NEOADJUVANT.THERAPY'
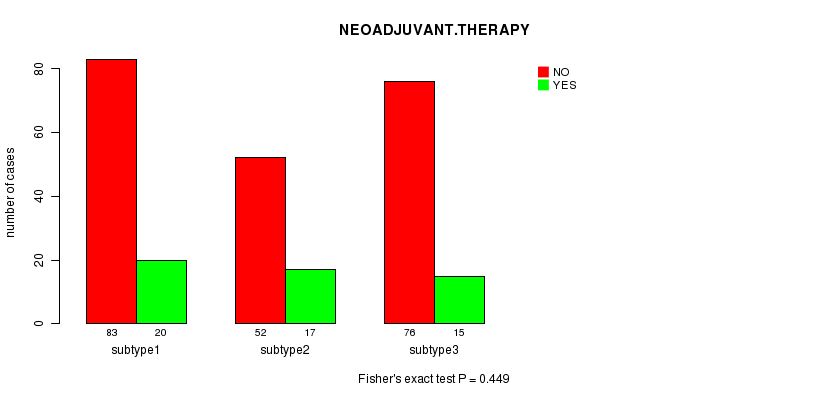
Table S73. Get Full Table Description of clustering approach #10: 'RNAseq cHierClus subtypes'
| Cluster Labels | 1 | 2 | 3 |
|---|---|---|---|
| Number of samples | 33 | 108 | 122 |
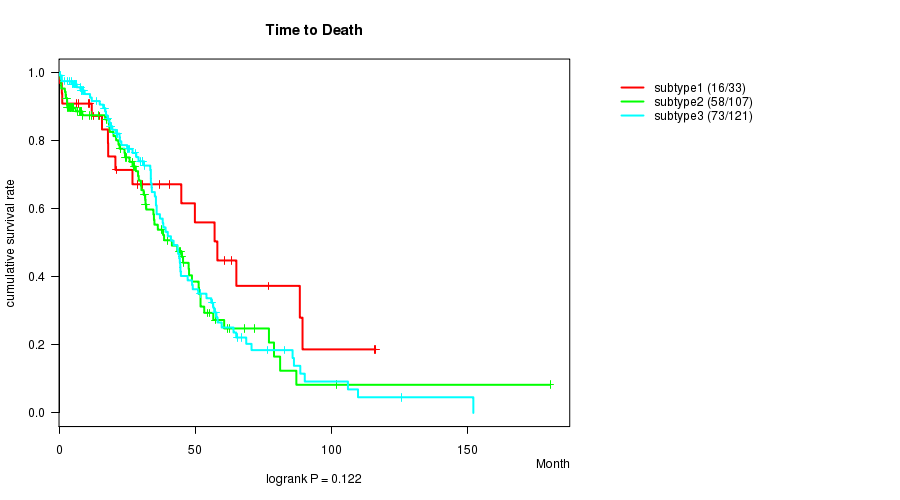
P value = 0.122 (logrank test)
Table S74. Clustering Approach #10: 'RNAseq cHierClus subtypes' versus Clinical Feature #1: 'Time to Death'
| nPatients | nDeath | Duration Range (Median), Month | |
|---|---|---|---|
| ALL | 261 | 147 | 0.3 - 180.2 (28.2) |
| subtype1 | 33 | 16 | 0.3 - 116.1 (26.9) |
| subtype2 | 107 | 58 | 0.4 - 180.2 (27.5) |
| subtype3 | 121 | 73 | 0.4 - 152.0 (30.0) |
Figure S64. Get High-res Image Clustering Approach #10: 'RNAseq cHierClus subtypes' versus Clinical Feature #1: 'Time to Death'
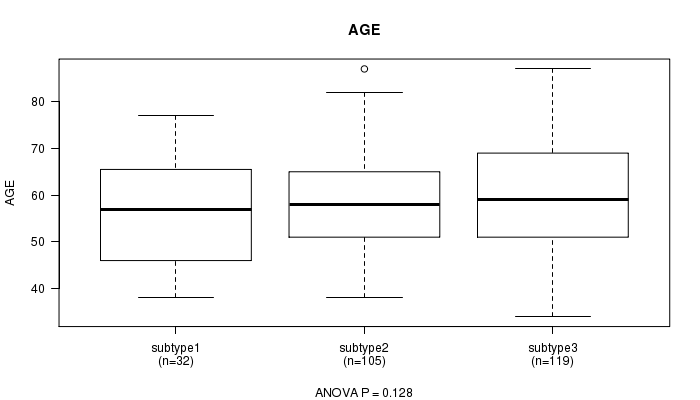
P value = 0.128 (ANOVA)
Table S75. Clustering Approach #10: 'RNAseq cHierClus subtypes' versus Clinical Feature #2: 'AGE'
| nPatients | Mean (Std.Dev) | |
|---|---|---|
| ALL | 256 | 59.1 (10.8) |
| subtype1 | 32 | 56.1 (11.2) |
| subtype2 | 105 | 58.6 (10.4) |
| subtype3 | 119 | 60.3 (11.0) |
Figure S65. Get High-res Image Clustering Approach #10: 'RNAseq cHierClus subtypes' versus Clinical Feature #2: 'AGE'
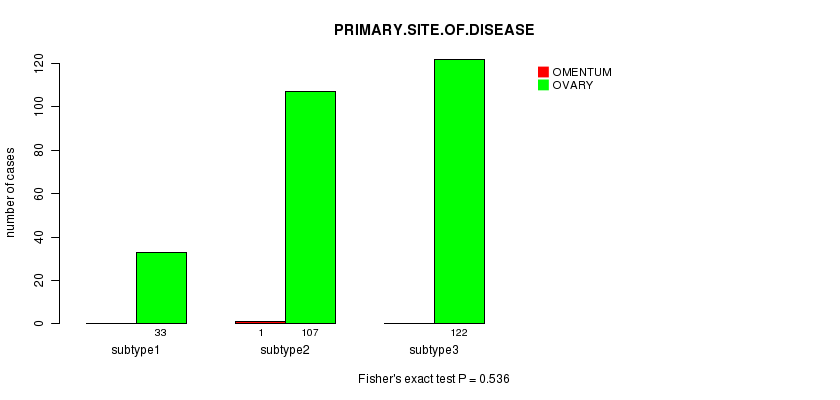
P value = 0.536 (Fisher's exact test)
Table S76. Clustering Approach #10: 'RNAseq cHierClus subtypes' versus Clinical Feature #3: 'PRIMARY.SITE.OF.DISEASE'
| nPatients | OMENTUM | OVARY |
|---|---|---|
| ALL | 1 | 262 |
| subtype1 | 0 | 33 |
| subtype2 | 1 | 107 |
| subtype3 | 0 | 122 |
Figure S66. Get High-res Image Clustering Approach #10: 'RNAseq cHierClus subtypes' versus Clinical Feature #3: 'PRIMARY.SITE.OF.DISEASE'
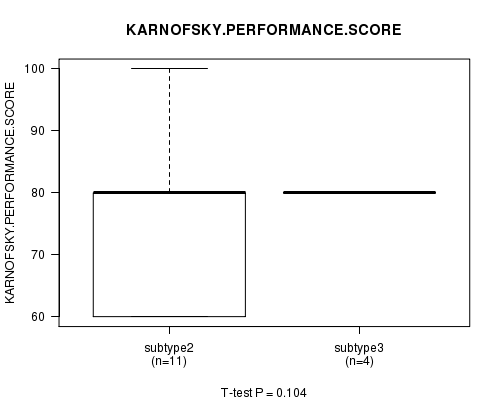
P value = 0.104 (ANOVA)
Table S77. Clustering Approach #10: 'RNAseq cHierClus subtypes' versus Clinical Feature #4: 'KARNOFSKY.PERFORMANCE.SCORE'
| nPatients | Mean (Std.Dev) | |
|---|---|---|
| ALL | 15 | 74.7 (11.9) |
| subtype2 | 11 | 72.7 (13.5) |
| subtype3 | 4 | 80.0 (0.0) |
Figure S67. Get High-res Image Clustering Approach #10: 'RNAseq cHierClus subtypes' versus Clinical Feature #4: 'KARNOFSKY.PERFORMANCE.SCORE'
P value = 0.119 (Chi-square test)
Table S78. Clustering Approach #10: 'RNAseq cHierClus subtypes' versus Clinical Feature #5: 'TUMOR.STAGE'
| nPatients | II | III | IV |
|---|---|---|---|
| ALL | 18 | 211 | 33 |
| subtype1 | 4 | 22 | 7 |
| subtype2 | 5 | 87 | 16 |
| subtype3 | 9 | 102 | 10 |
Figure S68. Get High-res Image Clustering Approach #10: 'RNAseq cHierClus subtypes' versus Clinical Feature #5: 'TUMOR.STAGE'
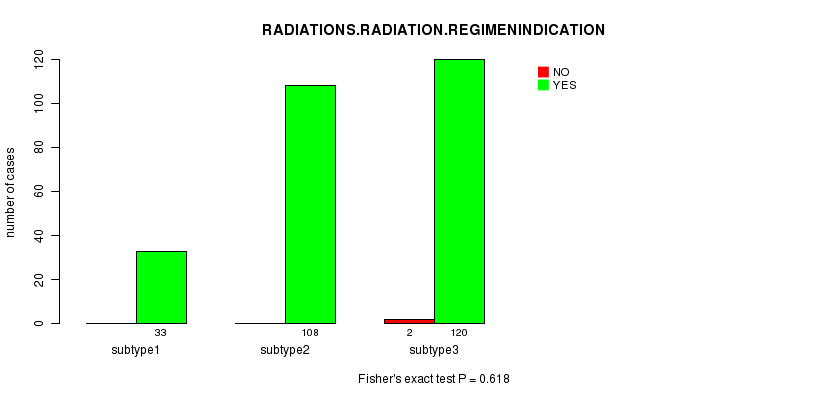
P value = 0.618 (Fisher's exact test)
Table S79. Clustering Approach #10: 'RNAseq cHierClus subtypes' versus Clinical Feature #6: 'RADIATIONS.RADIATION.REGIMENINDICATION'
| nPatients | NO | YES |
|---|---|---|
| ALL | 2 | 261 |
| subtype1 | 0 | 33 |
| subtype2 | 0 | 108 |
| subtype3 | 2 | 120 |
Figure S69. Get High-res Image Clustering Approach #10: 'RNAseq cHierClus subtypes' versus Clinical Feature #6: 'RADIATIONS.RADIATION.REGIMENINDICATION'
P value = 0.47 (Fisher's exact test)
Table S80. Clustering Approach #10: 'RNAseq cHierClus subtypes' versus Clinical Feature #7: 'NEOADJUVANT.THERAPY'
| nPatients | NO | YES |
|---|---|---|
| ALL | 211 | 52 |
| subtype1 | 24 | 9 |
| subtype2 | 87 | 21 |
| subtype3 | 100 | 22 |
Figure S70. Get High-res Image Clustering Approach #10: 'RNAseq cHierClus subtypes' versus Clinical Feature #7: 'NEOADJUVANT.THERAPY'
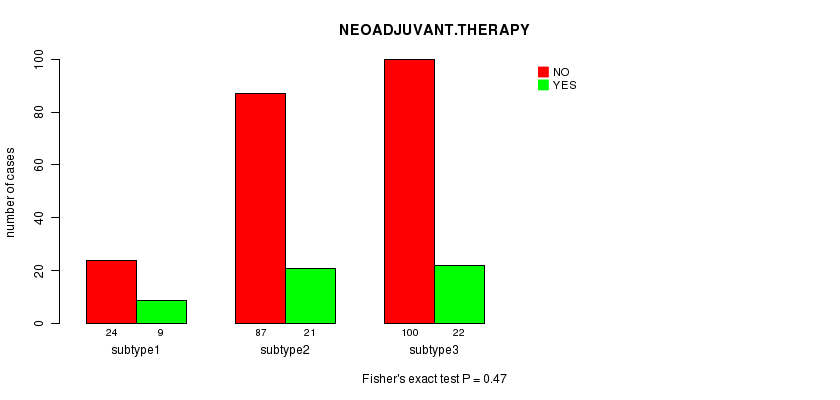
Table S81. Get Full Table Description of clustering approach #11: 'MIRseq CNMF subtypes'
| Cluster Labels | 1 | 2 | 3 |
|---|---|---|---|
| Number of samples | 113 | 195 | 146 |
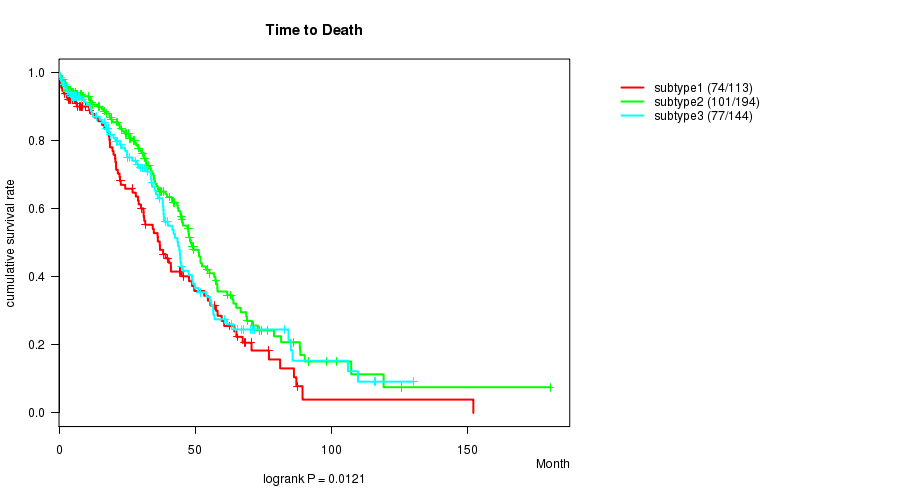
P value = 0.0121 (logrank test)
Table S82. Clustering Approach #11: 'MIRseq CNMF subtypes' versus Clinical Feature #1: 'Time to Death'
| nPatients | nDeath | Duration Range (Median), Month | |
|---|---|---|---|
| ALL | 451 | 252 | 0.3 - 180.2 (30.1) |
| subtype1 | 113 | 74 | 0.3 - 152.0 (27.0) |
| subtype2 | 194 | 101 | 0.3 - 180.2 (32.5) |
| subtype3 | 144 | 77 | 0.3 - 130.0 (28.7) |
Figure S71. Get High-res Image Clustering Approach #11: 'MIRseq CNMF subtypes' versus Clinical Feature #1: 'Time to Death'
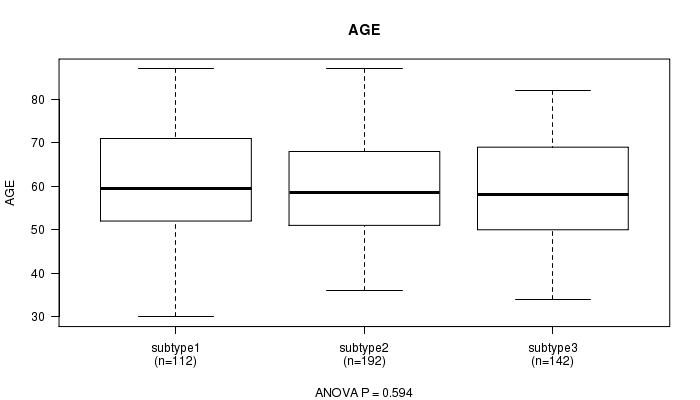
P value = 0.594 (ANOVA)
Table S83. Clustering Approach #11: 'MIRseq CNMF subtypes' versus Clinical Feature #2: 'AGE'
| nPatients | Mean (Std.Dev) | |
|---|---|---|
| ALL | 446 | 59.8 (11.5) |
| subtype1 | 112 | 60.8 (11.7) |
| subtype2 | 192 | 59.5 (11.3) |
| subtype3 | 142 | 59.5 (11.6) |
Figure S72. Get High-res Image Clustering Approach #11: 'MIRseq CNMF subtypes' versus Clinical Feature #2: 'AGE'
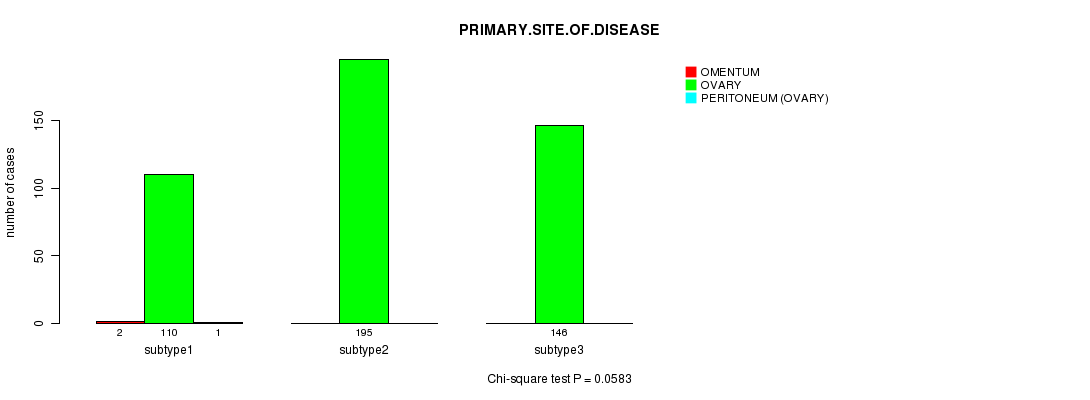
P value = 0.0583 (Chi-square test)
Table S84. Clustering Approach #11: 'MIRseq CNMF subtypes' versus Clinical Feature #3: 'PRIMARY.SITE.OF.DISEASE'
| nPatients | OMENTUM | OVARY | PERITONEUM (OVARY) |
|---|---|---|---|
| ALL | 2 | 451 | 1 |
| subtype1 | 2 | 110 | 1 |
| subtype2 | 0 | 195 | 0 |
| subtype3 | 0 | 146 | 0 |
Figure S73. Get High-res Image Clustering Approach #11: 'MIRseq CNMF subtypes' versus Clinical Feature #3: 'PRIMARY.SITE.OF.DISEASE'
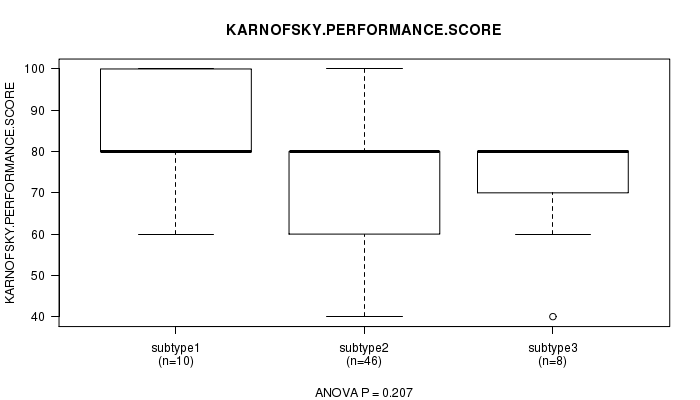
P value = 0.207 (ANOVA)
Table S85. Clustering Approach #11: 'MIRseq CNMF subtypes' versus Clinical Feature #4: 'KARNOFSKY.PERFORMANCE.SCORE'
| nPatients | Mean (Std.Dev) | |
|---|---|---|
| ALL | 64 | 75.3 (13.2) |
| subtype1 | 10 | 82.0 (14.8) |
| subtype2 | 46 | 74.3 (12.4) |
| subtype3 | 8 | 72.5 (14.9) |
Figure S74. Get High-res Image Clustering Approach #11: 'MIRseq CNMF subtypes' versus Clinical Feature #4: 'KARNOFSKY.PERFORMANCE.SCORE'
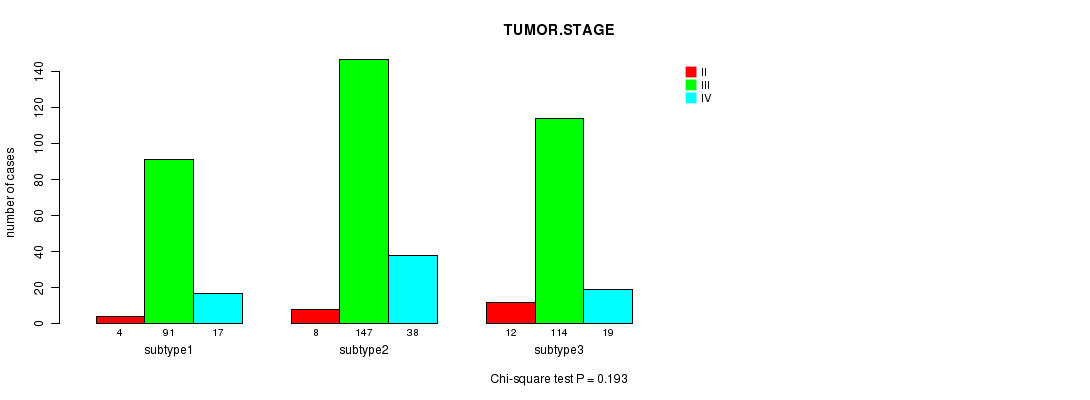
P value = 0.193 (Chi-square test)
Table S86. Clustering Approach #11: 'MIRseq CNMF subtypes' versus Clinical Feature #5: 'TUMOR.STAGE'
| nPatients | II | III | IV |
|---|---|---|---|
| ALL | 24 | 352 | 74 |
| subtype1 | 4 | 91 | 17 |
| subtype2 | 8 | 147 | 38 |
| subtype3 | 12 | 114 | 19 |
Figure S75. Get High-res Image Clustering Approach #11: 'MIRseq CNMF subtypes' versus Clinical Feature #5: 'TUMOR.STAGE'
P value = 0.476 (Fisher's exact test)
Table S87. Clustering Approach #11: 'MIRseq CNMF subtypes' versus Clinical Feature #6: 'RADIATIONS.RADIATION.REGIMENINDICATION'
| nPatients | NO | YES |
|---|---|---|
| ALL | 3 | 451 |
| subtype1 | 0 | 113 |
| subtype2 | 1 | 194 |
| subtype3 | 2 | 144 |
Figure S76. Get High-res Image Clustering Approach #11: 'MIRseq CNMF subtypes' versus Clinical Feature #6: 'RADIATIONS.RADIATION.REGIMENINDICATION'
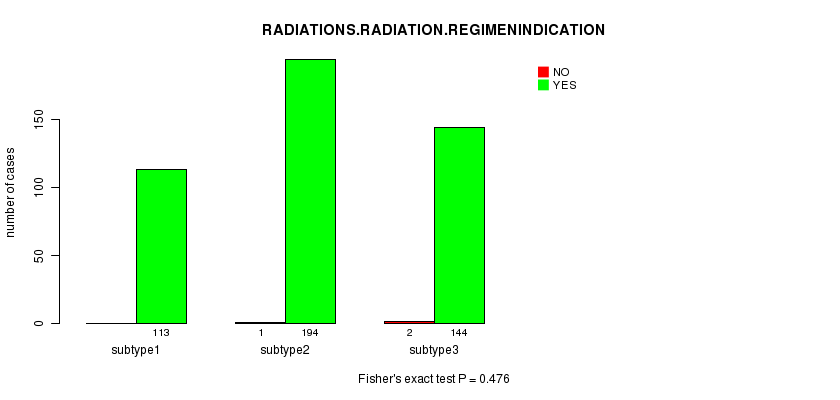
P value = 0.546 (Fisher's exact test)
Table S88. Clustering Approach #11: 'MIRseq CNMF subtypes' versus Clinical Feature #7: 'NEOADJUVANT.THERAPY'
| nPatients | NO | YES |
|---|---|---|
| ALL | 367 | 87 |
| subtype1 | 89 | 24 |
| subtype2 | 162 | 33 |
| subtype3 | 116 | 30 |
Figure S77. Get High-res Image Clustering Approach #11: 'MIRseq CNMF subtypes' versus Clinical Feature #7: 'NEOADJUVANT.THERAPY'
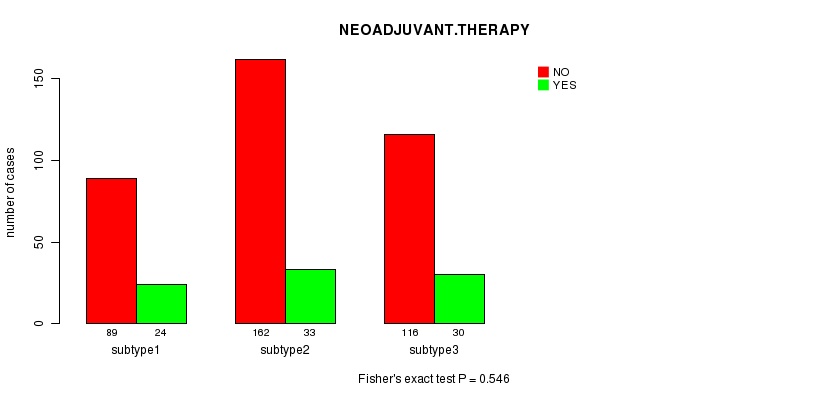
Table S89. Get Full Table Description of clustering approach #12: 'MIRseq cHierClus subtypes'
| Cluster Labels | 1 | 2 | 3 |
|---|---|---|---|
| Number of samples | 3 | 153 | 298 |
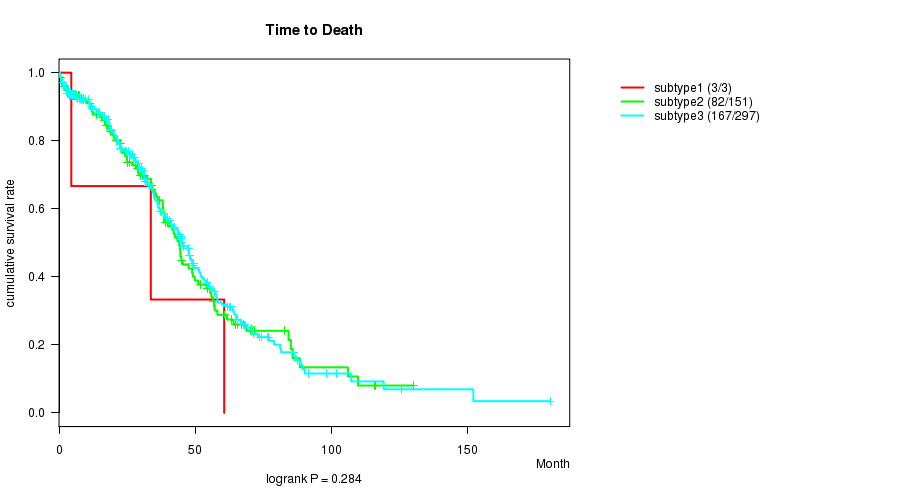
P value = 0.284 (logrank test)
Table S90. Clustering Approach #12: 'MIRseq cHierClus subtypes' versus Clinical Feature #1: 'Time to Death'
| nPatients | nDeath | Duration Range (Median), Month | |
|---|---|---|---|
| ALL | 451 | 252 | 0.3 - 180.2 (30.1) |
| subtype1 | 3 | 3 | 4.5 - 60.6 (33.7) |
| subtype2 | 151 | 82 | 0.3 - 130.0 (28.6) |
| subtype3 | 297 | 167 | 0.3 - 180.2 (31.0) |
Figure S78. Get High-res Image Clustering Approach #12: 'MIRseq cHierClus subtypes' versus Clinical Feature #1: 'Time to Death'
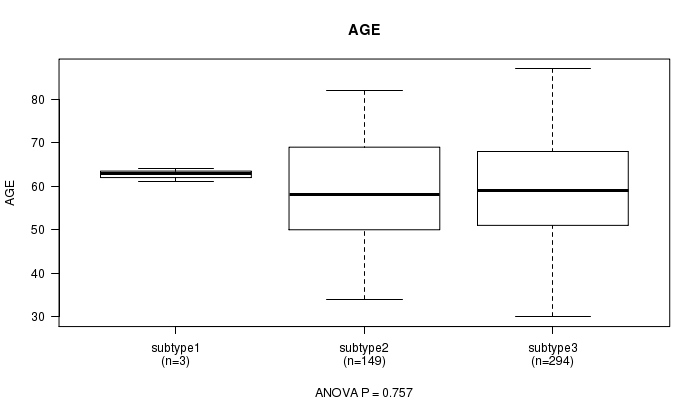
P value = 0.757 (ANOVA)
Table S91. Clustering Approach #12: 'MIRseq cHierClus subtypes' versus Clinical Feature #2: 'AGE'
| nPatients | Mean (Std.Dev) | |
|---|---|---|
| ALL | 446 | 59.8 (11.5) |
| subtype1 | 3 | 62.7 (1.5) |
| subtype2 | 149 | 59.3 (11.9) |
| subtype3 | 294 | 60.0 (11.4) |
Figure S79. Get High-res Image Clustering Approach #12: 'MIRseq cHierClus subtypes' versus Clinical Feature #2: 'AGE'
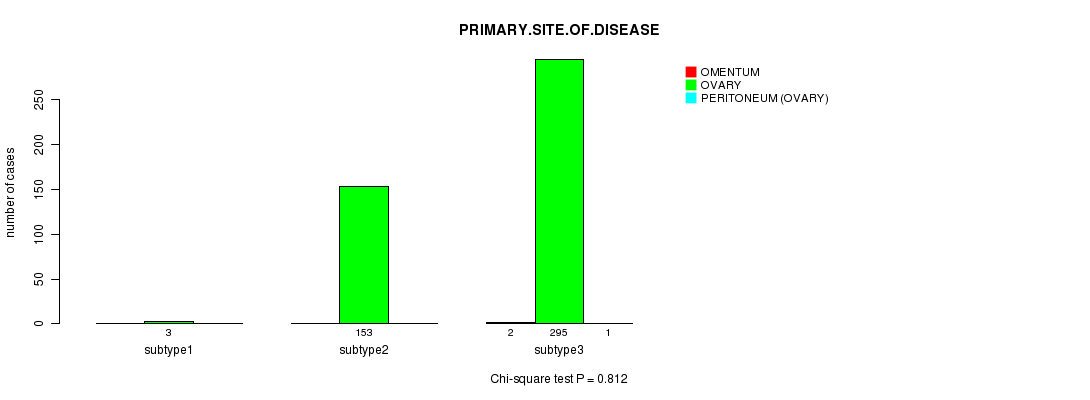
P value = 0.812 (Chi-square test)
Table S92. Clustering Approach #12: 'MIRseq cHierClus subtypes' versus Clinical Feature #3: 'PRIMARY.SITE.OF.DISEASE'
| nPatients | OMENTUM | OVARY | PERITONEUM (OVARY) |
|---|---|---|---|
| ALL | 2 | 451 | 1 |
| subtype1 | 0 | 3 | 0 |
| subtype2 | 0 | 153 | 0 |
| subtype3 | 2 | 295 | 1 |
Figure S80. Get High-res Image Clustering Approach #12: 'MIRseq cHierClus subtypes' versus Clinical Feature #3: 'PRIMARY.SITE.OF.DISEASE'
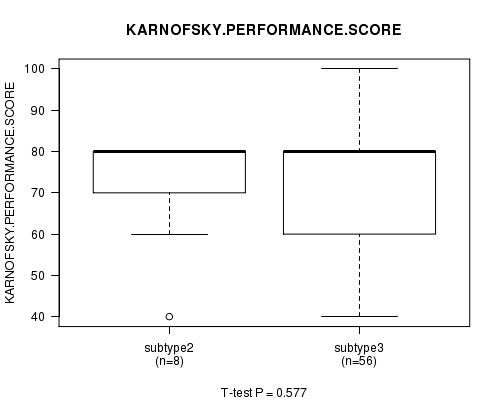
P value = 0.577 (ANOVA)
Table S93. Clustering Approach #12: 'MIRseq cHierClus subtypes' versus Clinical Feature #4: 'KARNOFSKY.PERFORMANCE.SCORE'
| nPatients | Mean (Std.Dev) | |
|---|---|---|
| ALL | 64 | 75.3 (13.2) |
| subtype2 | 8 | 72.5 (14.9) |
| subtype3 | 56 | 75.7 (13.1) |
Figure S81. Get High-res Image Clustering Approach #12: 'MIRseq cHierClus subtypes' versus Clinical Feature #4: 'KARNOFSKY.PERFORMANCE.SCORE'
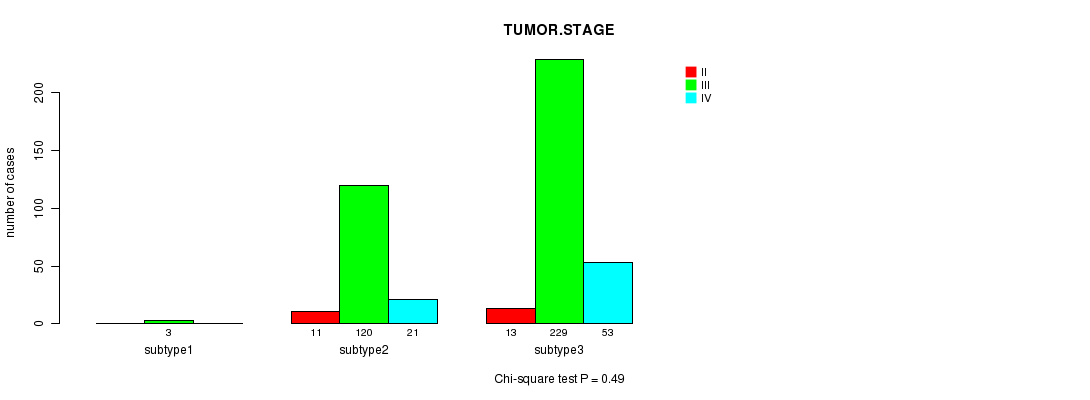
P value = 0.49 (Chi-square test)
Table S94. Clustering Approach #12: 'MIRseq cHierClus subtypes' versus Clinical Feature #5: 'TUMOR.STAGE'
| nPatients | II | III | IV |
|---|---|---|---|
| ALL | 24 | 352 | 74 |
| subtype1 | 0 | 3 | 0 |
| subtype2 | 11 | 120 | 21 |
| subtype3 | 13 | 229 | 53 |
Figure S82. Get High-res Image Clustering Approach #12: 'MIRseq cHierClus subtypes' versus Clinical Feature #5: 'TUMOR.STAGE'
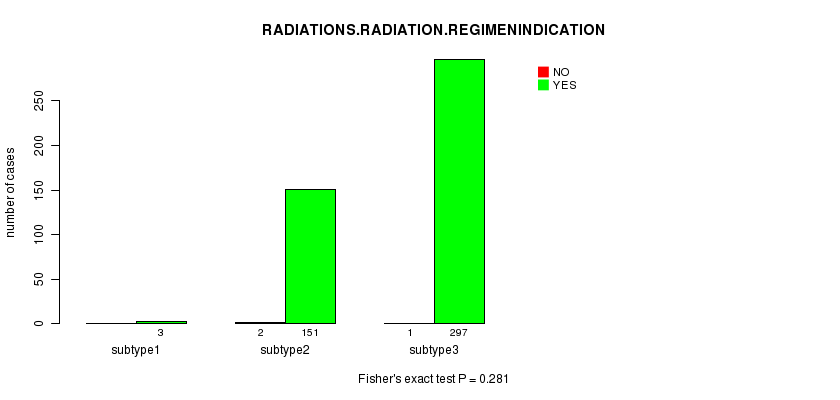
P value = 0.281 (Fisher's exact test)
Table S95. Clustering Approach #12: 'MIRseq cHierClus subtypes' versus Clinical Feature #6: 'RADIATIONS.RADIATION.REGIMENINDICATION'
| nPatients | NO | YES |
|---|---|---|
| ALL | 3 | 451 |
| subtype1 | 0 | 3 |
| subtype2 | 2 | 151 |
| subtype3 | 1 | 297 |
Figure S83. Get High-res Image Clustering Approach #12: 'MIRseq cHierClus subtypes' versus Clinical Feature #6: 'RADIATIONS.RADIATION.REGIMENINDICATION'
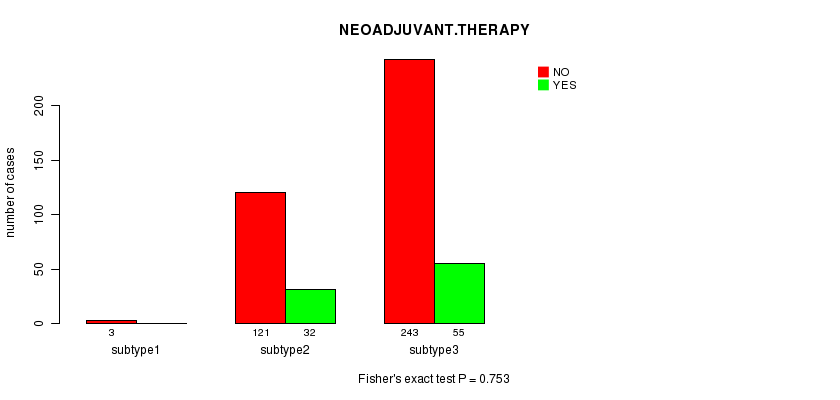
P value = 0.753 (Fisher's exact test)
Table S96. Clustering Approach #12: 'MIRseq cHierClus subtypes' versus Clinical Feature #7: 'NEOADJUVANT.THERAPY'
| nPatients | NO | YES |
|---|---|---|
| ALL | 367 | 87 |
| subtype1 | 3 | 0 |
| subtype2 | 121 | 32 |
| subtype3 | 243 | 55 |
Figure S84. Get High-res Image Clustering Approach #12: 'MIRseq cHierClus subtypes' versus Clinical Feature #7: 'NEOADJUVANT.THERAPY'
-
Cluster data file = OV.mergedcluster.txt
-
Clinical data file = OV.clin.merged.picked.txt
-
Number of patients = 569
-
Number of clustering approaches = 12
-
Number of selected clinical features = 7
-
Exclude small clusters that include fewer than K patients, K = 3
consensus non-negative matrix factorization clustering approach (Brunet et al. 2004)
Resampling-based clustering method (Monti et al. 2003)
For survival clinical features, the Kaplan-Meier survival curves of tumors with and without gene mutations were plotted and the statistical significance P values were estimated by logrank test (Bland and Altman 2004) using the 'survdiff' function in R
For continuous numerical clinical features, one-way analysis of variance (Howell 2002) was applied to compare the clinical values between tumor subtypes using 'anova' function in R
For multi-class clinical features (nominal or ordinal), Chi-square tests (Greenwood and Nikulin 1996) were used to estimate the P values using the 'chisq.test' function in R
For binary clinical features, two-tailed Fisher's exact tests (Fisher 1922) were used to estimate the P values using the 'fisher.test' function in R
This is an experimental feature. The full results of the analysis summarized in this report can be downloaded from the TCGA Data Coordination Center.