This pipeline uses various statistical tests to identify genes whose promoter methylation levels correlated to selected clinical features.
Testing the association between 17322 genes and 3 clinical features across 99 samples, statistically thresholded by Q value < 0.05, 2 clinical features related to at least one genes.
-
30 genes correlated to 'RADIATIONS.RADIATION.REGIMENINDICATION'.
-
NAA20 , SCD , ZNF280D , HIST1H2BB , ZKSCAN4 , ...
-
219 genes correlated to 'NEOADJUVANT.THERAPY'.
-
METT10D , DSG3 , KLHL33 , ALDH3A2 , KCTD18 , ...
-
No genes correlated to 'AGE'
Complete statistical result table is provided in Supplement Table 1
Table 1. Get Full Table This table shows the clinical features, statistical methods used, and the number of genes that are significantly associated with each clinical feature at Q value < 0.05.
| Clinical feature | Statistical test | Significant genes | Associated with | Associated with | ||
|---|---|---|---|---|---|---|
| AGE | Spearman correlation test | N=0 | ||||
| RADIATIONS RADIATION REGIMENINDICATION | t test | N=30 | yes | N=21 | no | N=9 |
| NEOADJUVANT THERAPY | t test | N=219 | yes | N=130 | no | N=89 |
Table S1. Basic characteristics of clinical feature: 'AGE'
| AGE | Mean (SD) | 61.08 (6.7) |
| Significant markers | N = 0 |
30 genes related to 'RADIATIONS.RADIATION.REGIMENINDICATION'.
Table S2. Basic characteristics of clinical feature: 'RADIATIONS.RADIATION.REGIMENINDICATION'
| RADIATIONS.RADIATION.REGIMENINDICATION | Labels | N |
| NO | 5 | |
| YES | 94 | |
| Significant markers | N = 30 | |
| Higher in YES | 21 | |
| Higher in NO | 9 |
Table S3. Get Full Table List of top 10 genes differentially expressed by 'RADIATIONS.RADIATION.REGIMENINDICATION'
| T(pos if higher in 'YES') | ttestP | Q | AUC | |
|---|---|---|---|---|
| NAA20 | 9.06 | 7.094e-14 | 1.23e-09 | 0.8681 |
| SCD | -8.88 | 2.439e-12 | 4.22e-08 | 0.8511 |
| ZNF280D | 7.61 | 9.97e-11 | 1.73e-06 | 0.7638 |
| HIST1H2BB | 7.04 | 2.837e-10 | 4.91e-06 | 0.717 |
| ZKSCAN4 | 7.95 | 4.126e-10 | 7.15e-06 | 0.8383 |
| CLEC4C | -6.74 | 1.439e-09 | 2.49e-05 | 0.7426 |
| ZNF525 | 8.2 | 1.965e-09 | 3.4e-05 | 0.8638 |
| AASDHPPT | 6.39 | 7.869e-09 | 0.000136 | 0.834 |
| VWDE | 6.17 | 1.567e-08 | 0.000271 | 0.7787 |
| CGB2 | -6.77 | 1.643e-08 | 0.000284 | 0.8468 |
Figure S1. Get High-res Image As an example, this figure shows the association of NAA20 to 'RADIATIONS.RADIATION.REGIMENINDICATION'. P value = 7.09e-14 with T-test analysis.
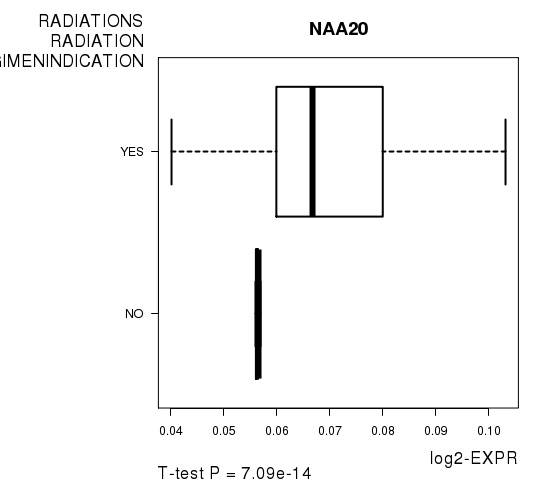
Table S4. Basic characteristics of clinical feature: 'NEOADJUVANT.THERAPY'
| NEOADJUVANT.THERAPY | Labels | N |
| NO | 4 | |
| YES | 95 | |
| Significant markers | N = 219 | |
| Higher in YES | 130 | |
| Higher in NO | 89 |
Table S5. Get Full Table List of top 10 genes differentially expressed by 'NEOADJUVANT.THERAPY'
| T(pos if higher in 'YES') | ttestP | Q | AUC | |
|---|---|---|---|---|
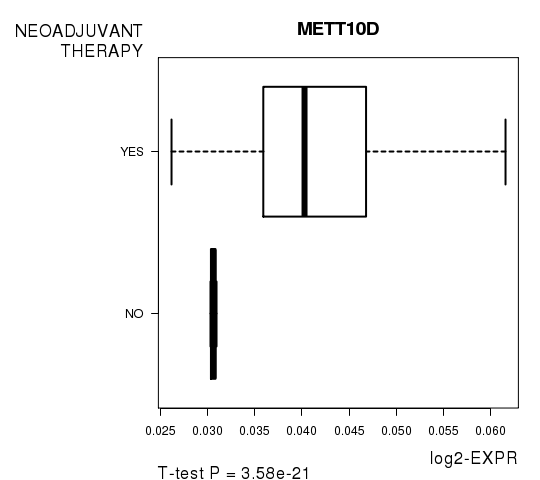
| METT10D | 12.14 | 3.578e-21 | 6.2e-17 | 0.9105 |
| DSG3 | -12.04 | 1.097e-20 | 1.9e-16 | 0.9895 |
| KLHL33 | -11.71 | 2.916e-20 | 5.05e-16 | 0.9132 |
| ALDH3A2 | -11.23 | 3.532e-19 | 6.12e-15 | 0.9816 |
| KCTD18 | 11.69 | 1.714e-17 | 2.97e-13 | 0.9421 |
| HSD17B14 | 12.69 | 9.774e-17 | 1.69e-12 | 0.9947 |
| ARV1 | 14.36 | 2.383e-16 | 4.13e-12 | 0.9947 |
| TTC13 | 14.36 | 2.383e-16 | 4.13e-12 | 0.9947 |
| RRM1 | 10.5 | 1.372e-15 | 2.38e-11 | 0.8658 |
| PPP3R1 | 9.81 | 2.695e-15 | 4.67e-11 | 0.8553 |
Figure S2. Get High-res Image As an example, this figure shows the association of METT10D to 'NEOADJUVANT.THERAPY'. P value = 3.58e-21 with T-test analysis.
-
Expresson data file = PRAD.meth.for_correlation.filtered_data.txt
-
Clinical data file = PRAD.clin.merged.picked.txt
-
Number of patients = 99
-
Number of genes = 17322
-
Number of clinical features = 3
For continuous numerical clinical features, Spearman's rank correlation coefficients (Spearman 1904) and two-tailed P values were estimated using 'cor.test' function in R
For two-class clinical features, two-tailed Student's t test with unequal variance (Lehmann and Romano 2005) was applied to compare the log2-expression levels between the two clinical classes using 't.test' function in R
For multiple hypothesis correction, Q value is the False Discovery Rate (FDR) analogue of the P value (Benjamini and Hochberg 1995), defined as the minimum FDR at which the test may be called significant. We used the 'Benjamini and Hochberg' method of 'p.adjust' function in R to convert P values into Q values.
This is an experimental feature. The full results of the analysis summarized in this report can be downloaded from the TCGA Data Coordination Center.