This pipeline computes the correlation between cancer subtypes identified by different molecular patterns and selected clinical features.
Testing the association between subtypes identified by 6 different clustering approaches and 10 clinical features across 159 patients, 4 significant findings detected with P value < 0.05.
-
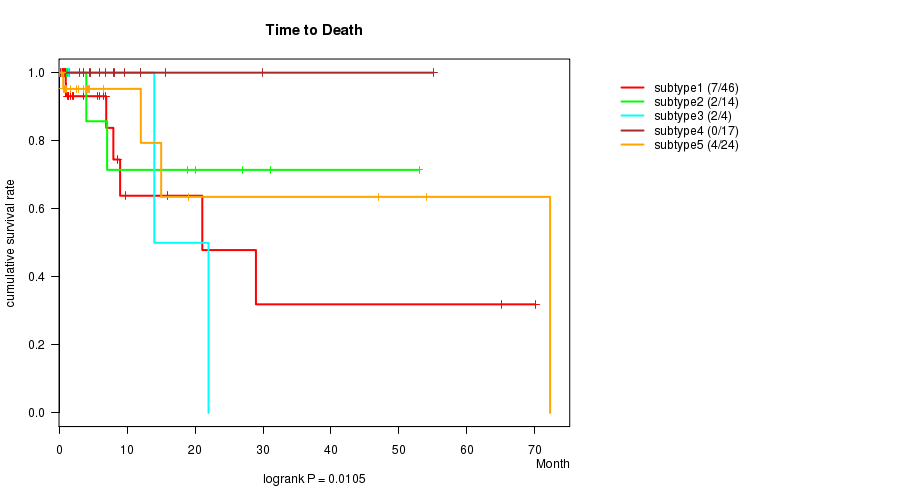
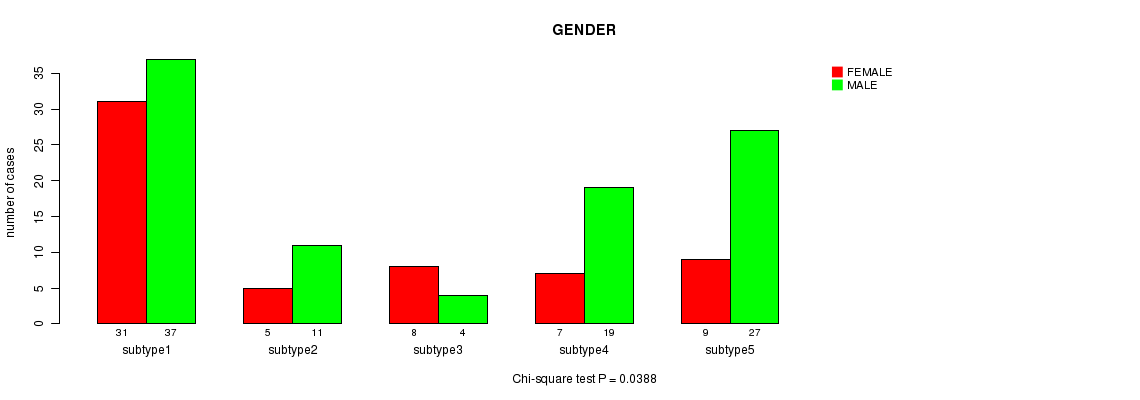
5 subtypes identified in current cancer cohort by 'CN CNMF'. These subtypes correlate to 'Time to Death' and 'GENDER'.
-
4 subtypes identified in current cancer cohort by 'METHLYATION CNMF'. These subtypes do not correlate to any clinical features.
-
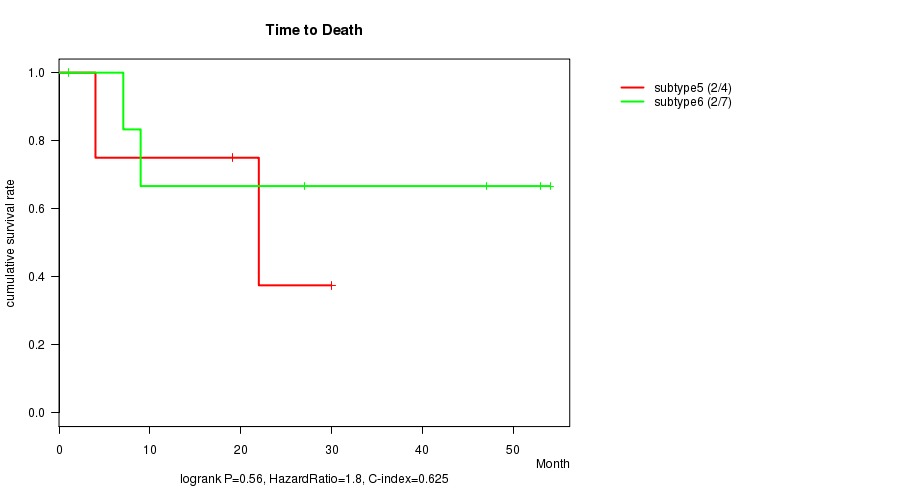
CNMF clustering analysis on sequencing-based mRNA expression data identified 6 subtypes that do not correlate to any clinical features.
-
Consensus hierarchical clustering analysis on sequencing-based mRNA expression data identified 4 subtypes that do not correlate to any clinical features.
-
CNMF clustering analysis on sequencing-based miR expression data identified 5 subtypes that correlate to 'HISTOLOGICAL.TYPE'.
-
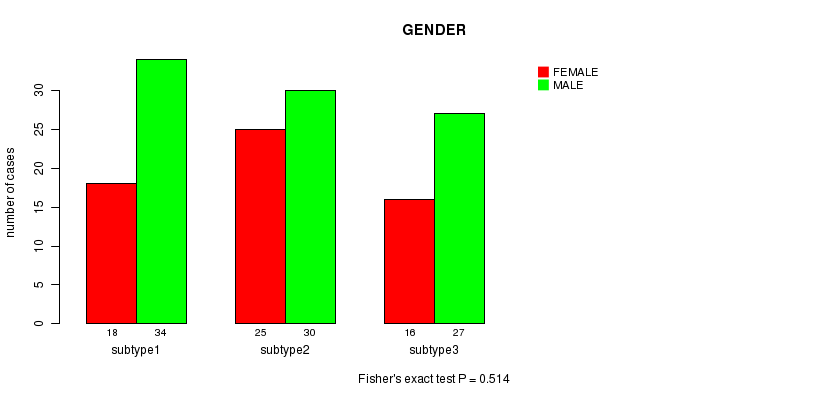
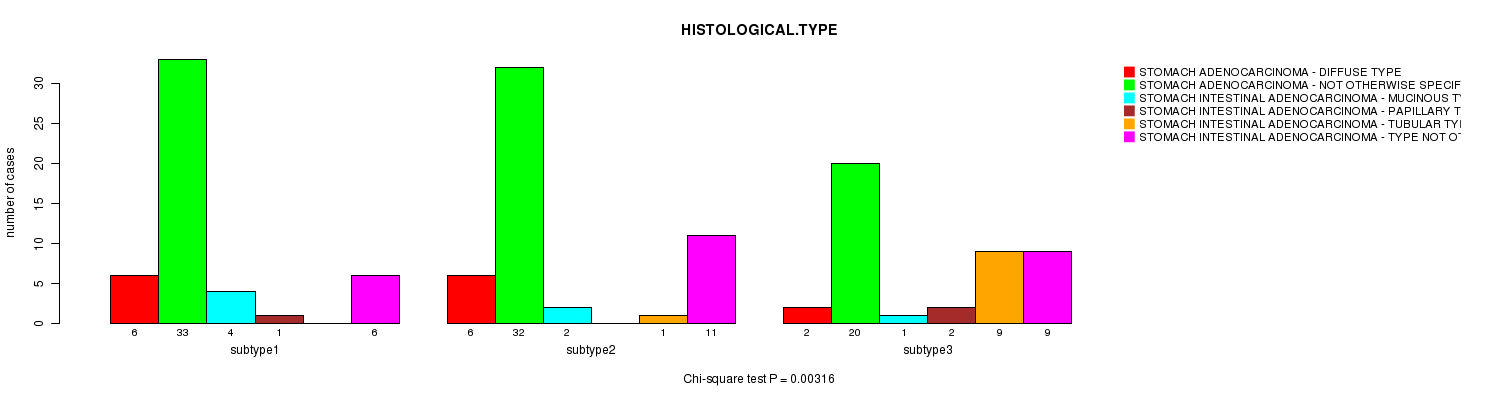
Consensus hierarchical clustering analysis on sequencing-based miR expression data identified 3 subtypes that correlate to 'HISTOLOGICAL.TYPE'.
Table 1. Get Full Table Overview of the association between subtypes identified by 6 different clustering approaches and 10 clinical features. Shown in the table are P values from statistical tests. Thresholded by P value < 0.05, 4 significant findings detected.
|
Clinical Features |
Statistical Tests |
CN CNMF |
METHLYATION CNMF |
RNAseq CNMF subtypes |
RNAseq cHierClus subtypes |
MIRseq CNMF subtypes |
MIRseq cHierClus subtypes |
| Time to Death | logrank test | 0.0105 | 0.165 | 0.56 | 0.676 | 0.158 | 0.612 |
| AGE | ANOVA | 0.178 | 0.183 | 0.358 | 0.591 | 0.38 | 0.833 |
| GENDER | Fisher's exact test | 0.0388 | 0.911 | 0.59 | 0.362 | 0.275 | 0.514 |
| HISTOLOGICAL TYPE | Chi-square test | 0.104 | 0.463 | 0.363 | 0.175 | 0.031 | 0.00316 |
| PATHOLOGY T | Chi-square test | 0.279 | 0.0825 | 0.304 | 0.578 | 0.768 | 0.545 |
| PATHOLOGY N | Chi-square test | 0.117 | 0.753 | 0.509 | 0.148 | 0.564 | 0.433 |
| PATHOLOGICSPREAD(M) | Chi-square test | 0.909 | 0.819 | 0.725 | 0.496 | 0.445 | 0.885 |
| TUMOR STAGE | Chi-square test | 0.924 | 0.21 | 0.746 | 0.0898 | 0.0727 | 0.194 |
| RADIATIONS RADIATION REGIMENINDICATION | Fisher's exact test | 0.316 | 0.81 | 0.0665 | 0.132 | ||
| NEOADJUVANT THERAPY | Fisher's exact test | 0.0539 | 0.873 | 0.23 | 0.797 |
Table S1. Get Full Table Description of clustering approach #1: 'CN CNMF'
| Cluster Labels | 1 | 2 | 3 | 4 | 5 |
|---|---|---|---|---|---|
| Number of samples | 68 | 16 | 12 | 26 | 36 |
P value = 0.0105 (logrank test)
Table S2. Clustering Approach #1: 'CN CNMF' versus Clinical Feature #1: 'Time to Death'
| nPatients | nDeath | Duration Range (Median), Month | |
|---|---|---|---|
| ALL | 105 | 15 | 0.1 - 72.2 (2.9) |
| subtype1 | 46 | 7 | 0.1 - 70.1 (1.0) |
| subtype2 | 14 | 2 | 0.1 - 53.0 (3.8) |
| subtype3 | 4 | 2 | 0.2 - 22.0 (7.7) |
| subtype4 | 17 | 0 | 0.2 - 55.0 (6.9) |
| subtype5 | 24 | 4 | 0.3 - 72.2 (3.8) |
Figure S1. Get High-res Image Clustering Approach #1: 'CN CNMF' versus Clinical Feature #1: 'Time to Death'
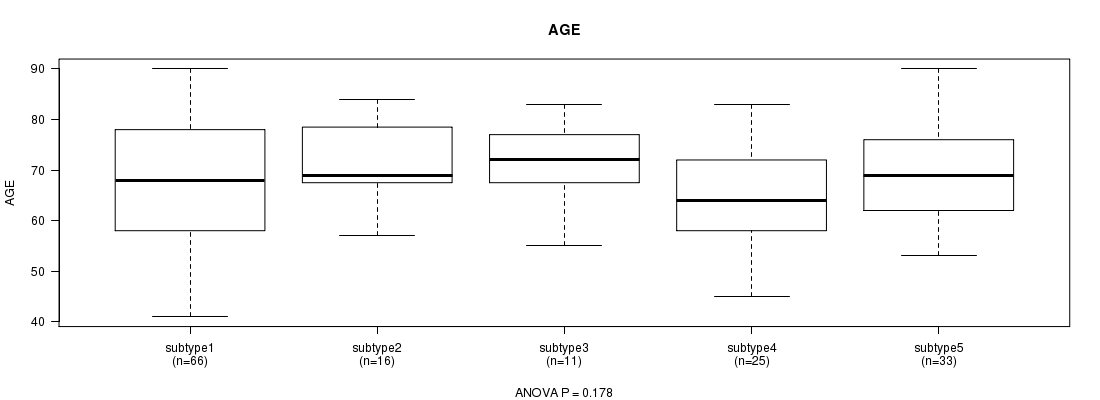
P value = 0.178 (ANOVA)
Table S3. Clustering Approach #1: 'CN CNMF' versus Clinical Feature #2: 'AGE'
| nPatients | Mean (Std.Dev) | |
|---|---|---|
| ALL | 151 | 67.9 (10.7) |
| subtype1 | 66 | 67.5 (12.0) |
| subtype2 | 16 | 71.1 (7.4) |
| subtype3 | 11 | 70.8 (8.8) |
| subtype4 | 25 | 64.0 (10.0) |
| subtype5 | 33 | 69.3 (9.7) |
Figure S2. Get High-res Image Clustering Approach #1: 'CN CNMF' versus Clinical Feature #2: 'AGE'
P value = 0.0388 (Chi-square test)
Table S4. Clustering Approach #1: 'CN CNMF' versus Clinical Feature #3: 'GENDER'
| nPatients | FEMALE | MALE |
|---|---|---|
| ALL | 60 | 98 |
| subtype1 | 31 | 37 |
| subtype2 | 5 | 11 |
| subtype3 | 8 | 4 |
| subtype4 | 7 | 19 |
| subtype5 | 9 | 27 |
Figure S3. Get High-res Image Clustering Approach #1: 'CN CNMF' versus Clinical Feature #3: 'GENDER'
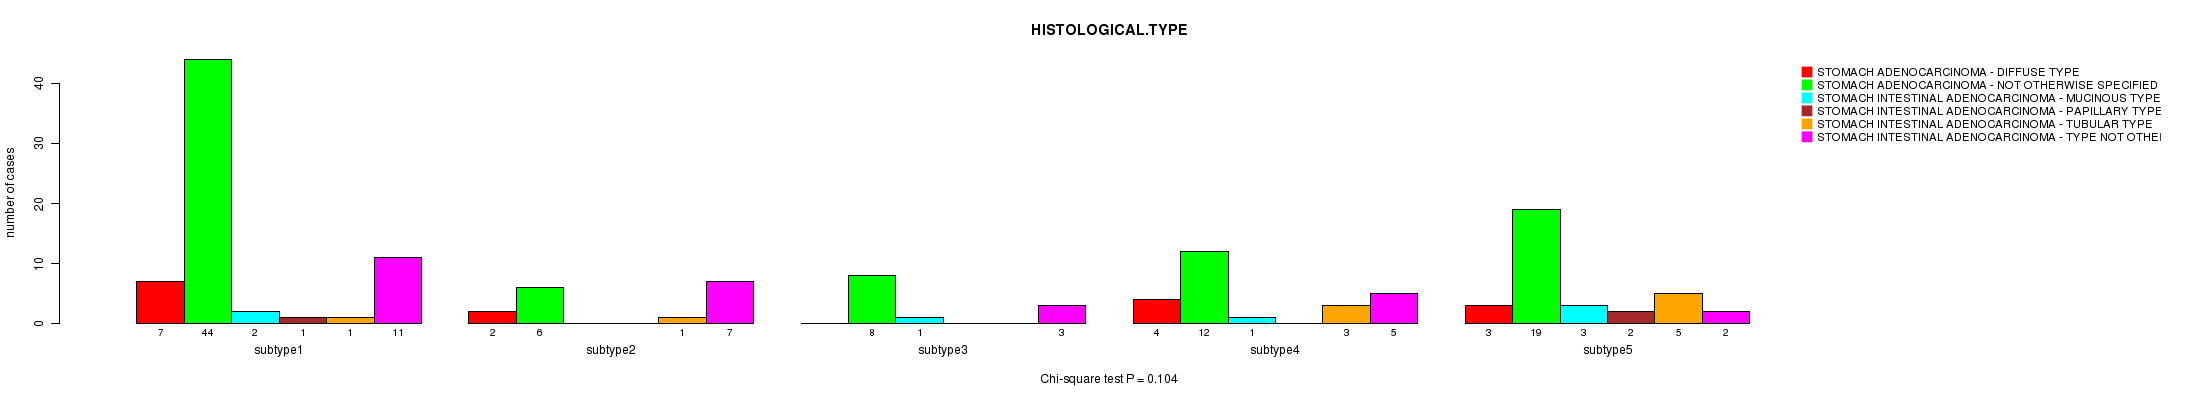
P value = 0.104 (Chi-square test)
Table S5. Clustering Approach #1: 'CN CNMF' versus Clinical Feature #4: 'HISTOLOGICAL.TYPE'
| nPatients | STOMACH ADENOCARCINOMA - DIFFUSE TYPE | STOMACH ADENOCARCINOMA - NOT OTHERWISE SPECIFIED (NOS) | STOMACH INTESTINAL ADENOCARCINOMA - MUCINOUS TYPE | STOMACH INTESTINAL ADENOCARCINOMA - PAPILLARY TYPE | STOMACH INTESTINAL ADENOCARCINOMA - TUBULAR TYPE | STOMACH INTESTINAL ADENOCARCINOMA - TYPE NOT OTHERWISE SPECIFIED (NOS) |
|---|---|---|---|---|---|---|
| ALL | 16 | 89 | 7 | 3 | 10 | 28 |
| subtype1 | 7 | 44 | 2 | 1 | 1 | 11 |
| subtype2 | 2 | 6 | 0 | 0 | 1 | 7 |
| subtype3 | 0 | 8 | 1 | 0 | 0 | 3 |
| subtype4 | 4 | 12 | 1 | 0 | 3 | 5 |
| subtype5 | 3 | 19 | 3 | 2 | 5 | 2 |
Figure S4. Get High-res Image Clustering Approach #1: 'CN CNMF' versus Clinical Feature #4: 'HISTOLOGICAL.TYPE'
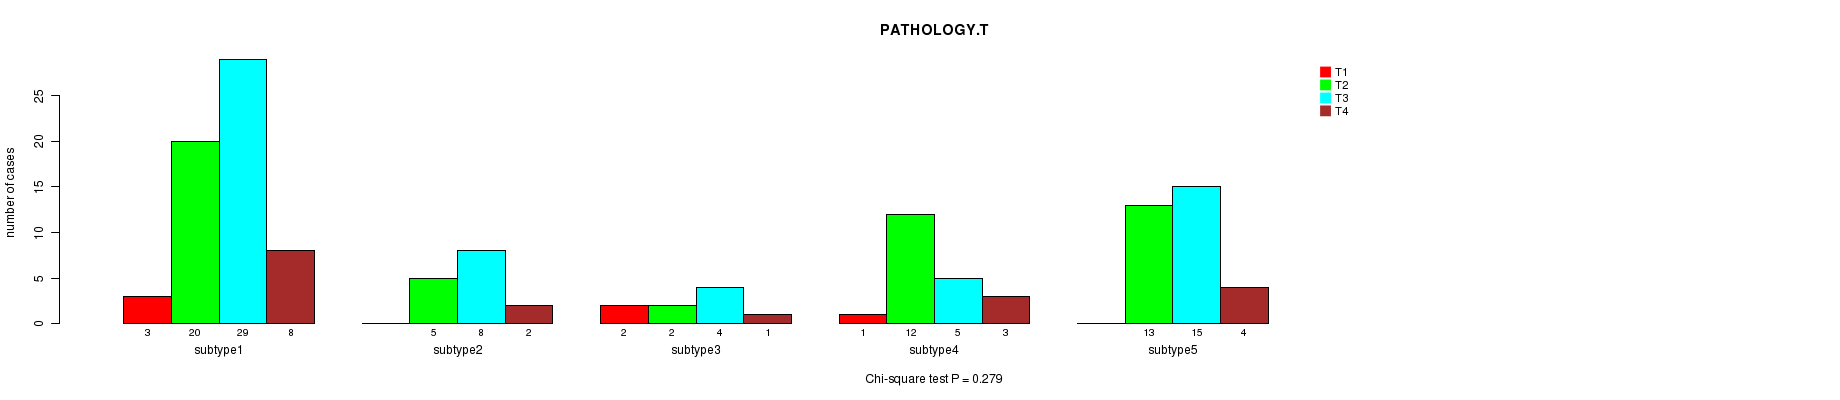
P value = 0.279 (Chi-square test)
Table S6. Clustering Approach #1: 'CN CNMF' versus Clinical Feature #5: 'PATHOLOGY.T'
| nPatients | T1 | T2 | T3 | T4 |
|---|---|---|---|---|
| ALL | 6 | 52 | 61 | 18 |
| subtype1 | 3 | 20 | 29 | 8 |
| subtype2 | 0 | 5 | 8 | 2 |
| subtype3 | 2 | 2 | 4 | 1 |
| subtype4 | 1 | 12 | 5 | 3 |
| subtype5 | 0 | 13 | 15 | 4 |
Figure S5. Get High-res Image Clustering Approach #1: 'CN CNMF' versus Clinical Feature #5: 'PATHOLOGY.T'
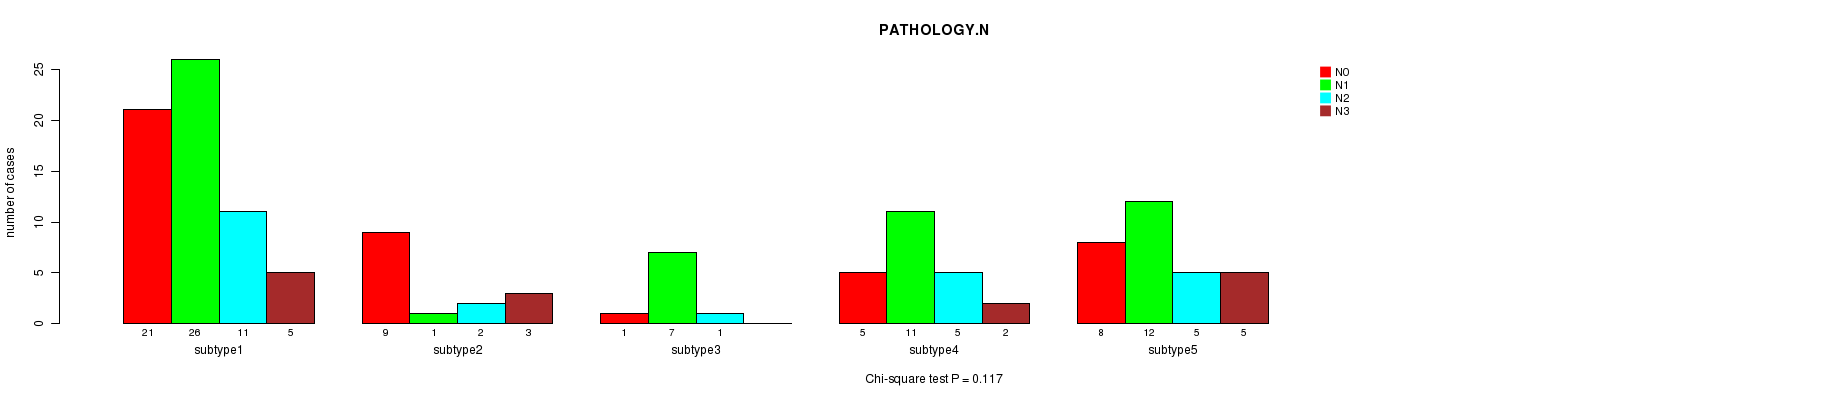
P value = 0.117 (Chi-square test)
Table S7. Clustering Approach #1: 'CN CNMF' versus Clinical Feature #6: 'PATHOLOGY.N'
| nPatients | N0 | N1 | N2 | N3 |
|---|---|---|---|---|
| ALL | 44 | 57 | 24 | 15 |
| subtype1 | 21 | 26 | 11 | 5 |
| subtype2 | 9 | 1 | 2 | 3 |
| subtype3 | 1 | 7 | 1 | 0 |
| subtype4 | 5 | 11 | 5 | 2 |
| subtype5 | 8 | 12 | 5 | 5 |
Figure S6. Get High-res Image Clustering Approach #1: 'CN CNMF' versus Clinical Feature #6: 'PATHOLOGY.N'
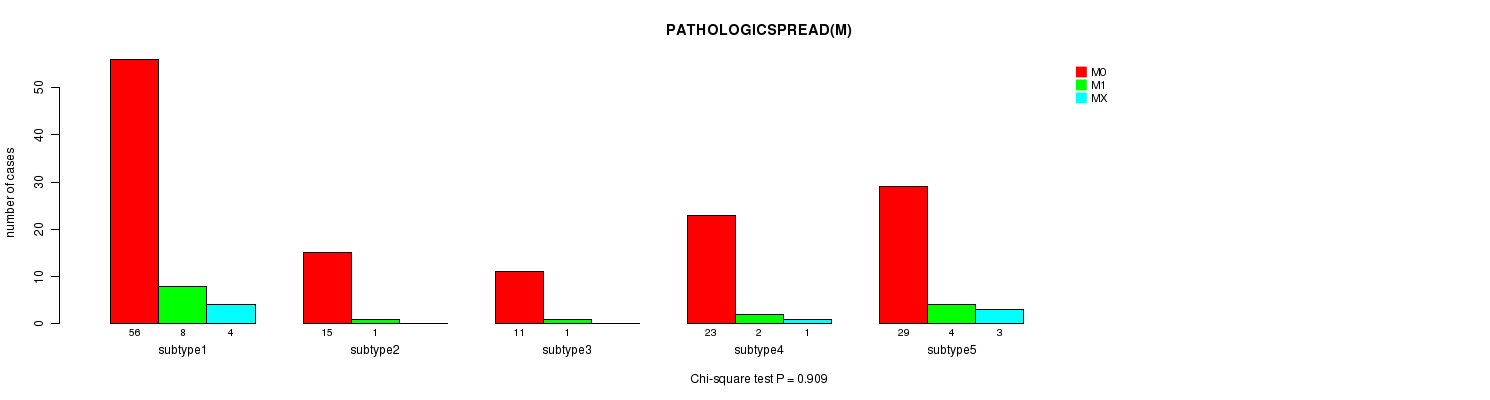
P value = 0.909 (Chi-square test)
Table S8. Clustering Approach #1: 'CN CNMF' versus Clinical Feature #7: 'PATHOLOGICSPREAD(M)'
| nPatients | M0 | M1 | MX |
|---|---|---|---|
| ALL | 134 | 16 | 8 |
| subtype1 | 56 | 8 | 4 |
| subtype2 | 15 | 1 | 0 |
| subtype3 | 11 | 1 | 0 |
| subtype4 | 23 | 2 | 1 |
| subtype5 | 29 | 4 | 3 |
Figure S7. Get High-res Image Clustering Approach #1: 'CN CNMF' versus Clinical Feature #7: 'PATHOLOGICSPREAD(M)'
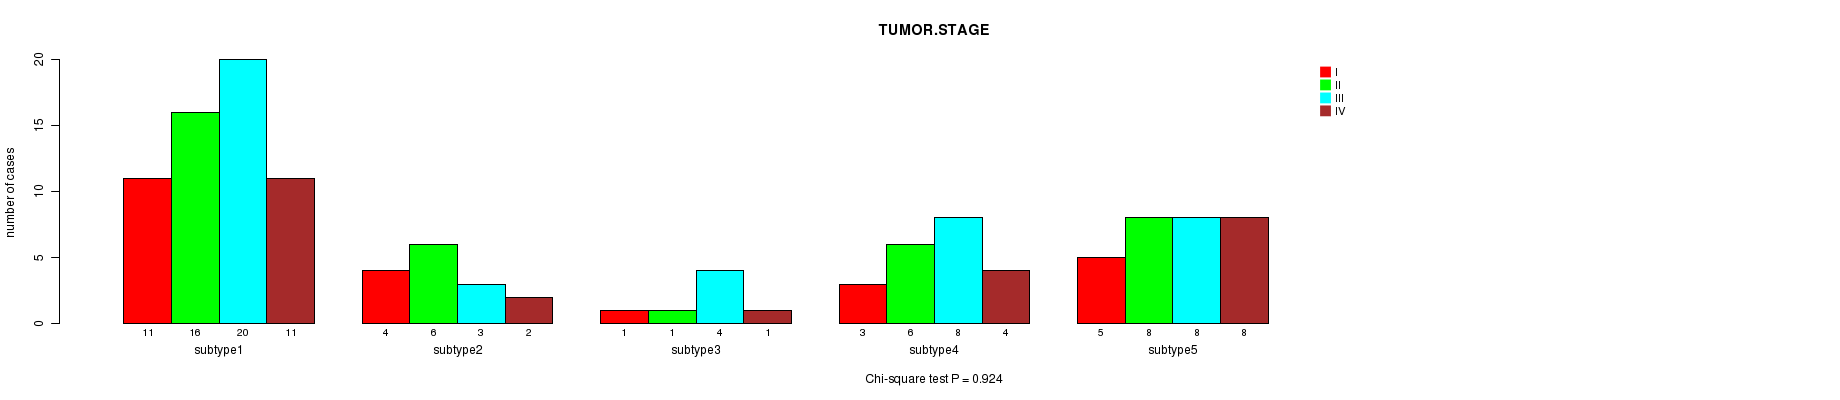
P value = 0.924 (Chi-square test)
Table S9. Clustering Approach #1: 'CN CNMF' versus Clinical Feature #8: 'TUMOR.STAGE'
| nPatients | I | II | III | IV |
|---|---|---|---|---|
| ALL | 24 | 37 | 43 | 26 |
| subtype1 | 11 | 16 | 20 | 11 |
| subtype2 | 4 | 6 | 3 | 2 |
| subtype3 | 1 | 1 | 4 | 1 |
| subtype4 | 3 | 6 | 8 | 4 |
| subtype5 | 5 | 8 | 8 | 8 |
Figure S8. Get High-res Image Clustering Approach #1: 'CN CNMF' versus Clinical Feature #8: 'TUMOR.STAGE'
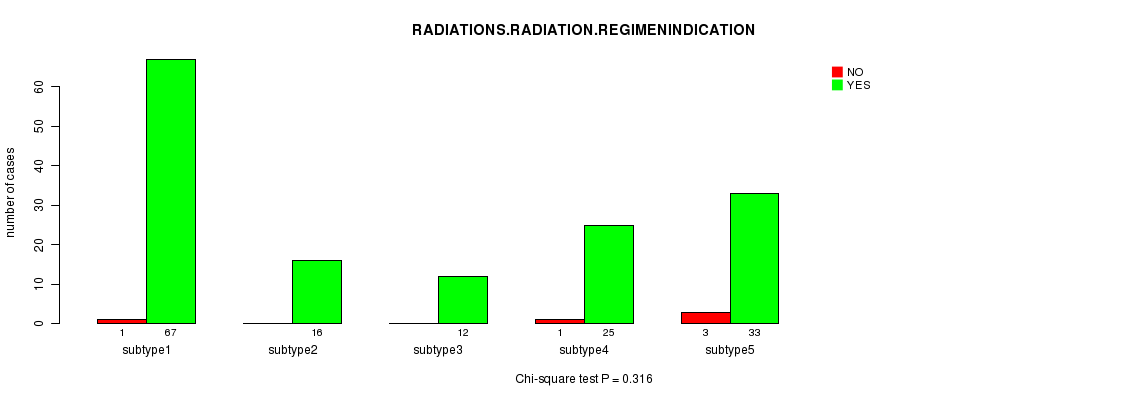
P value = 0.316 (Chi-square test)
Table S10. Clustering Approach #1: 'CN CNMF' versus Clinical Feature #9: 'RADIATIONS.RADIATION.REGIMENINDICATION'
| nPatients | NO | YES |
|---|---|---|
| ALL | 5 | 153 |
| subtype1 | 1 | 67 |
| subtype2 | 0 | 16 |
| subtype3 | 0 | 12 |
| subtype4 | 1 | 25 |
| subtype5 | 3 | 33 |
Figure S9. Get High-res Image Clustering Approach #1: 'CN CNMF' versus Clinical Feature #9: 'RADIATIONS.RADIATION.REGIMENINDICATION'
P value = 0.0539 (Chi-square test)
Table S11. Clustering Approach #1: 'CN CNMF' versus Clinical Feature #10: 'NEOADJUVANT.THERAPY'
| nPatients | NO | YES |
|---|---|---|
| ALL | 11 | 147 |
| subtype1 | 2 | 66 |
| subtype2 | 0 | 16 |
| subtype3 | 0 | 12 |
| subtype4 | 4 | 22 |
| subtype5 | 5 | 31 |
Figure S10. Get High-res Image Clustering Approach #1: 'CN CNMF' versus Clinical Feature #10: 'NEOADJUVANT.THERAPY'
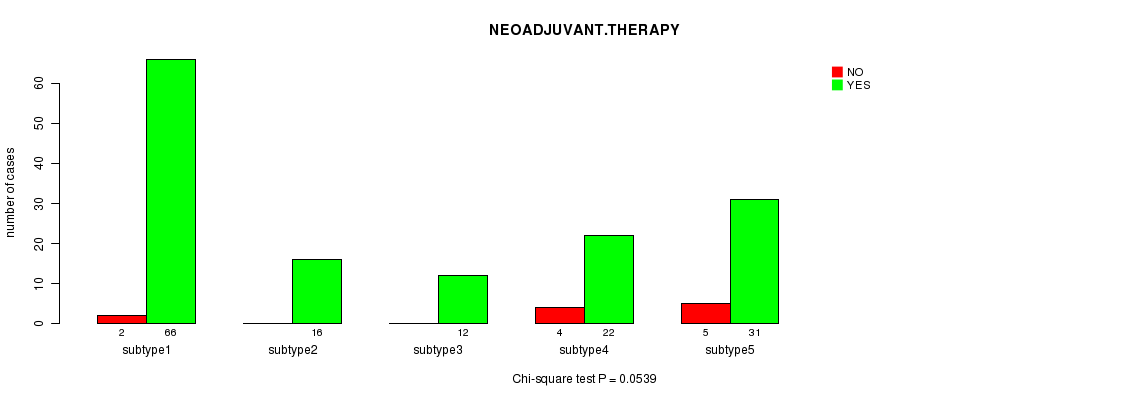
Table S12. Get Full Table Description of clustering approach #2: 'METHLYATION CNMF'
| Cluster Labels | 1 | 2 | 3 | 4 |
|---|---|---|---|---|
| Number of samples | 26 | 21 | 20 | 28 |
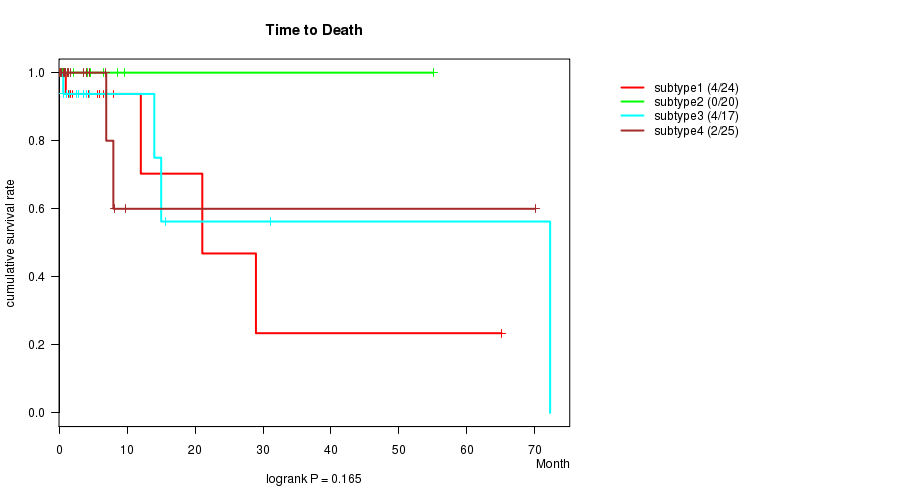
P value = 0.165 (logrank test)
Table S13. Clustering Approach #2: 'METHLYATION CNMF' versus Clinical Feature #1: 'Time to Death'
| nPatients | nDeath | Duration Range (Median), Month | |
|---|---|---|---|
| ALL | 86 | 10 | 0.1 - 72.2 (1.4) |
| subtype1 | 24 | 4 | 0.1 - 65.1 (1.8) |
| subtype2 | 20 | 0 | 0.1 - 55.0 (1.2) |
| subtype3 | 17 | 4 | 0.4 - 72.2 (3.6) |
| subtype4 | 25 | 2 | 0.1 - 70.1 (1.0) |
Figure S11. Get High-res Image Clustering Approach #2: 'METHLYATION CNMF' versus Clinical Feature #1: 'Time to Death'
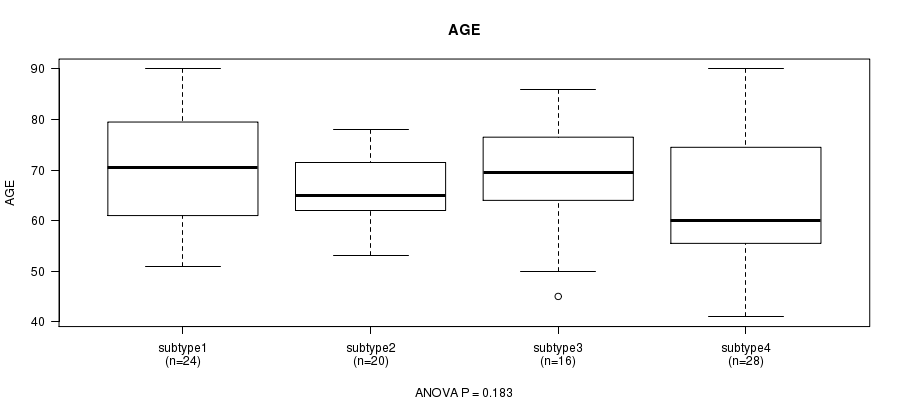
P value = 0.183 (ANOVA)
Table S14. Clustering Approach #2: 'METHLYATION CNMF' versus Clinical Feature #2: 'AGE'
| nPatients | Mean (Std.Dev) | |
|---|---|---|
| ALL | 88 | 67.1 (10.9) |
| subtype1 | 24 | 70.5 (11.1) |
| subtype2 | 20 | 66.0 (7.1) |
| subtype3 | 16 | 68.5 (11.1) |
| subtype4 | 28 | 64.2 (12.5) |
Figure S12. Get High-res Image Clustering Approach #2: 'METHLYATION CNMF' versus Clinical Feature #2: 'AGE'
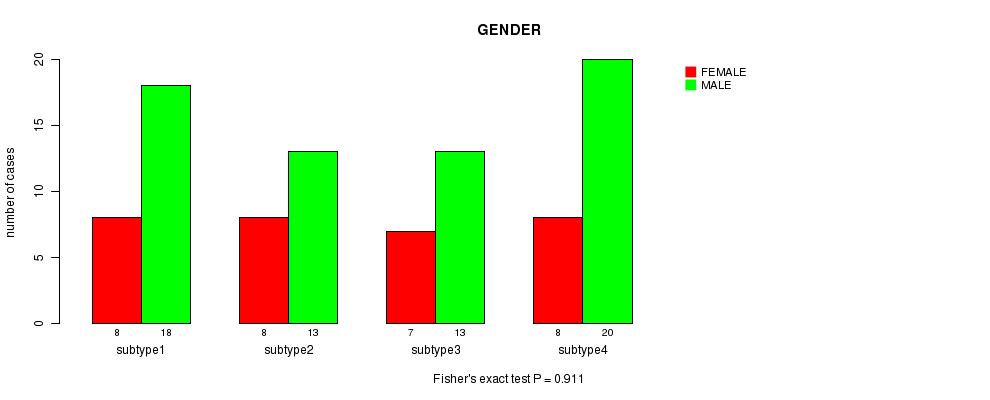
P value = 0.911 (Fisher's exact test)
Table S15. Clustering Approach #2: 'METHLYATION CNMF' versus Clinical Feature #3: 'GENDER'
| nPatients | FEMALE | MALE |
|---|---|---|
| ALL | 31 | 64 |
| subtype1 | 8 | 18 |
| subtype2 | 8 | 13 |
| subtype3 | 7 | 13 |
| subtype4 | 8 | 20 |
Figure S13. Get High-res Image Clustering Approach #2: 'METHLYATION CNMF' versus Clinical Feature #3: 'GENDER'
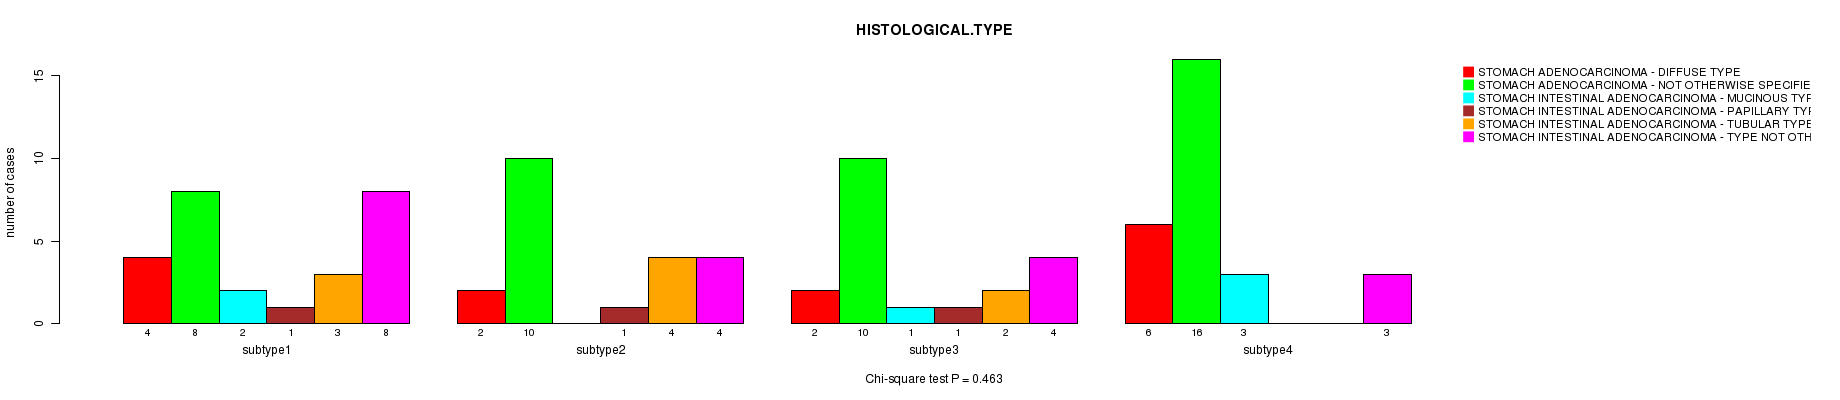
P value = 0.463 (Chi-square test)
Table S16. Clustering Approach #2: 'METHLYATION CNMF' versus Clinical Feature #4: 'HISTOLOGICAL.TYPE'
| nPatients | STOMACH ADENOCARCINOMA - DIFFUSE TYPE | STOMACH ADENOCARCINOMA - NOT OTHERWISE SPECIFIED (NOS) | STOMACH INTESTINAL ADENOCARCINOMA - MUCINOUS TYPE | STOMACH INTESTINAL ADENOCARCINOMA - PAPILLARY TYPE | STOMACH INTESTINAL ADENOCARCINOMA - TUBULAR TYPE | STOMACH INTESTINAL ADENOCARCINOMA - TYPE NOT OTHERWISE SPECIFIED (NOS) |
|---|---|---|---|---|---|---|
| ALL | 14 | 44 | 6 | 3 | 9 | 19 |
| subtype1 | 4 | 8 | 2 | 1 | 3 | 8 |
| subtype2 | 2 | 10 | 0 | 1 | 4 | 4 |
| subtype3 | 2 | 10 | 1 | 1 | 2 | 4 |
| subtype4 | 6 | 16 | 3 | 0 | 0 | 3 |
Figure S14. Get High-res Image Clustering Approach #2: 'METHLYATION CNMF' versus Clinical Feature #4: 'HISTOLOGICAL.TYPE'
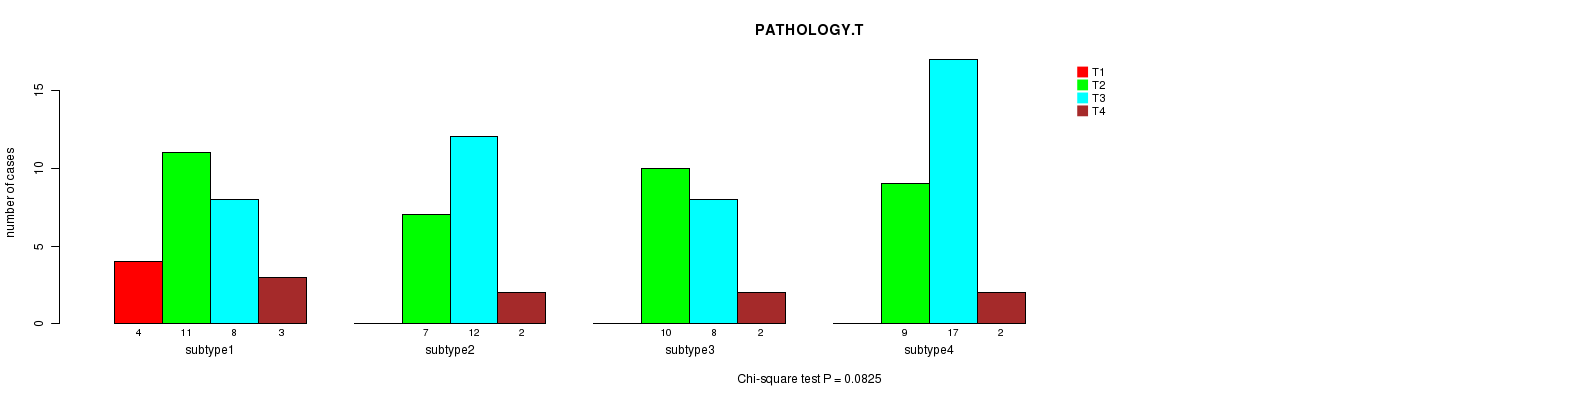
P value = 0.0825 (Chi-square test)
Table S17. Clustering Approach #2: 'METHLYATION CNMF' versus Clinical Feature #5: 'PATHOLOGY.T'
| nPatients | T1 | T2 | T3 | T4 |
|---|---|---|---|---|
| ALL | 4 | 37 | 45 | 9 |
| subtype1 | 4 | 11 | 8 | 3 |
| subtype2 | 0 | 7 | 12 | 2 |
| subtype3 | 0 | 10 | 8 | 2 |
| subtype4 | 0 | 9 | 17 | 2 |
Figure S15. Get High-res Image Clustering Approach #2: 'METHLYATION CNMF' versus Clinical Feature #5: 'PATHOLOGY.T'
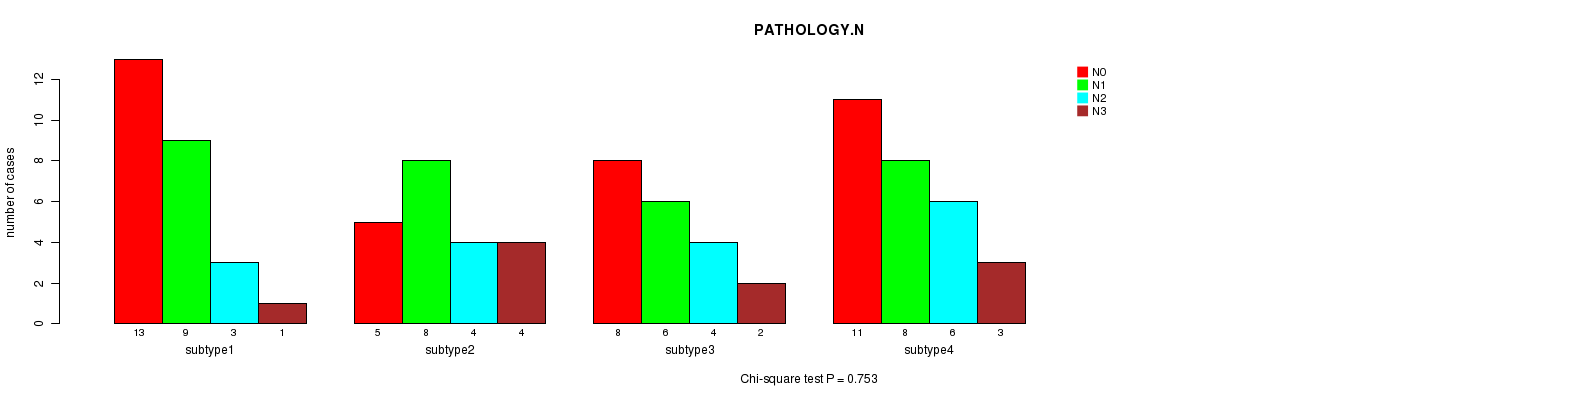
P value = 0.753 (Chi-square test)
Table S18. Clustering Approach #2: 'METHLYATION CNMF' versus Clinical Feature #6: 'PATHOLOGY.N'
| nPatients | N0 | N1 | N2 | N3 |
|---|---|---|---|---|
| ALL | 37 | 31 | 17 | 10 |
| subtype1 | 13 | 9 | 3 | 1 |
| subtype2 | 5 | 8 | 4 | 4 |
| subtype3 | 8 | 6 | 4 | 2 |
| subtype4 | 11 | 8 | 6 | 3 |
Figure S16. Get High-res Image Clustering Approach #2: 'METHLYATION CNMF' versus Clinical Feature #6: 'PATHOLOGY.N'
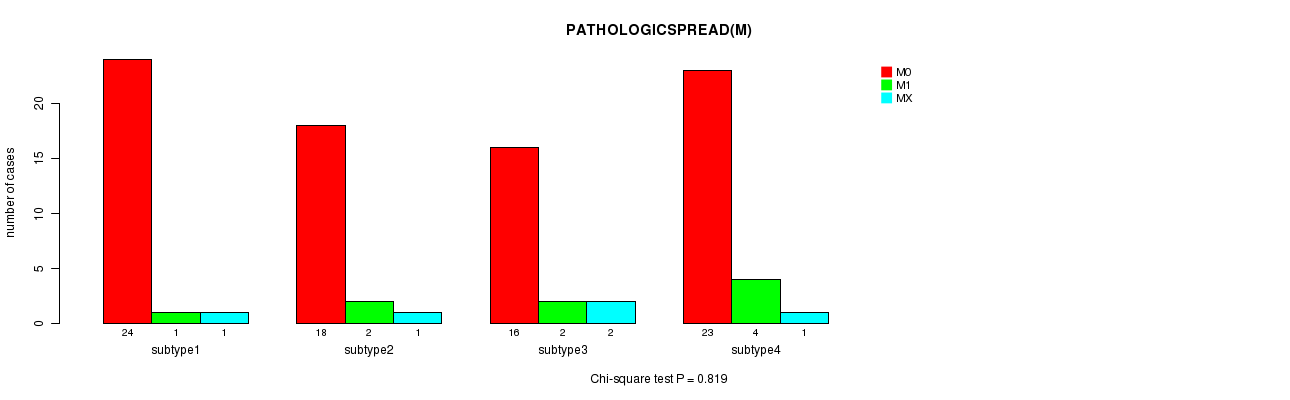
P value = 0.819 (Chi-square test)
Table S19. Clustering Approach #2: 'METHLYATION CNMF' versus Clinical Feature #7: 'PATHOLOGICSPREAD(M)'
| nPatients | M0 | M1 | MX |
|---|---|---|---|
| ALL | 81 | 9 | 5 |
| subtype1 | 24 | 1 | 1 |
| subtype2 | 18 | 2 | 1 |
| subtype3 | 16 | 2 | 2 |
| subtype4 | 23 | 4 | 1 |
Figure S17. Get High-res Image Clustering Approach #2: 'METHLYATION CNMF' versus Clinical Feature #7: 'PATHOLOGICSPREAD(M)'
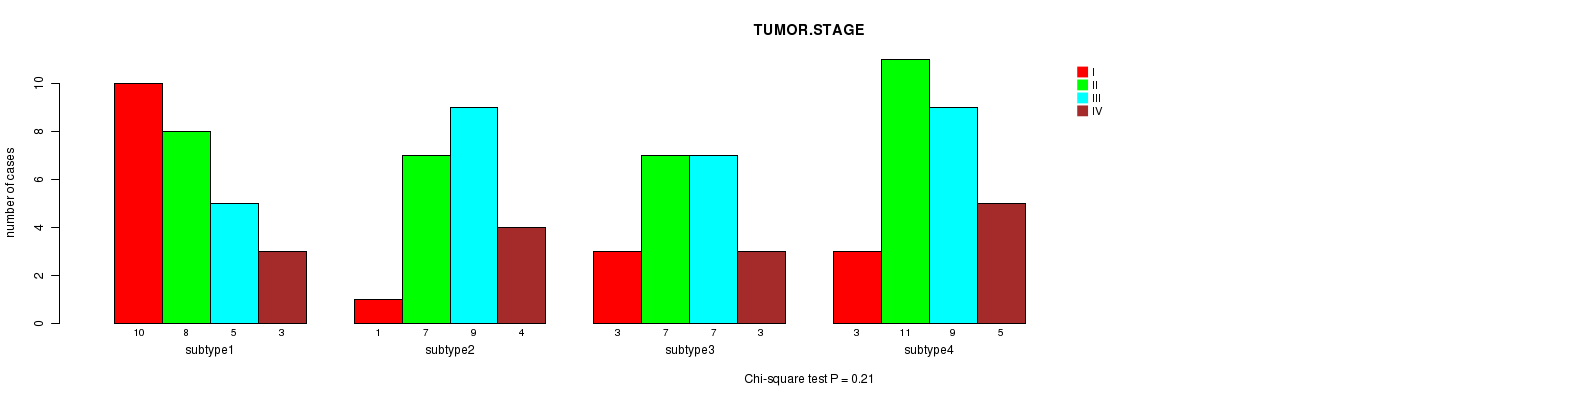
P value = 0.21 (Chi-square test)
Table S20. Clustering Approach #2: 'METHLYATION CNMF' versus Clinical Feature #8: 'TUMOR.STAGE'
| nPatients | I | II | III | IV |
|---|---|---|---|---|
| ALL | 17 | 33 | 30 | 15 |
| subtype1 | 10 | 8 | 5 | 3 |
| subtype2 | 1 | 7 | 9 | 4 |
| subtype3 | 3 | 7 | 7 | 3 |
| subtype4 | 3 | 11 | 9 | 5 |
Figure S18. Get High-res Image Clustering Approach #2: 'METHLYATION CNMF' versus Clinical Feature #8: 'TUMOR.STAGE'
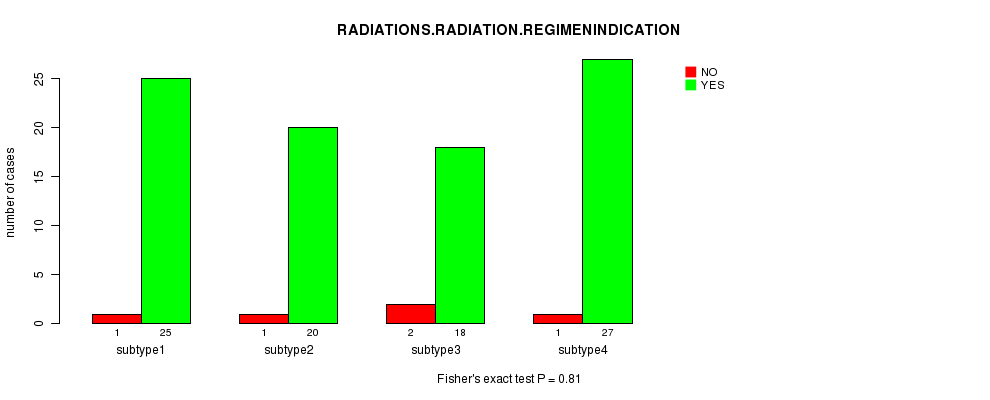
P value = 0.81 (Fisher's exact test)
Table S21. Clustering Approach #2: 'METHLYATION CNMF' versus Clinical Feature #9: 'RADIATIONS.RADIATION.REGIMENINDICATION'
| nPatients | NO | YES |
|---|---|---|
| ALL | 5 | 90 |
| subtype1 | 1 | 25 |
| subtype2 | 1 | 20 |
| subtype3 | 2 | 18 |
| subtype4 | 1 | 27 |
Figure S19. Get High-res Image Clustering Approach #2: 'METHLYATION CNMF' versus Clinical Feature #9: 'RADIATIONS.RADIATION.REGIMENINDICATION'
P value = 0.873 (Fisher's exact test)
Table S22. Clustering Approach #2: 'METHLYATION CNMF' versus Clinical Feature #10: 'NEOADJUVANT.THERAPY'
| nPatients | NO | YES |
|---|---|---|
| ALL | 11 | 84 |
| subtype1 | 2 | 24 |
| subtype2 | 3 | 18 |
| subtype3 | 3 | 17 |
| subtype4 | 3 | 25 |
Figure S20. Get High-res Image Clustering Approach #2: 'METHLYATION CNMF' versus Clinical Feature #10: 'NEOADJUVANT.THERAPY'
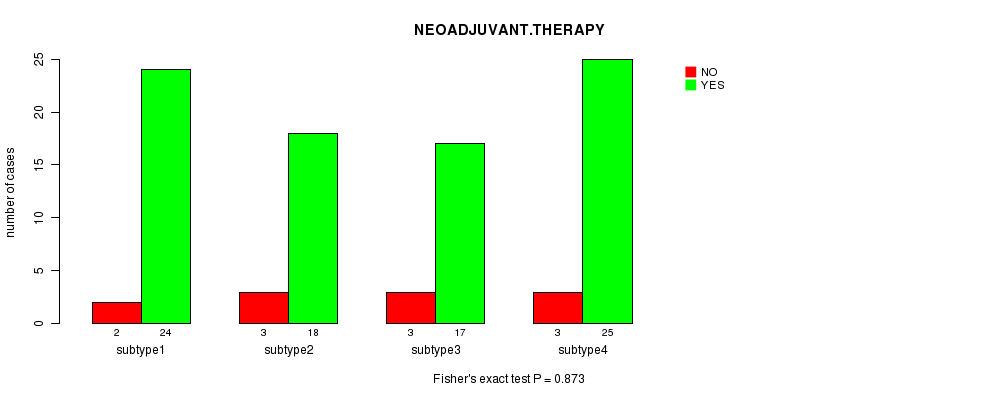
Table S23. Get Full Table Description of clustering approach #3: 'RNAseq CNMF subtypes'
| Cluster Labels | 1 | 2 | 3 | 4 | 5 | 6 |
|---|---|---|---|---|---|---|
| Number of samples | 11 | 6 | 7 | 11 | 12 | 10 |
P value = 0.56 (logrank test)
Table S24. Clustering Approach #3: 'RNAseq CNMF subtypes' versus Clinical Feature #1: 'Time to Death'
| nPatients | nDeath | Duration Range (Median), Month | |
|---|---|---|---|
| ALL | 18 | 5 | 1.0 - 54.0 (14.0) |
| subtype1 | 2 | 0 | 1.0 - 12.0 (6.5) |
| subtype2 | 2 | 0 | 1.0 - 18.9 (10.0) |
| subtype3 | 1 | 0 | 3.0 - 3.0 (3.0) |
| subtype4 | 2 | 1 | 1.0 - 15.9 (8.5) |
| subtype5 | 4 | 2 | 4.0 - 30.0 (20.5) |
| subtype6 | 7 | 2 | 1.0 - 54.0 (27.0) |
Figure S21. Get High-res Image Clustering Approach #3: 'RNAseq CNMF subtypes' versus Clinical Feature #1: 'Time to Death'
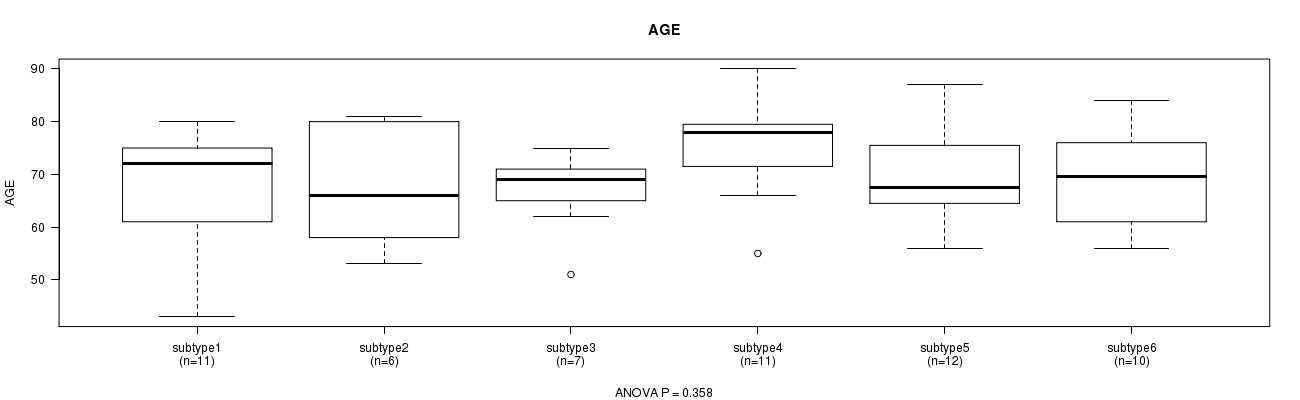
P value = 0.358 (ANOVA)
Table S25. Clustering Approach #3: 'RNAseq CNMF subtypes' versus Clinical Feature #2: 'AGE'
| nPatients | Mean (Std.Dev) | |
|---|---|---|
| ALL | 57 | 69.5 (10.1) |
| subtype1 | 11 | 67.0 (12.3) |
| subtype2 | 6 | 67.3 (12.0) |
| subtype3 | 7 | 66.7 (8.1) |
| subtype4 | 11 | 75.6 (9.5) |
| subtype5 | 12 | 69.2 (9.0) |
| subtype6 | 10 | 68.9 (9.1) |
Figure S22. Get High-res Image Clustering Approach #3: 'RNAseq CNMF subtypes' versus Clinical Feature #2: 'AGE'
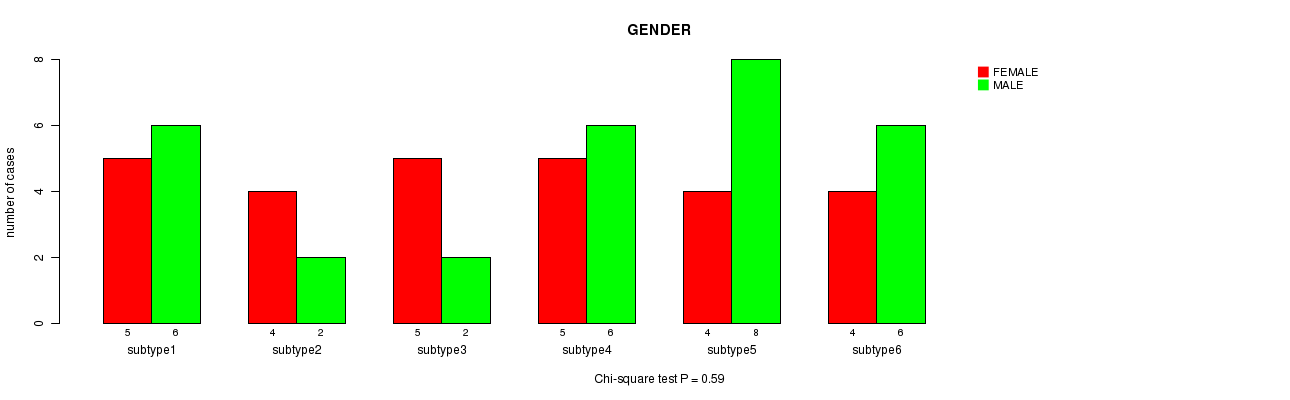
P value = 0.59 (Chi-square test)
Table S26. Clustering Approach #3: 'RNAseq CNMF subtypes' versus Clinical Feature #3: 'GENDER'
| nPatients | FEMALE | MALE |
|---|---|---|
| ALL | 27 | 30 |
| subtype1 | 5 | 6 |
| subtype2 | 4 | 2 |
| subtype3 | 5 | 2 |
| subtype4 | 5 | 6 |
| subtype5 | 4 | 8 |
| subtype6 | 4 | 6 |
Figure S23. Get High-res Image Clustering Approach #3: 'RNAseq CNMF subtypes' versus Clinical Feature #3: 'GENDER'
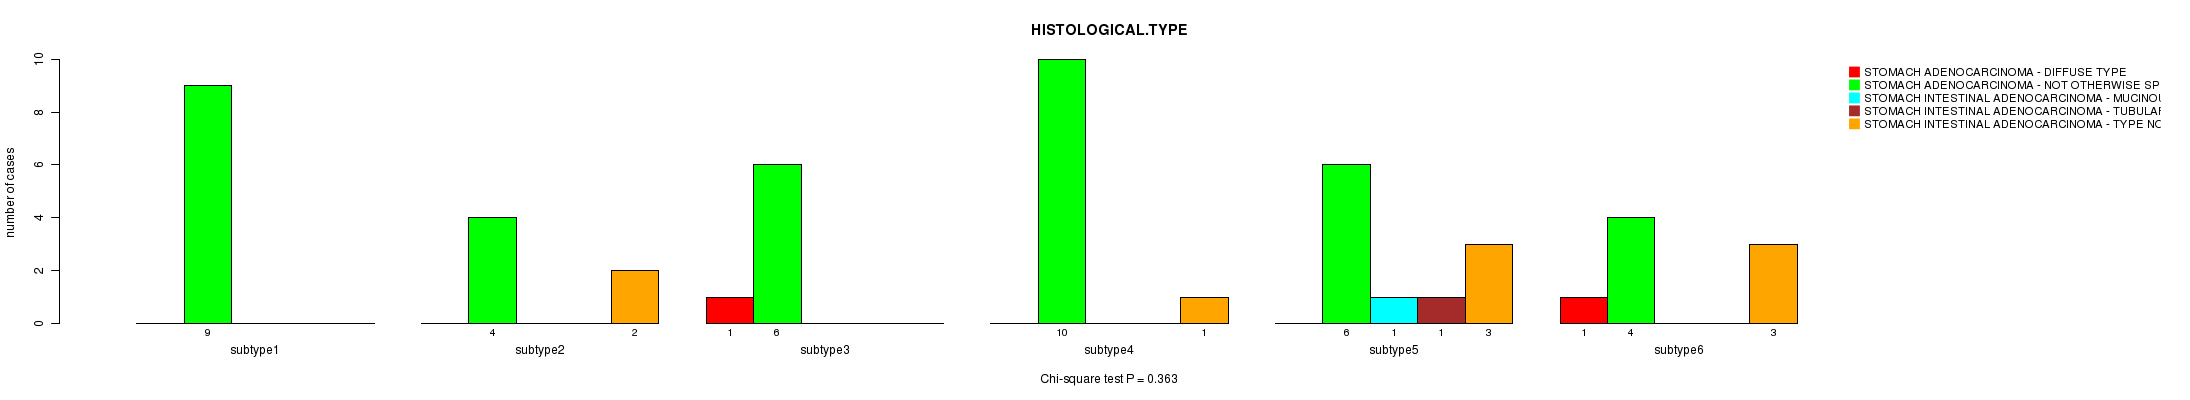
P value = 0.363 (Chi-square test)
Table S27. Clustering Approach #3: 'RNAseq CNMF subtypes' versus Clinical Feature #4: 'HISTOLOGICAL.TYPE'
| nPatients | STOMACH ADENOCARCINOMA - DIFFUSE TYPE | STOMACH ADENOCARCINOMA - NOT OTHERWISE SPECIFIED (NOS) | STOMACH INTESTINAL ADENOCARCINOMA - MUCINOUS TYPE | STOMACH INTESTINAL ADENOCARCINOMA - TUBULAR TYPE | STOMACH INTESTINAL ADENOCARCINOMA - TYPE NOT OTHERWISE SPECIFIED (NOS) |
|---|---|---|---|---|---|
| ALL | 2 | 39 | 1 | 1 | 9 |
| subtype1 | 0 | 9 | 0 | 0 | 0 |
| subtype2 | 0 | 4 | 0 | 0 | 2 |
| subtype3 | 1 | 6 | 0 | 0 | 0 |
| subtype4 | 0 | 10 | 0 | 0 | 1 |
| subtype5 | 0 | 6 | 1 | 1 | 3 |
| subtype6 | 1 | 4 | 0 | 0 | 3 |
Figure S24. Get High-res Image Clustering Approach #3: 'RNAseq CNMF subtypes' versus Clinical Feature #4: 'HISTOLOGICAL.TYPE'
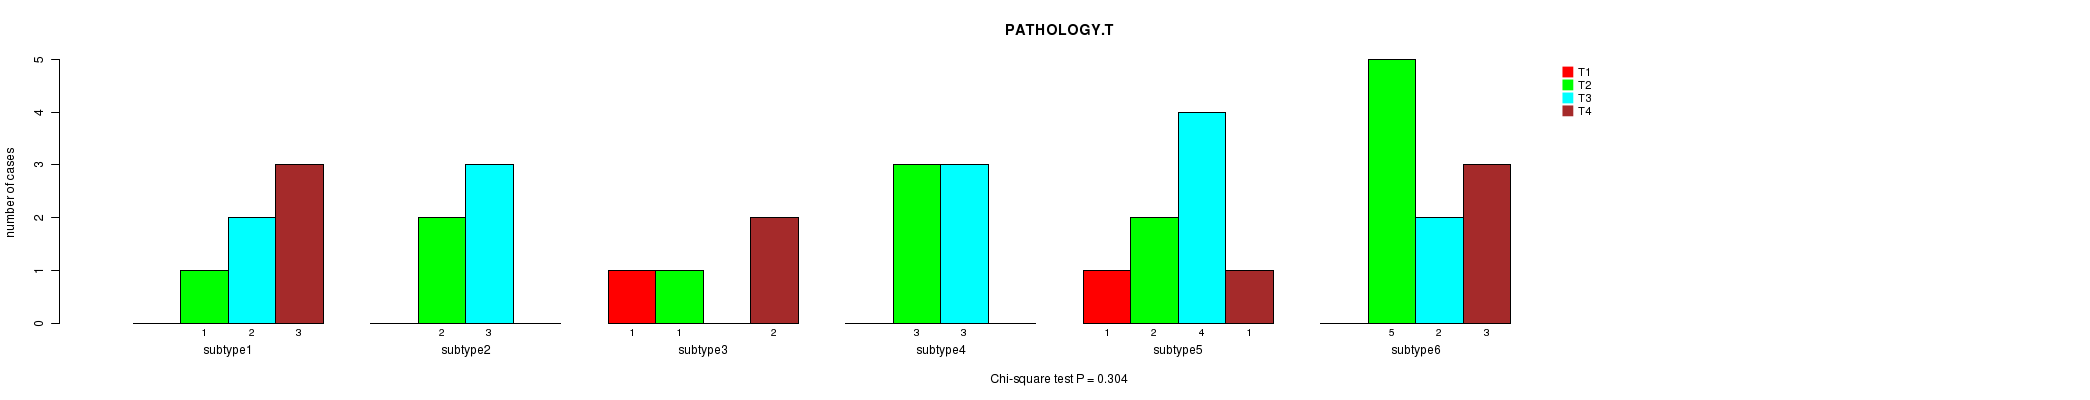
P value = 0.304 (Chi-square test)
Table S28. Clustering Approach #3: 'RNAseq CNMF subtypes' versus Clinical Feature #5: 'PATHOLOGY.T'
| nPatients | T1 | T2 | T3 | T4 |
|---|---|---|---|---|
| ALL | 2 | 14 | 14 | 9 |
| subtype1 | 0 | 1 | 2 | 3 |
| subtype2 | 0 | 2 | 3 | 0 |
| subtype3 | 1 | 1 | 0 | 2 |
| subtype4 | 0 | 3 | 3 | 0 |
| subtype5 | 1 | 2 | 4 | 1 |
| subtype6 | 0 | 5 | 2 | 3 |
Figure S25. Get High-res Image Clustering Approach #3: 'RNAseq CNMF subtypes' versus Clinical Feature #5: 'PATHOLOGY.T'
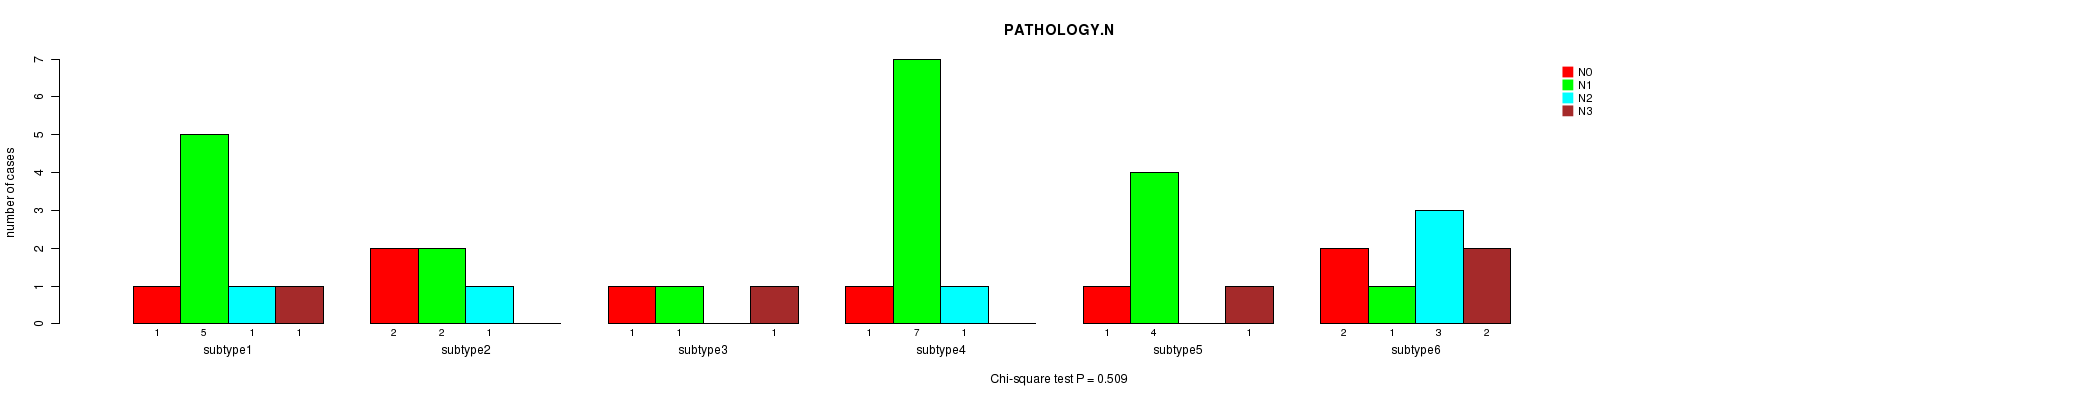
P value = 0.509 (Chi-square test)
Table S29. Clustering Approach #3: 'RNAseq CNMF subtypes' versus Clinical Feature #6: 'PATHOLOGY.N'
| nPatients | N0 | N1 | N2 | N3 |
|---|---|---|---|---|
| ALL | 8 | 20 | 6 | 5 |
| subtype1 | 1 | 5 | 1 | 1 |
| subtype2 | 2 | 2 | 1 | 0 |
| subtype3 | 1 | 1 | 0 | 1 |
| subtype4 | 1 | 7 | 1 | 0 |
| subtype5 | 1 | 4 | 0 | 1 |
| subtype6 | 2 | 1 | 3 | 2 |
Figure S26. Get High-res Image Clustering Approach #3: 'RNAseq CNMF subtypes' versus Clinical Feature #6: 'PATHOLOGY.N'
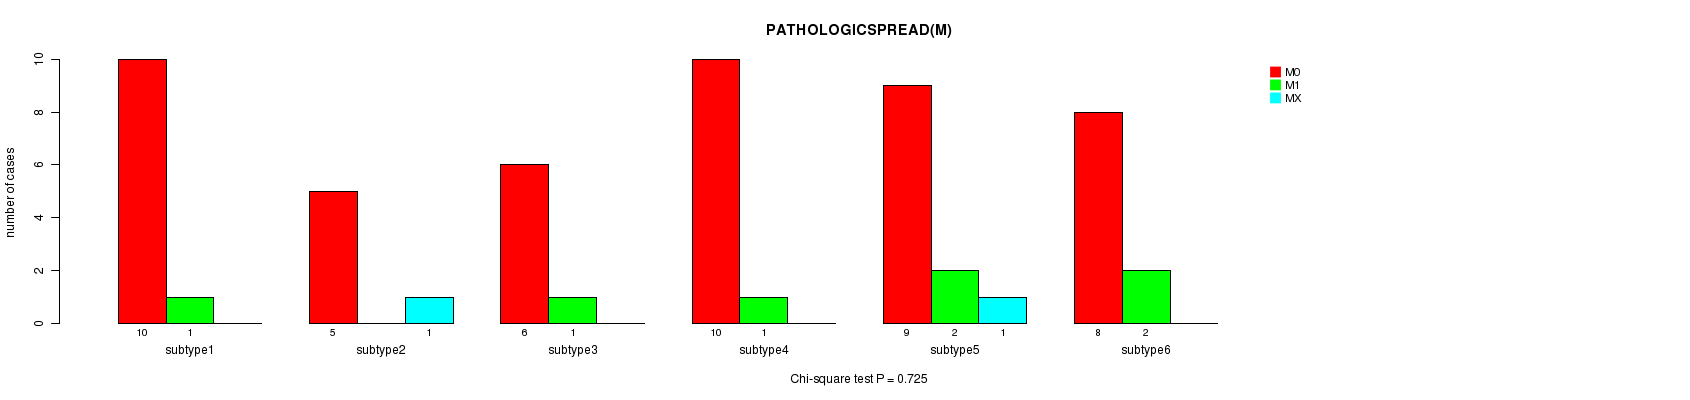
P value = 0.725 (Chi-square test)
Table S30. Clustering Approach #3: 'RNAseq CNMF subtypes' versus Clinical Feature #7: 'PATHOLOGICSPREAD(M)'
| nPatients | M0 | M1 | MX |
|---|---|---|---|
| ALL | 48 | 7 | 2 |
| subtype1 | 10 | 1 | 0 |
| subtype2 | 5 | 0 | 1 |
| subtype3 | 6 | 1 | 0 |
| subtype4 | 10 | 1 | 0 |
| subtype5 | 9 | 2 | 1 |
| subtype6 | 8 | 2 | 0 |
Figure S27. Get High-res Image Clustering Approach #3: 'RNAseq CNMF subtypes' versus Clinical Feature #7: 'PATHOLOGICSPREAD(M)'
P value = 0.746 (Chi-square test)
Table S31. Clustering Approach #3: 'RNAseq CNMF subtypes' versus Clinical Feature #8: 'TUMOR.STAGE'
| nPatients | I | II | III | IV |
|---|---|---|---|---|
| ALL | 7 | 4 | 10 | 11 |
| subtype1 | 0 | 1 | 2 | 3 |
| subtype2 | 2 | 0 | 2 | 0 |
| subtype3 | 1 | 0 | 1 | 1 |
| subtype4 | 1 | 1 | 2 | 1 |
| subtype5 | 1 | 2 | 1 | 2 |
| subtype6 | 2 | 0 | 2 | 4 |
Figure S28. Get High-res Image Clustering Approach #3: 'RNAseq CNMF subtypes' versus Clinical Feature #8: 'TUMOR.STAGE'
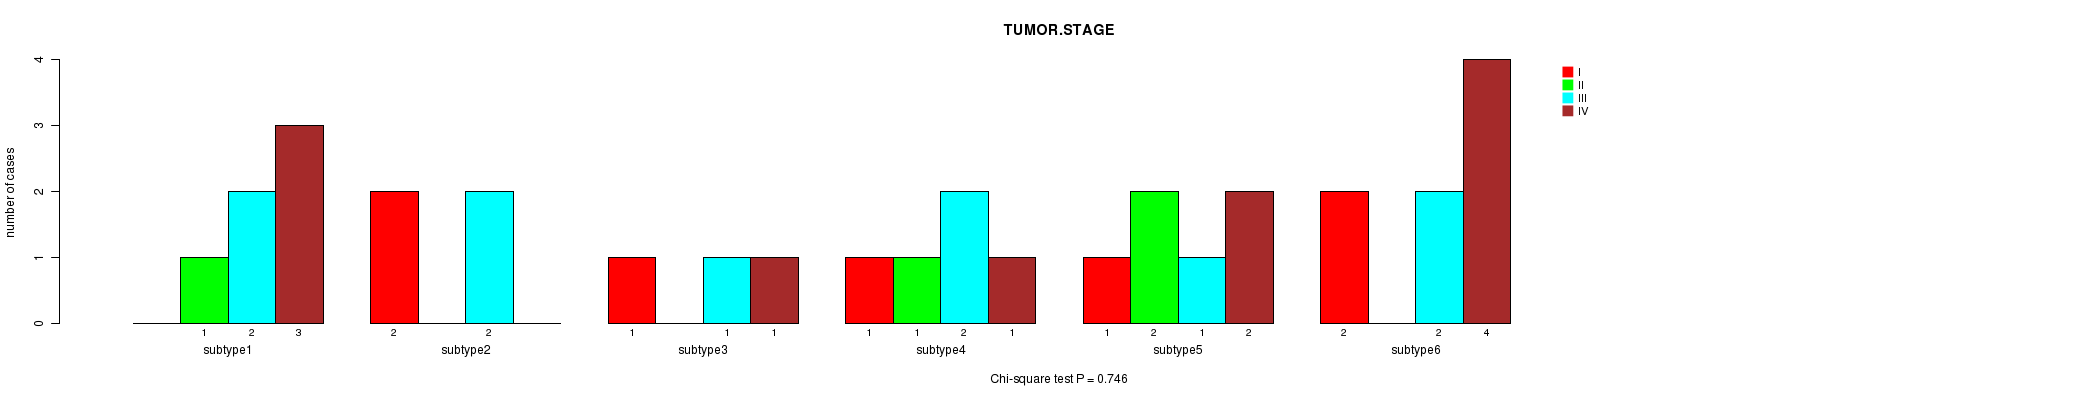
Table S32. Get Full Table Description of clustering approach #4: 'RNAseq cHierClus subtypes'
| Cluster Labels | 1 | 2 | 3 | 4 |
|---|---|---|---|---|
| Number of samples | 11 | 18 | 17 | 11 |
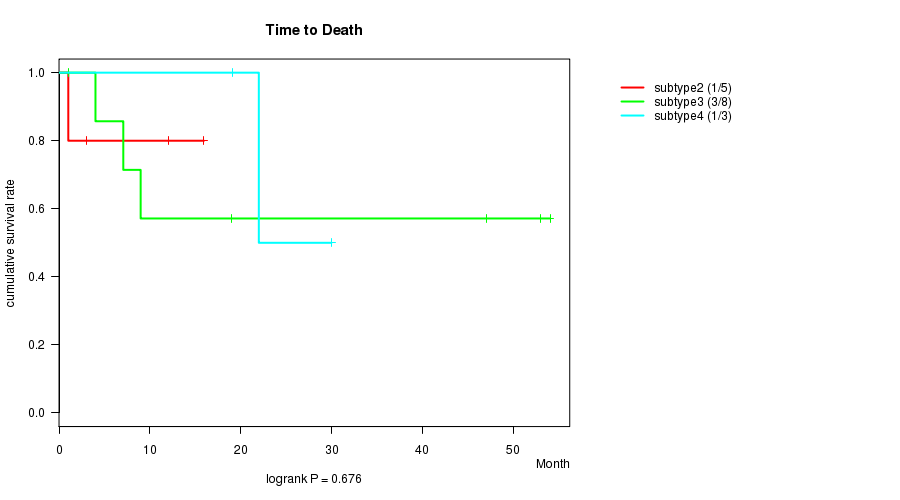
P value = 0.676 (logrank test)
Table S33. Clustering Approach #4: 'RNAseq cHierClus subtypes' versus Clinical Feature #1: 'Time to Death'
| nPatients | nDeath | Duration Range (Median), Month | |
|---|---|---|---|
| ALL | 18 | 5 | 1.0 - 54.0 (14.0) |
| subtype1 | 2 | 0 | 1.0 - 27.0 (14.0) |
| subtype2 | 5 | 1 | 1.0 - 15.9 (3.0) |
| subtype3 | 8 | 3 | 1.0 - 54.0 (14.0) |
| subtype4 | 3 | 1 | 19.1 - 30.0 (22.0) |
Figure S29. Get High-res Image Clustering Approach #4: 'RNAseq cHierClus subtypes' versus Clinical Feature #1: 'Time to Death'
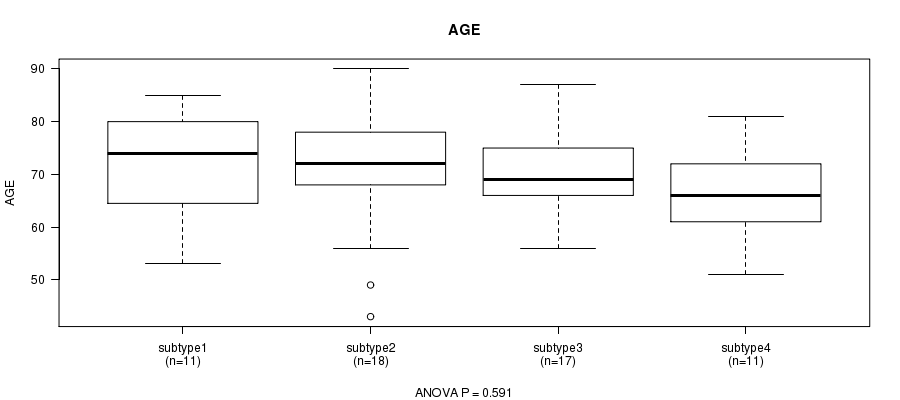
P value = 0.591 (ANOVA)
Table S34. Clustering Approach #4: 'RNAseq cHierClus subtypes' versus Clinical Feature #2: 'AGE'
| nPatients | Mean (Std.Dev) | |
|---|---|---|
| ALL | 57 | 69.5 (10.1) |
| subtype1 | 11 | 72.1 (10.9) |
| subtype2 | 18 | 70.1 (11.5) |
| subtype3 | 17 | 69.3 (8.7) |
| subtype4 | 11 | 66.2 (9.4) |
Figure S30. Get High-res Image Clustering Approach #4: 'RNAseq cHierClus subtypes' versus Clinical Feature #2: 'AGE'
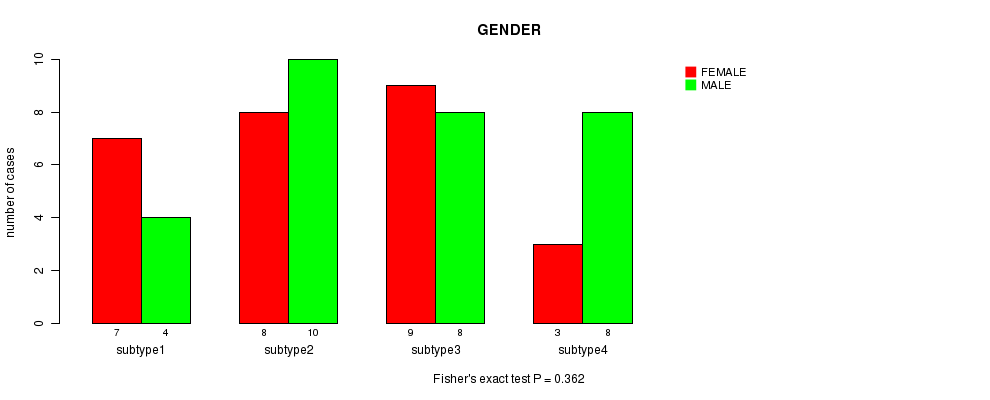
P value = 0.362 (Fisher's exact test)
Table S35. Clustering Approach #4: 'RNAseq cHierClus subtypes' versus Clinical Feature #3: 'GENDER'
| nPatients | FEMALE | MALE |
|---|---|---|
| ALL | 27 | 30 |
| subtype1 | 7 | 4 |
| subtype2 | 8 | 10 |
| subtype3 | 9 | 8 |
| subtype4 | 3 | 8 |
Figure S31. Get High-res Image Clustering Approach #4: 'RNAseq cHierClus subtypes' versus Clinical Feature #3: 'GENDER'
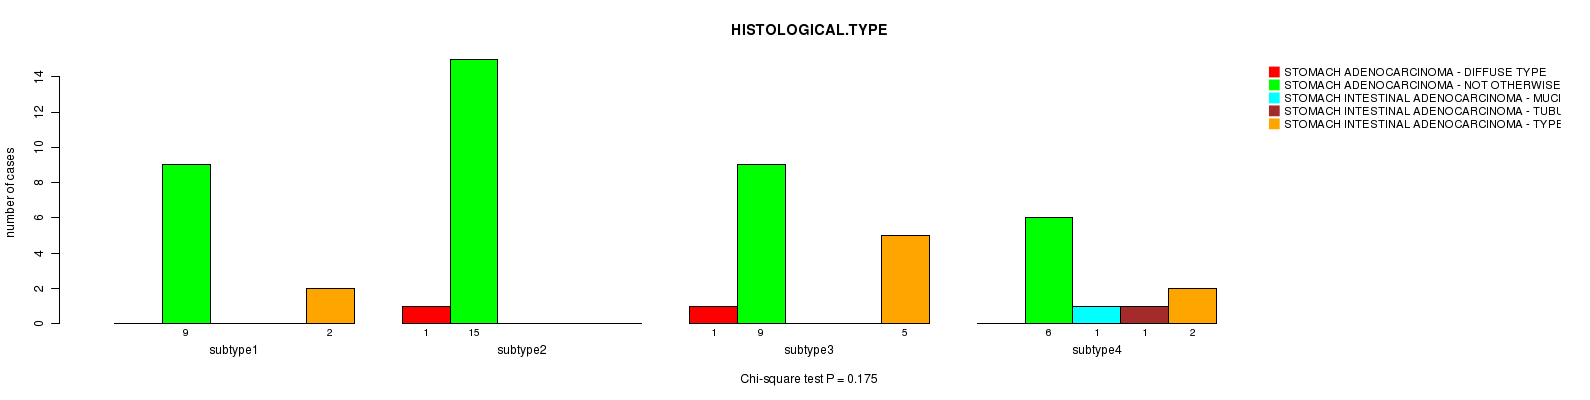
P value = 0.175 (Chi-square test)
Table S36. Clustering Approach #4: 'RNAseq cHierClus subtypes' versus Clinical Feature #4: 'HISTOLOGICAL.TYPE'
| nPatients | STOMACH ADENOCARCINOMA - DIFFUSE TYPE | STOMACH ADENOCARCINOMA - NOT OTHERWISE SPECIFIED (NOS) | STOMACH INTESTINAL ADENOCARCINOMA - MUCINOUS TYPE | STOMACH INTESTINAL ADENOCARCINOMA - TUBULAR TYPE | STOMACH INTESTINAL ADENOCARCINOMA - TYPE NOT OTHERWISE SPECIFIED (NOS) |
|---|---|---|---|---|---|
| ALL | 2 | 39 | 1 | 1 | 9 |
| subtype1 | 0 | 9 | 0 | 0 | 2 |
| subtype2 | 1 | 15 | 0 | 0 | 0 |
| subtype3 | 1 | 9 | 0 | 0 | 5 |
| subtype4 | 0 | 6 | 1 | 1 | 2 |
Figure S32. Get High-res Image Clustering Approach #4: 'RNAseq cHierClus subtypes' versus Clinical Feature #4: 'HISTOLOGICAL.TYPE'
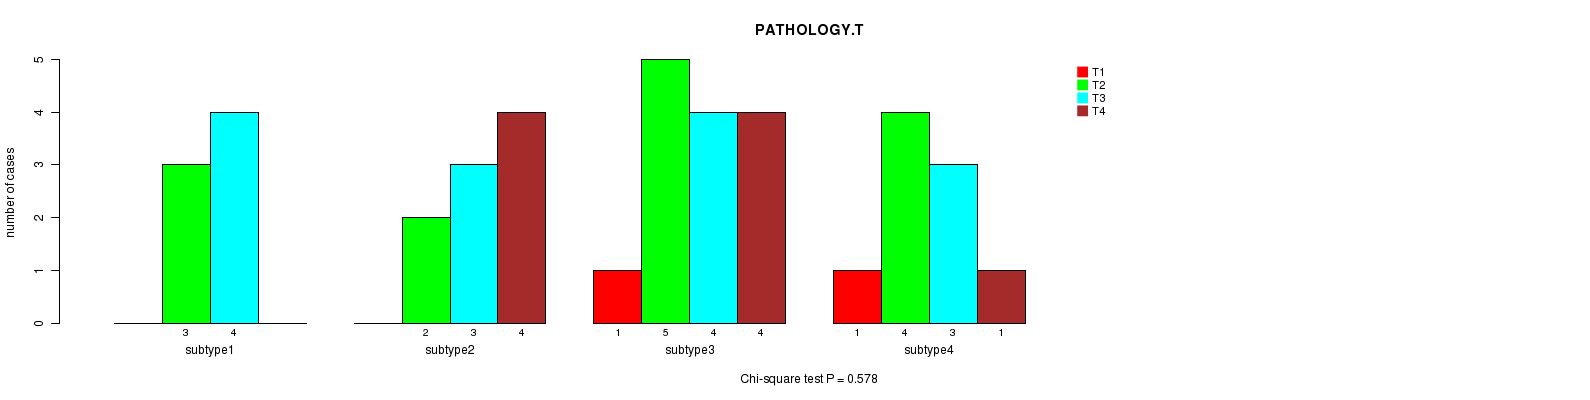
P value = 0.578 (Chi-square test)
Table S37. Clustering Approach #4: 'RNAseq cHierClus subtypes' versus Clinical Feature #5: 'PATHOLOGY.T'
| nPatients | T1 | T2 | T3 | T4 |
|---|---|---|---|---|
| ALL | 2 | 14 | 14 | 9 |
| subtype1 | 0 | 3 | 4 | 0 |
| subtype2 | 0 | 2 | 3 | 4 |
| subtype3 | 1 | 5 | 4 | 4 |
| subtype4 | 1 | 4 | 3 | 1 |
Figure S33. Get High-res Image Clustering Approach #4: 'RNAseq cHierClus subtypes' versus Clinical Feature #5: 'PATHOLOGY.T'
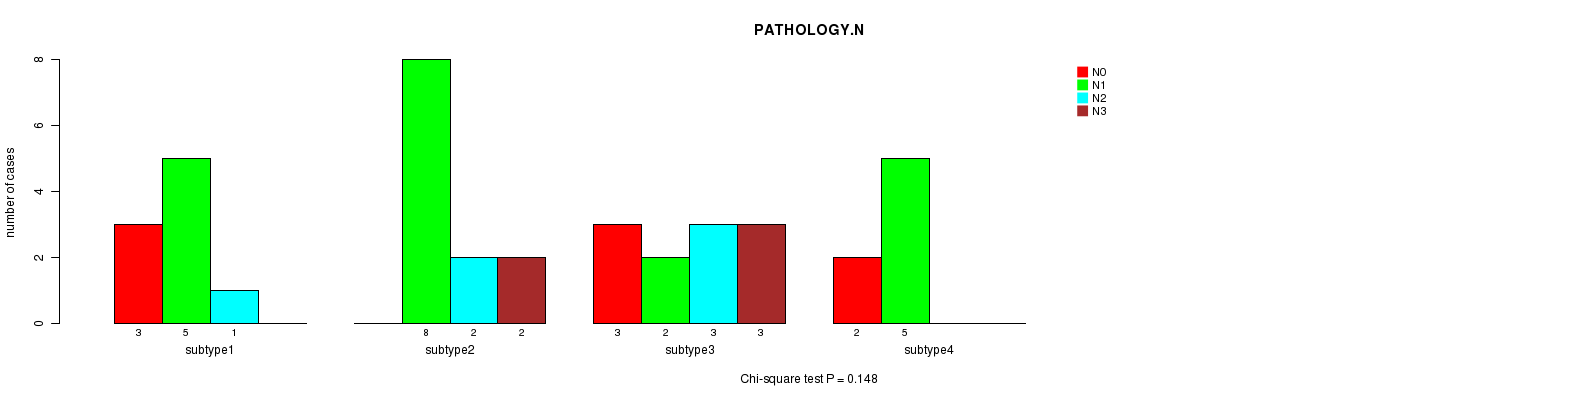
P value = 0.148 (Chi-square test)
Table S38. Clustering Approach #4: 'RNAseq cHierClus subtypes' versus Clinical Feature #6: 'PATHOLOGY.N'
| nPatients | N0 | N1 | N2 | N3 |
|---|---|---|---|---|
| ALL | 8 | 20 | 6 | 5 |
| subtype1 | 3 | 5 | 1 | 0 |
| subtype2 | 0 | 8 | 2 | 2 |
| subtype3 | 3 | 2 | 3 | 3 |
| subtype4 | 2 | 5 | 0 | 0 |
Figure S34. Get High-res Image Clustering Approach #4: 'RNAseq cHierClus subtypes' versus Clinical Feature #6: 'PATHOLOGY.N'
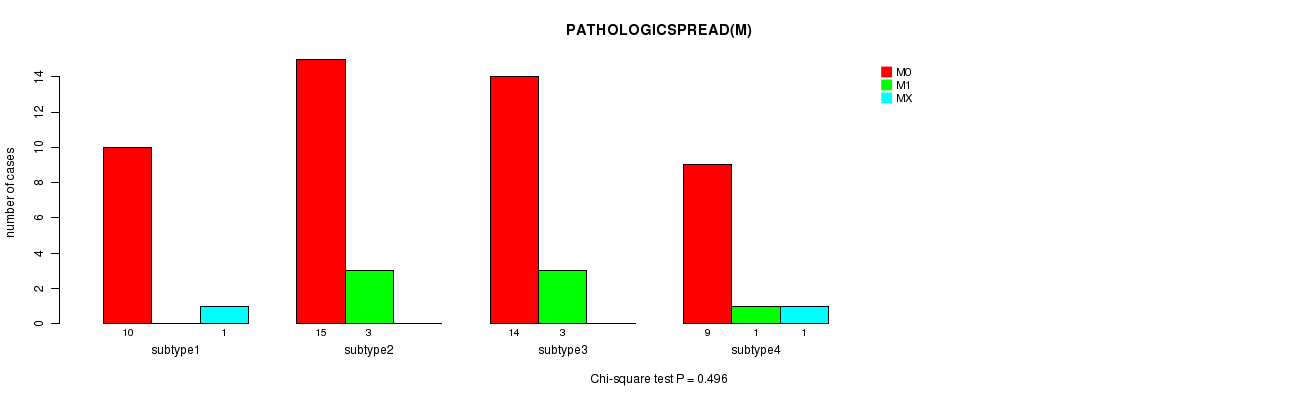
P value = 0.496 (Chi-square test)
Table S39. Clustering Approach #4: 'RNAseq cHierClus subtypes' versus Clinical Feature #7: 'PATHOLOGICSPREAD(M)'
| nPatients | M0 | M1 | MX |
|---|---|---|---|
| ALL | 48 | 7 | 2 |
| subtype1 | 10 | 0 | 1 |
| subtype2 | 15 | 3 | 0 |
| subtype3 | 14 | 3 | 0 |
| subtype4 | 9 | 1 | 1 |
Figure S35. Get High-res Image Clustering Approach #4: 'RNAseq cHierClus subtypes' versus Clinical Feature #7: 'PATHOLOGICSPREAD(M)'
P value = 0.0898 (Chi-square test)
Table S40. Clustering Approach #4: 'RNAseq cHierClus subtypes' versus Clinical Feature #8: 'TUMOR.STAGE'
| nPatients | I | II | III | IV |
|---|---|---|---|---|
| ALL | 7 | 4 | 10 | 11 |
| subtype1 | 3 | 0 | 3 | 0 |
| subtype2 | 0 | 2 | 2 | 5 |
| subtype3 | 2 | 0 | 4 | 5 |
| subtype4 | 2 | 2 | 1 | 1 |
Figure S36. Get High-res Image Clustering Approach #4: 'RNAseq cHierClus subtypes' versus Clinical Feature #8: 'TUMOR.STAGE'
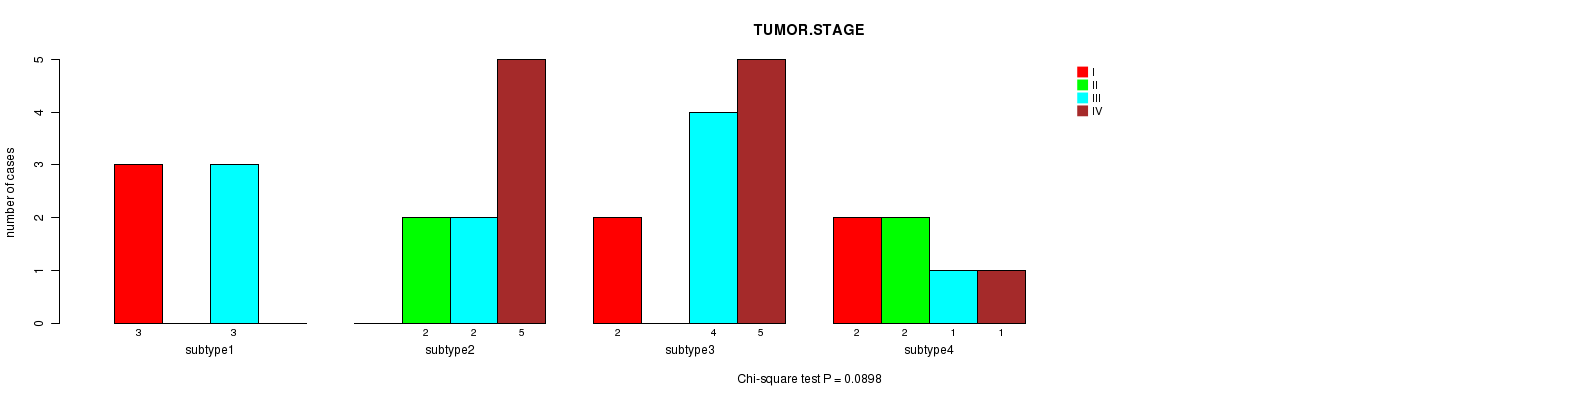
Table S41. Get Full Table Description of clustering approach #5: 'MIRseq CNMF subtypes'
| Cluster Labels | 1 | 2 | 3 | 4 | 5 |
|---|---|---|---|---|---|
| Number of samples | 29 | 43 | 24 | 24 | 30 |
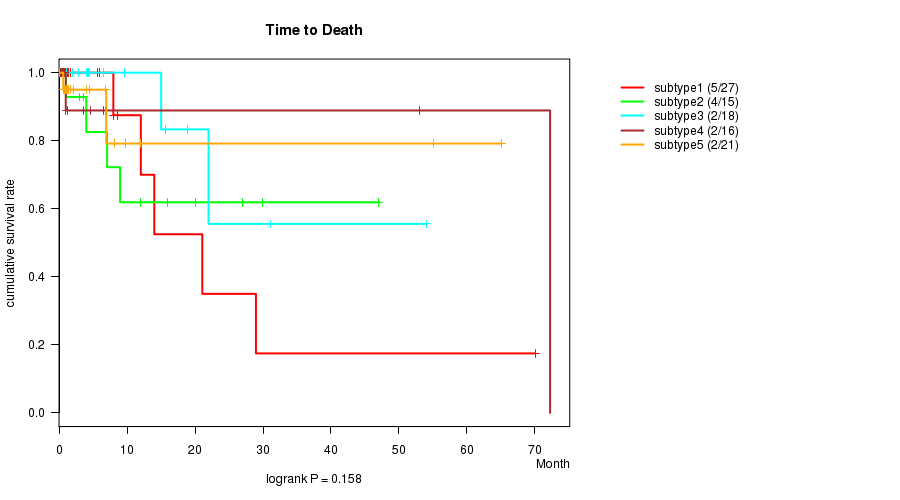
P value = 0.158 (logrank test)
Table S42. Clustering Approach #5: 'MIRseq CNMF subtypes' versus Clinical Feature #1: 'Time to Death'
| nPatients | nDeath | Duration Range (Median), Month | |
|---|---|---|---|
| ALL | 97 | 15 | 0.1 - 72.2 (3.0) |
| subtype1 | 27 | 5 | 0.3 - 70.1 (1.4) |
| subtype2 | 15 | 4 | 0.1 - 47.0 (7.1) |
| subtype3 | 18 | 2 | 0.3 - 54.0 (4.4) |
| subtype4 | 16 | 2 | 0.1 - 72.2 (1.0) |
| subtype5 | 21 | 2 | 0.1 - 65.1 (1.7) |
Figure S37. Get High-res Image Clustering Approach #5: 'MIRseq CNMF subtypes' versus Clinical Feature #1: 'Time to Death'
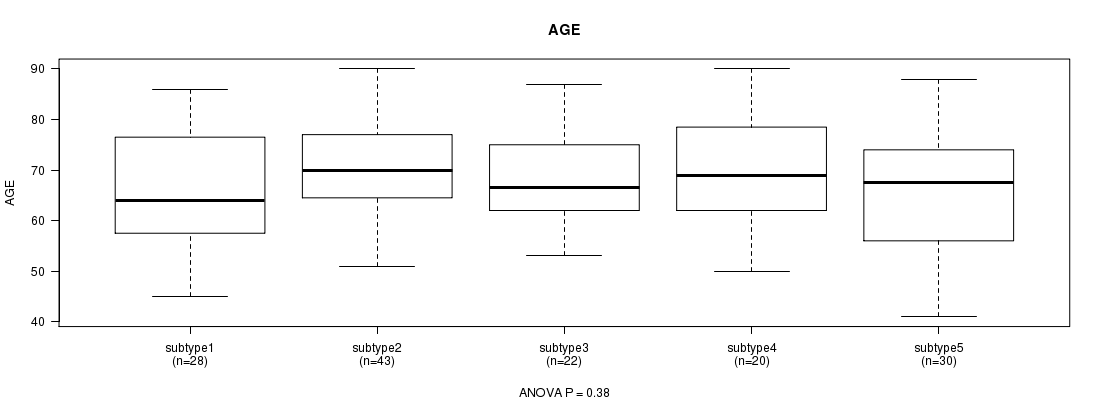
P value = 0.38 (ANOVA)
Table S43. Clustering Approach #5: 'MIRseq CNMF subtypes' versus Clinical Feature #2: 'AGE'
| nPatients | Mean (Std.Dev) | |
|---|---|---|
| ALL | 143 | 67.8 (10.7) |
| subtype1 | 28 | 65.8 (11.6) |
| subtype2 | 43 | 69.7 (9.4) |
| subtype3 | 22 | 67.8 (8.9) |
| subtype4 | 20 | 69.8 (11.2) |
| subtype5 | 30 | 65.6 (12.4) |
Figure S38. Get High-res Image Clustering Approach #5: 'MIRseq CNMF subtypes' versus Clinical Feature #2: 'AGE'
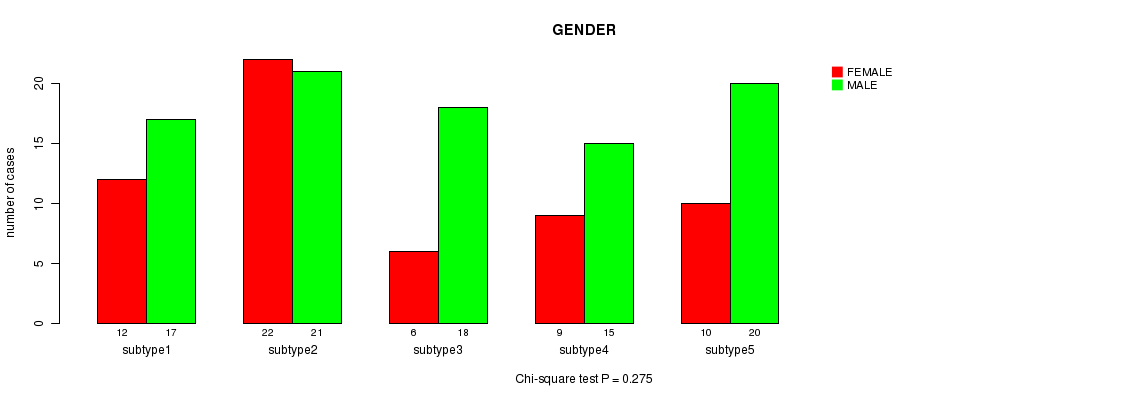
P value = 0.275 (Chi-square test)
Table S44. Clustering Approach #5: 'MIRseq CNMF subtypes' versus Clinical Feature #3: 'GENDER'
| nPatients | FEMALE | MALE |
|---|---|---|
| ALL | 59 | 91 |
| subtype1 | 12 | 17 |
| subtype2 | 22 | 21 |
| subtype3 | 6 | 18 |
| subtype4 | 9 | 15 |
| subtype5 | 10 | 20 |
Figure S39. Get High-res Image Clustering Approach #5: 'MIRseq CNMF subtypes' versus Clinical Feature #3: 'GENDER'
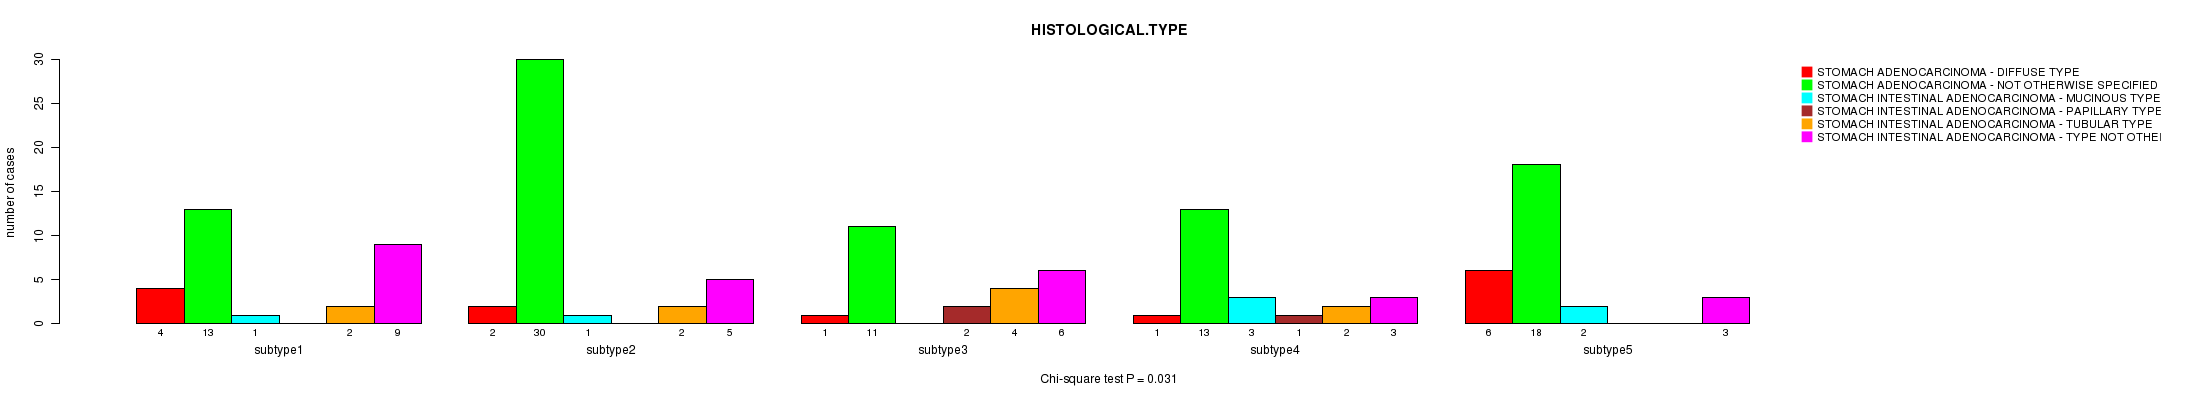
P value = 0.031 (Chi-square test)
Table S45. Clustering Approach #5: 'MIRseq CNMF subtypes' versus Clinical Feature #4: 'HISTOLOGICAL.TYPE'
| nPatients | STOMACH ADENOCARCINOMA - DIFFUSE TYPE | STOMACH ADENOCARCINOMA - NOT OTHERWISE SPECIFIED (NOS) | STOMACH INTESTINAL ADENOCARCINOMA - MUCINOUS TYPE | STOMACH INTESTINAL ADENOCARCINOMA - PAPILLARY TYPE | STOMACH INTESTINAL ADENOCARCINOMA - TUBULAR TYPE | STOMACH INTESTINAL ADENOCARCINOMA - TYPE NOT OTHERWISE SPECIFIED (NOS) |
|---|---|---|---|---|---|---|
| ALL | 14 | 85 | 7 | 3 | 10 | 26 |
| subtype1 | 4 | 13 | 1 | 0 | 2 | 9 |
| subtype2 | 2 | 30 | 1 | 0 | 2 | 5 |
| subtype3 | 1 | 11 | 0 | 2 | 4 | 6 |
| subtype4 | 1 | 13 | 3 | 1 | 2 | 3 |
| subtype5 | 6 | 18 | 2 | 0 | 0 | 3 |
Figure S40. Get High-res Image Clustering Approach #5: 'MIRseq CNMF subtypes' versus Clinical Feature #4: 'HISTOLOGICAL.TYPE'
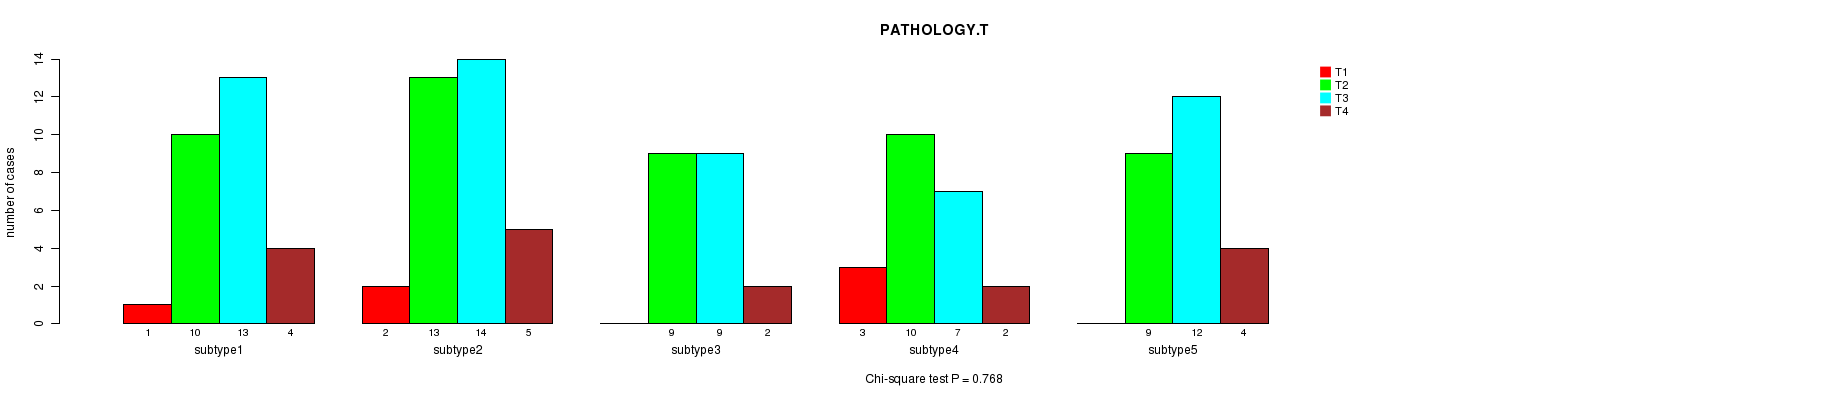
P value = 0.768 (Chi-square test)
Table S46. Clustering Approach #5: 'MIRseq CNMF subtypes' versus Clinical Feature #5: 'PATHOLOGY.T'
| nPatients | T1 | T2 | T3 | T4 |
|---|---|---|---|---|
| ALL | 6 | 51 | 55 | 17 |
| subtype1 | 1 | 10 | 13 | 4 |
| subtype2 | 2 | 13 | 14 | 5 |
| subtype3 | 0 | 9 | 9 | 2 |
| subtype4 | 3 | 10 | 7 | 2 |
| subtype5 | 0 | 9 | 12 | 4 |
Figure S41. Get High-res Image Clustering Approach #5: 'MIRseq CNMF subtypes' versus Clinical Feature #5: 'PATHOLOGY.T'
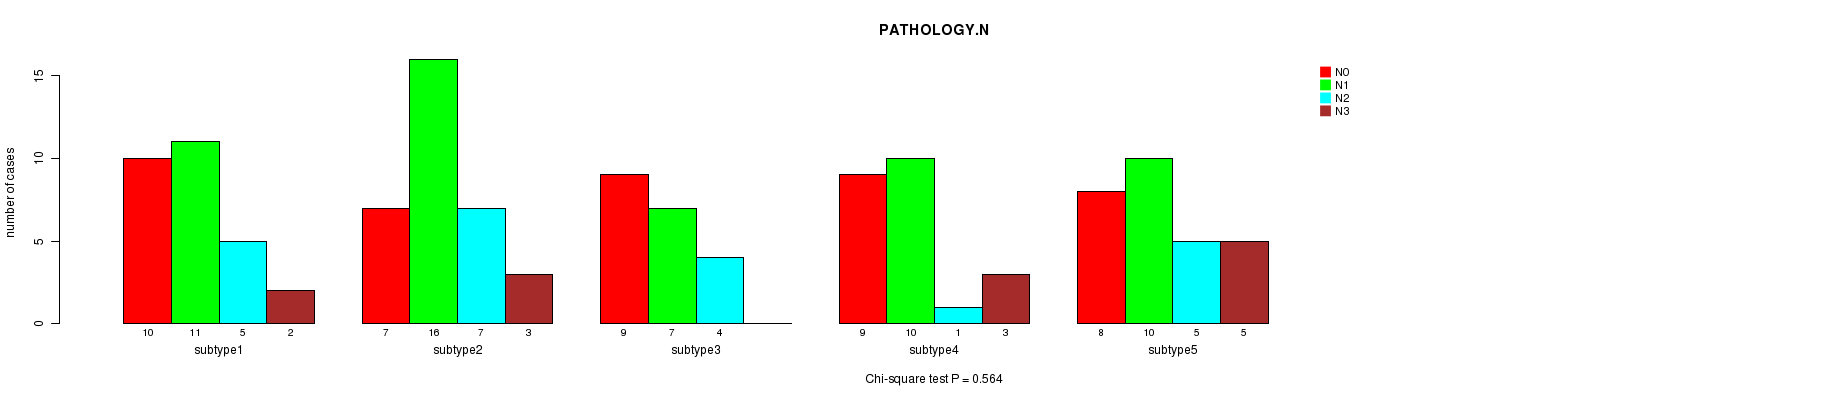
P value = 0.564 (Chi-square test)
Table S47. Clustering Approach #5: 'MIRseq CNMF subtypes' versus Clinical Feature #6: 'PATHOLOGY.N'
| nPatients | N0 | N1 | N2 | N3 |
|---|---|---|---|---|
| ALL | 43 | 54 | 22 | 13 |
| subtype1 | 10 | 11 | 5 | 2 |
| subtype2 | 7 | 16 | 7 | 3 |
| subtype3 | 9 | 7 | 4 | 0 |
| subtype4 | 9 | 10 | 1 | 3 |
| subtype5 | 8 | 10 | 5 | 5 |
Figure S42. Get High-res Image Clustering Approach #5: 'MIRseq CNMF subtypes' versus Clinical Feature #6: 'PATHOLOGY.N'
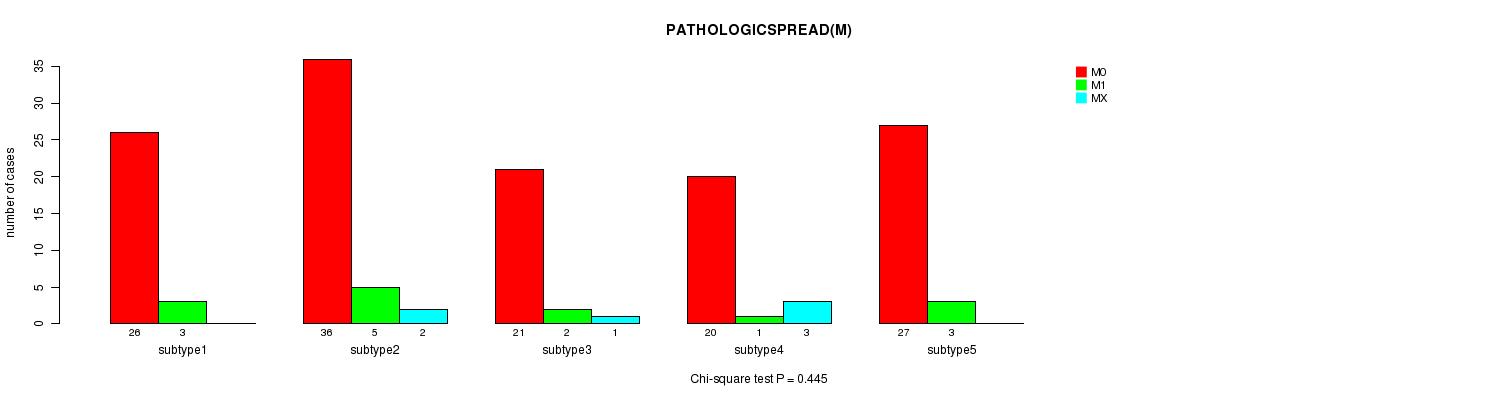
P value = 0.445 (Chi-square test)
Table S48. Clustering Approach #5: 'MIRseq CNMF subtypes' versus Clinical Feature #7: 'PATHOLOGICSPREAD(M)'
| nPatients | M0 | M1 | MX |
|---|---|---|---|
| ALL | 130 | 14 | 6 |
| subtype1 | 26 | 3 | 0 |
| subtype2 | 36 | 5 | 2 |
| subtype3 | 21 | 2 | 1 |
| subtype4 | 20 | 1 | 3 |
| subtype5 | 27 | 3 | 0 |
Figure S43. Get High-res Image Clustering Approach #5: 'MIRseq CNMF subtypes' versus Clinical Feature #7: 'PATHOLOGICSPREAD(M)'
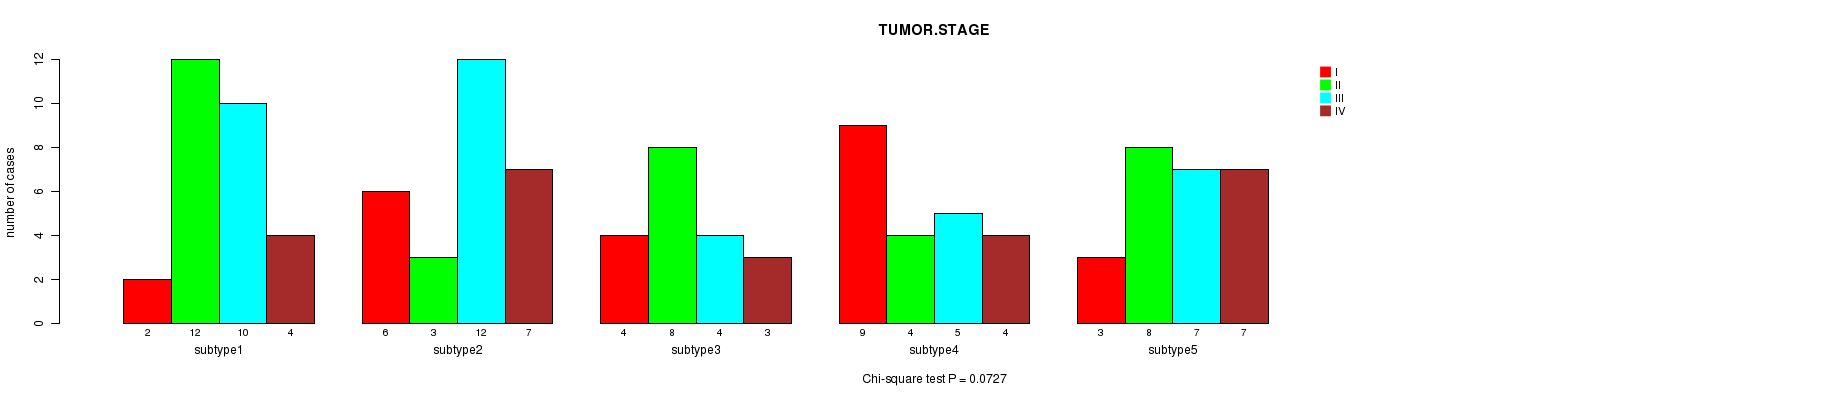
P value = 0.0727 (Chi-square test)
Table S49. Clustering Approach #5: 'MIRseq CNMF subtypes' versus Clinical Feature #8: 'TUMOR.STAGE'
| nPatients | I | II | III | IV |
|---|---|---|---|---|
| ALL | 24 | 35 | 38 | 25 |
| subtype1 | 2 | 12 | 10 | 4 |
| subtype2 | 6 | 3 | 12 | 7 |
| subtype3 | 4 | 8 | 4 | 3 |
| subtype4 | 9 | 4 | 5 | 4 |
| subtype5 | 3 | 8 | 7 | 7 |
Figure S44. Get High-res Image Clustering Approach #5: 'MIRseq CNMF subtypes' versus Clinical Feature #8: 'TUMOR.STAGE'
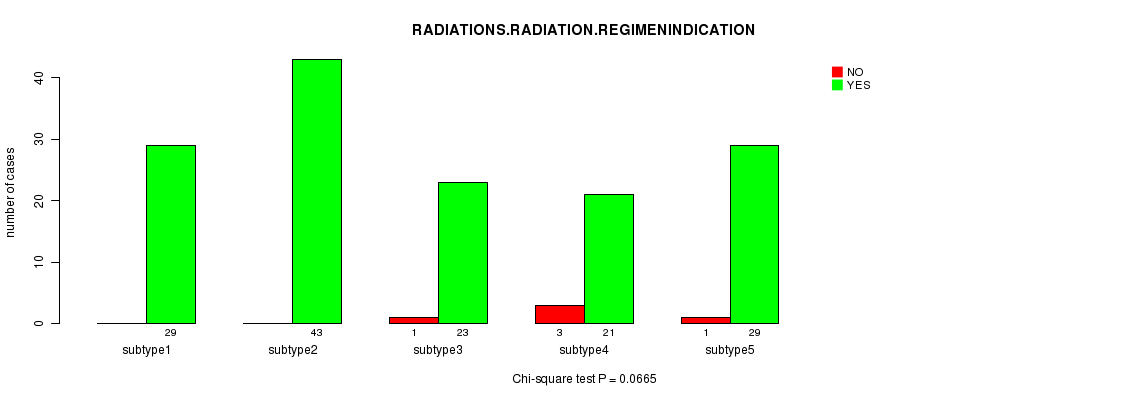
P value = 0.0665 (Chi-square test)
Table S50. Clustering Approach #5: 'MIRseq CNMF subtypes' versus Clinical Feature #9: 'RADIATIONS.RADIATION.REGIMENINDICATION'
| nPatients | NO | YES |
|---|---|---|
| ALL | 5 | 145 |
| subtype1 | 0 | 29 |
| subtype2 | 0 | 43 |
| subtype3 | 1 | 23 |
| subtype4 | 3 | 21 |
| subtype5 | 1 | 29 |
Figure S45. Get High-res Image Clustering Approach #5: 'MIRseq CNMF subtypes' versus Clinical Feature #9: 'RADIATIONS.RADIATION.REGIMENINDICATION'
P value = 0.23 (Chi-square test)
Table S51. Clustering Approach #5: 'MIRseq CNMF subtypes' versus Clinical Feature #10: 'NEOADJUVANT.THERAPY'
| nPatients | NO | YES |
|---|---|---|
| ALL | 11 | 139 |
| subtype1 | 2 | 27 |
| subtype2 | 0 | 43 |
| subtype3 | 3 | 21 |
| subtype4 | 3 | 21 |
| subtype5 | 3 | 27 |
Figure S46. Get High-res Image Clustering Approach #5: 'MIRseq CNMF subtypes' versus Clinical Feature #10: 'NEOADJUVANT.THERAPY'
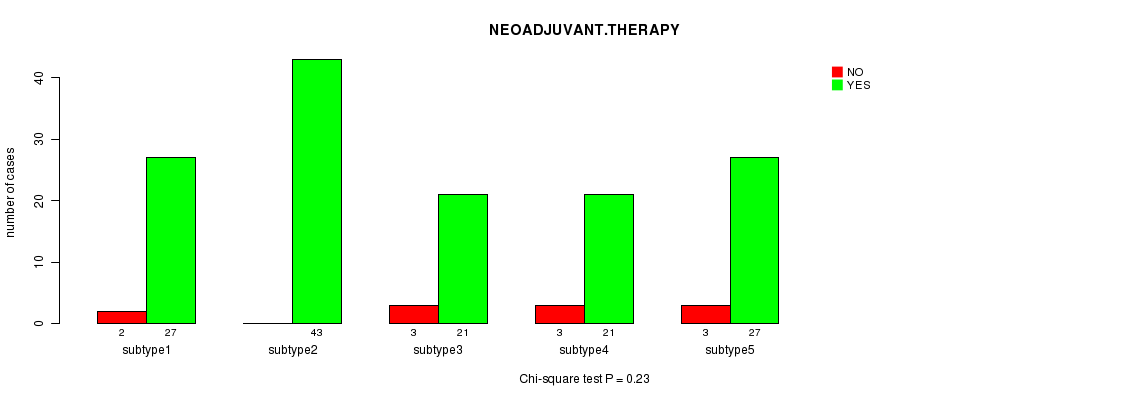
Table S52. Get Full Table Description of clustering approach #6: 'MIRseq cHierClus subtypes'
| Cluster Labels | 1 | 2 | 3 |
|---|---|---|---|
| Number of samples | 52 | 55 | 43 |
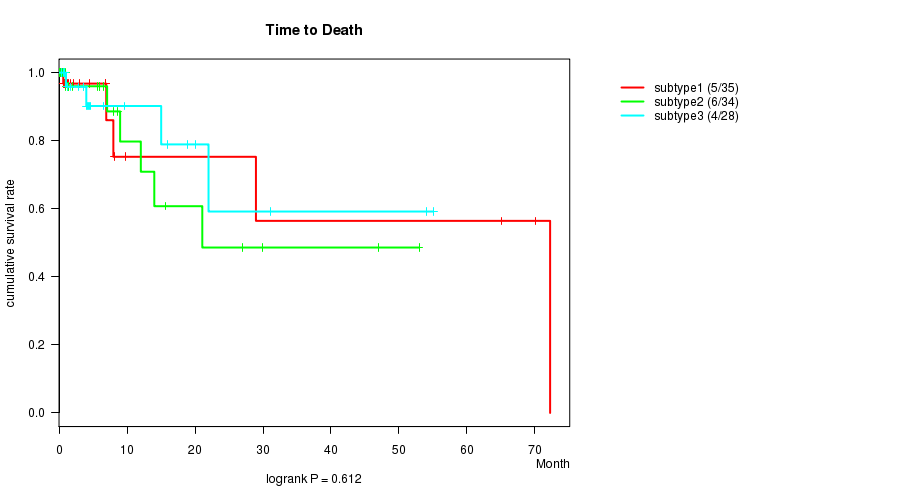
P value = 0.612 (logrank test)
Table S53. Clustering Approach #6: 'MIRseq cHierClus subtypes' versus Clinical Feature #1: 'Time to Death'
| nPatients | nDeath | Duration Range (Median), Month | |
|---|---|---|---|
| ALL | 97 | 15 | 0.1 - 72.2 (3.0) |
| subtype1 | 35 | 5 | 0.1 - 72.2 (1.1) |
| subtype2 | 34 | 6 | 0.1 - 53.0 (3.8) |
| subtype3 | 28 | 4 | 0.3 - 55.0 (4.1) |
Figure S47. Get High-res Image Clustering Approach #6: 'MIRseq cHierClus subtypes' versus Clinical Feature #1: 'Time to Death'
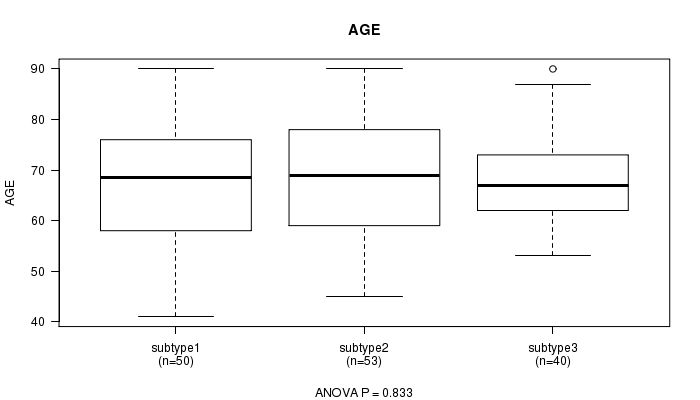
P value = 0.833 (ANOVA)
Table S54. Clustering Approach #6: 'MIRseq cHierClus subtypes' versus Clinical Feature #2: 'AGE'
| nPatients | Mean (Std.Dev) | |
|---|---|---|
| ALL | 143 | 67.8 (10.7) |
| subtype1 | 50 | 67.1 (12.3) |
| subtype2 | 53 | 68.4 (10.6) |
| subtype3 | 40 | 67.9 (8.8) |
Figure S48. Get High-res Image Clustering Approach #6: 'MIRseq cHierClus subtypes' versus Clinical Feature #2: 'AGE'
P value = 0.514 (Fisher's exact test)
Table S55. Clustering Approach #6: 'MIRseq cHierClus subtypes' versus Clinical Feature #3: 'GENDER'
| nPatients | FEMALE | MALE |
|---|---|---|
| ALL | 59 | 91 |
| subtype1 | 18 | 34 |
| subtype2 | 25 | 30 |
| subtype3 | 16 | 27 |
Figure S49. Get High-res Image Clustering Approach #6: 'MIRseq cHierClus subtypes' versus Clinical Feature #3: 'GENDER'
P value = 0.00316 (Chi-square test)
Table S56. Clustering Approach #6: 'MIRseq cHierClus subtypes' versus Clinical Feature #4: 'HISTOLOGICAL.TYPE'
| nPatients | STOMACH ADENOCARCINOMA - DIFFUSE TYPE | STOMACH ADENOCARCINOMA - NOT OTHERWISE SPECIFIED (NOS) | STOMACH INTESTINAL ADENOCARCINOMA - MUCINOUS TYPE | STOMACH INTESTINAL ADENOCARCINOMA - PAPILLARY TYPE | STOMACH INTESTINAL ADENOCARCINOMA - TUBULAR TYPE | STOMACH INTESTINAL ADENOCARCINOMA - TYPE NOT OTHERWISE SPECIFIED (NOS) |
|---|---|---|---|---|---|---|
| ALL | 14 | 85 | 7 | 3 | 10 | 26 |
| subtype1 | 6 | 33 | 4 | 1 | 0 | 6 |
| subtype2 | 6 | 32 | 2 | 0 | 1 | 11 |
| subtype3 | 2 | 20 | 1 | 2 | 9 | 9 |
Figure S50. Get High-res Image Clustering Approach #6: 'MIRseq cHierClus subtypes' versus Clinical Feature #4: 'HISTOLOGICAL.TYPE'
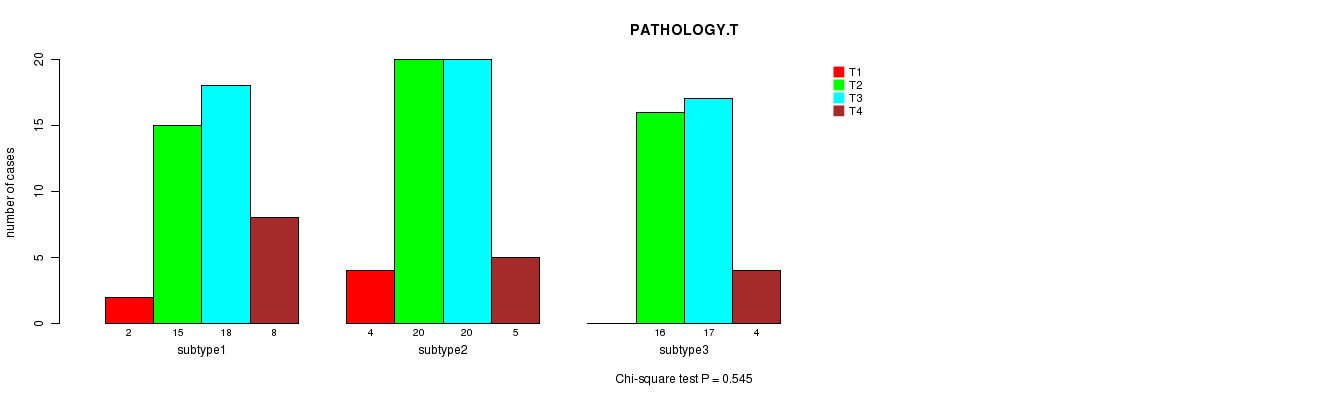
P value = 0.545 (Chi-square test)
Table S57. Clustering Approach #6: 'MIRseq cHierClus subtypes' versus Clinical Feature #5: 'PATHOLOGY.T'
| nPatients | T1 | T2 | T3 | T4 |
|---|---|---|---|---|
| ALL | 6 | 51 | 55 | 17 |
| subtype1 | 2 | 15 | 18 | 8 |
| subtype2 | 4 | 20 | 20 | 5 |
| subtype3 | 0 | 16 | 17 | 4 |
Figure S51. Get High-res Image Clustering Approach #6: 'MIRseq cHierClus subtypes' versus Clinical Feature #5: 'PATHOLOGY.T'
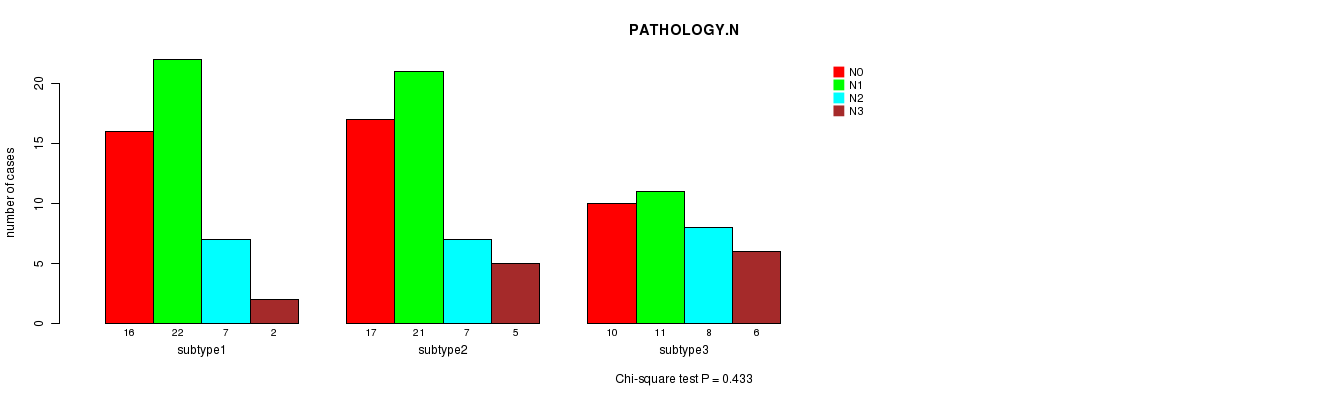
P value = 0.433 (Chi-square test)
Table S58. Clustering Approach #6: 'MIRseq cHierClus subtypes' versus Clinical Feature #6: 'PATHOLOGY.N'
| nPatients | N0 | N1 | N2 | N3 |
|---|---|---|---|---|
| ALL | 43 | 54 | 22 | 13 |
| subtype1 | 16 | 22 | 7 | 2 |
| subtype2 | 17 | 21 | 7 | 5 |
| subtype3 | 10 | 11 | 8 | 6 |
Figure S52. Get High-res Image Clustering Approach #6: 'MIRseq cHierClus subtypes' versus Clinical Feature #6: 'PATHOLOGY.N'
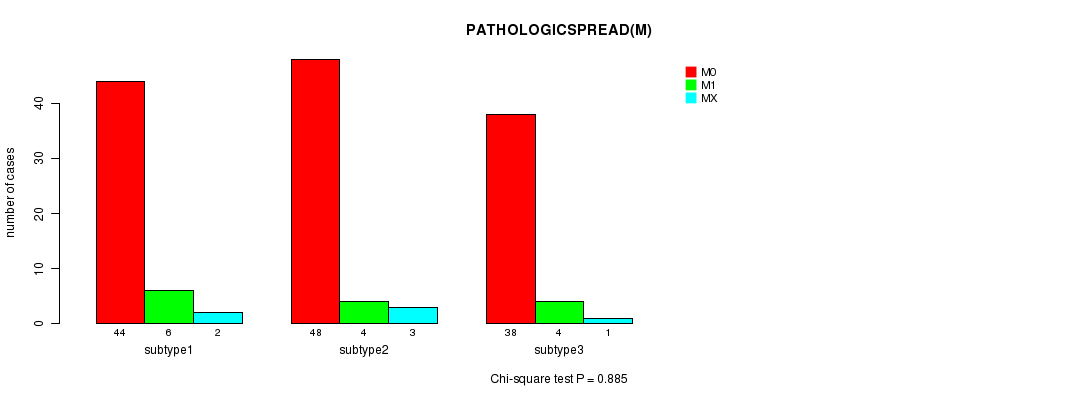
P value = 0.885 (Chi-square test)
Table S59. Clustering Approach #6: 'MIRseq cHierClus subtypes' versus Clinical Feature #7: 'PATHOLOGICSPREAD(M)'
| nPatients | M0 | M1 | MX |
|---|---|---|---|
| ALL | 130 | 14 | 6 |
| subtype1 | 44 | 6 | 2 |
| subtype2 | 48 | 4 | 3 |
| subtype3 | 38 | 4 | 1 |
Figure S53. Get High-res Image Clustering Approach #6: 'MIRseq cHierClus subtypes' versus Clinical Feature #7: 'PATHOLOGICSPREAD(M)'
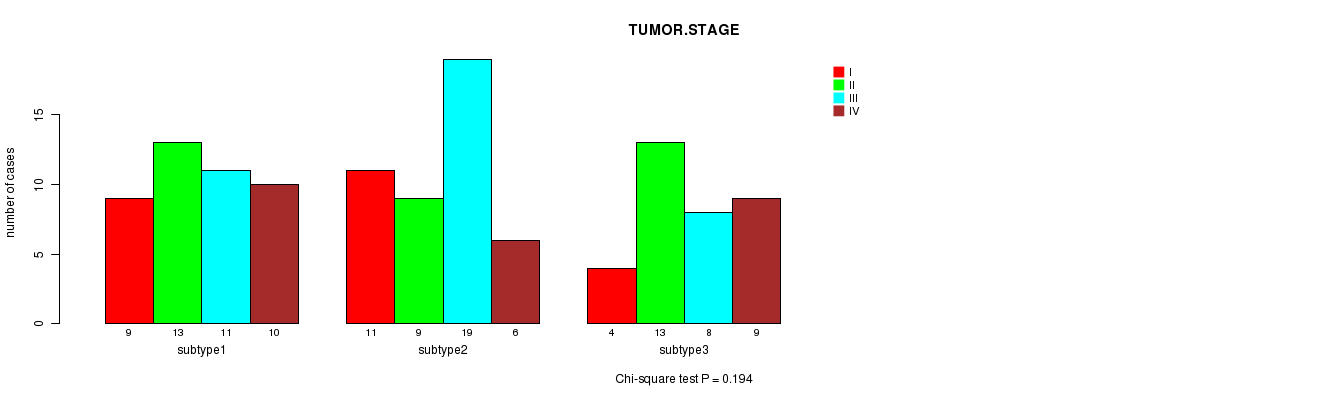
P value = 0.194 (Chi-square test)
Table S60. Clustering Approach #6: 'MIRseq cHierClus subtypes' versus Clinical Feature #8: 'TUMOR.STAGE'
| nPatients | I | II | III | IV |
|---|---|---|---|---|
| ALL | 24 | 35 | 38 | 25 |
| subtype1 | 9 | 13 | 11 | 10 |
| subtype2 | 11 | 9 | 19 | 6 |
| subtype3 | 4 | 13 | 8 | 9 |
Figure S54. Get High-res Image Clustering Approach #6: 'MIRseq cHierClus subtypes' versus Clinical Feature #8: 'TUMOR.STAGE'
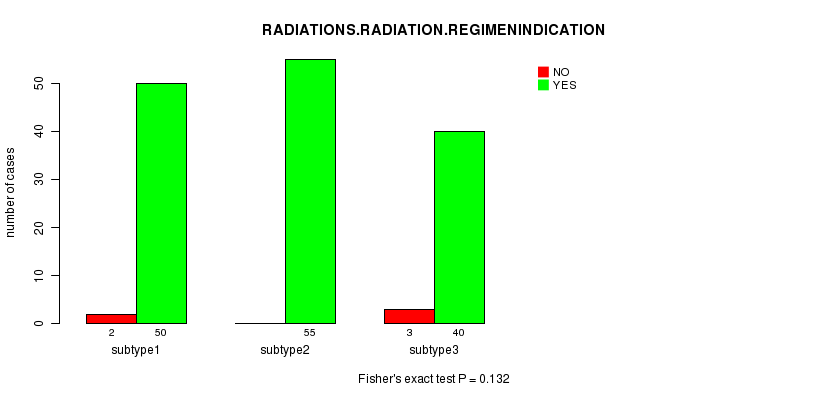
P value = 0.132 (Fisher's exact test)
Table S61. Clustering Approach #6: 'MIRseq cHierClus subtypes' versus Clinical Feature #9: 'RADIATIONS.RADIATION.REGIMENINDICATION'
| nPatients | NO | YES |
|---|---|---|
| ALL | 5 | 145 |
| subtype1 | 2 | 50 |
| subtype2 | 0 | 55 |
| subtype3 | 3 | 40 |
Figure S55. Get High-res Image Clustering Approach #6: 'MIRseq cHierClus subtypes' versus Clinical Feature #9: 'RADIATIONS.RADIATION.REGIMENINDICATION'
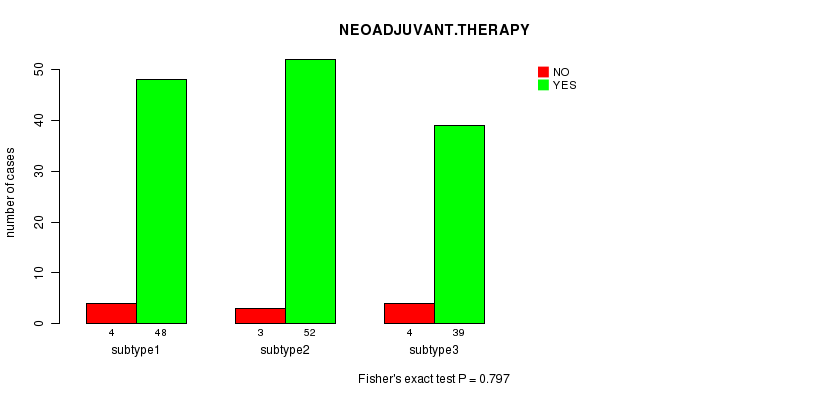
P value = 0.797 (Fisher's exact test)
Table S62. Clustering Approach #6: 'MIRseq cHierClus subtypes' versus Clinical Feature #10: 'NEOADJUVANT.THERAPY'
| nPatients | NO | YES |
|---|---|---|
| ALL | 11 | 139 |
| subtype1 | 4 | 48 |
| subtype2 | 3 | 52 |
| subtype3 | 4 | 39 |
Figure S56. Get High-res Image Clustering Approach #6: 'MIRseq cHierClus subtypes' versus Clinical Feature #10: 'NEOADJUVANT.THERAPY'
-
Cluster data file = STAD.mergedcluster.txt
-
Clinical data file = STAD.clin.merged.picked.txt
-
Number of patients = 159
-
Number of clustering approaches = 6
-
Number of selected clinical features = 10
-
Exclude small clusters that include fewer than K patients, K = 3
consensus non-negative matrix factorization clustering approach (Brunet et al. 2004)
Resampling-based clustering method (Monti et al. 2003)
For survival clinical features, the Kaplan-Meier survival curves of tumors with and without gene mutations were plotted and the statistical significance P values were estimated by logrank test (Bland and Altman 2004) using the 'survdiff' function in R
For continuous numerical clinical features, one-way analysis of variance (Howell 2002) was applied to compare the clinical values between tumor subtypes using 'anova' function in R
For multi-class clinical features (nominal or ordinal), Chi-square tests (Greenwood and Nikulin 1996) were used to estimate the P values using the 'chisq.test' function in R
For binary clinical features, two-tailed Fisher's exact tests (Fisher 1922) were used to estimate the P values using the 'fisher.test' function in R
This is an experimental feature. The full results of the analysis summarized in this report can be downloaded from the TCGA Data Coordination Center.