This report serves to describe the mutational landscape and properties of a given individual set, as well as rank genes and genesets according to mutational significance. MutSig v2.0 was used to generate the results found in this report.
-
Working with individual set: STAD
-
Number of patients in set: 133
The input for this pipeline is a set of individuals with the following files associated for each:
-
An annotated .maf file describing the mutations called for the respective individual, and their properties.
-
A .wig file that contains information about the coverage of the sample.
-
MAF used for this analysis:STAD.final_analysis_set.maf
-
Significantly mutated genes (q ≤ 0.1): 56
-
Mutations seen in COSMIC: 342
-
Significantly mutated genes in COSMIC territory: 22
-
Genes with clustered mutations (≤ 3 aa apart): 1311
-
Significantly mutated genesets: 12
-
Significantly mutated genesets: (excluding sig. mutated genes):0
-
Read 133 MAFs of type "Broad"
-
Total number of mutations in input MAFs: 267713
-
After removing 171098 noncoding mutations: 96615
-
After collapsing adjacent/redundant mutations: 77270
-
Number of mutations before filtering: 77270
-
After removing 396 mutations outside gene set: 76874
-
After removing 95 mutations outside category set: 76779
-
After removing 2 "impossible" mutations in
-
gene-patient-category bins of zero coverage: 76777
Table 1. Get Full Table Table representing breakdown of mutations by type.
| type | count |
|---|---|
| Frame_Shift_Del | 2059 |
| Frame_Shift_Ins | 306 |
| In_Frame_Del | 141 |
| In_Frame_Ins | 18 |
| Missense_Mutation | 49582 |
| Nonsense_Mutation | 2293 |
| Nonstop_Mutation | 52 |
| Silent | 21076 |
| Splice_Site | 1222 |
| Translation_Start_Site | 30 |
| Total | 76779 |
Table 2. Get Full Table A breakdown of mutation rates per category discovered for this individual set.
| category | n | N | rate | rate_per_mb | relative_rate | exp_ns_s_ratio |
|---|---|---|---|---|---|---|
| *CpG->T | 17232 | 213212487 | 0.000081 | 81 | 5.7 | 2.1 |
| *Np(A/C/T)->transit | 16836 | 3086012671 | 5.5e-06 | 5.5 | 0.38 | 2 |
| *ApG->G | 2333 | 597942472 | 3.9e-06 | 3.9 | 0.27 | 2.1 |
| transver | 13197 | 3897167630 | 3.4e-06 | 3.4 | 0.24 | 5 |
| indel+null | 6013 | 3897167630 | 1.5e-06 | 1.5 | 0.11 | NaN |
| double_null | 91 | 3897167630 | 2.3e-08 | 0.023 | 0.0016 | NaN |
| Total | 55702 | 3897167630 | 0.000014 | 14 | 1 | 3.5 |
The x axis represents the samples. The y axis represents the exons, one row per exon, and they are sorted by average coverage across samples. For exons with exactly the same average coverage, they are sorted next by the %GC of the exon. (The secondary sort is especially useful for the zero-coverage exons at the bottom).
Figure 1.
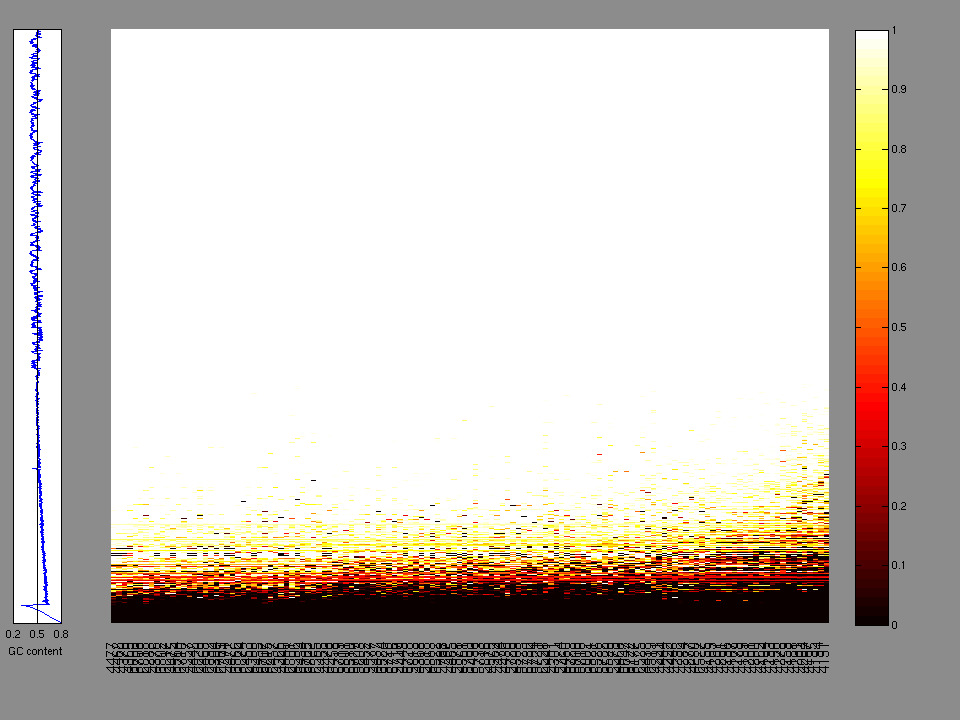
Figure 2. Patients counts and rates file used to generate this plot: STAD.patients.counts_and_rates.txt
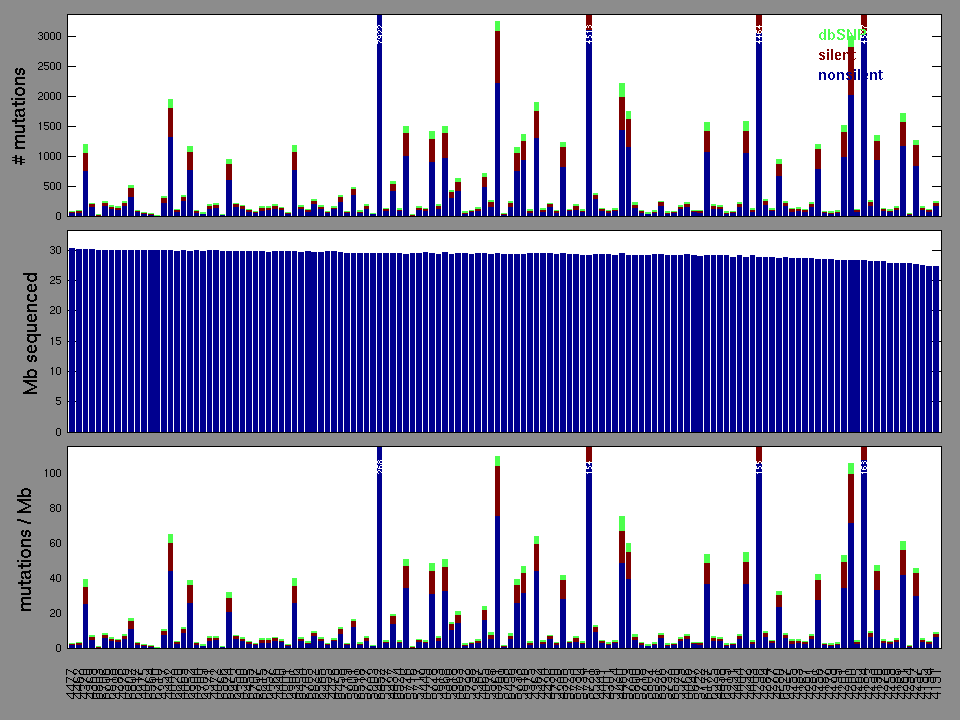
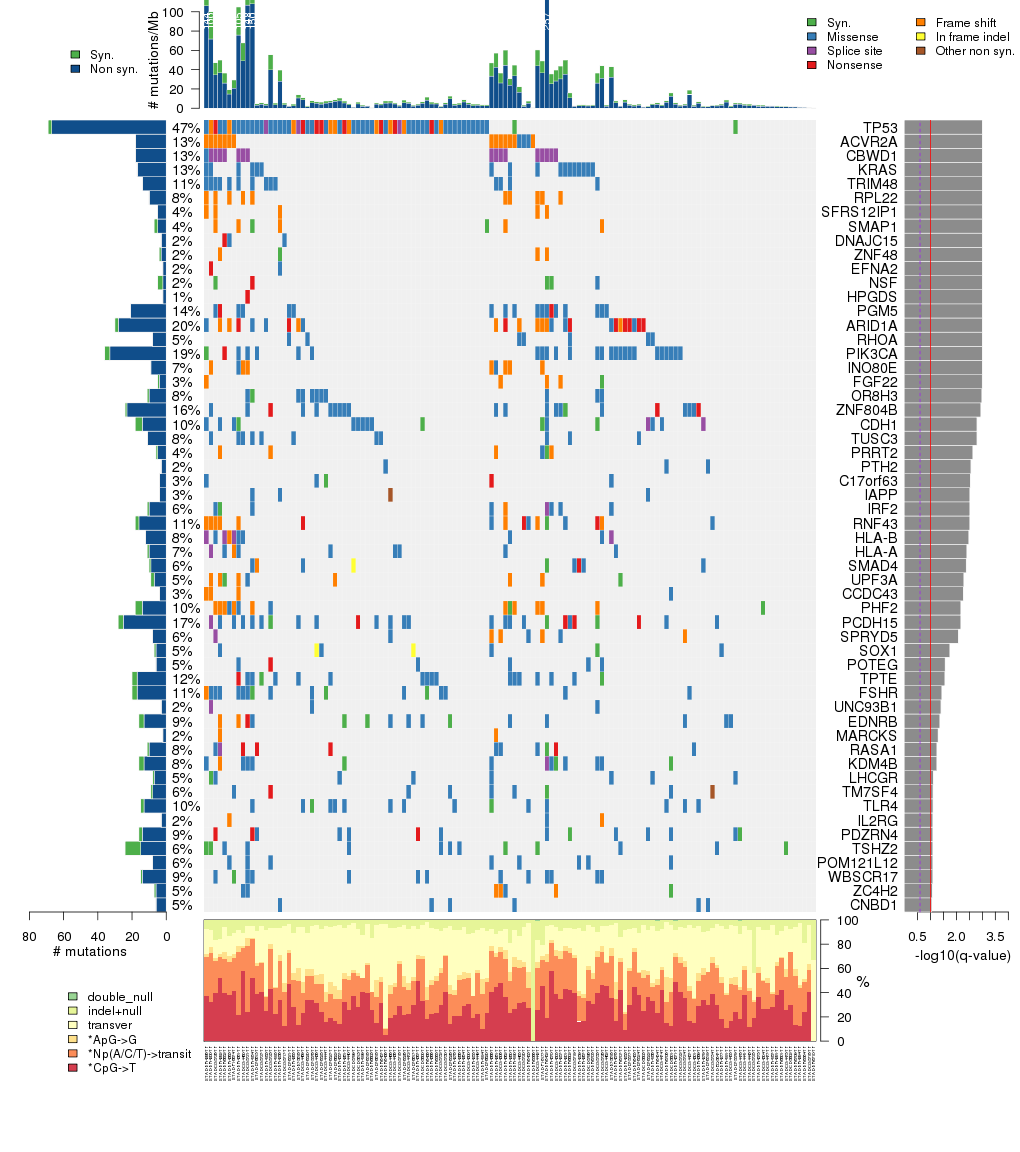
Figure 3. Get High-res Image The matrix in the center of the figure represents individual mutations in patient samples, color-coded by type of mutation, for the significantly mutated genes. The rate of synonymous and non-synonymous mutations is displayed at the top of the matrix. The barplot on the left of the matrix shows the number of mutations in each gene. The percentages represent the fraction of tumors with at least one mutation in the specified gene. The barplot to the right of the matrix displays the q-values for the most significantly mutated genes. The purple boxplots below the matrix (only displayed if required columns are present in the provided MAF) represent the distributions of allelic fractions observed in each sample. The plot at the bottom represents the base substitution distribution of individual samples, using the same categories that were used to calculate significance.
Column Descriptions:
-
N = number of sequenced bases in this gene across the individual set
-
n = number of (nonsilent) mutations in this gene across the individual set
-
npat = number of patients (individuals) with at least one nonsilent mutation
-
nsite = number of unique sites having a non-silent mutation
-
nsil = number of silent mutations in this gene across the individual set
-
n1 = number of nonsilent mutations of type: *CpG->T
-
n2 = number of nonsilent mutations of type: *Np(A/C/T)->transit
-
n3 = number of nonsilent mutations of type: *ApG->G
-
n4 = number of nonsilent mutations of type: transver
-
n5 = number of nonsilent mutations of type: indel+null
-
n6 = number of nonsilent mutations of type: double_null
-
p_classic = p-value for the observed amount of nonsilent mutations being elevated in this gene
-
p_ns_s = p-value for the observed nonsilent/silent ratio being elevated in this gene
-
p_ks = p-value for clustering of mutations (Kolmogorov-Smirnoff test)
-
p_cons = p-value for enrichment of mutations at evolutionarily most-conserved sites in gene
-
p_joint = p-value for clustering + conservation
-
p = p-value (overall)
-
q = q-value, False Discovery Rate (Benjamini-Hochberg procedure)
Table 3. Get Full Table A Ranked List of Significantly Mutated Genes. Number of significant genes found: 56. Number of genes displayed: 35. Click on a gene name to display its stick figure depicting the distribution of mutations and mutation types across the chosen gene (this feature may not be available for all significant genes).
| rank | gene | description | N | n | npat | nsite | nsil | n1 | n2 | n3 | n4 | n5 | n6 | p_classic | p_ns_s | p_ks | p_cons | p_joint | p | q |
|---|---|---|---|---|---|---|---|---|---|---|---|---|---|---|---|---|---|---|---|---|
| 1 | TP53 | tumor protein p53 | 165051 | 67 | 62 | 48 | 2 | 21 | 13 | 2 | 10 | 20 | 1 | 1.6e-15 | 2.1e-06 | 2e-07 | 2e-07 | 0 | <1.00e-15 | <1.38e-12 |
| 2 | ACVR2A | activin A receptor, type IIA | 210899 | 18 | 17 | 5 | 0 | 0 | 3 | 0 | 1 | 14 | 0 | 1.8e-11 | 0.28 | 2e-07 | 0.0024 | 0 | <1.00e-15 | <1.38e-12 |
| 3 | CBWD1 | COBW domain containing 1 | 131067 | 18 | 17 | 3 | 0 | 0 | 2 | 0 | 0 | 16 | 0 | 1.2e-12 | 0.037 | 2e-07 | 3.2e-06 | 0 | <1.00e-15 | <1.38e-12 |
| 4 | KRAS | v-Ki-ras2 Kirsten rat sarcoma viral oncogene homolog | 93127 | 17 | 17 | 8 | 0 | 0 | 12 | 0 | 5 | 0 | 0 | 8.2e-15 | 0.0054 | 2.6e-06 | 0.00042 | 0 | <1.00e-15 | <1.38e-12 |
| 5 | TRIM48 | tripartite motif-containing 48 | 84892 | 14 | 14 | 3 | 0 | 0 | 13 | 0 | 1 | 0 | 0 | 4.1e-11 | 0.0032 | 2e-07 | 0.88 | 0 | <1.00e-15 | <1.38e-12 |
| 6 | RPL22 | ribosomal protein L22 | 50726 | 10 | 10 | 1 | 0 | 0 | 0 | 0 | 0 | 10 | 0 | 2.5e-09 | 1 | 2e-07 | 0.028 | 0 | <1.00e-15 | <1.38e-12 |
| 7 | SFRS12IP1 | SFRS12-interacting protein 1 | 61056 | 5 | 5 | 1 | 0 | 0 | 0 | 0 | 0 | 5 | 0 | 0.0006 | 1 | 2e-07 | 0.42 | 0 | <1.00e-15 | <1.38e-12 |
| 8 | SMAP1 | stromal membrane-associated GTPase-activating protein 1 | 178580 | 5 | 5 | 1 | 2 | 0 | 0 | 0 | 0 | 5 | 0 | 0.027 | 1 | 2e-07 | 0.3 | 0 | <1.00e-15 | <1.38e-12 |
| 9 | DNAJC15 | DnaJ (Hsp40) homolog, subfamily C, member 15 | 58957 | 3 | 3 | 3 | 0 | 1 | 0 | 0 | 1 | 1 | 0 | 0.011 | 0.4 | 0.034 | 0.01 | 0 | <1.00e-15 | <1.38e-12 |
| 10 | ZNF48 | zinc finger protein 48 | 236871 | 3 | 3 | 1 | 1 | 0 | 0 | 0 | 0 | 3 | 0 | 0.6 | 1 | 4e-07 | 0.16 | 0 | <1.00e-15 | <1.38e-12 |
| 11 | EFNA2 | ephrin-A2 | 47344 | 2 | 2 | 2 | 0 | 1 | 0 | 0 | 0 | 1 | 0 | 0.096 | 0.38 | 0.012 | 0.69 | 0 | <1.00e-15 | <1.38e-12 |
| 12 | NSF | N-ethylmaleimide-sensitive factor | 163988 | 2 | 2 | 2 | 3 | 0 | 0 | 1 | 0 | 1 | 0 | 0.72 | 0.98 | 0.00019 | 0.7 | 0 | <1.00e-15 | <1.38e-12 |
| 13 | HPGDS | hematopoietic prostaglandin D synthase | 82460 | 2 | 1 | 2 | 0 | 0 | 1 | 0 | 0 | 1 | 0 | 0.42 | 0.5 | 0.0031 | 0.88 | 0 | <1.00e-15 | <1.38e-12 |
| 14 | PGM5 | phosphoglucomutase 5 | 187631 | 21 | 18 | 7 | 0 | 5 | 14 | 0 | 0 | 2 | 0 | 9.4e-11 | 0.00034 | 2e-07 | 1 | 0.000017 | 5.47e-14 | 7.03e-11 |
| 15 | ARID1A | AT rich interactive domain 1A (SWI-like) | 773196 | 28 | 26 | 27 | 2 | 4 | 1 | 0 | 5 | 15 | 3 | 8.3e-11 | 0.064 | 0.18 | 0.047 | 0.059 | 1.33e-10 | 1.59e-07 |
| 16 | RHOA | ras homolog gene family, member A | 79534 | 8 | 7 | 4 | 0 | 0 | 5 | 0 | 3 | 0 | 0 | 1.7e-07 | 0.089 | 9.2e-06 | 0.16 | 0.000078 | 3.51e-10 | 3.94e-07 |
| 17 | PIK3CA | phosphoinositide-3-kinase, catalytic, alpha polypeptide | 437042 | 33 | 25 | 19 | 3 | 5 | 20 | 3 | 4 | 1 | 0 | 8.3e-08 | 0.0045 | 0.0018 | 0.0075 | 0.00021 | 4.39e-10 | 4.64e-07 |
| 18 | INO80E | INO80 complex subunit E | 53262 | 9 | 9 | 4 | 0 | 1 | 0 | 0 | 1 | 6 | 1 | 2.7e-08 | 0.51 | 0.062 | 0.00092 | 0.00088 | 5.96e-10 | 5.95e-07 |
| 19 | FGF22 | fibroblast growth factor 22 | 22304 | 4 | 4 | 1 | 1 | 0 | 0 | 0 | 0 | 4 | 0 | 0.00011 | 1 | 2e-07 | 0.99 | 3.4e-06 | 8.40e-09 | 7.96e-06 |
| 20 | OR8H3 | olfactory receptor, family 8, subfamily H, member 3 | 125419 | 10 | 10 | 8 | 1 | 0 | 4 | 3 | 3 | 0 | 0 | 2.1e-07 | 0.1 | 0.26 | 0.011 | 0.017 | 7.38e-08 | 6.64e-05 |
| 21 | ZNF804B | zinc finger protein 804B | 540495 | 23 | 21 | 22 | 1 | 0 | 8 | 0 | 12 | 3 | 0 | 2.3e-08 | 0.019 | 0.26 | 0.7 | 0.45 | 1.99e-07 | 0.000171 |
| 22 | CDH1 | cadherin 1, type 1, E-cadherin (epithelial) | 338076 | 14 | 13 | 14 | 4 | 1 | 5 | 1 | 5 | 2 | 0 | 0.00027 | 0.38 | 0.0062 | 0.0012 | 0.00016 | 7.60e-07 | 0.000622 |
| 23 | TUSC3 | tumor suppressor candidate 3 | 142522 | 11 | 11 | 10 | 0 | 5 | 1 | 0 | 5 | 0 | 0 | 4.8e-07 | 0.078 | 0.076 | 0.22 | 0.093 | 7.99e-07 | 0.000625 |
| 24 | PRRT2 | proline-rich transmembrane protein 2 | 134137 | 5 | 5 | 2 | 1 | 0 | 0 | 0 | 1 | 4 | 0 | 0.01 | 0.93 | 2e-07 | 0.21 | 0.000011 | 1.86e-06 | 0.00139 |
| 25 | PTH2 | parathyroid hormone 2 | 26182 | 3 | 3 | 1 | 0 | 0 | 0 | 0 | 3 | 0 | 0 | 0.0019 | 0.43 | 0.000023 | 0.073 | 0.000077 | 2.46e-06 | 0.00177 |
| 26 | C17orf63 | chromosome 17 open reading frame 63 | 9845 | 4 | 4 | 4 | 0 | 2 | 0 | 0 | 1 | 1 | 0 | 2.7e-06 | 0.16 | NaN | NaN | NaN | 2.73e-06 | 0.00189 |
| 27 | IAPP | islet amyloid polypeptide | 36974 | 4 | 4 | 3 | 0 | 0 | 0 | 0 | 4 | 0 | 0 | 0.00024 | 0.47 | 0.00029 | 0.98 | 0.00082 | 3.21e-06 | 0.00207 |
| 28 | IRF2 | interferon regulatory factor 2 | 143858 | 10 | 8 | 10 | 1 | 4 | 0 | 0 | 4 | 1 | 1 | 0.00038 | 0.2 | 0.004 | 0.018 | 0.00051 | 3.22e-06 | 0.00207 |
| 29 | RNF43 | ring finger protein 43 | 289155 | 16 | 15 | 9 | 2 | 1 | 4 | 0 | 0 | 11 | 0 | 0.000022 | 0.42 | 0.0099 | 0.12 | 0.0095 | 3.36e-06 | 0.00209 |
| 30 | HLA-B | major histocompatibility complex, class I, B | 131490 | 12 | 10 | 12 | 0 | 1 | 3 | 2 | 1 | 3 | 2 | 6e-07 | 0.02 | 0.94 | 0.12 | 0.4 | 3.93e-06 | 0.00236 |
| 31 | HLA-A | major histocompatibility complex, class I, A | 144803 | 10 | 9 | 10 | 1 | 0 | 2 | 3 | 3 | 2 | 0 | 0.000023 | 0.23 | 0.12 | 0.0092 | 0.015 | 5.28e-06 | 0.00306 |
| 32 | SMAD4 | SMAD family member 4 | 226261 | 9 | 8 | 8 | 1 | 3 | 1 | 0 | 2 | 3 | 0 | 0.000027 | 0.32 | 0.013 | 0.078 | 0.013 | 5.61e-06 | 0.00316 |
| 33 | UPF3A | UPF3 regulator of nonsense transcripts homolog A (yeast) | 148651 | 7 | 7 | 3 | 2 | 0 | 1 | 0 | 0 | 6 | 0 | 0.0055 | 0.96 | 0.000084 | 0.01 | 0.000092 | 7.87e-06 | 0.00429 |
| 34 | CCDC43 | coiled-coil domain containing 43 | 84224 | 4 | 4 | 2 | 0 | 0 | 0 | 0 | 1 | 3 | 0 | 0.018 | 0.86 | 1.6e-06 | 0.55 | 3e-05 | 8.24e-06 | 0.00436 |
| 35 | PHF2 | PHD finger protein 2 | 350230 | 14 | 13 | 5 | 4 | 2 | 1 | 0 | 1 | 10 | 0 | 0.011 | 0.88 | 7.6e-06 | 0.34 | 7e-05 | 1.14e-05 | 0.00580 |
Figure S1. This figure depicts the distribution of mutations and mutation types across the TP53 significant gene.
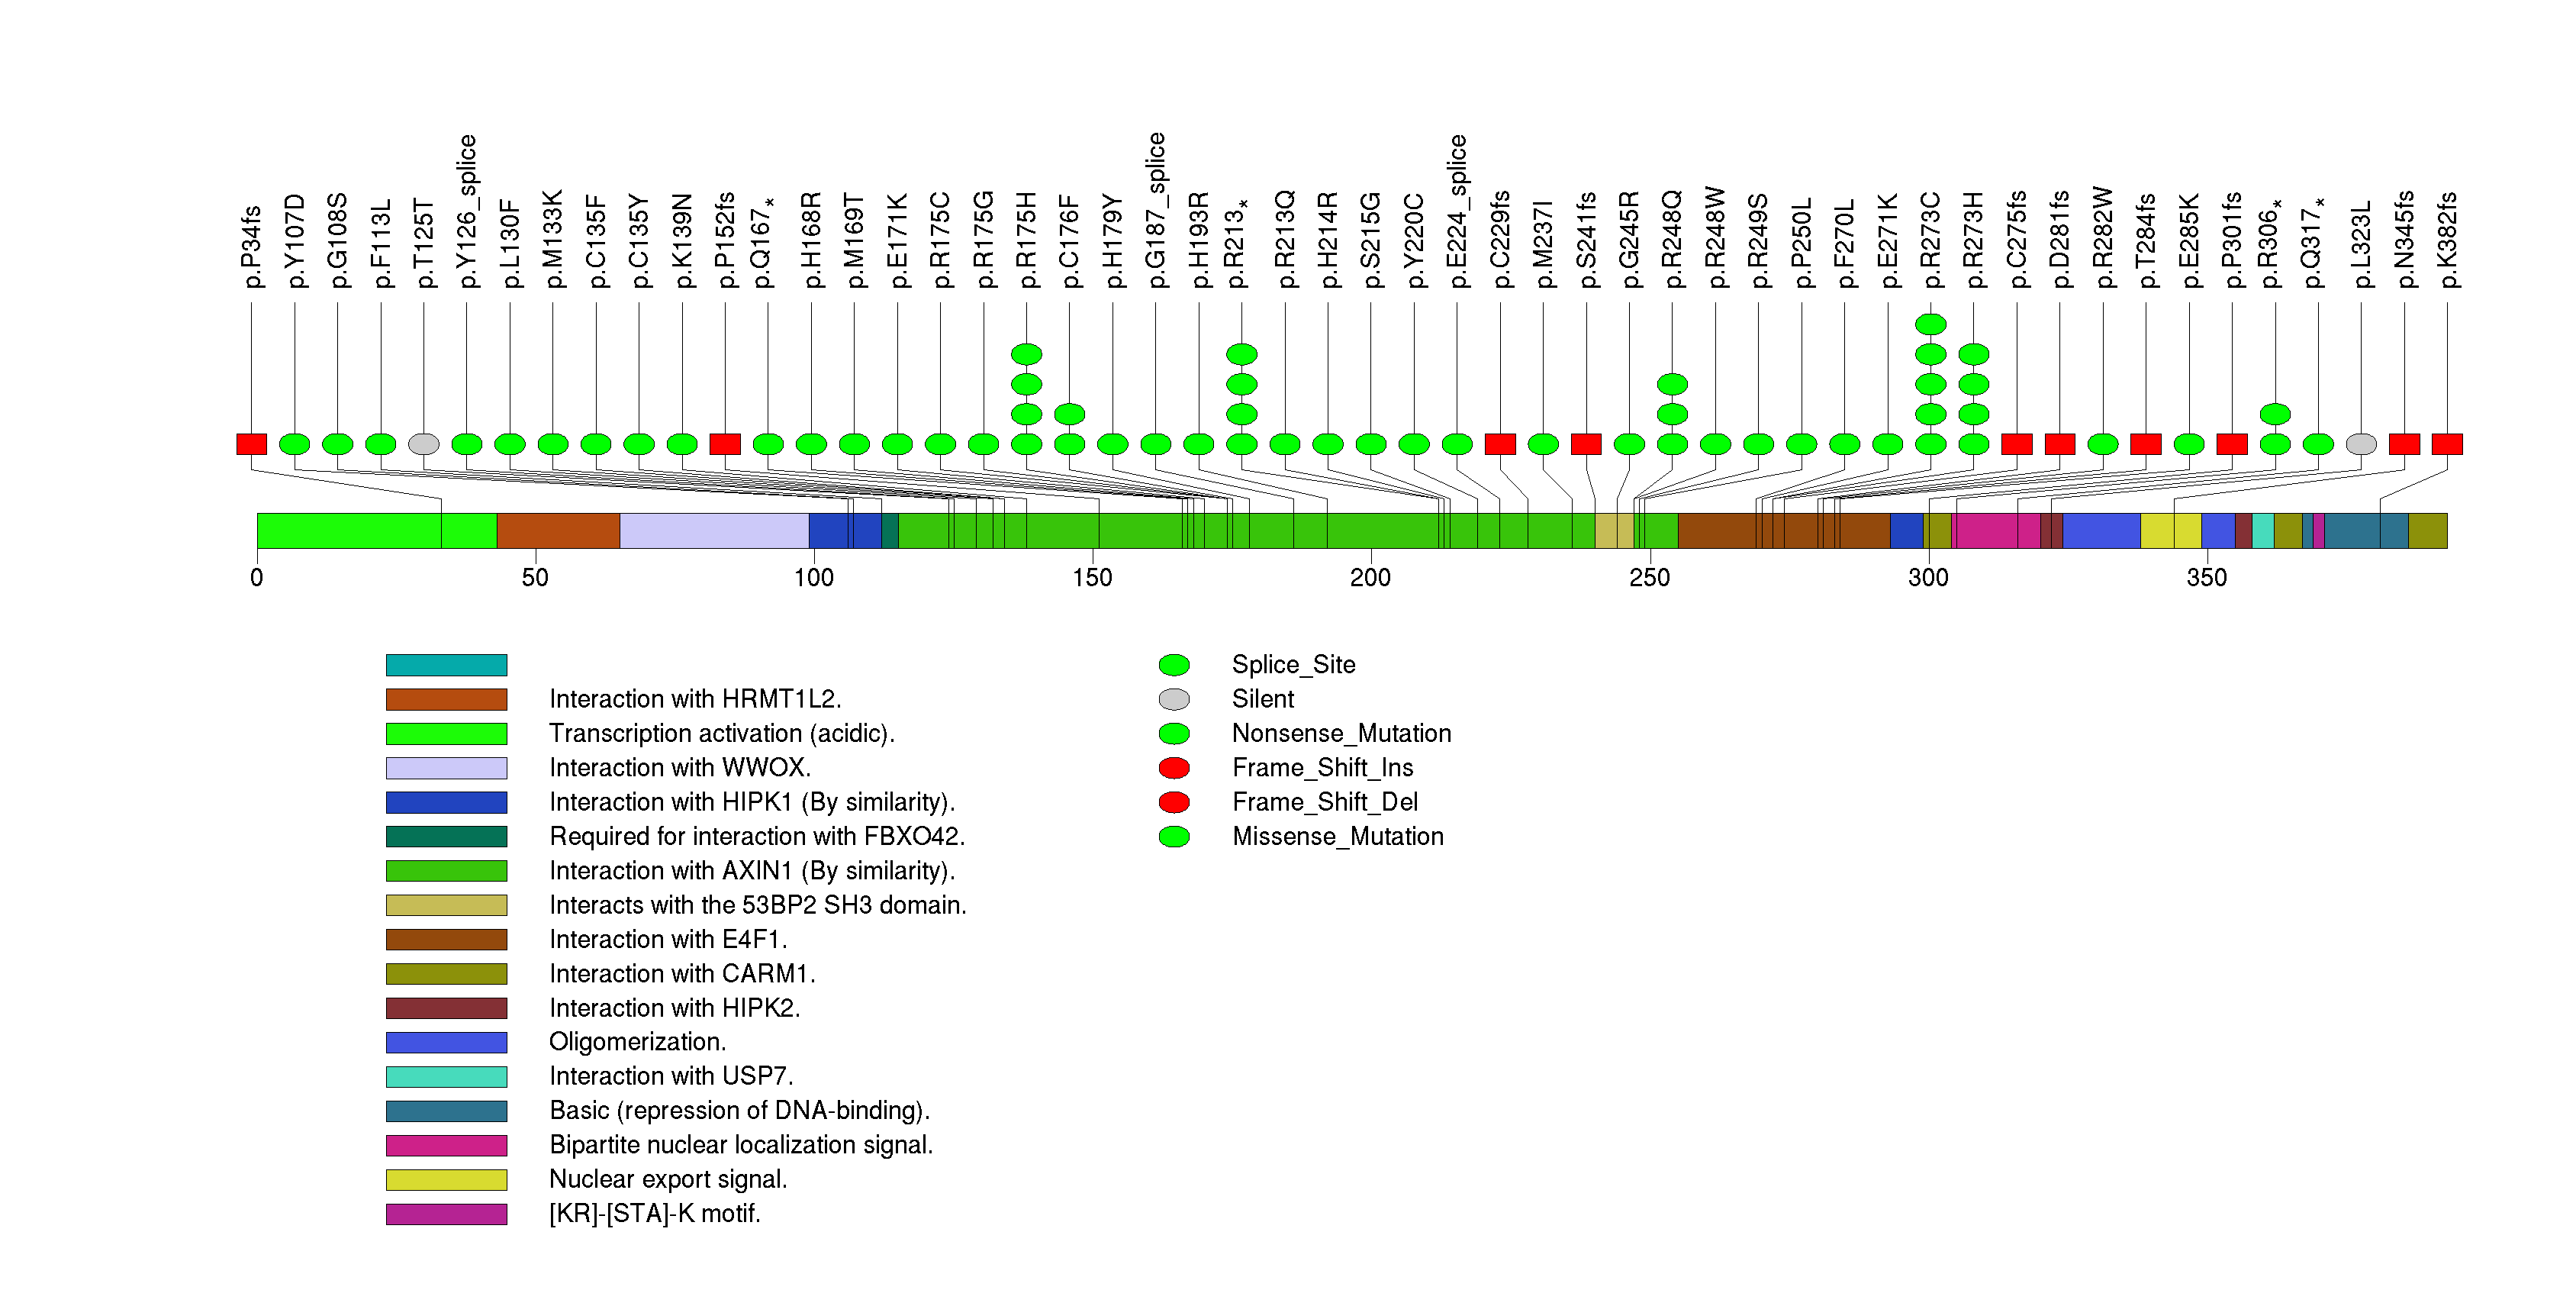
Figure S2. This figure depicts the distribution of mutations and mutation types across the ACVR2A significant gene.
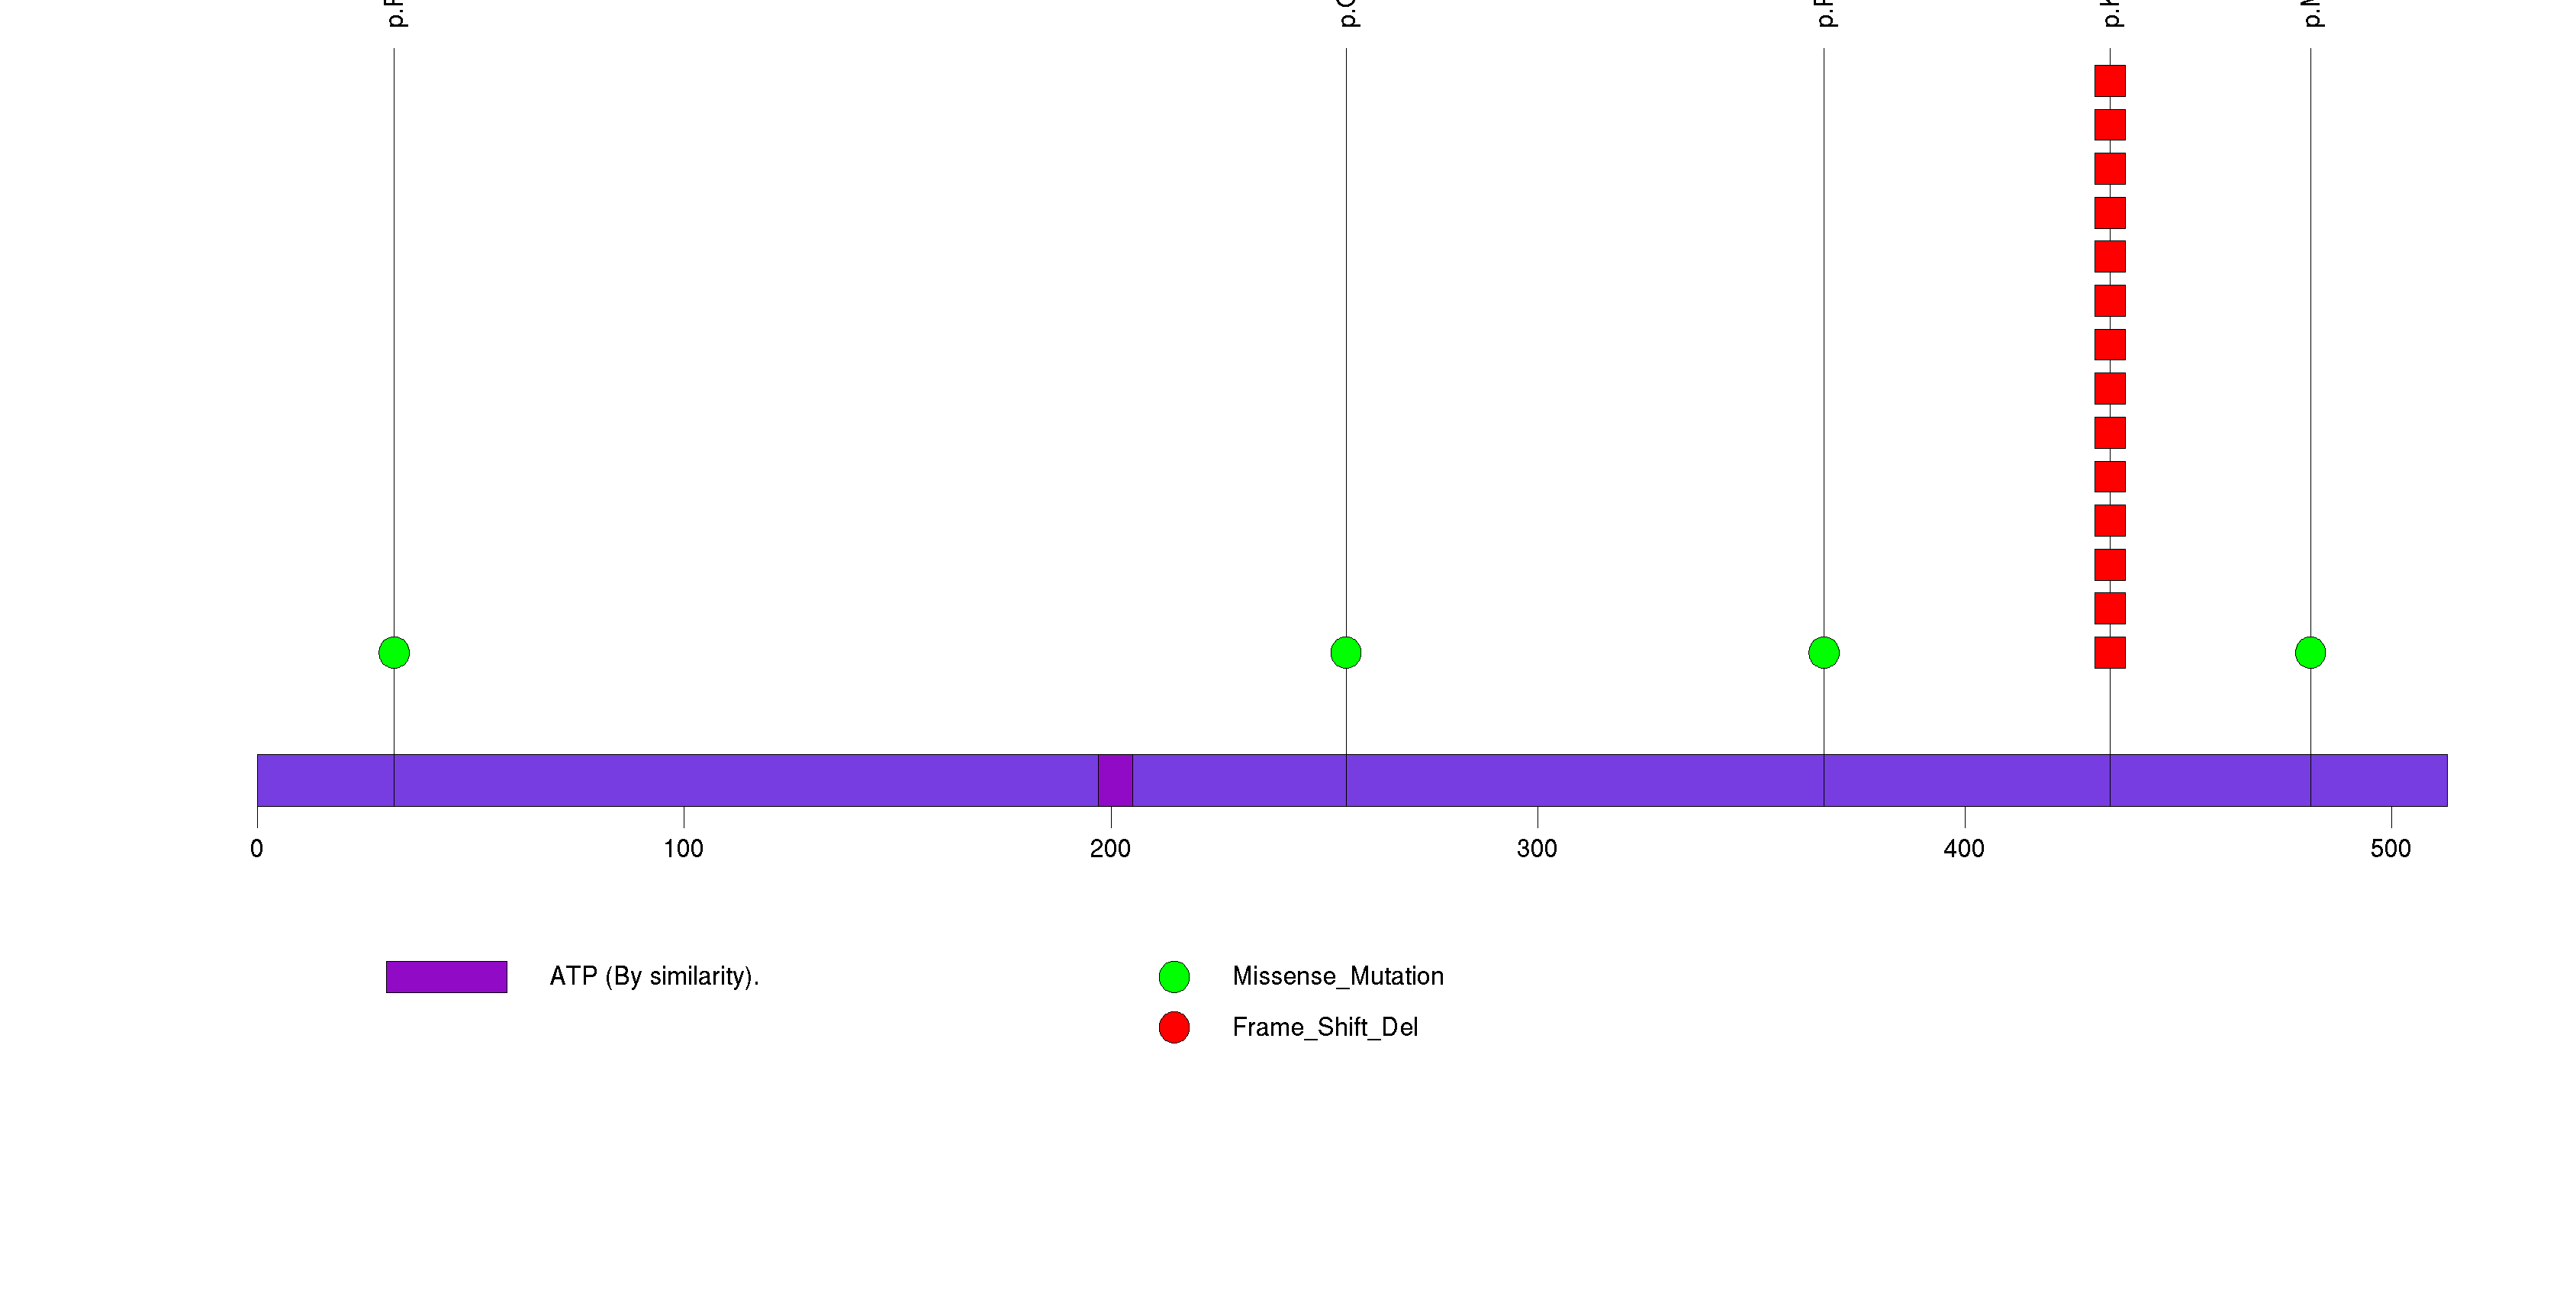
Figure S3. This figure depicts the distribution of mutations and mutation types across the KRAS significant gene.
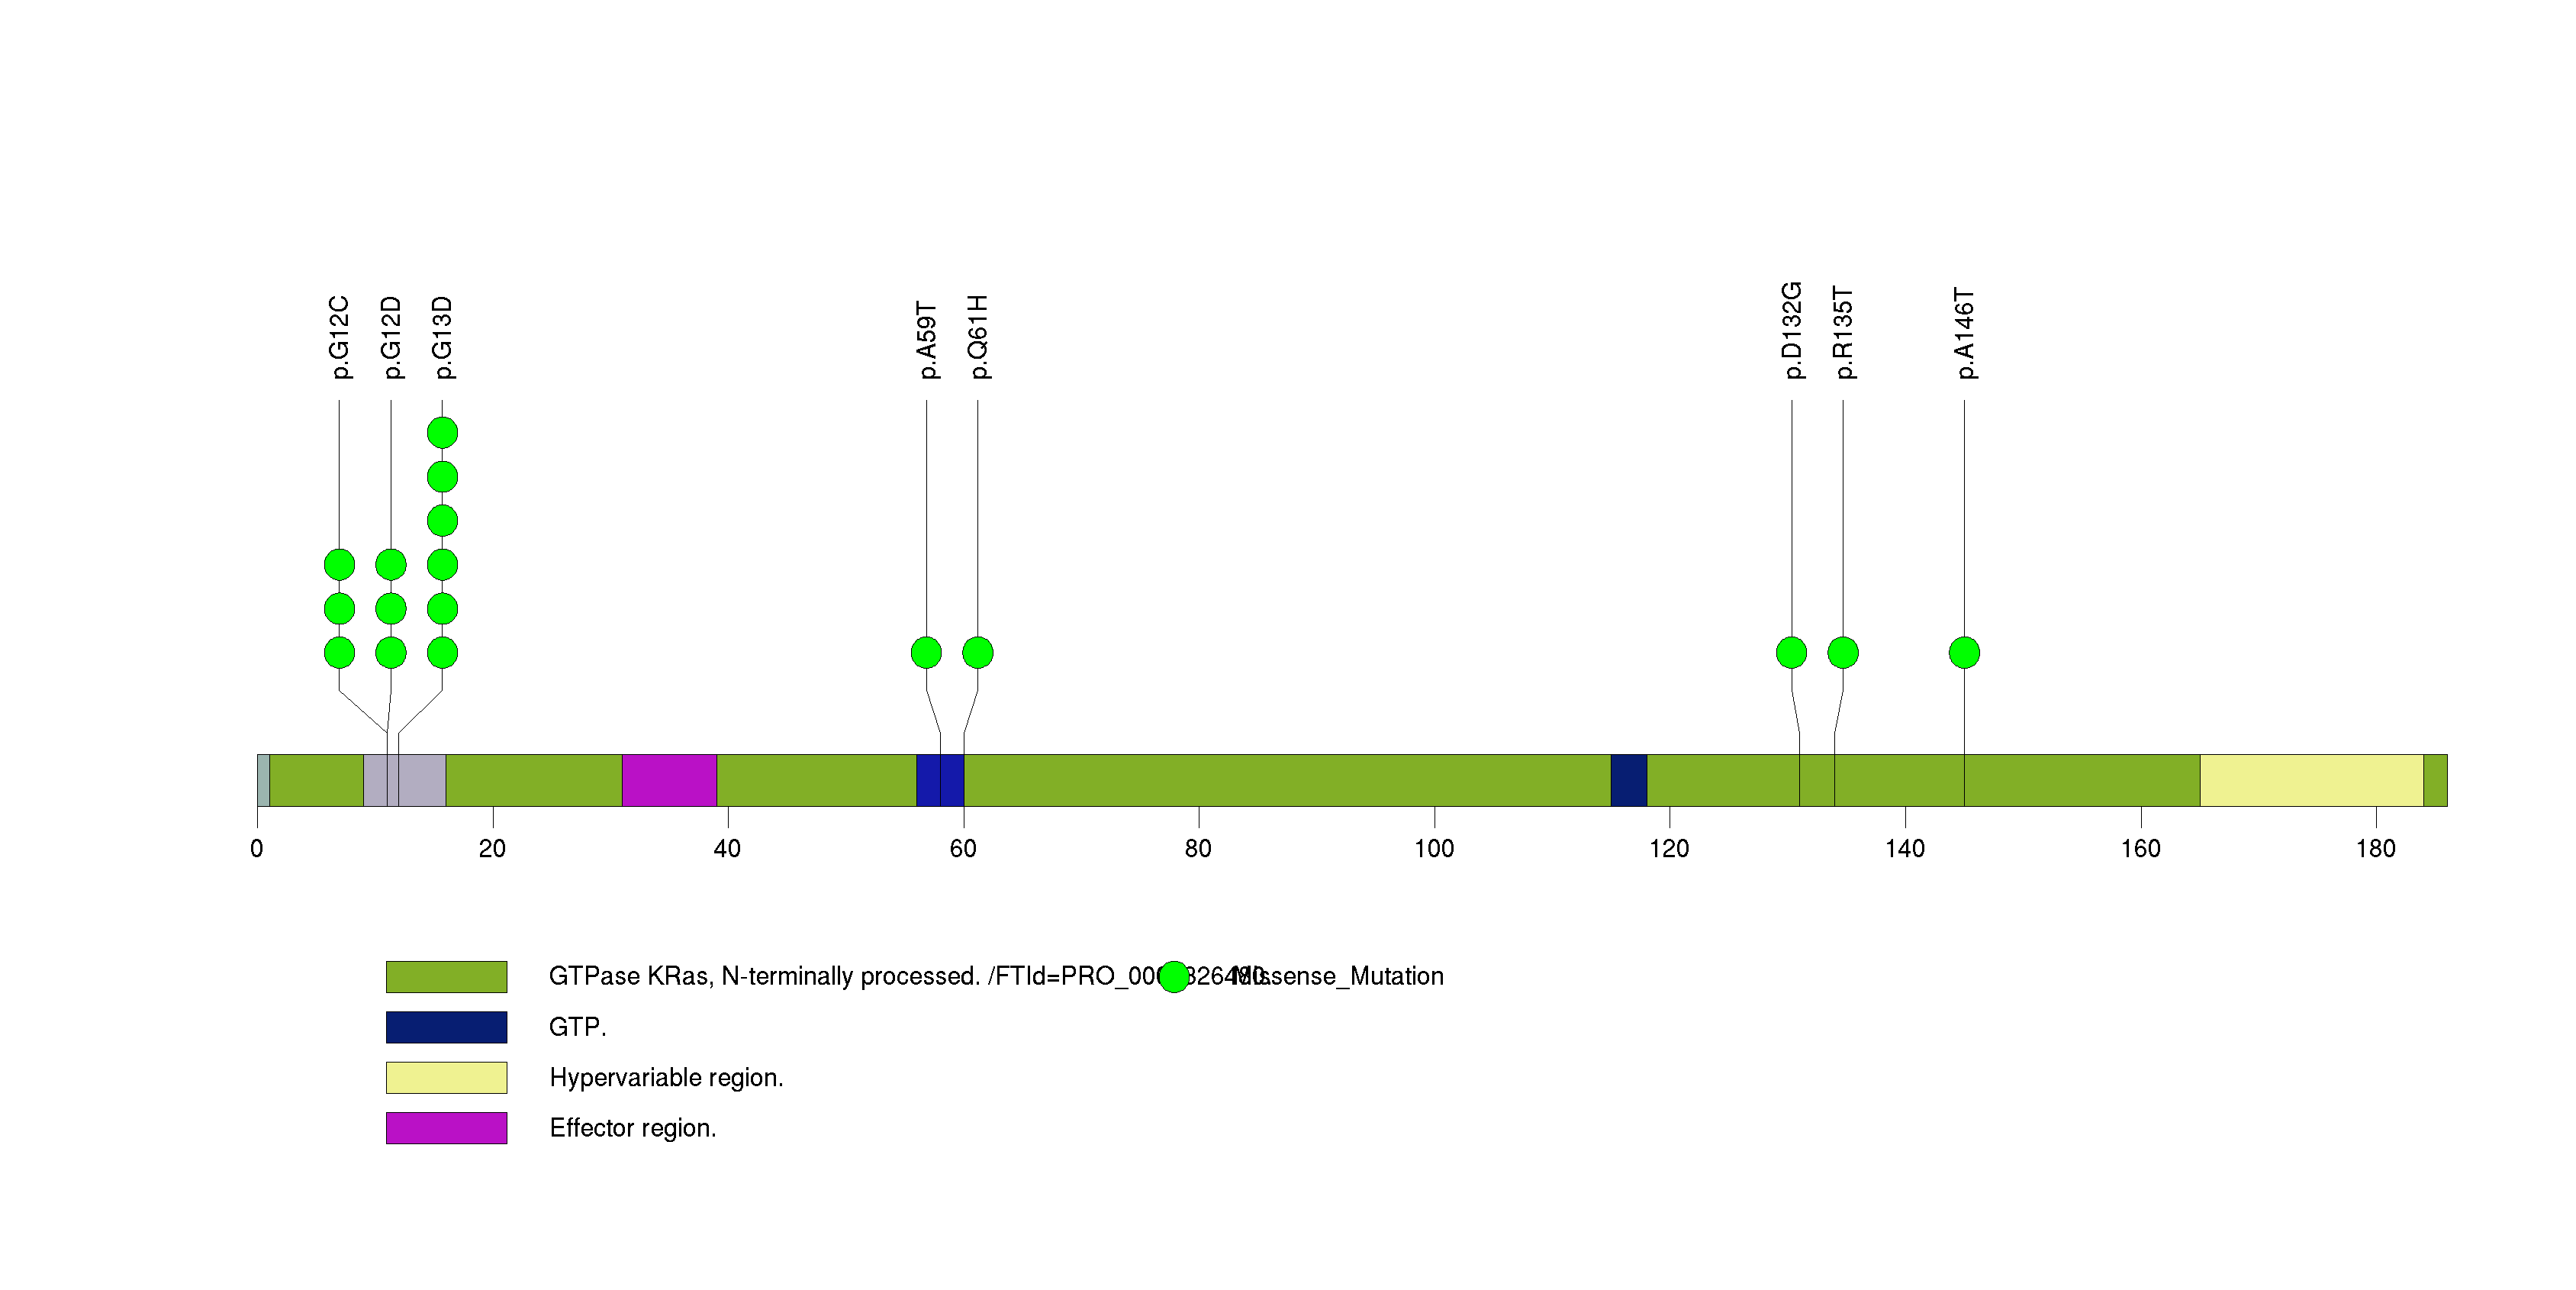
Figure S4. This figure depicts the distribution of mutations and mutation types across the TRIM48 significant gene.
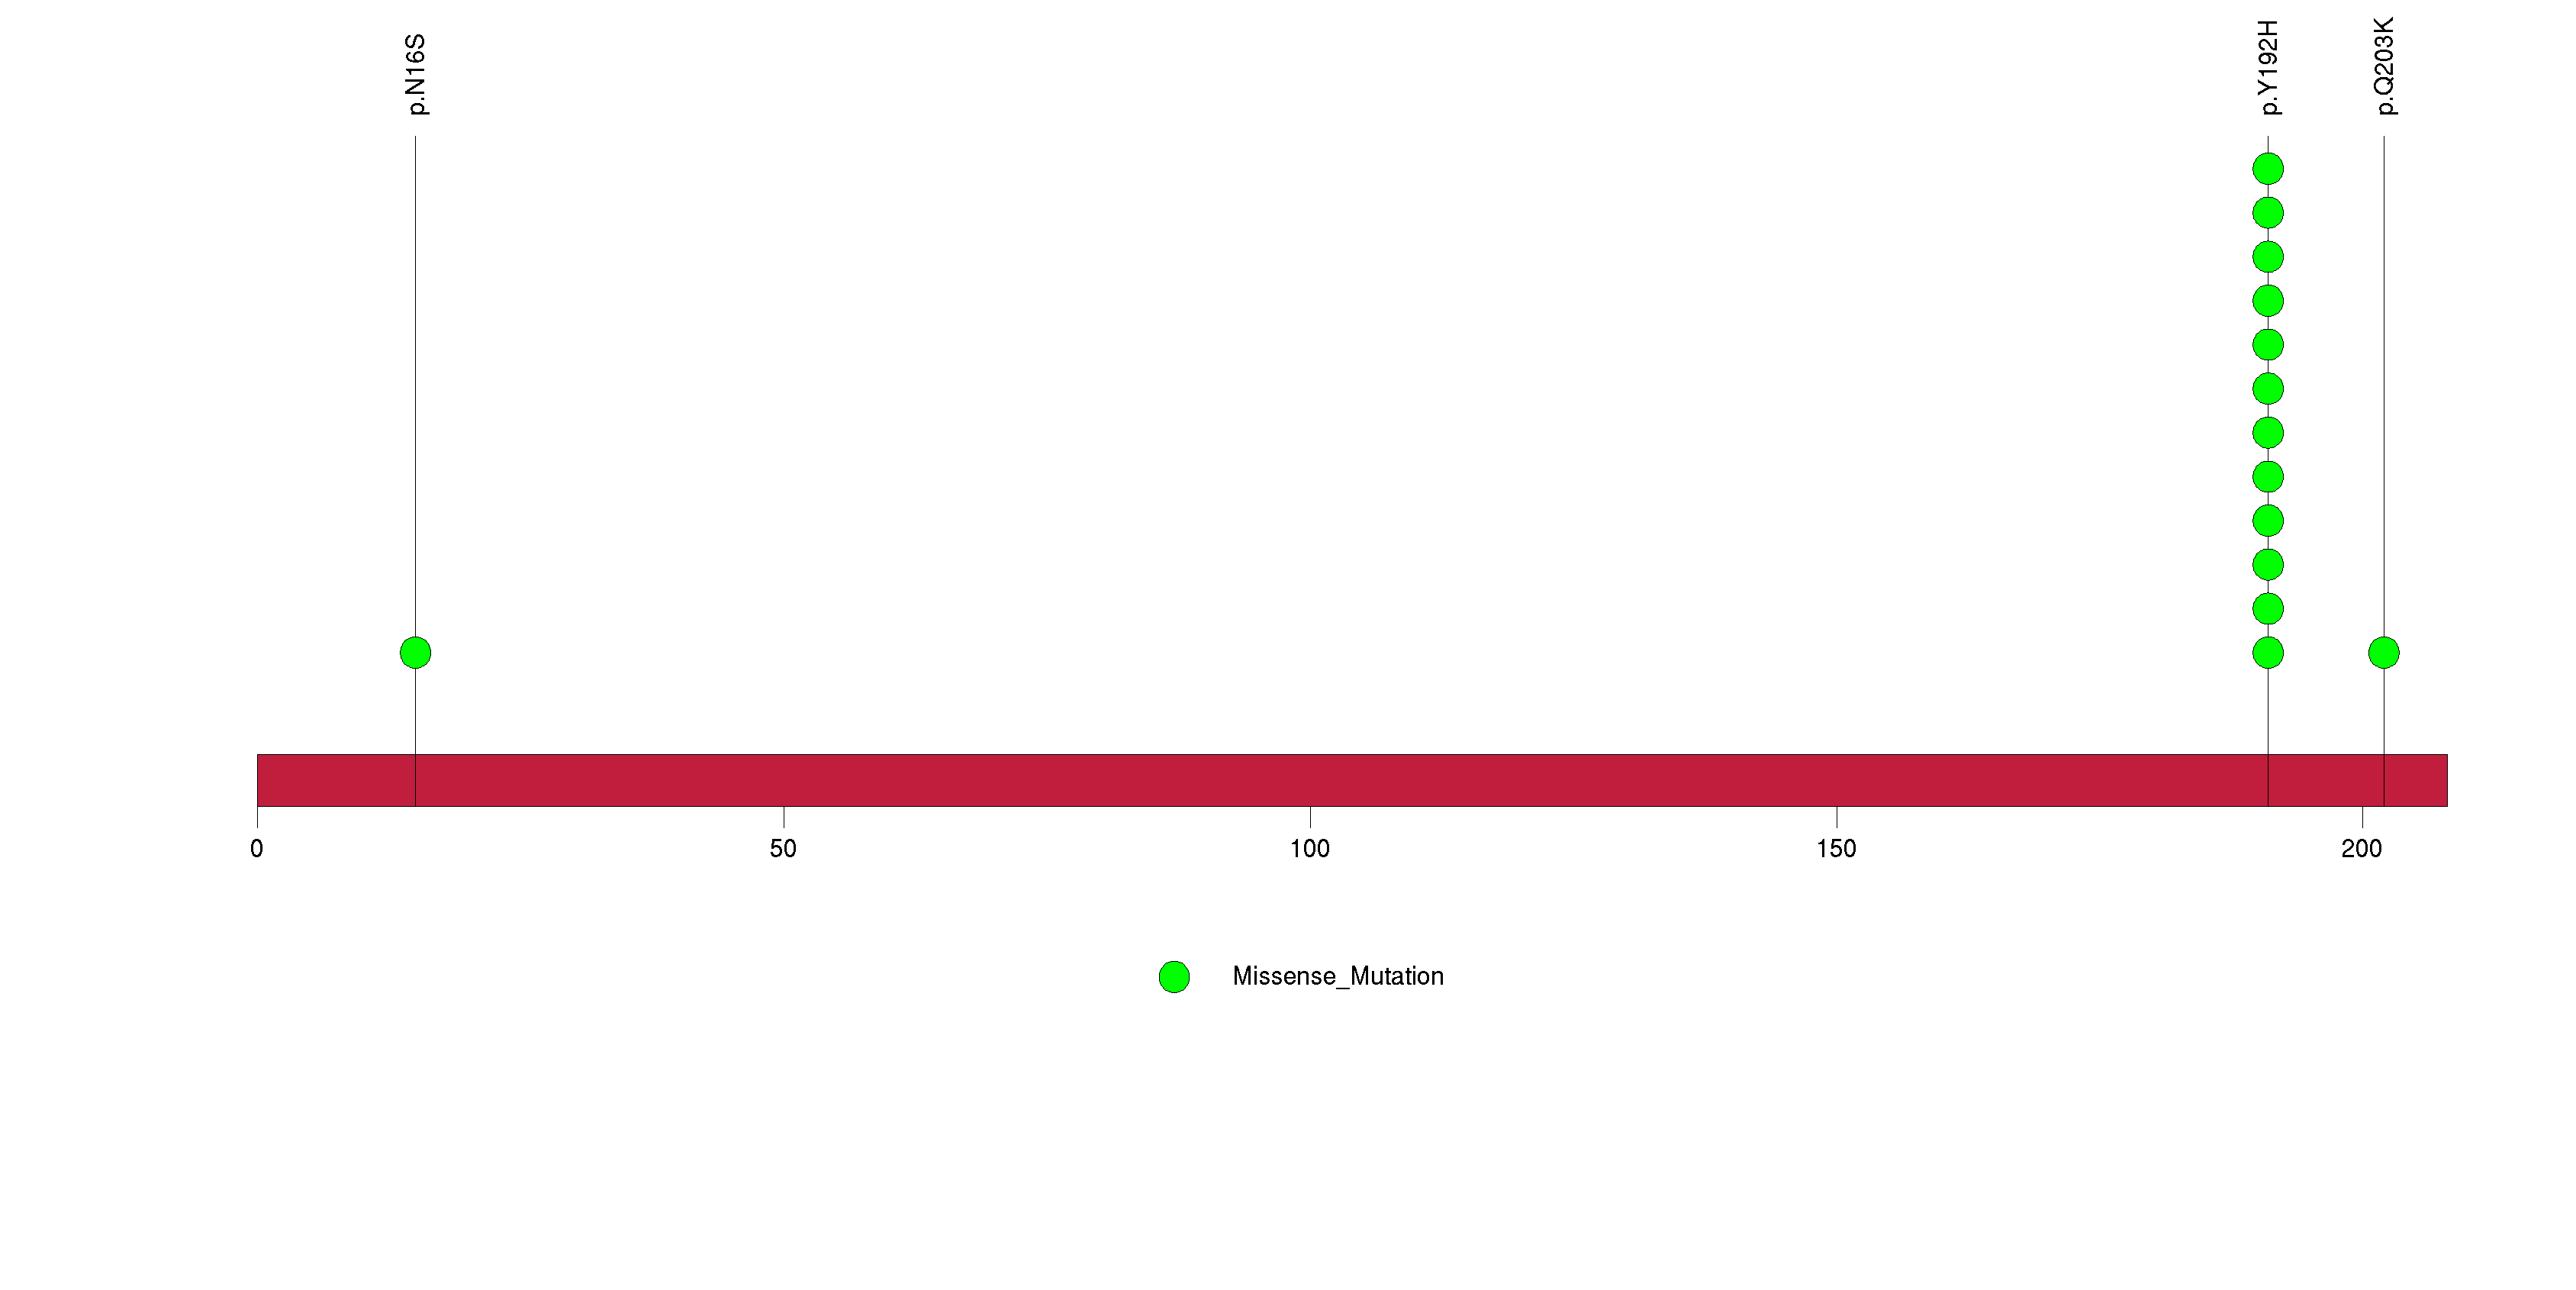
Figure S5. This figure depicts the distribution of mutations and mutation types across the RPL22 significant gene.
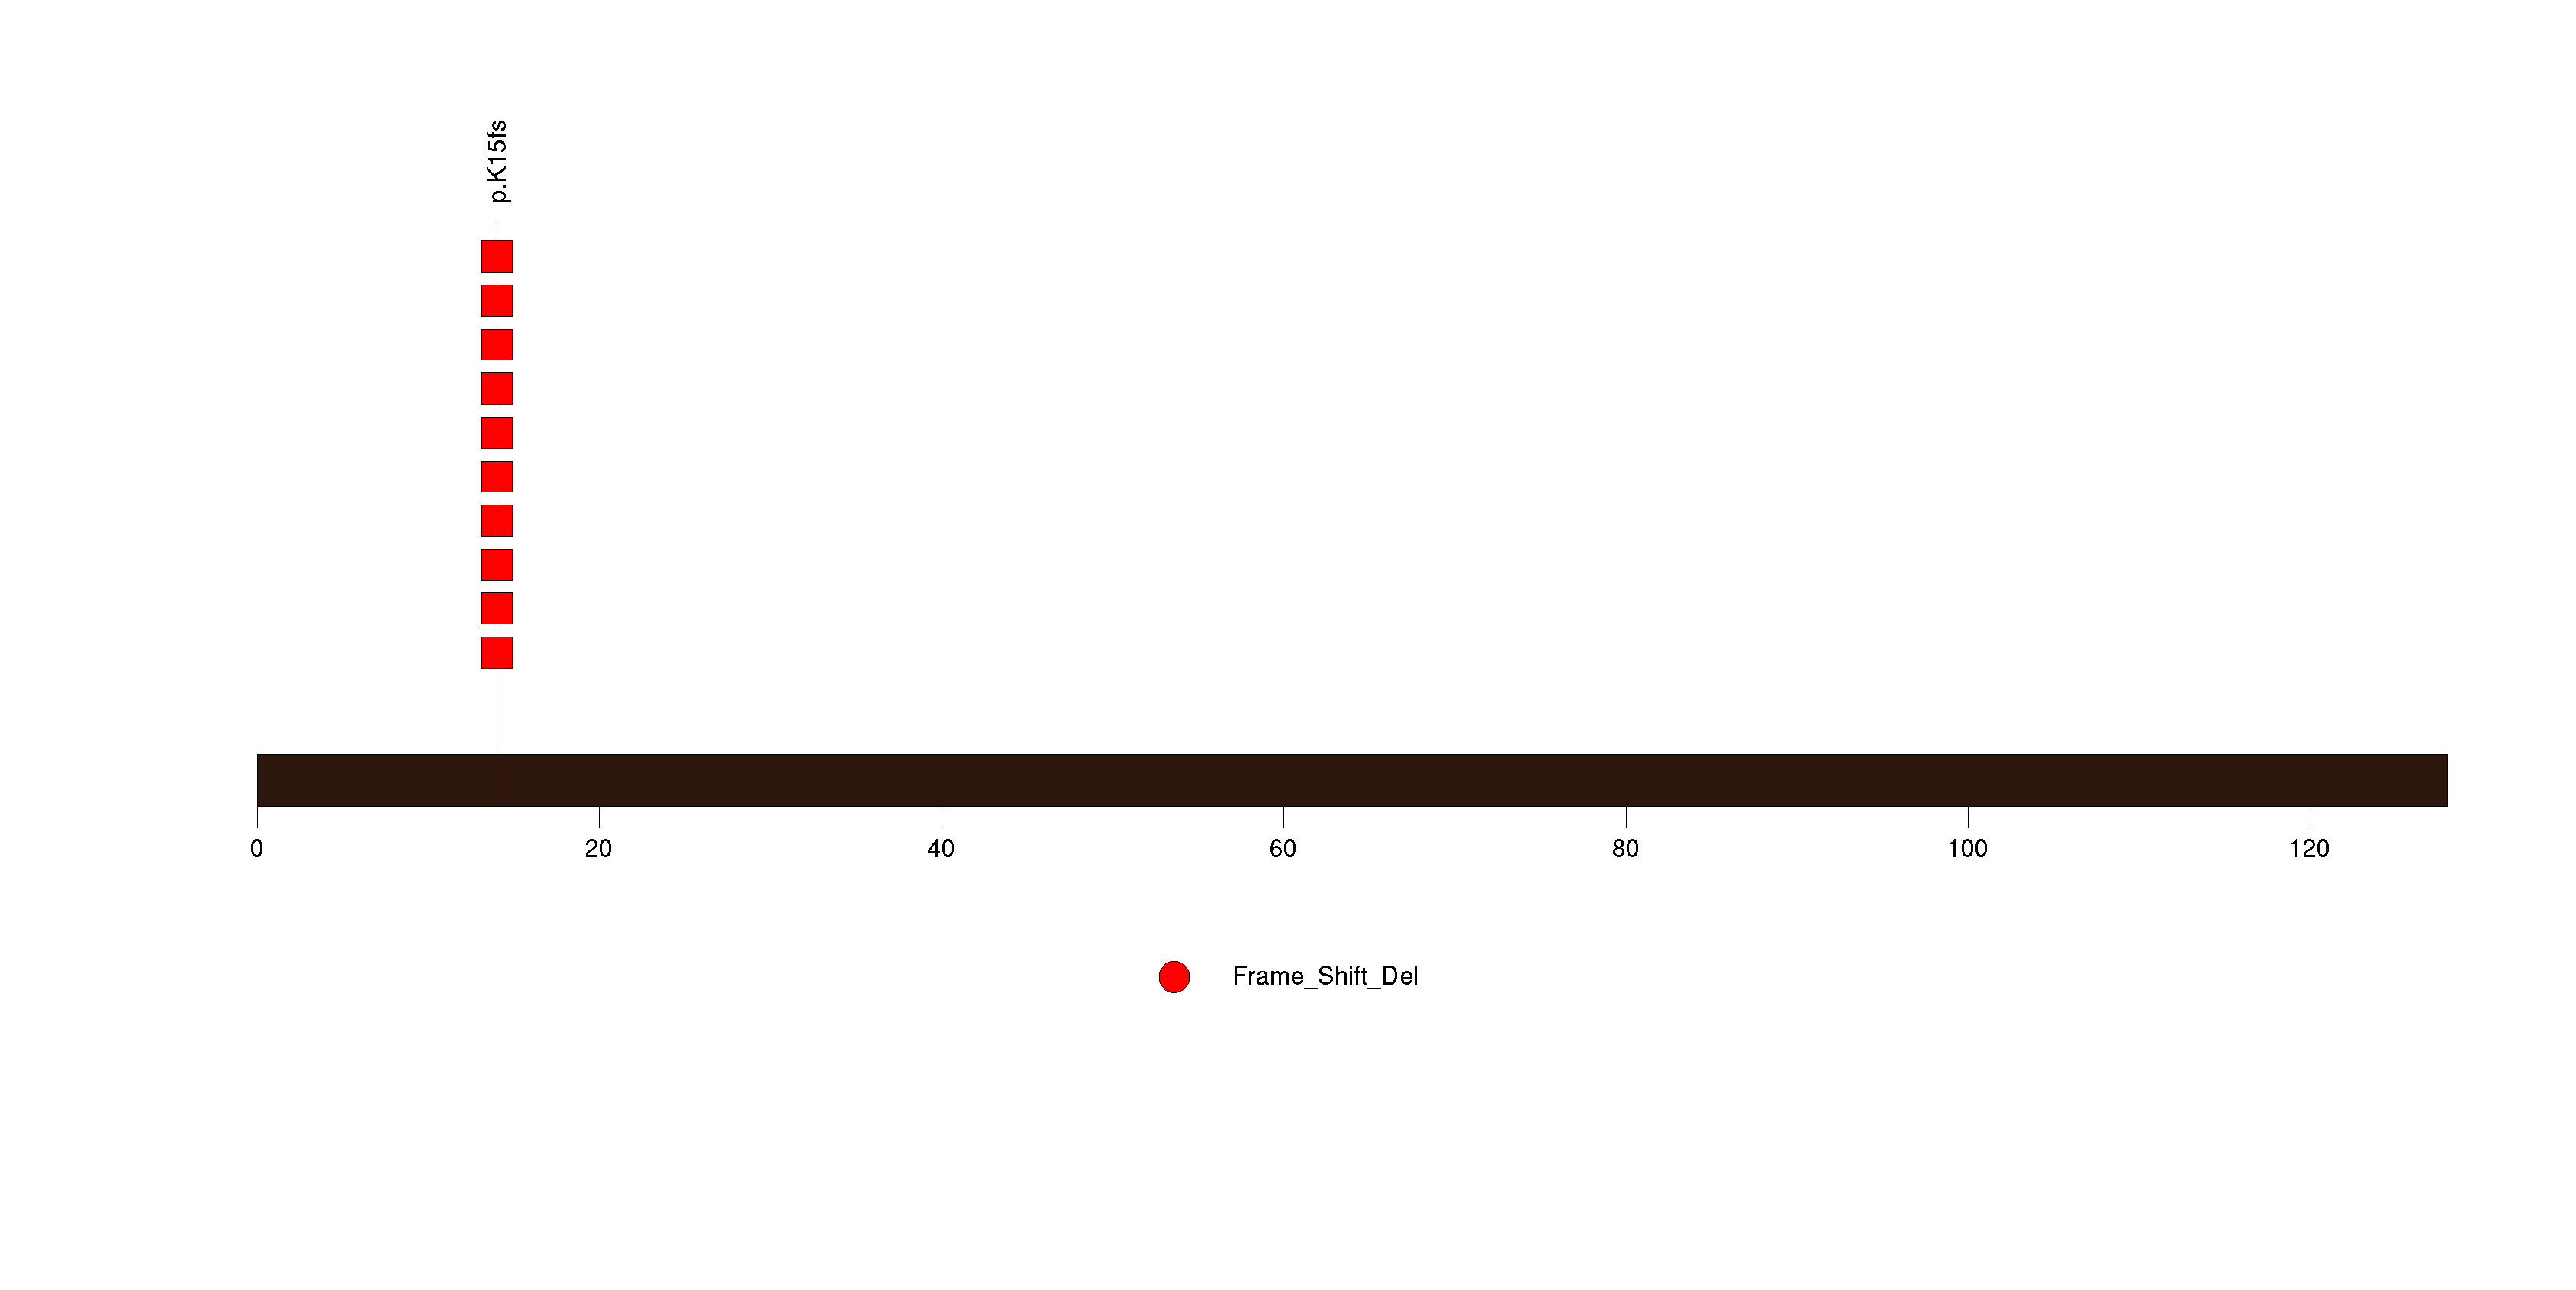
Figure S6. This figure depicts the distribution of mutations and mutation types across the SMAP1 significant gene.
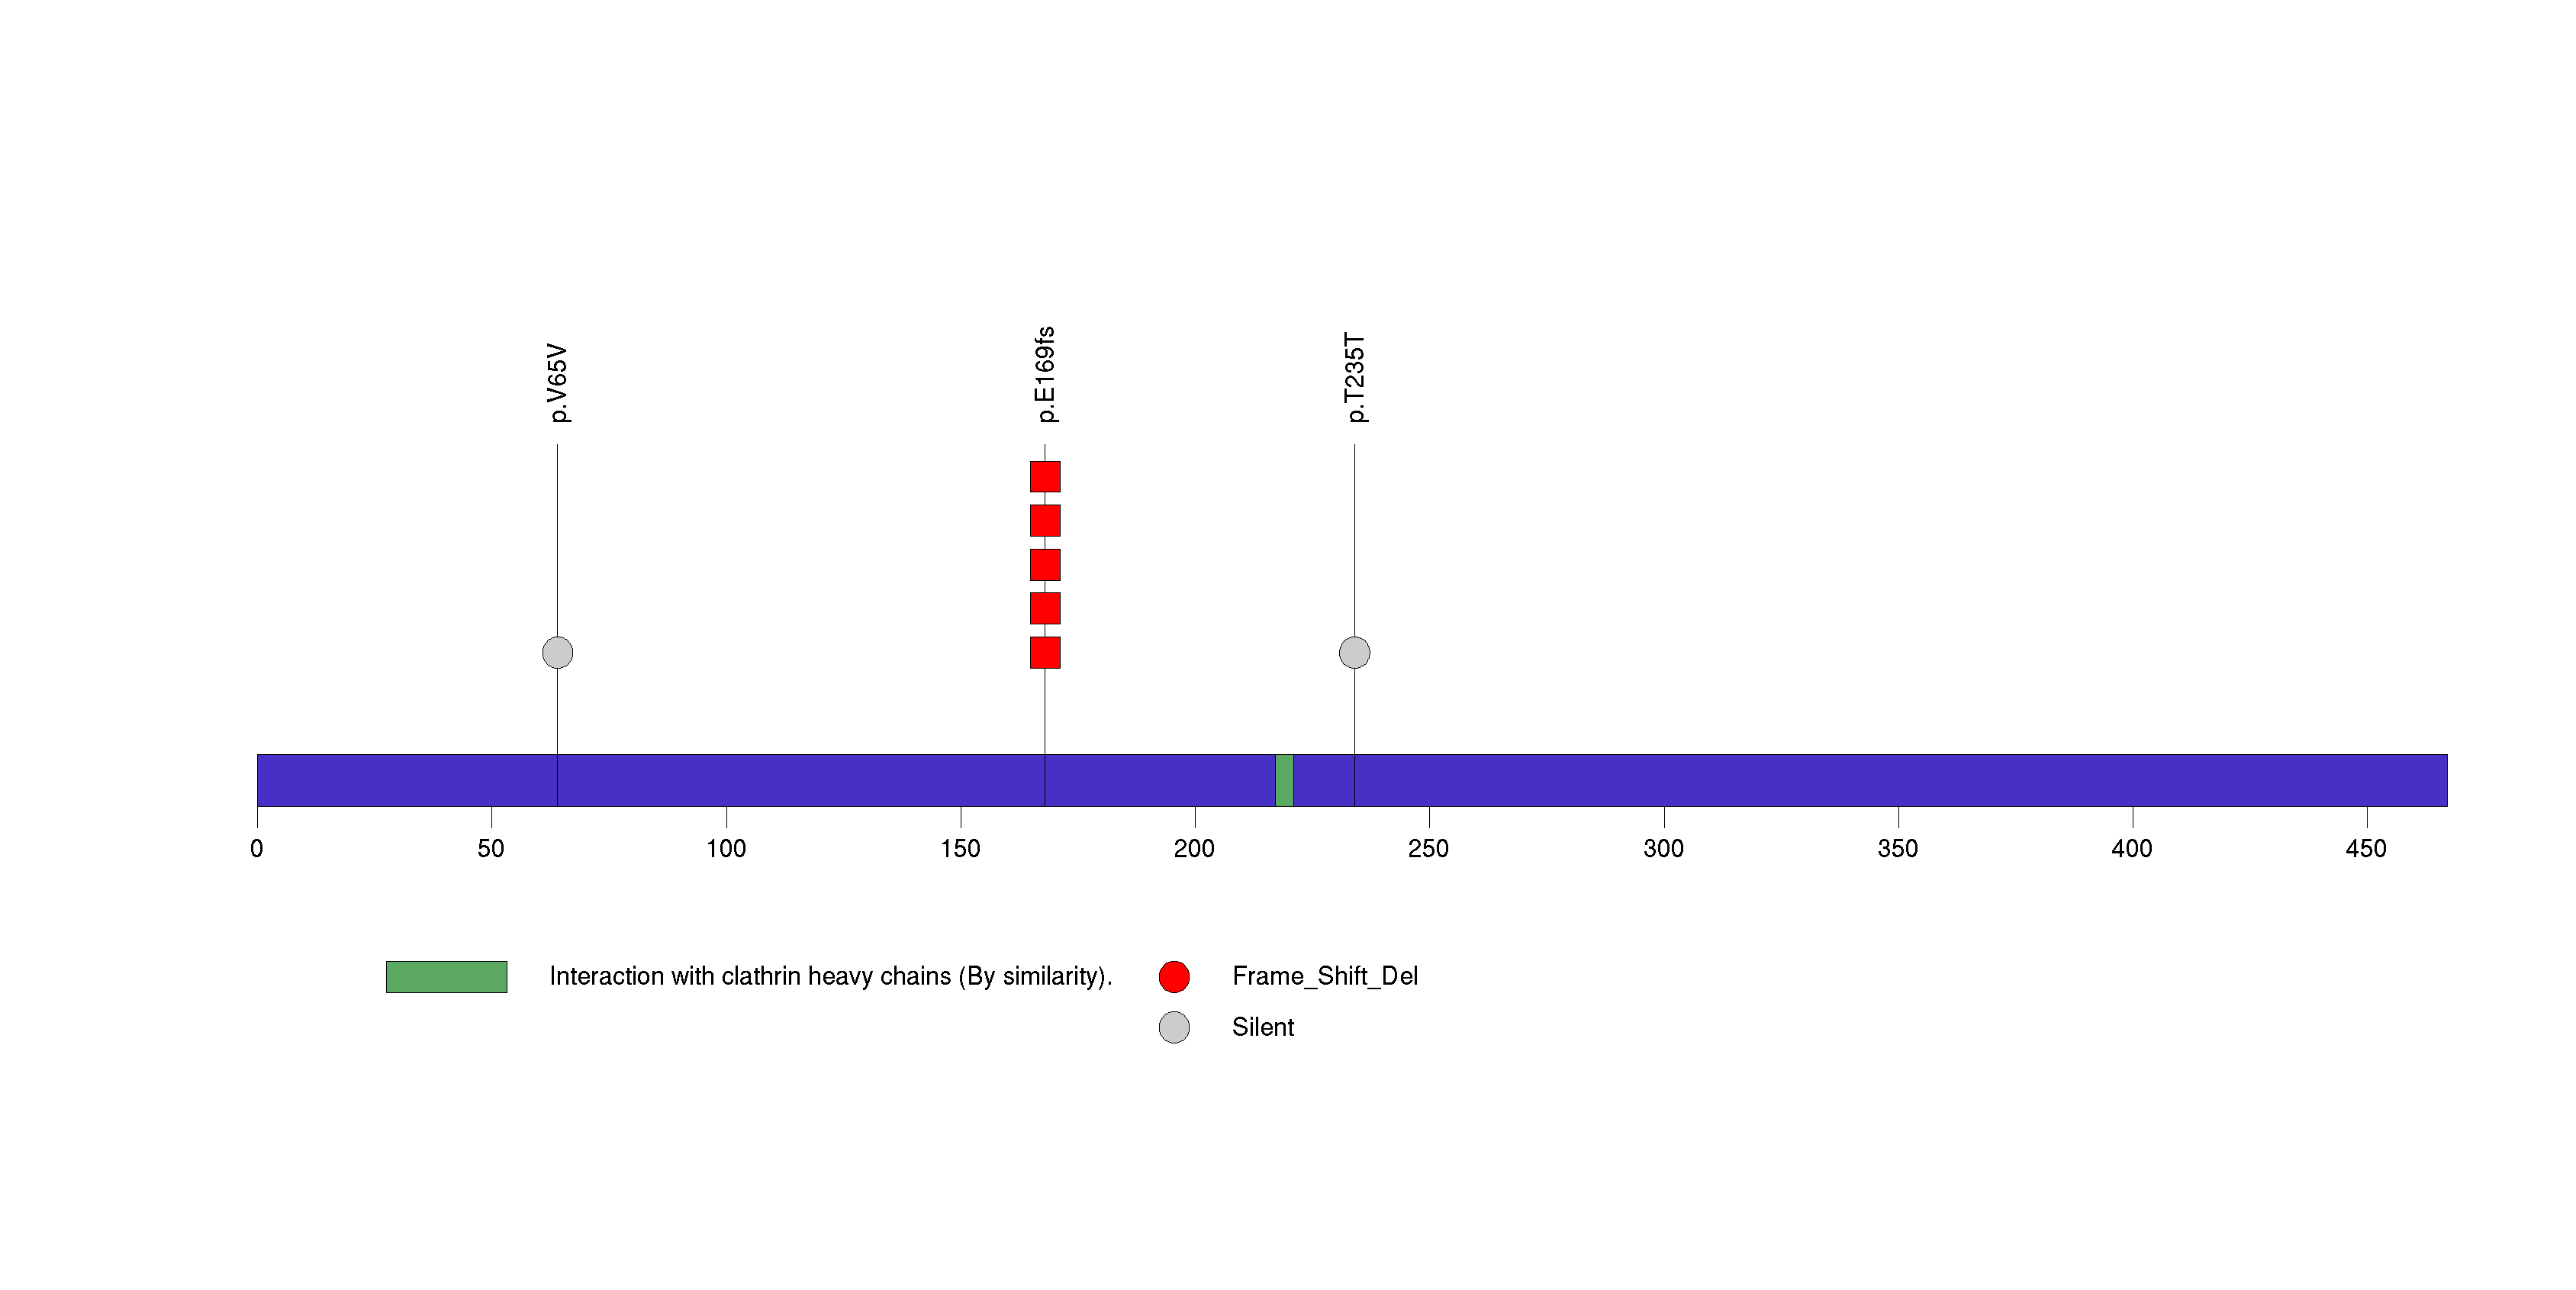
Figure S7. This figure depicts the distribution of mutations and mutation types across the DNAJC15 significant gene.
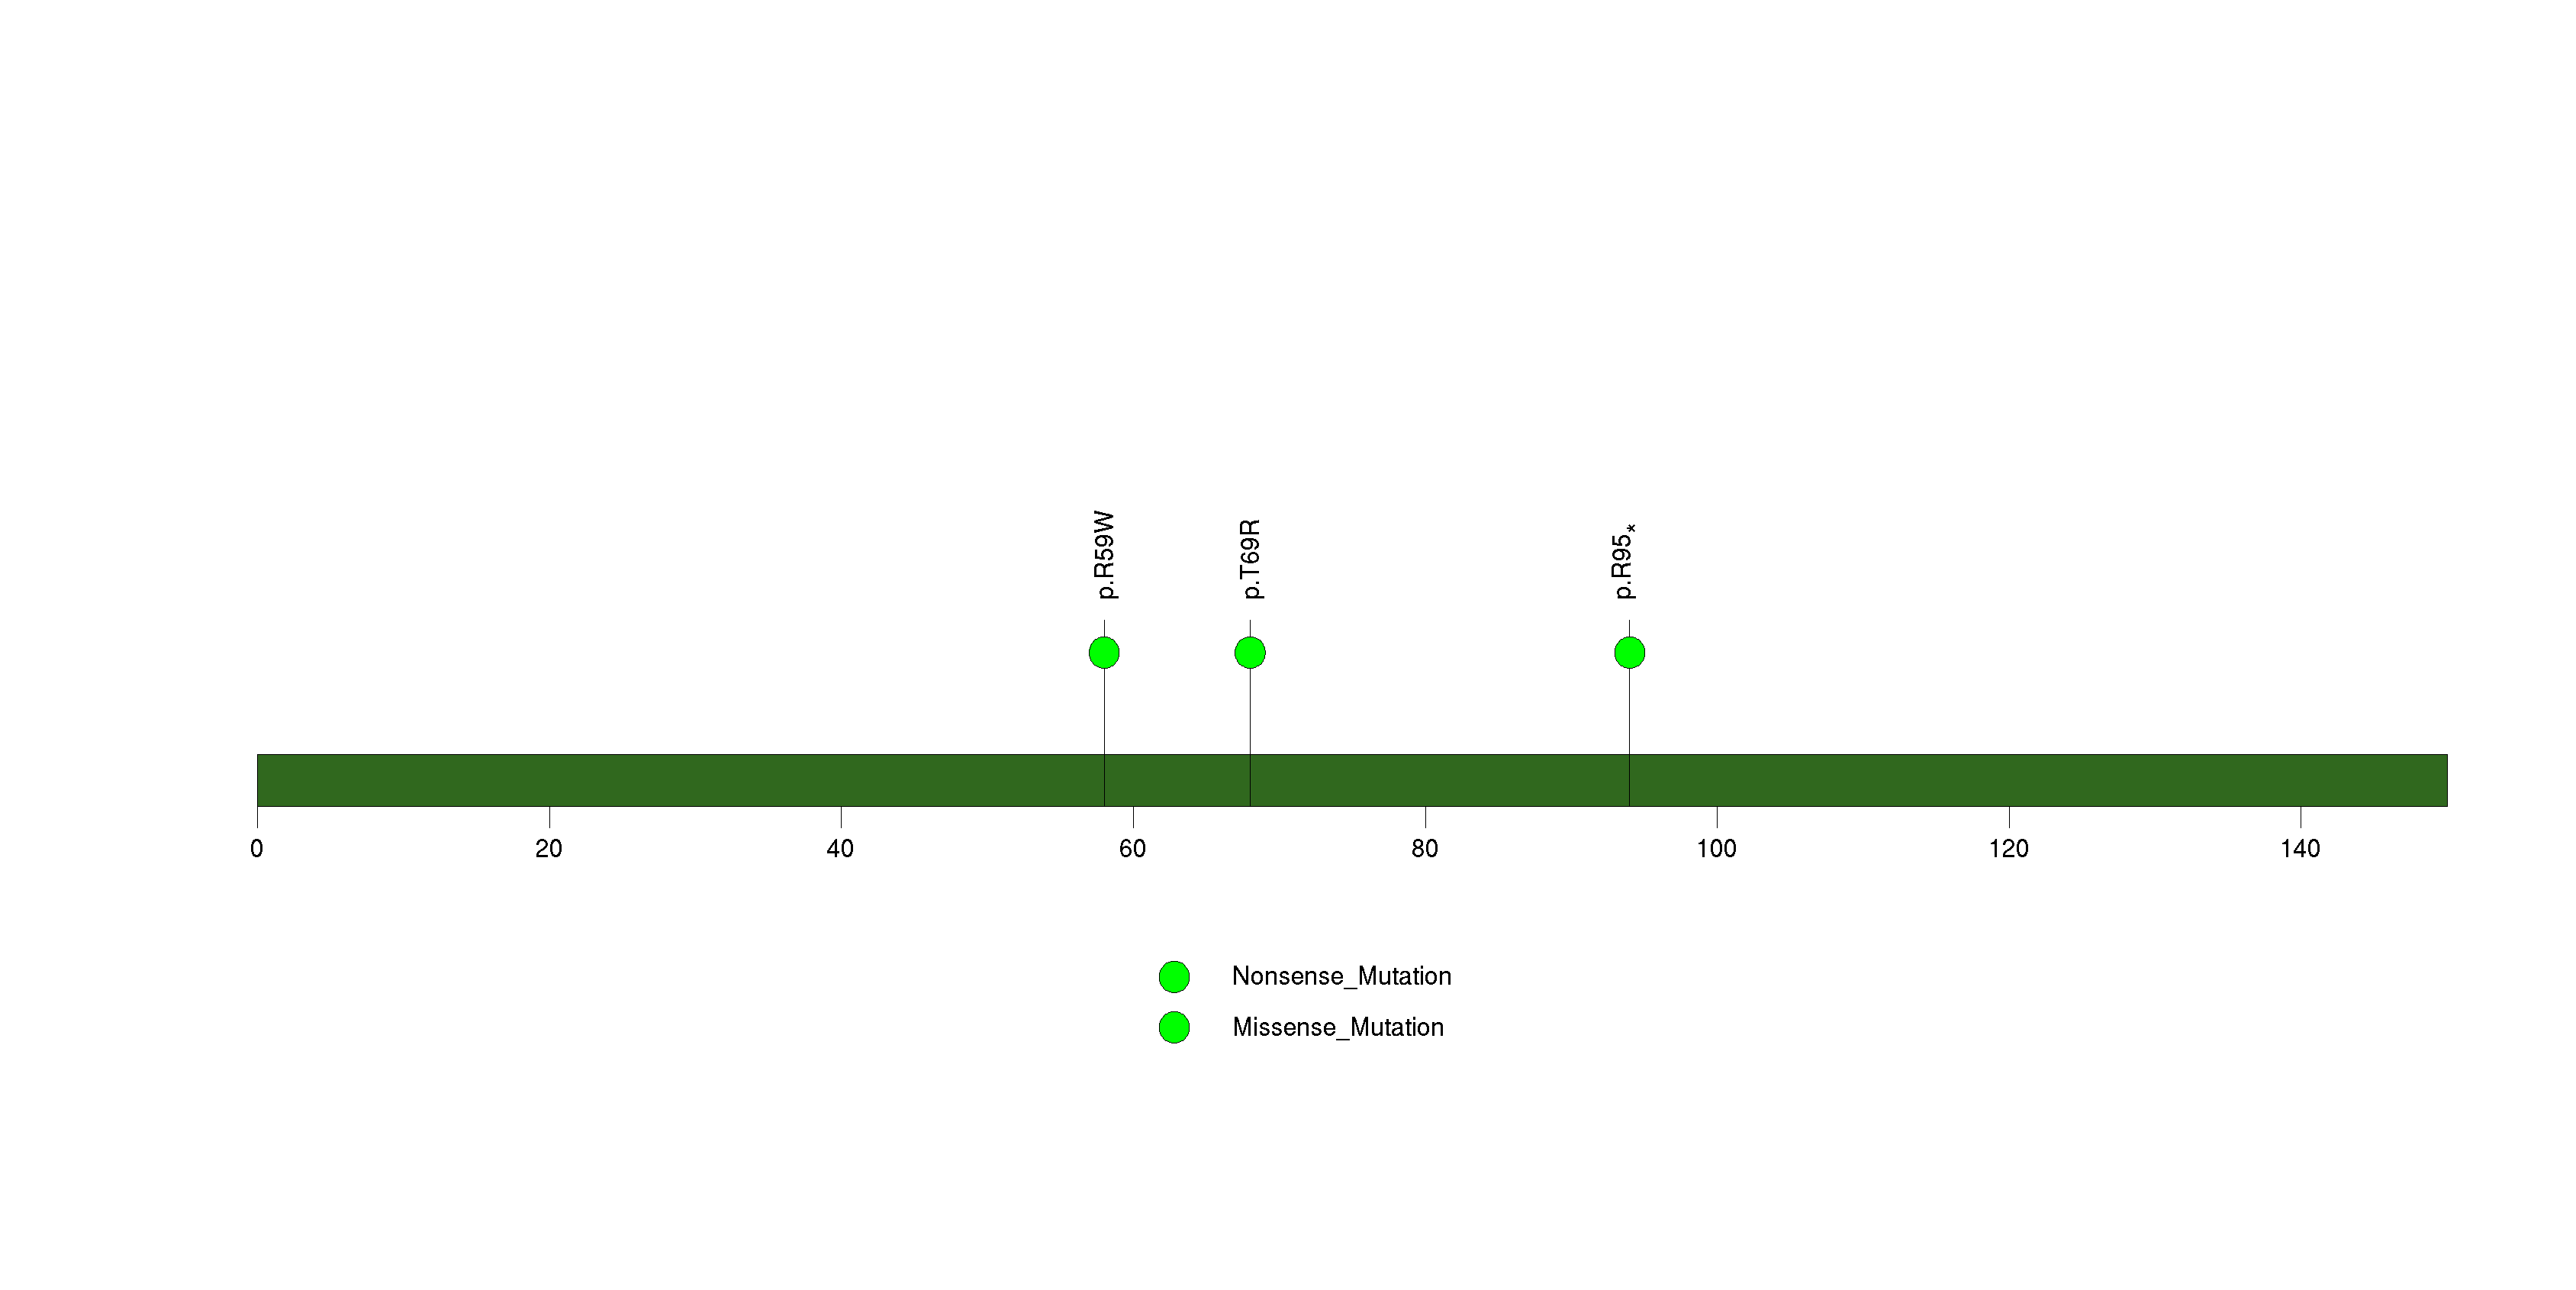
Figure S8. This figure depicts the distribution of mutations and mutation types across the ZNF48 significant gene.
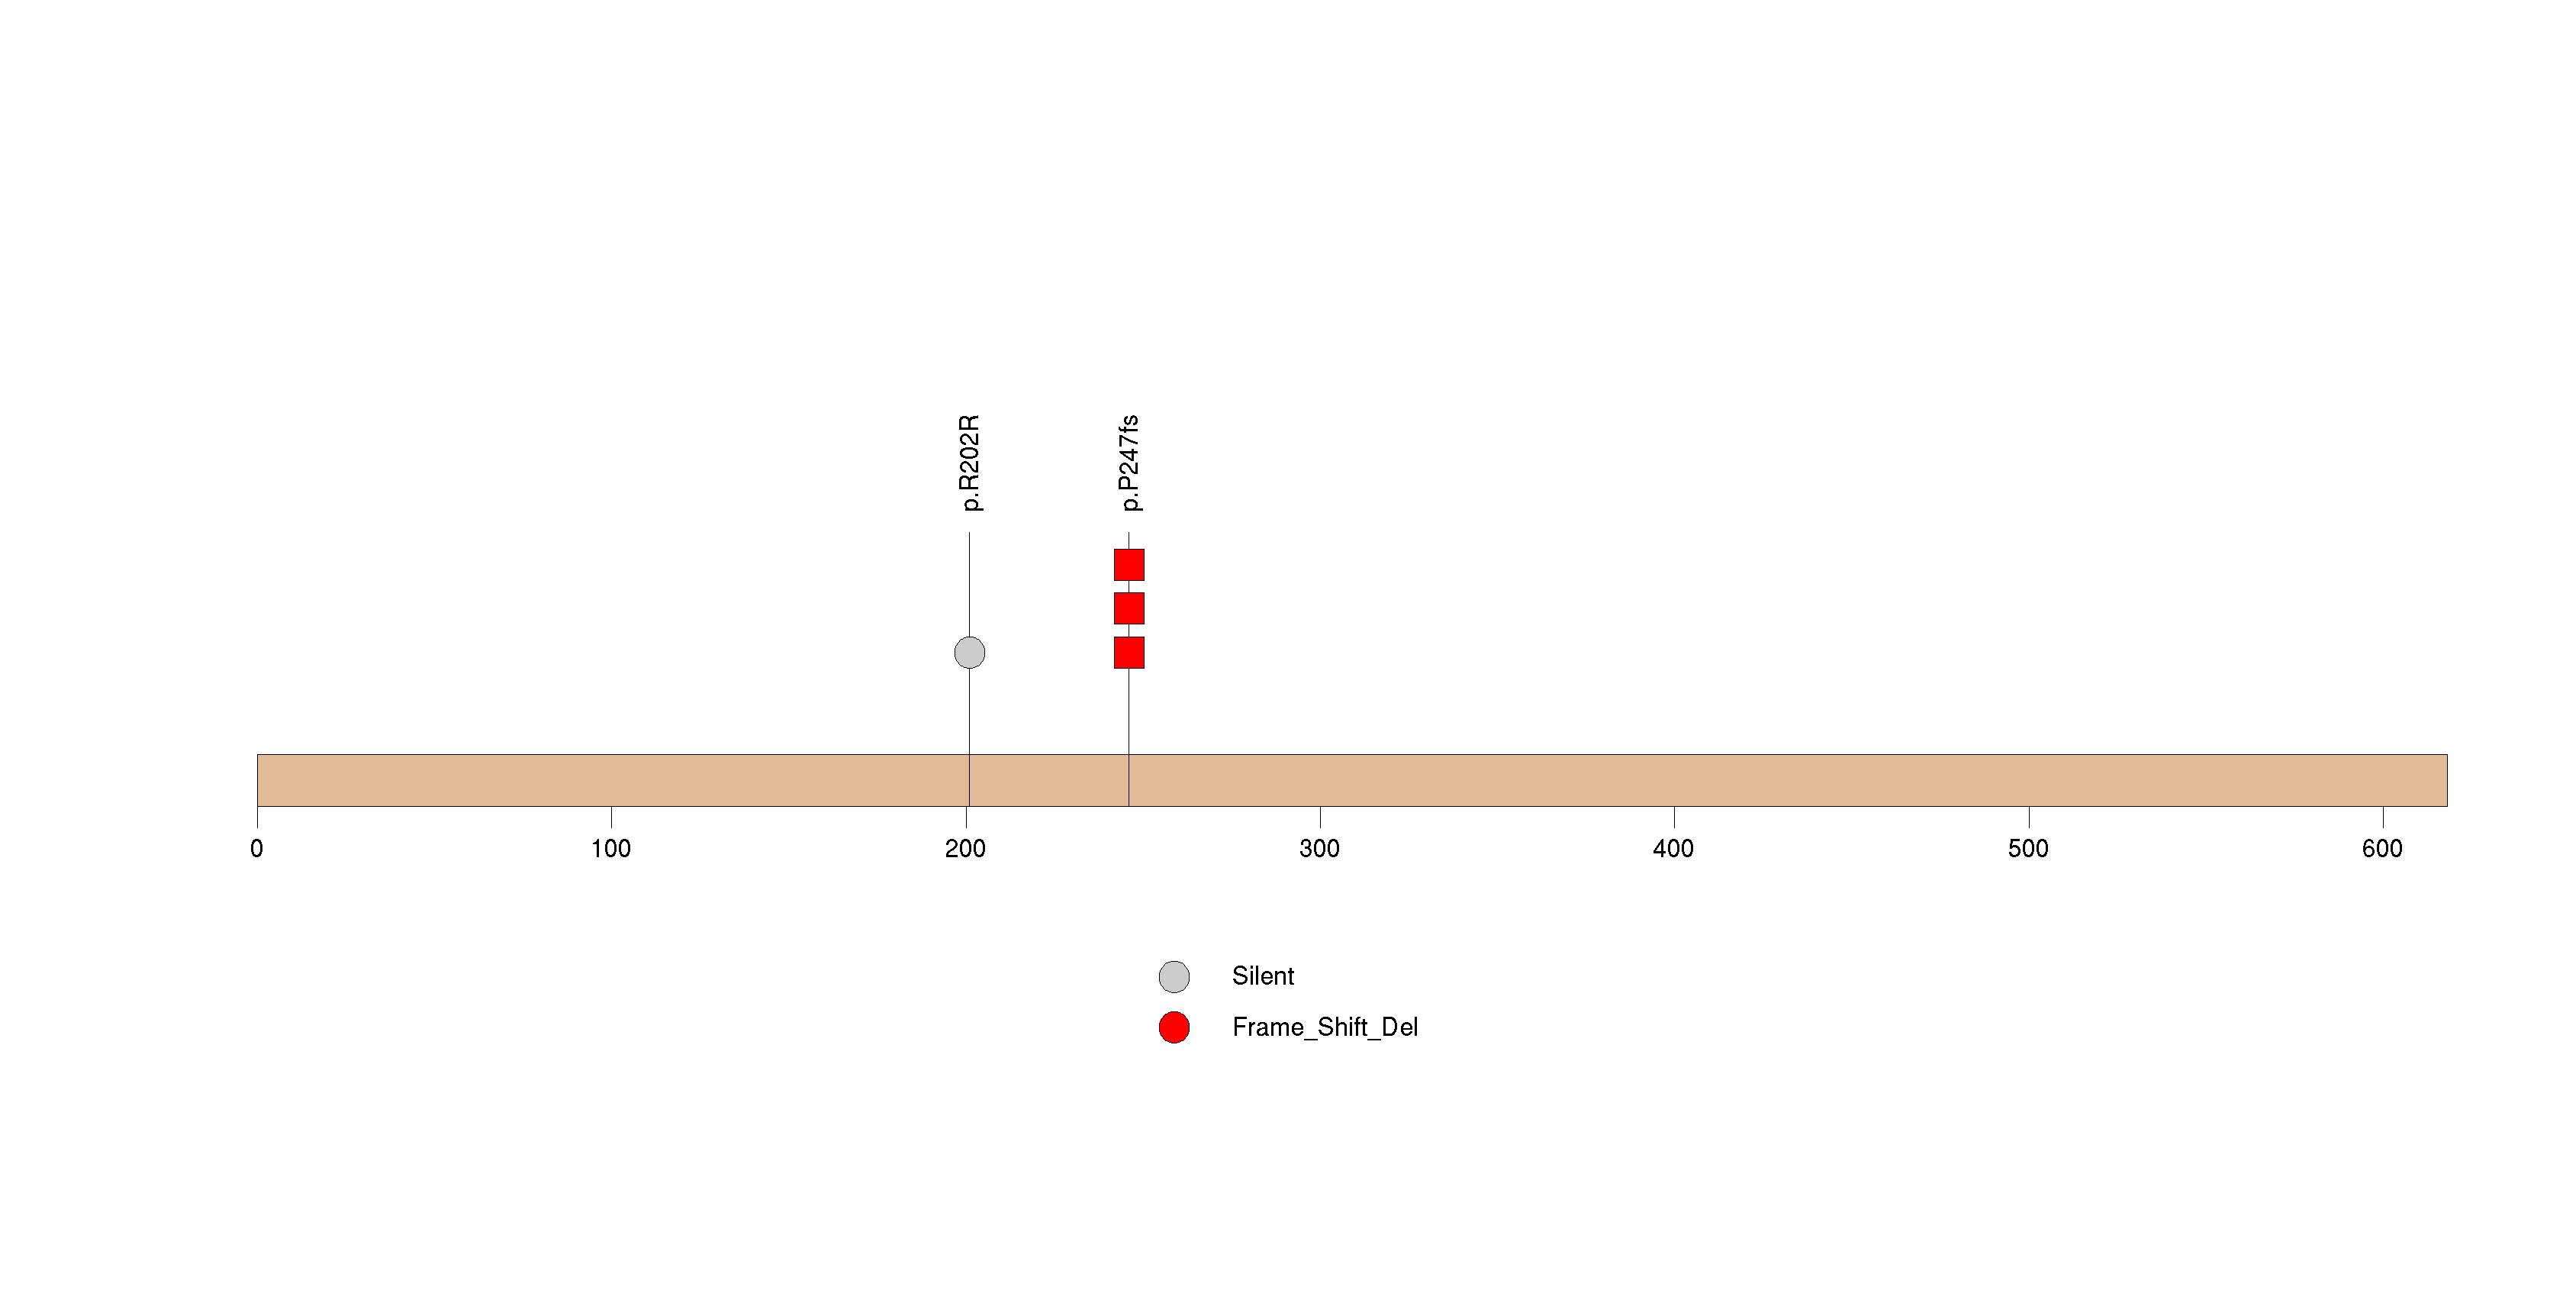
Figure S9. This figure depicts the distribution of mutations and mutation types across the EFNA2 significant gene.
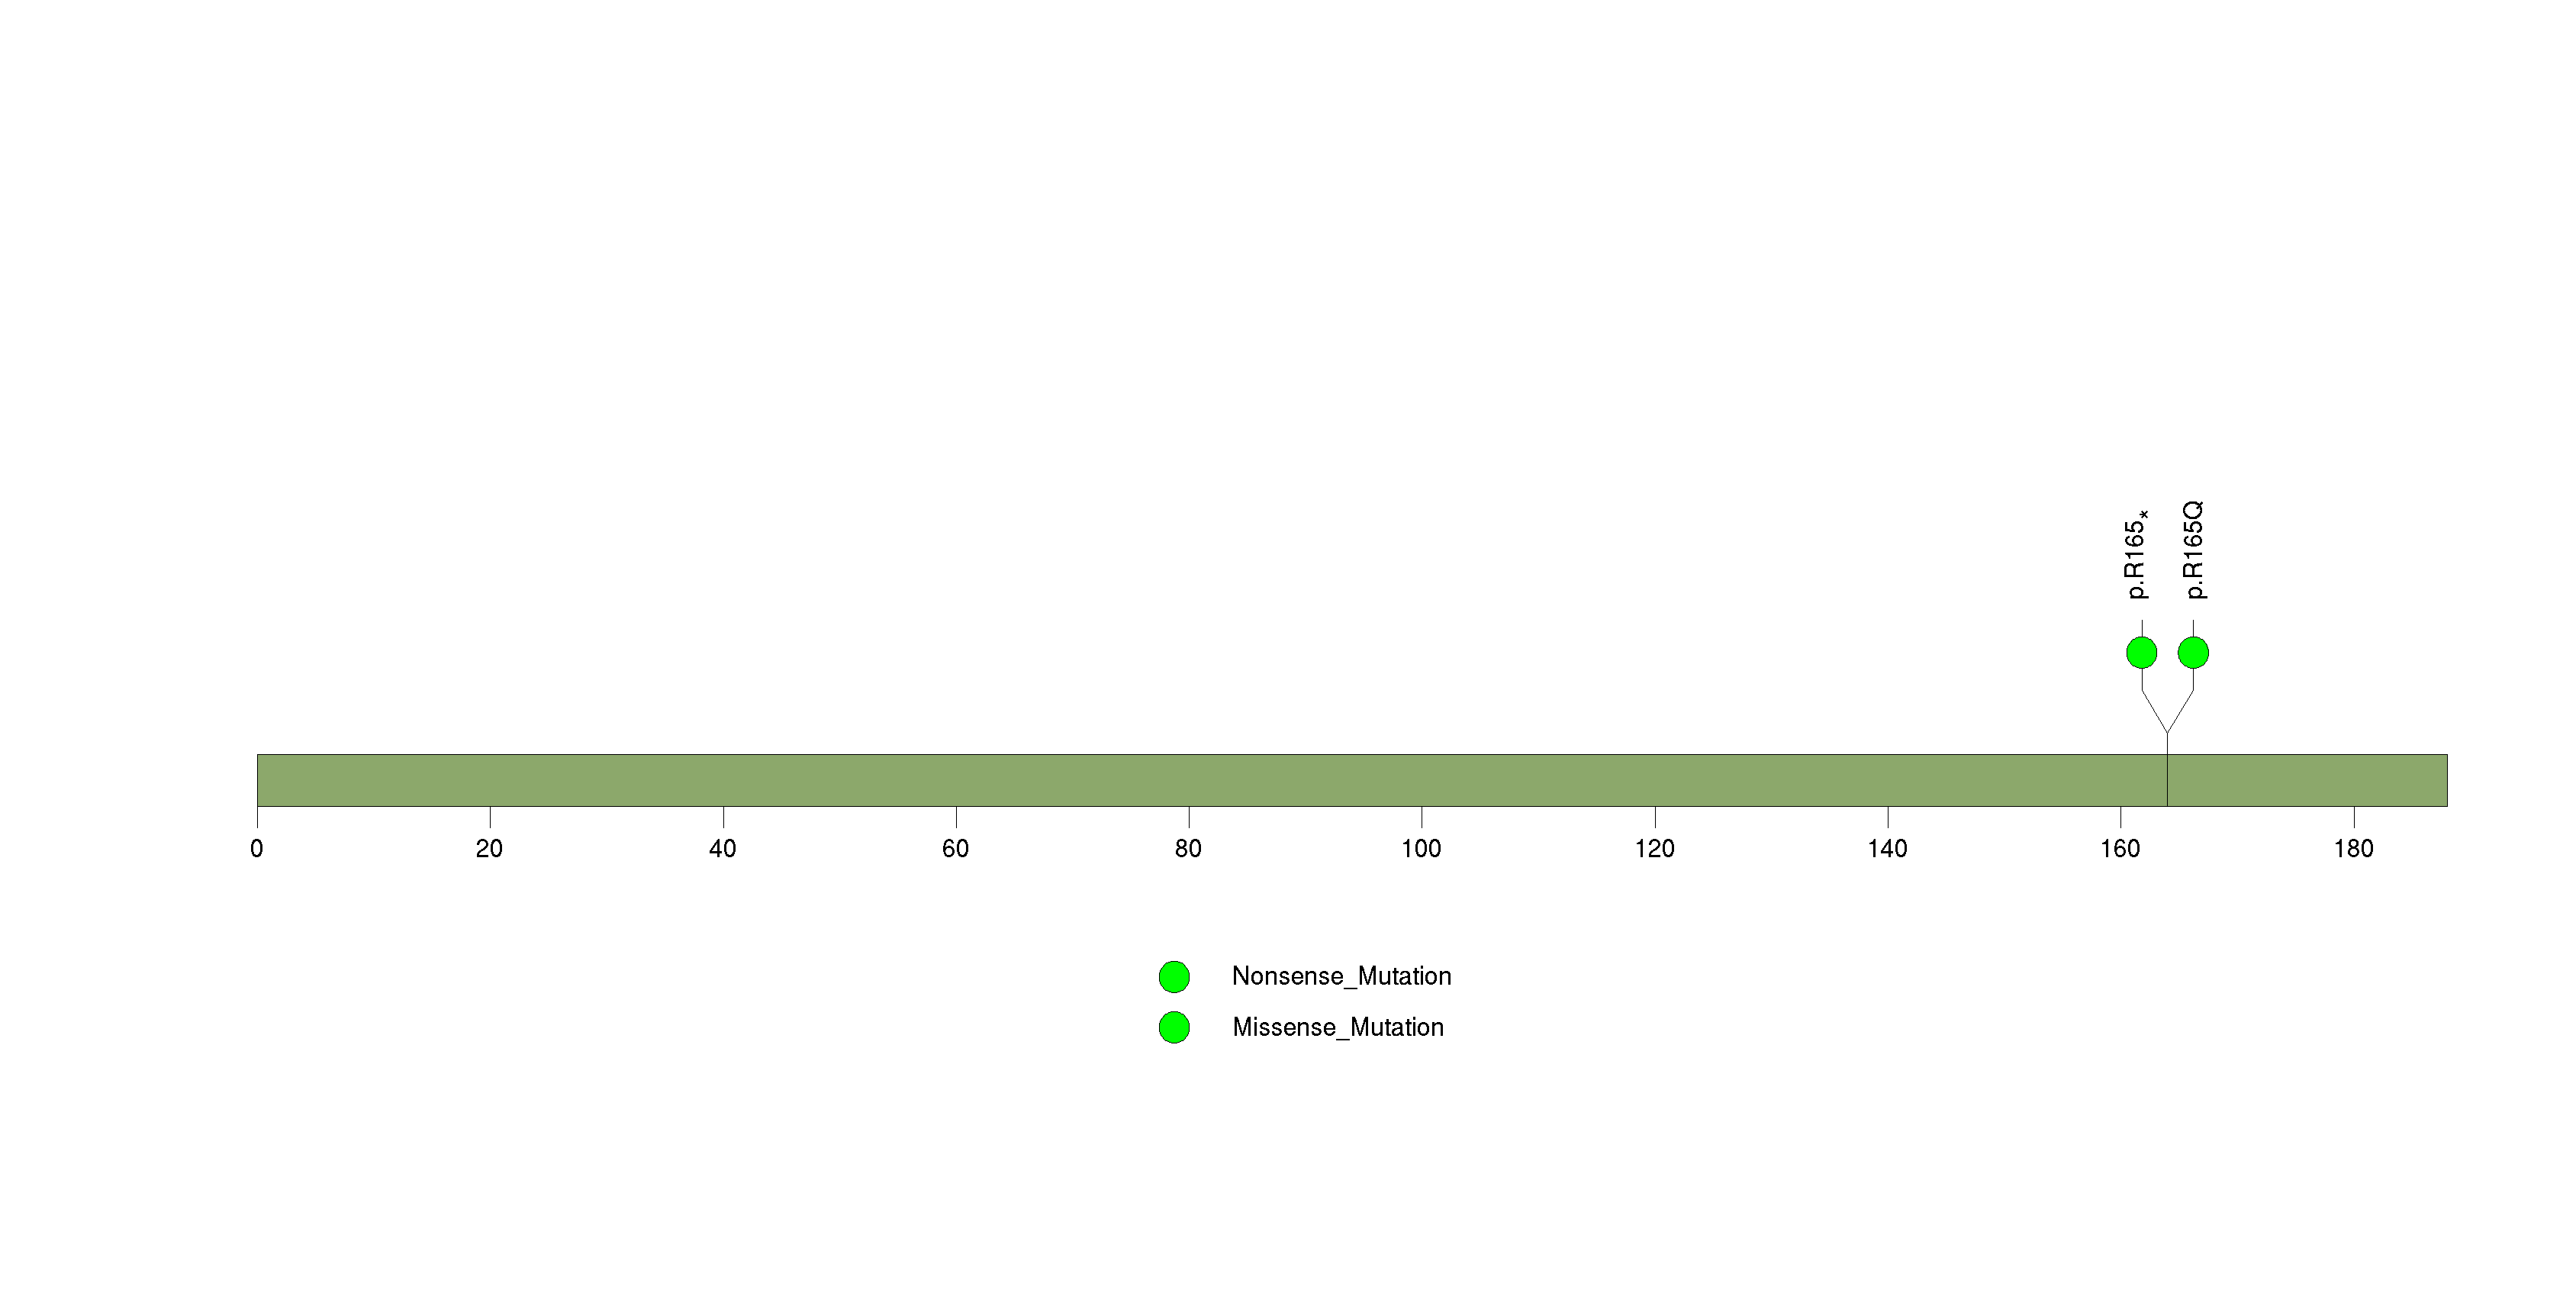
Figure S10. This figure depicts the distribution of mutations and mutation types across the NSF significant gene.
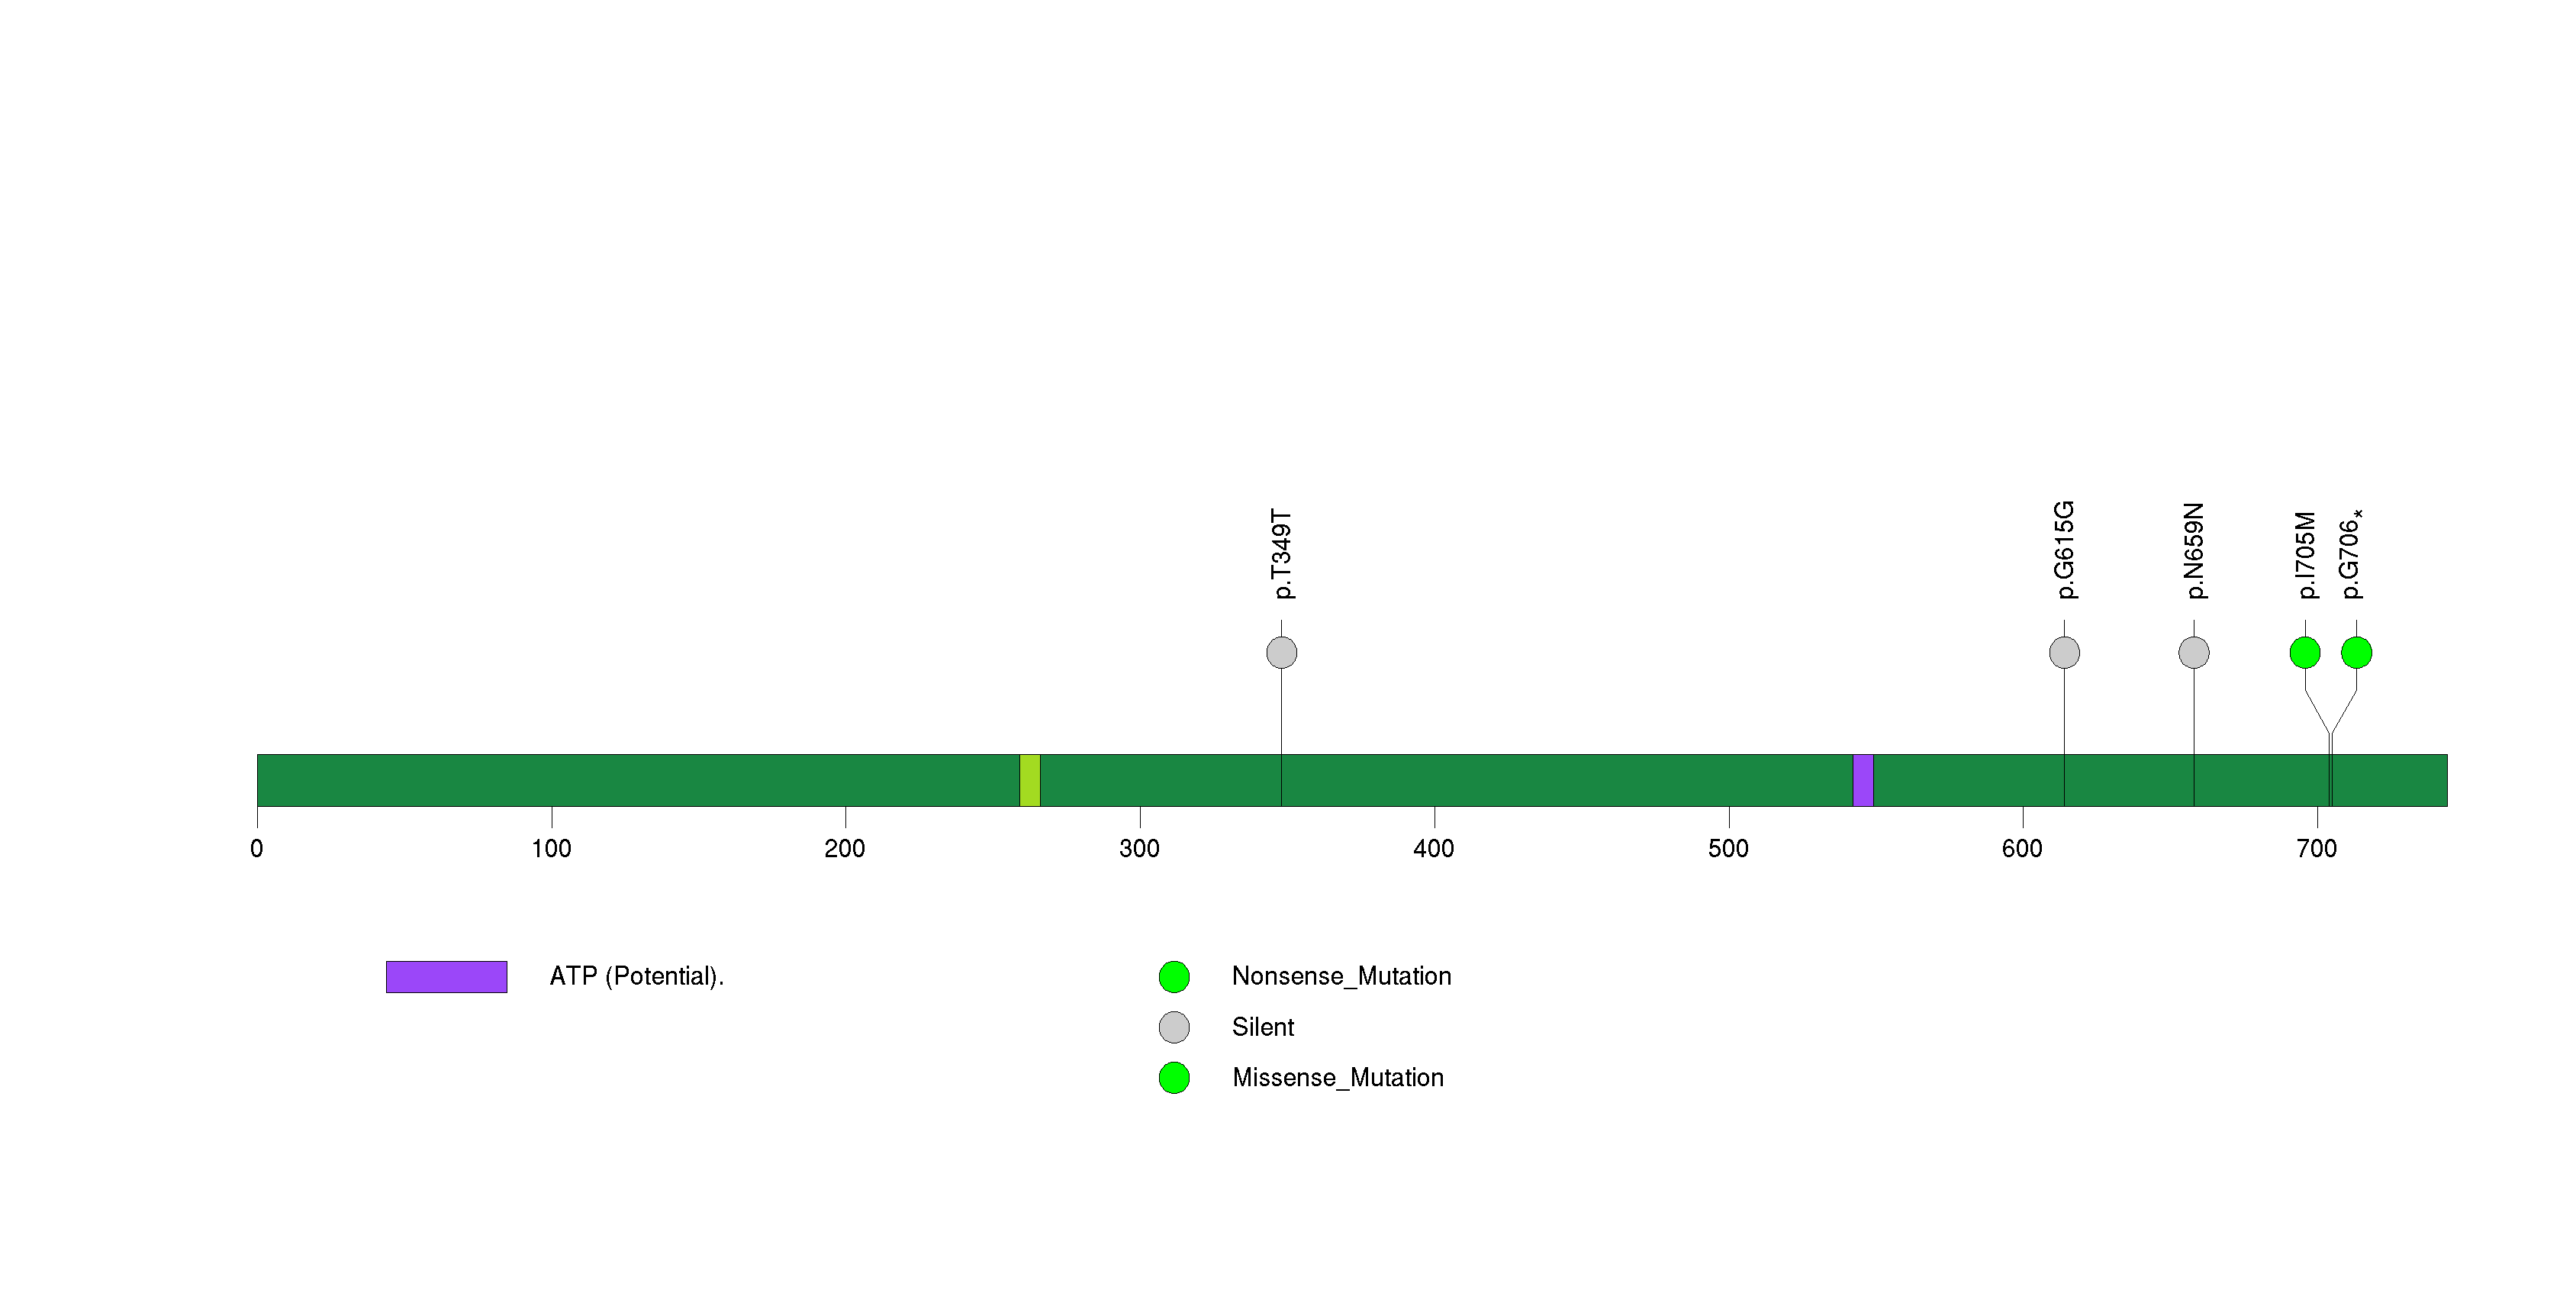
Figure S11. This figure depicts the distribution of mutations and mutation types across the HPGDS significant gene.
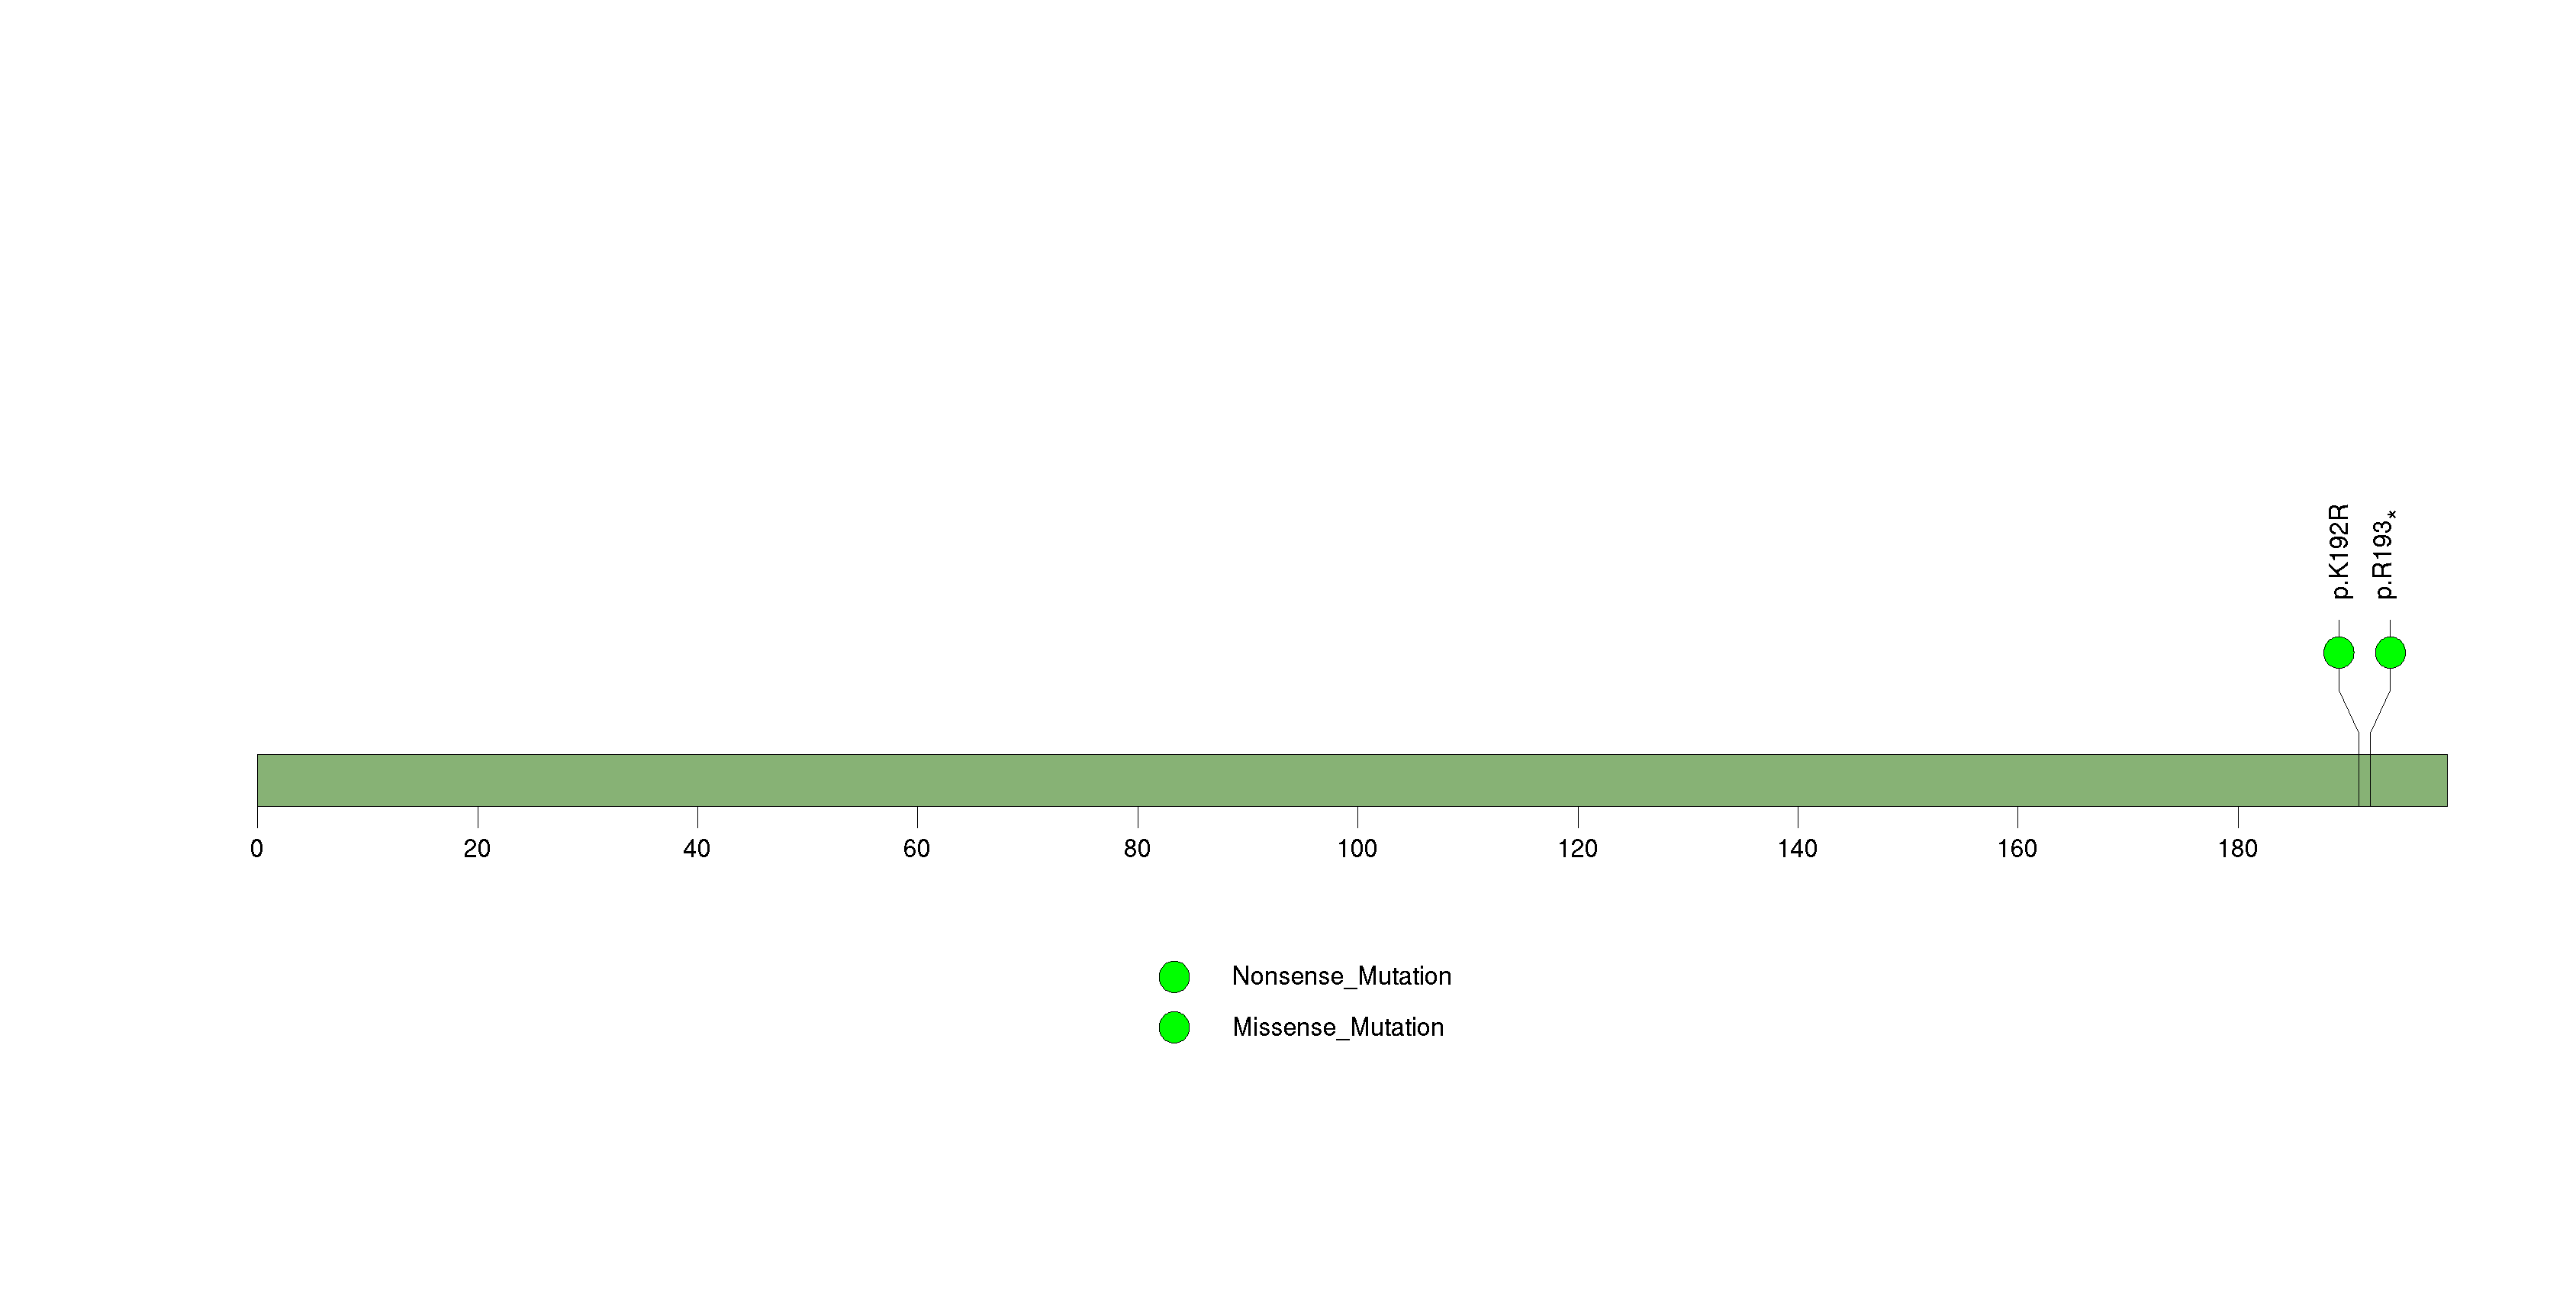
Figure S12. This figure depicts the distribution of mutations and mutation types across the PGM5 significant gene.
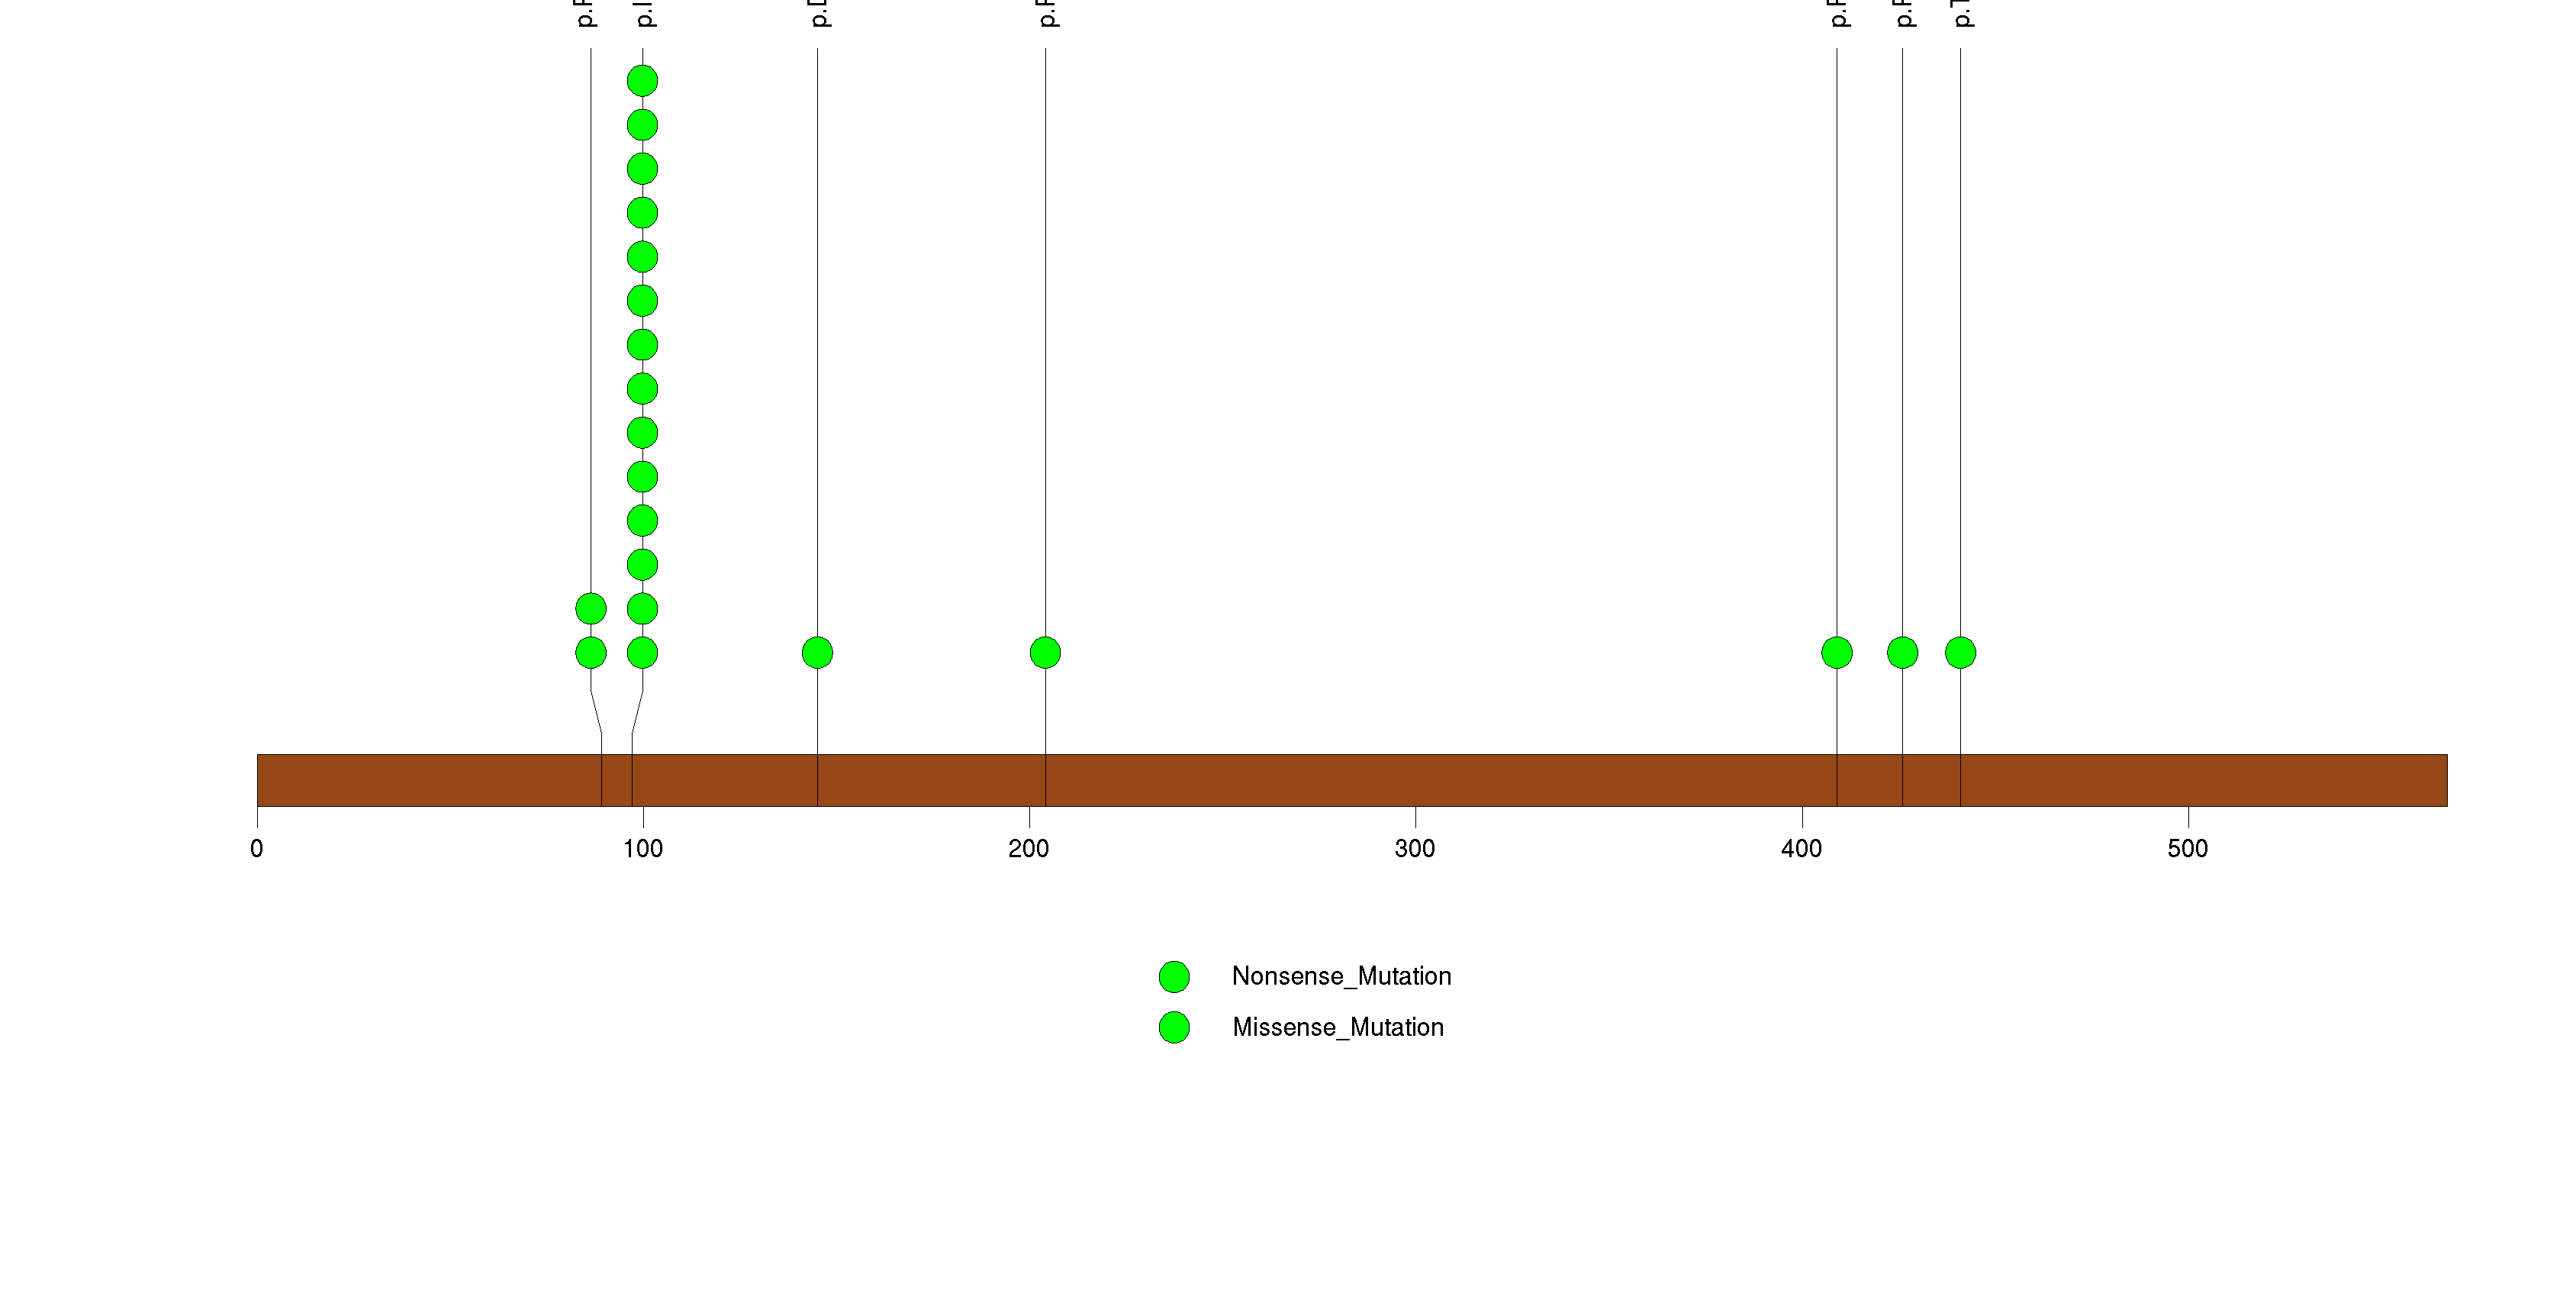
Figure S13. This figure depicts the distribution of mutations and mutation types across the ARID1A significant gene.
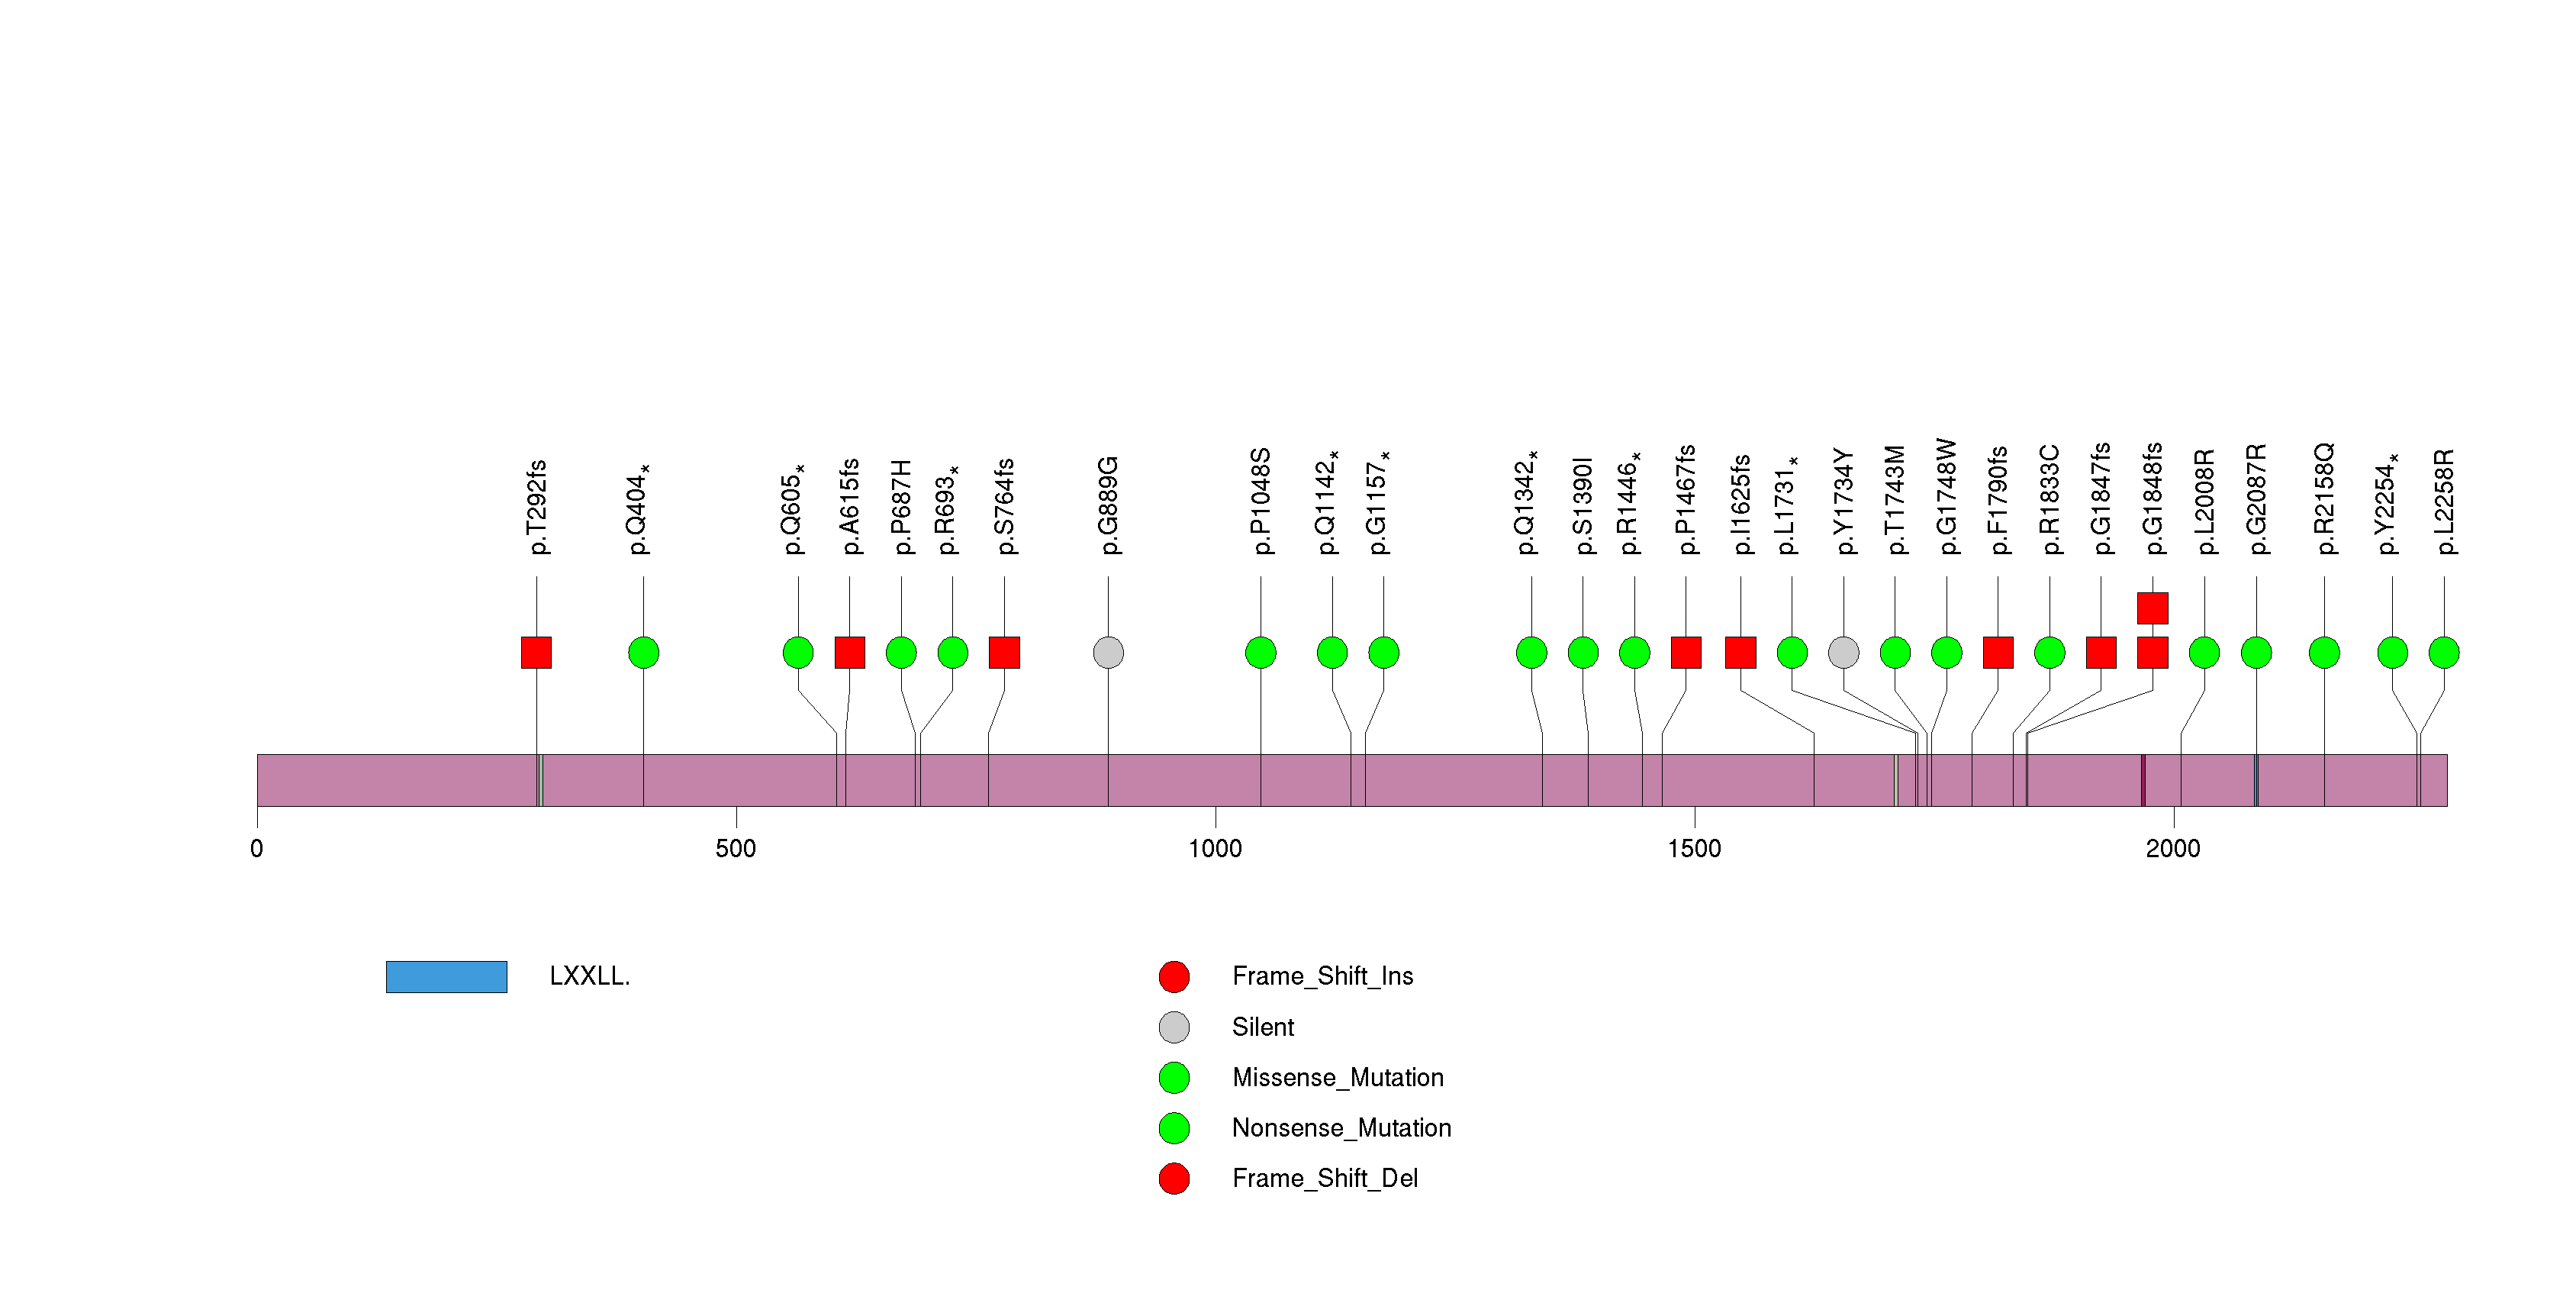
Figure S14. This figure depicts the distribution of mutations and mutation types across the RHOA significant gene.
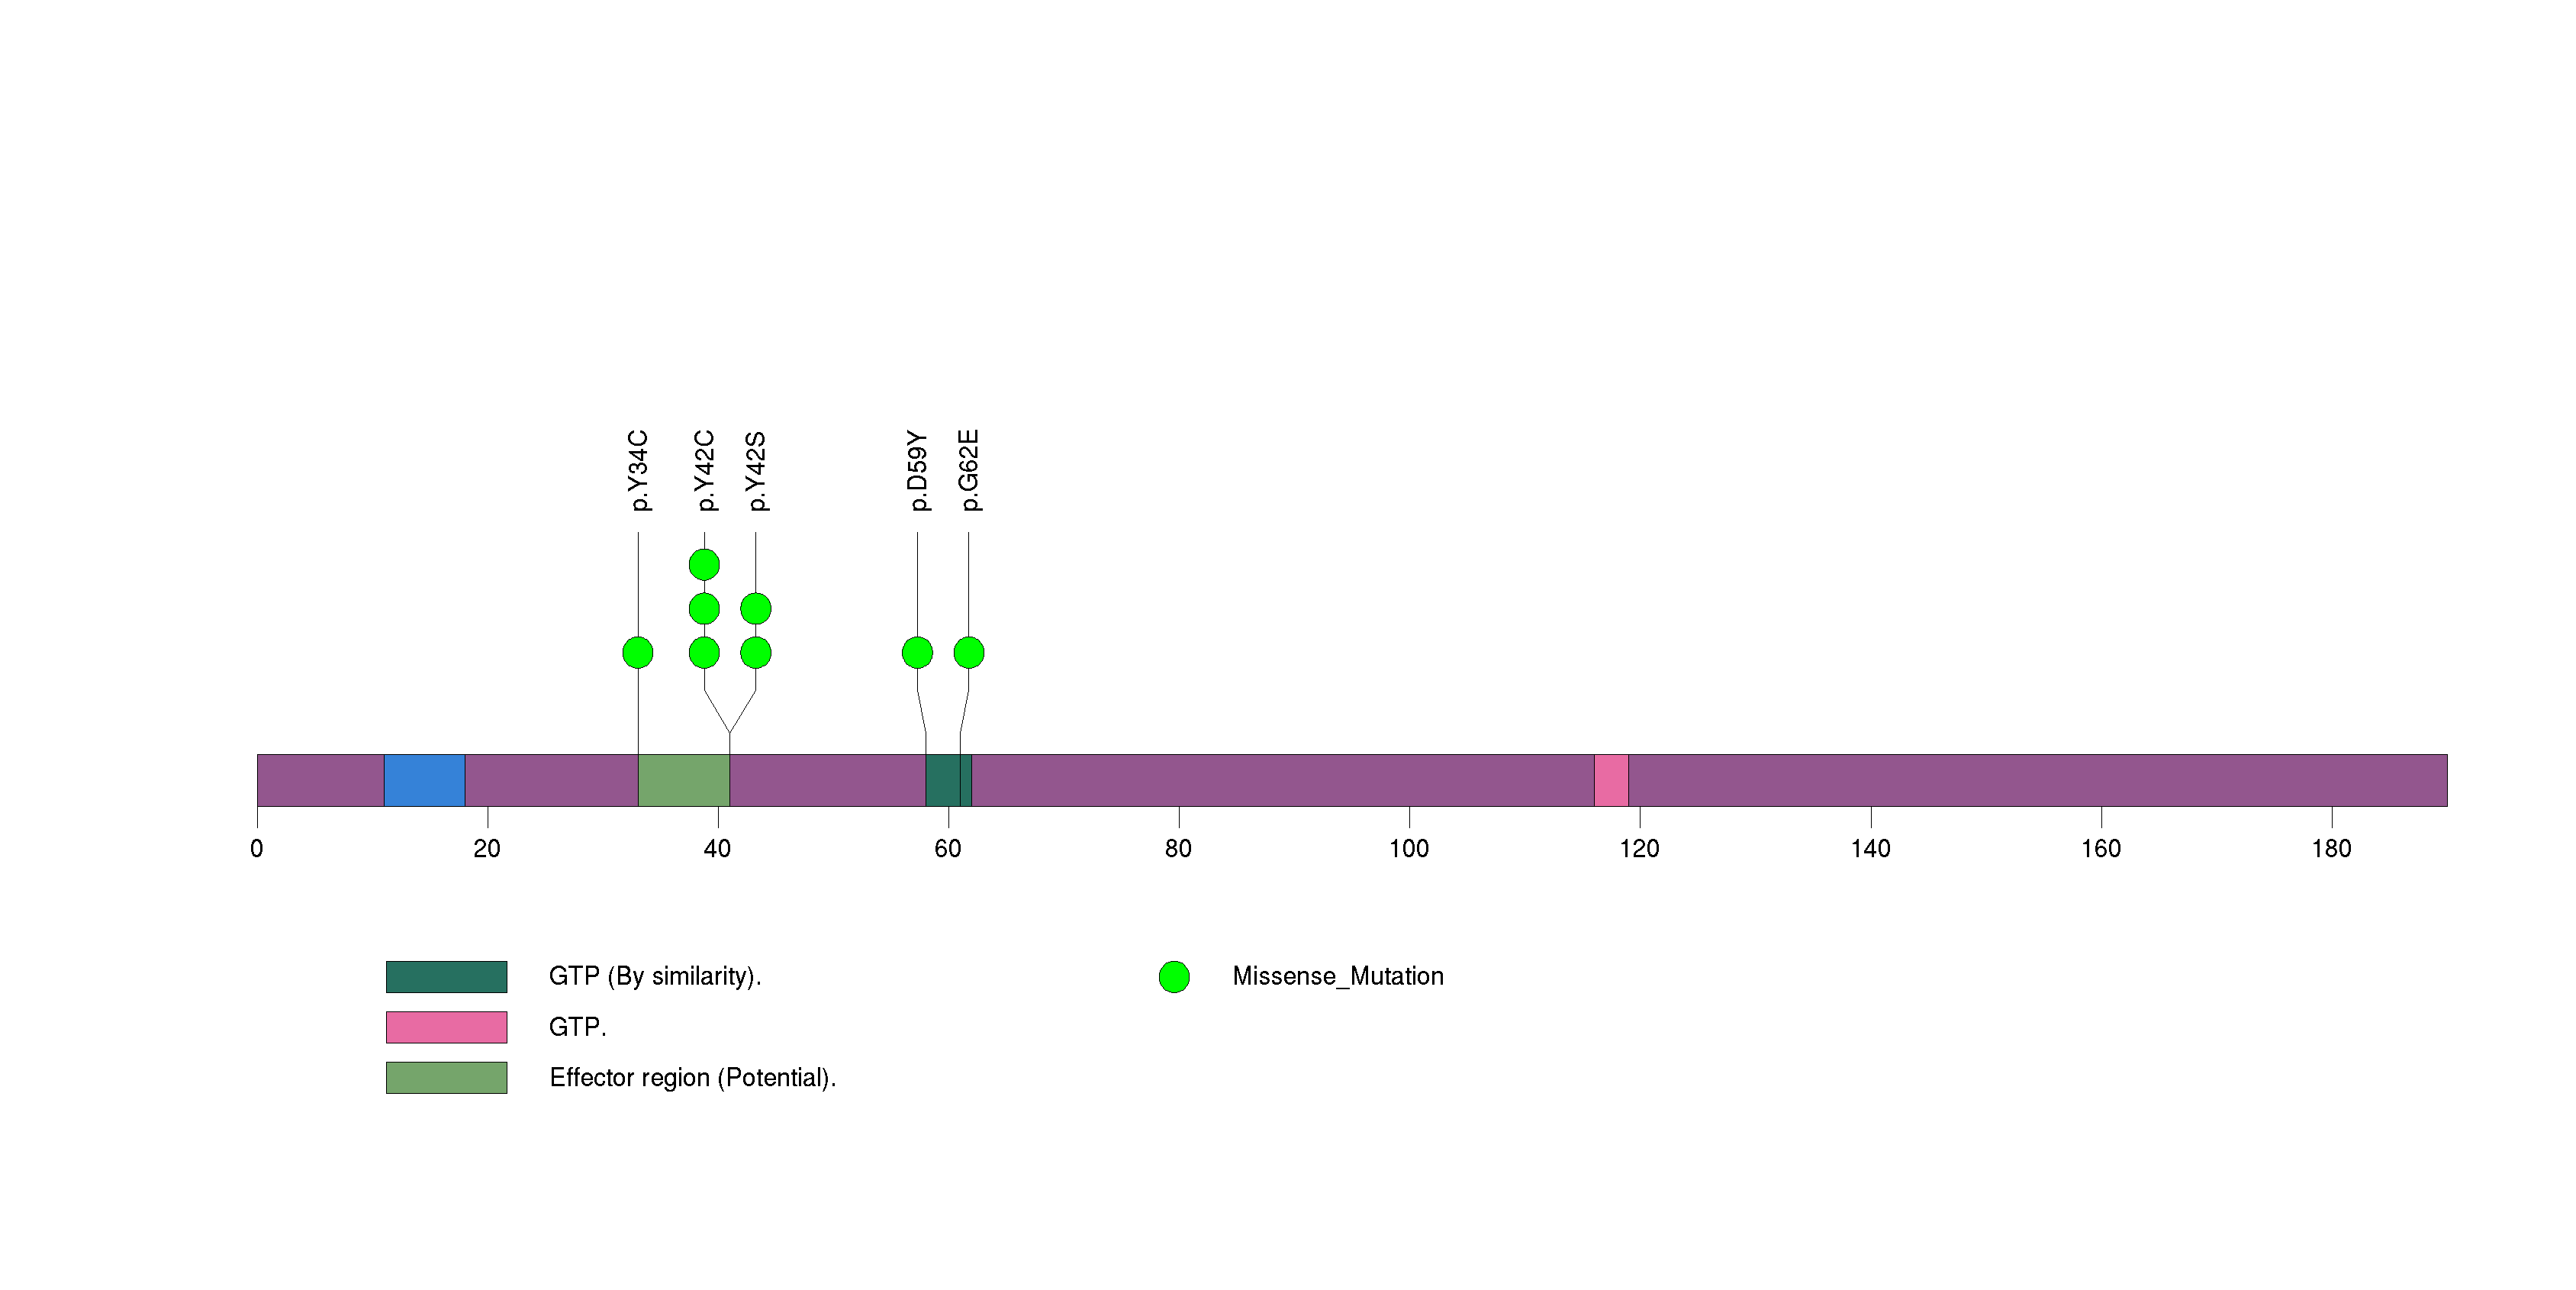
Figure S15. This figure depicts the distribution of mutations and mutation types across the PIK3CA significant gene.
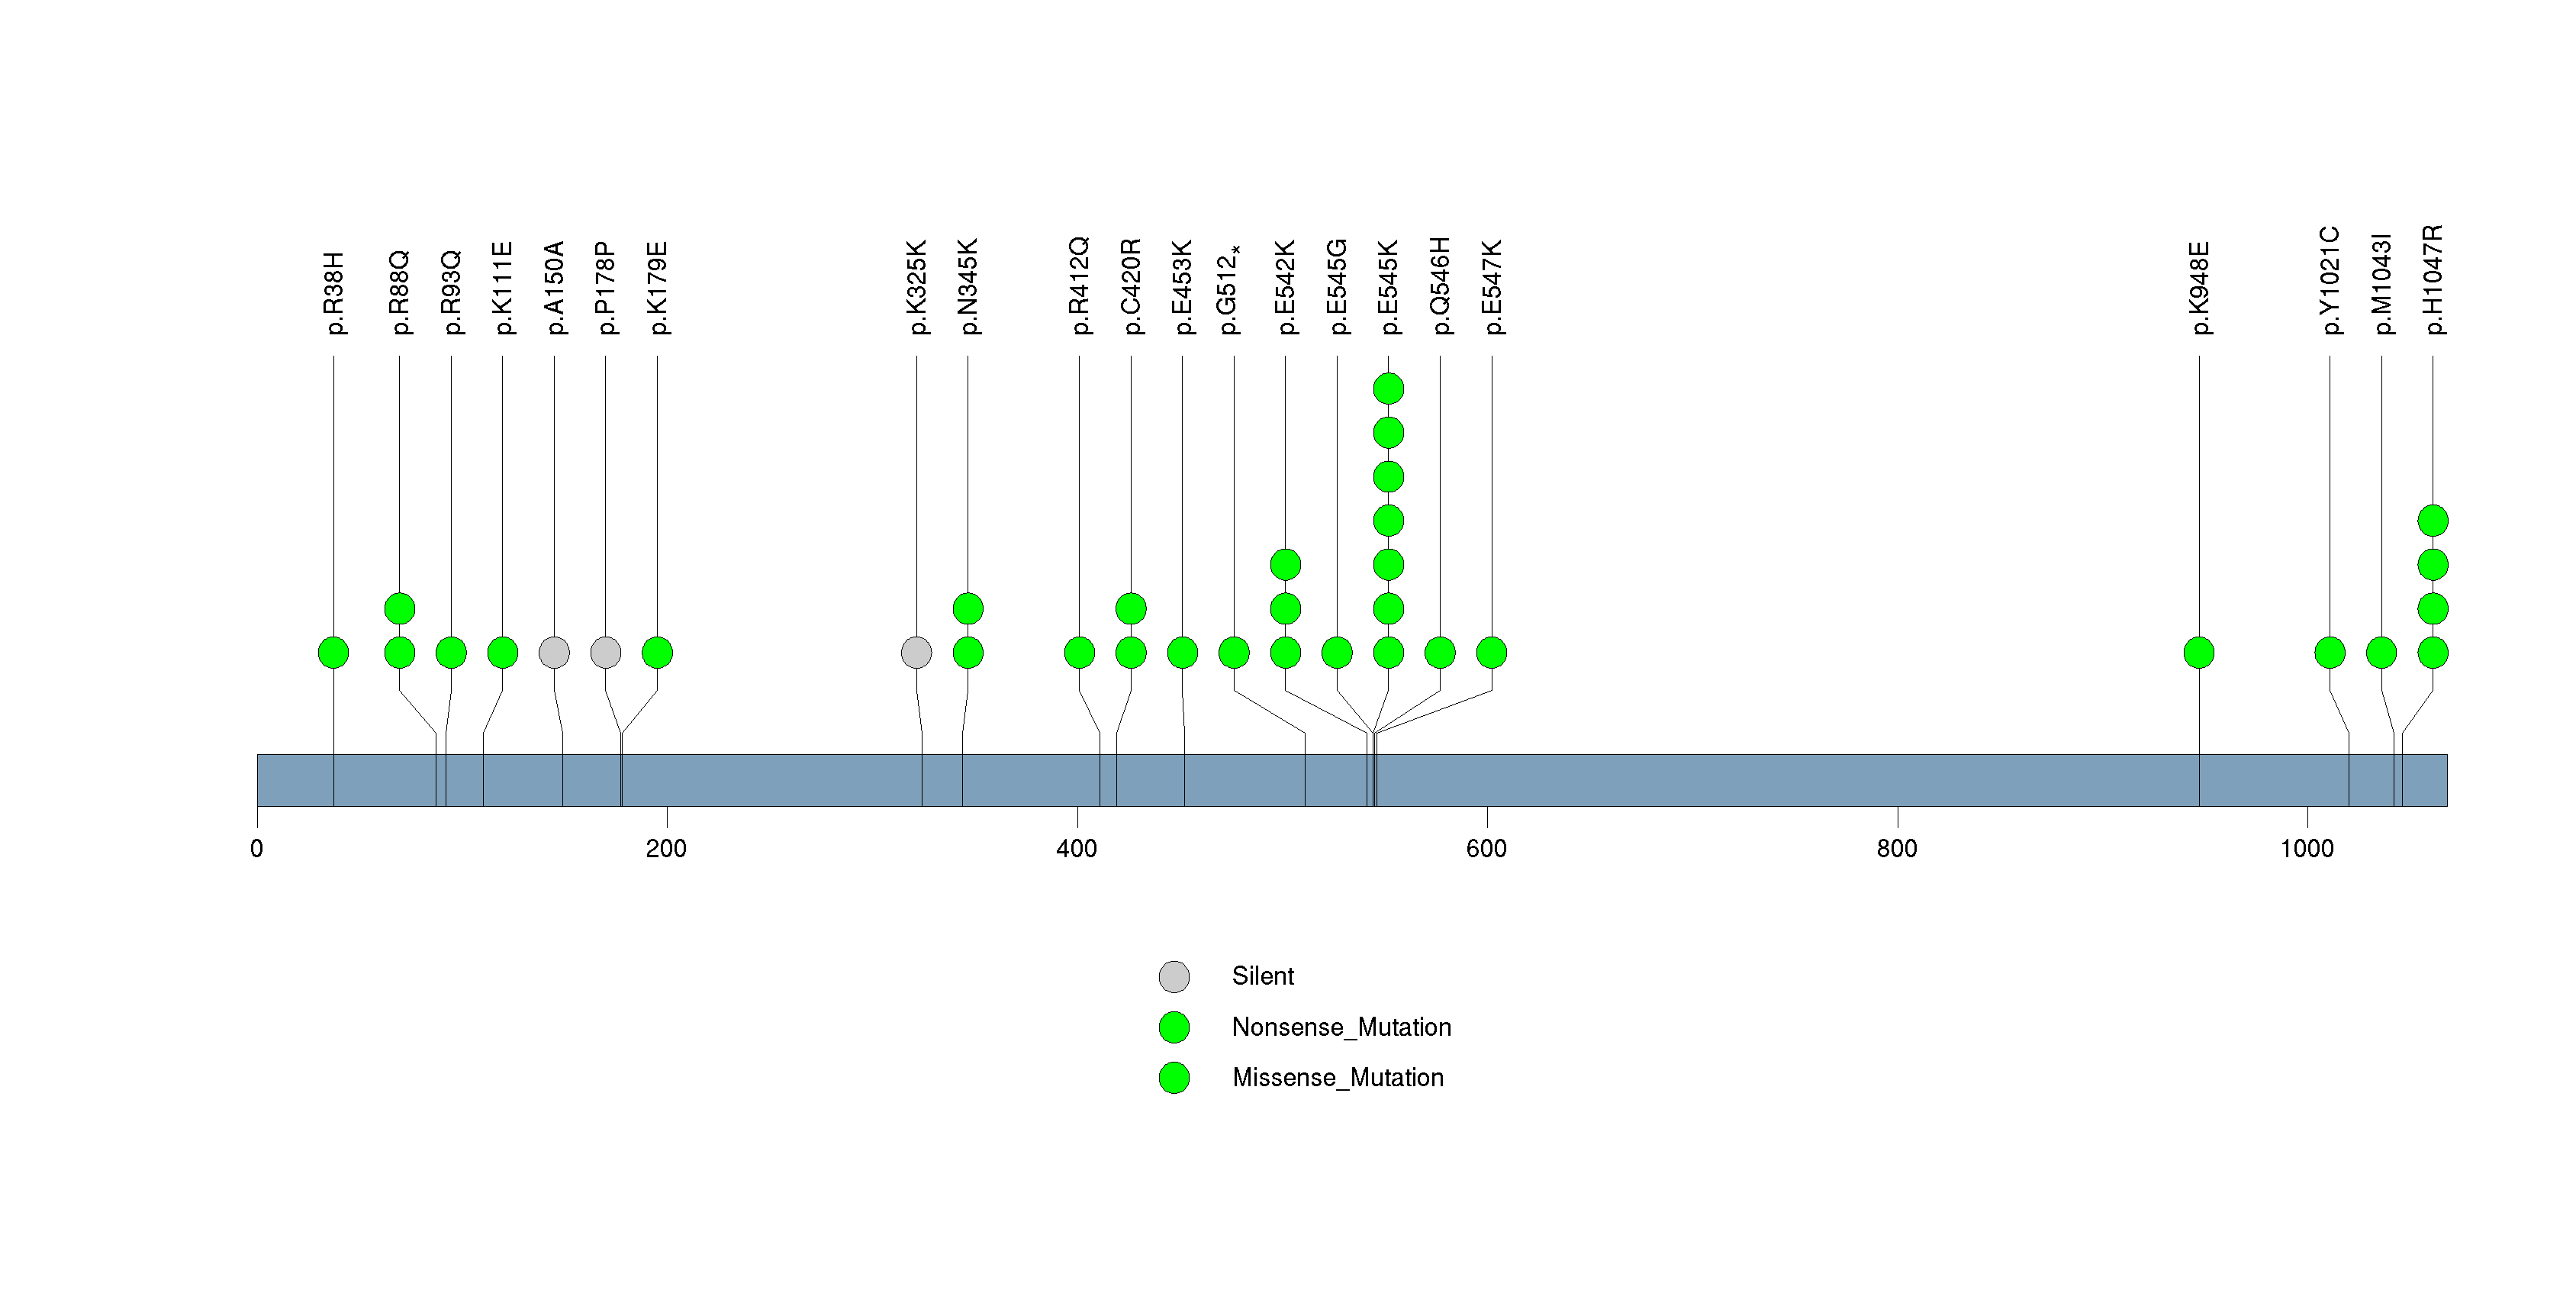
Figure S16. This figure depicts the distribution of mutations and mutation types across the INO80E significant gene.
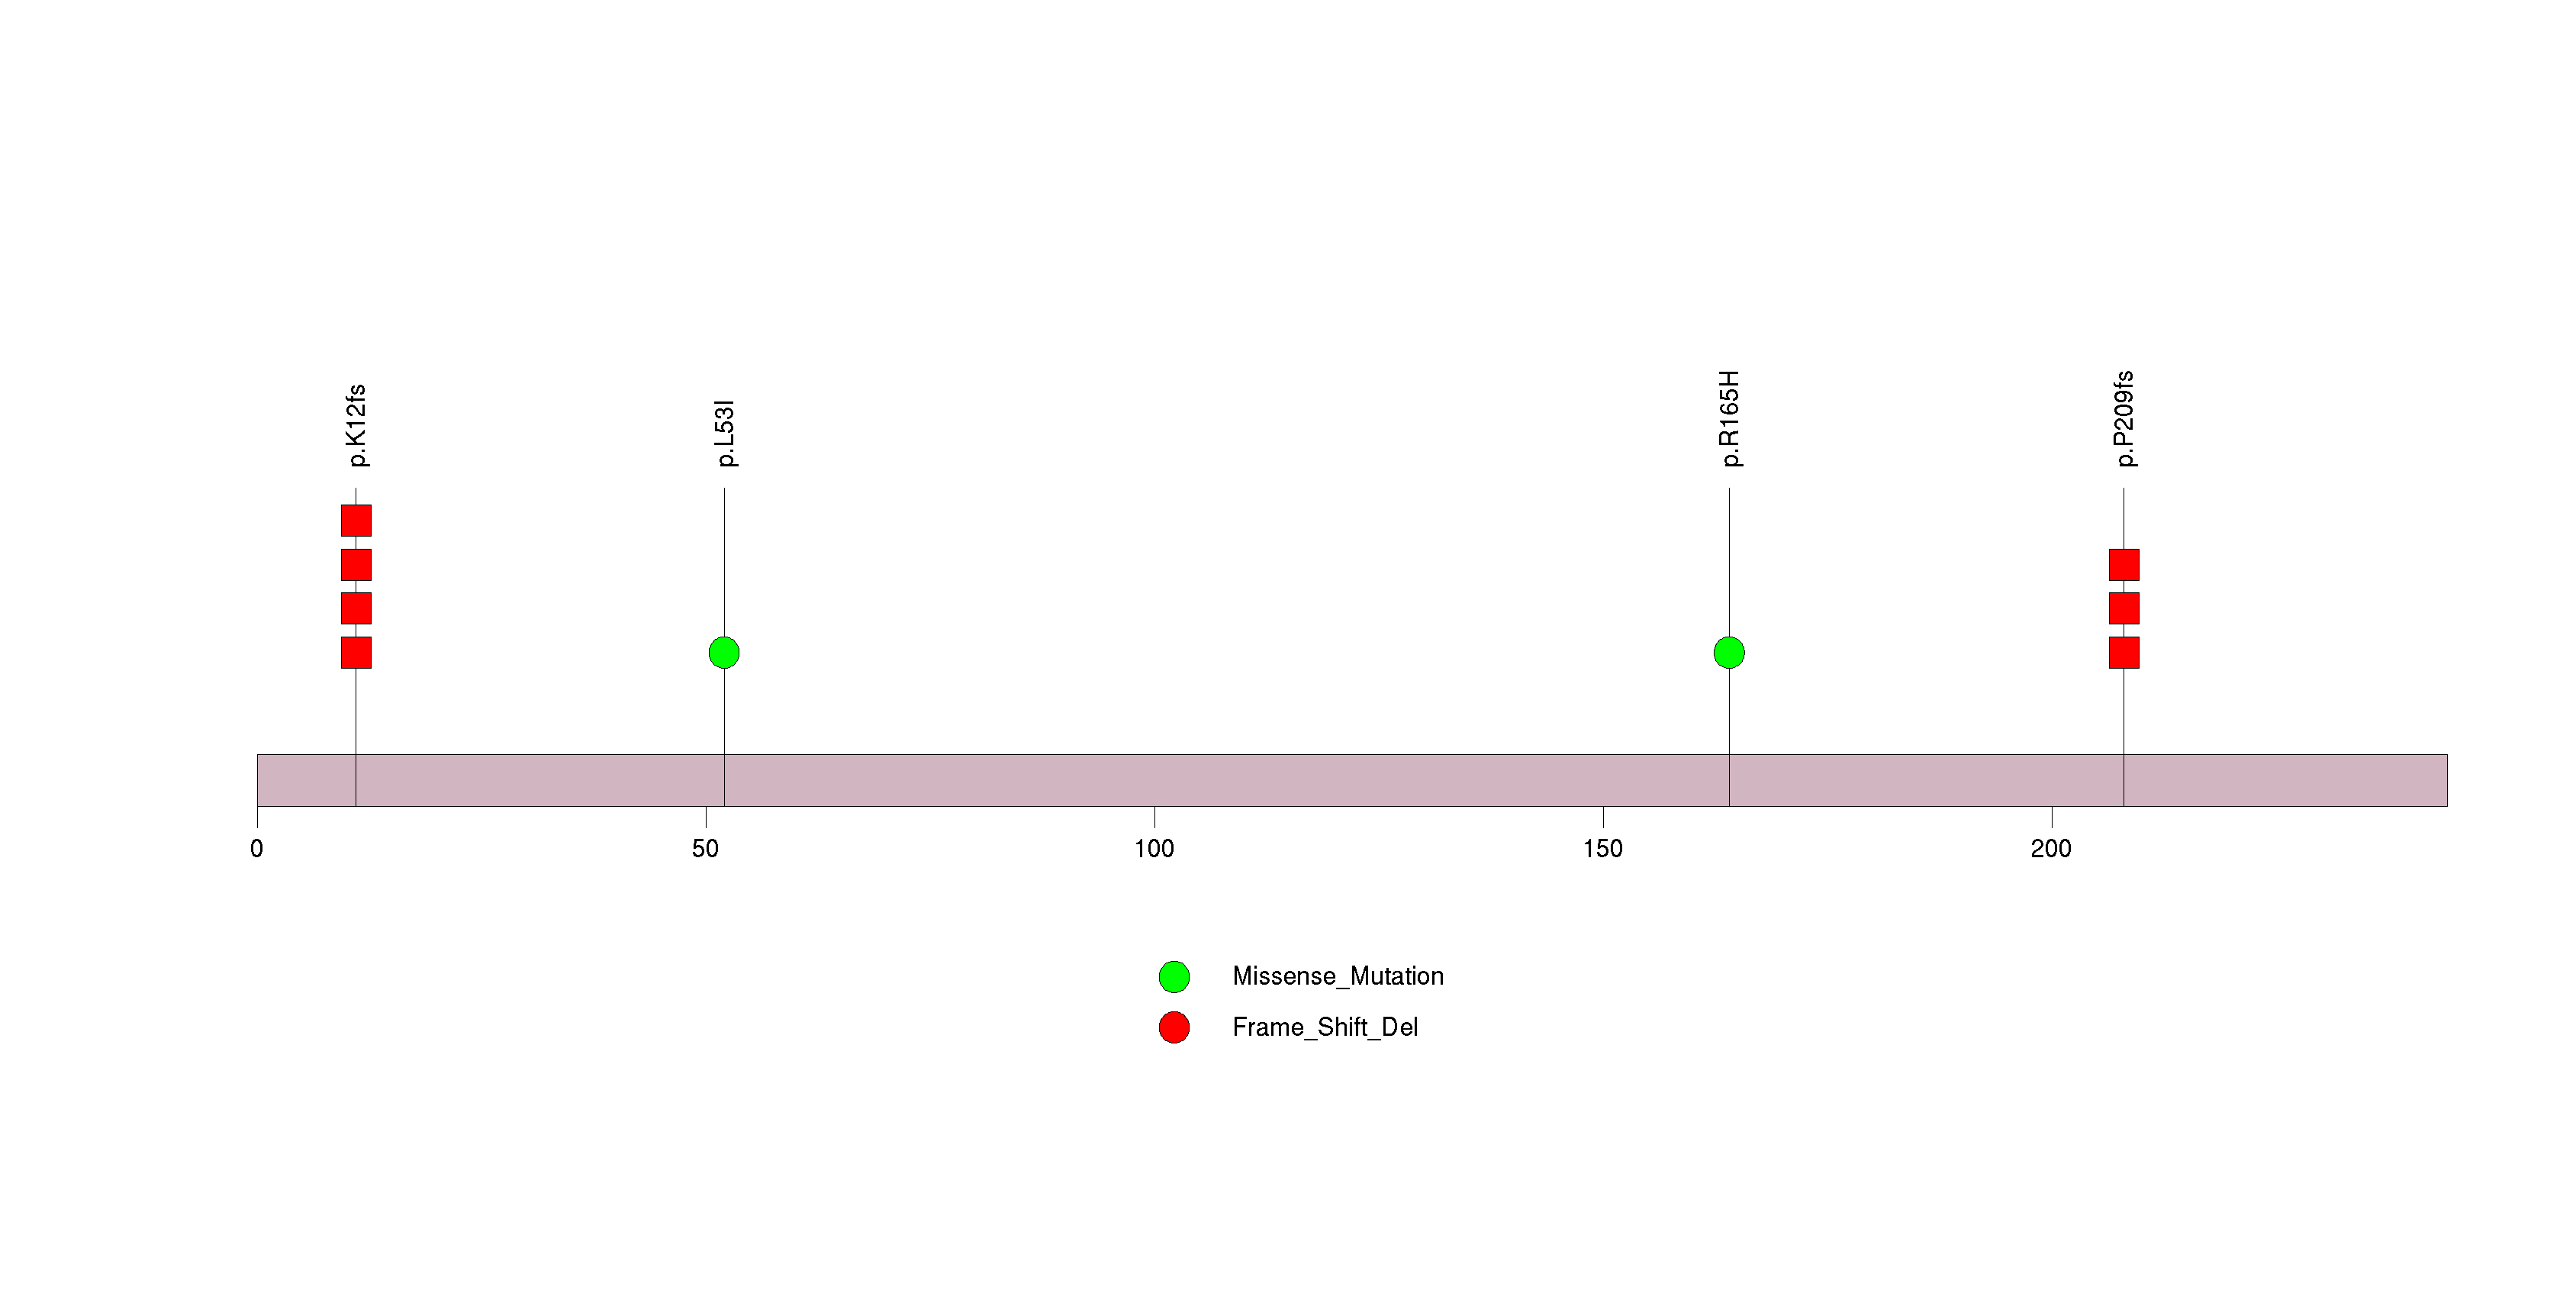
Figure S17. This figure depicts the distribution of mutations and mutation types across the FGF22 significant gene.
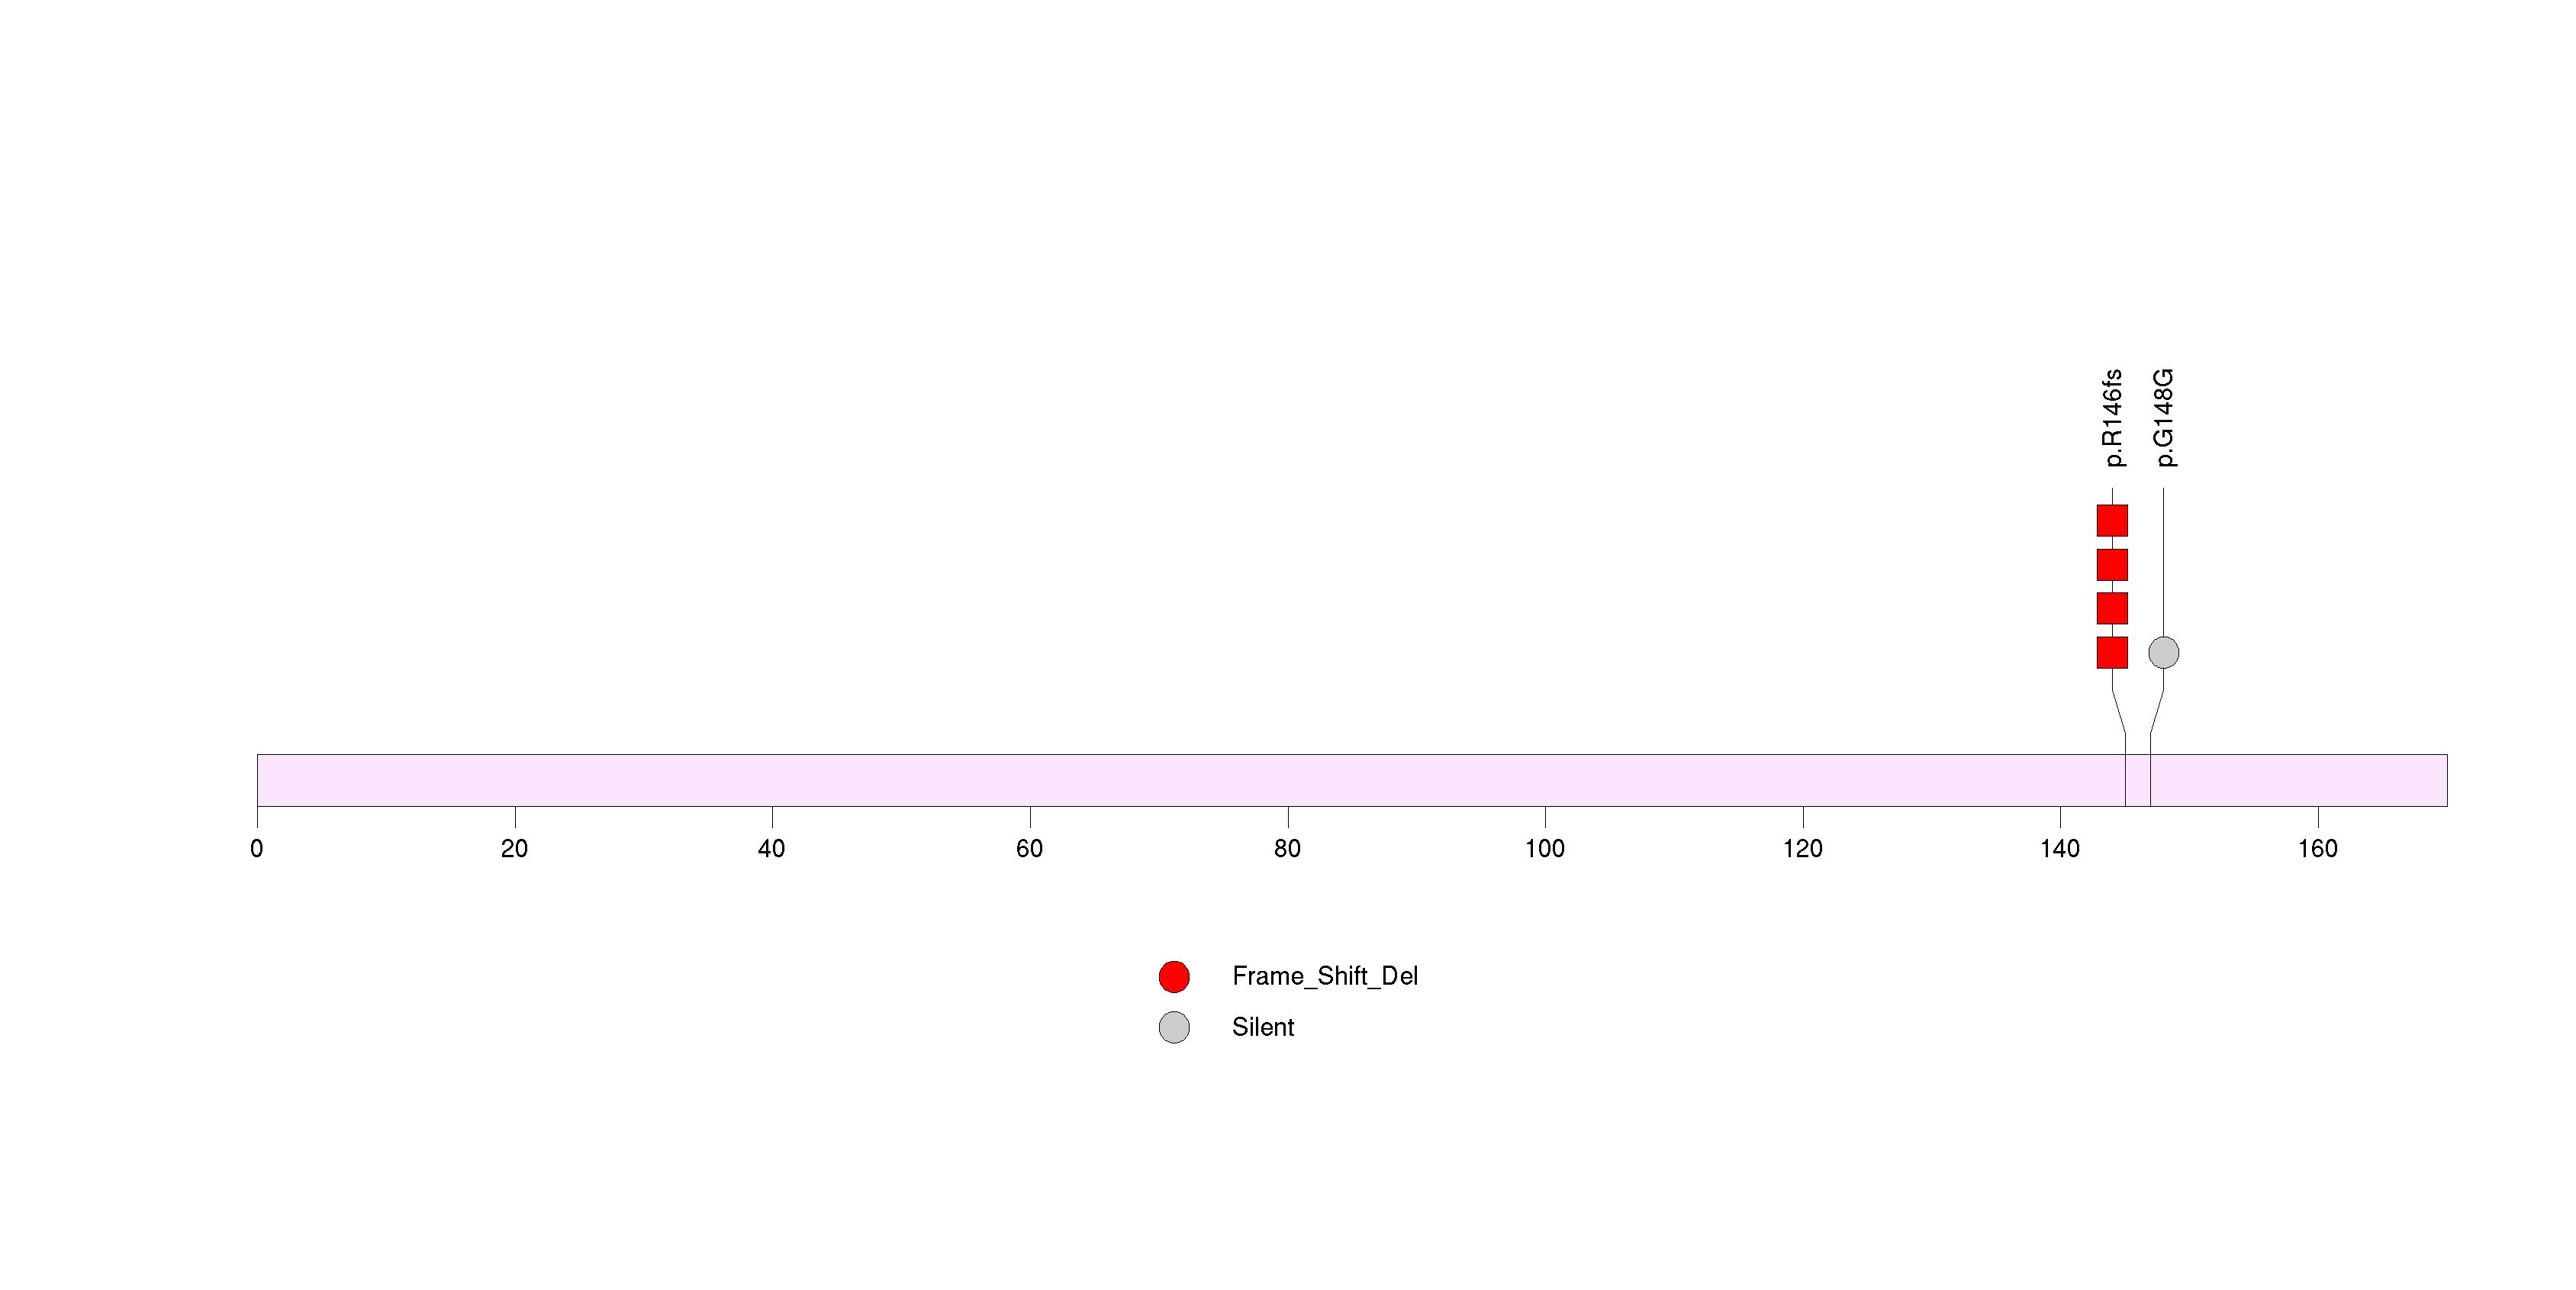
Figure S18. This figure depicts the distribution of mutations and mutation types across the OR8H3 significant gene.
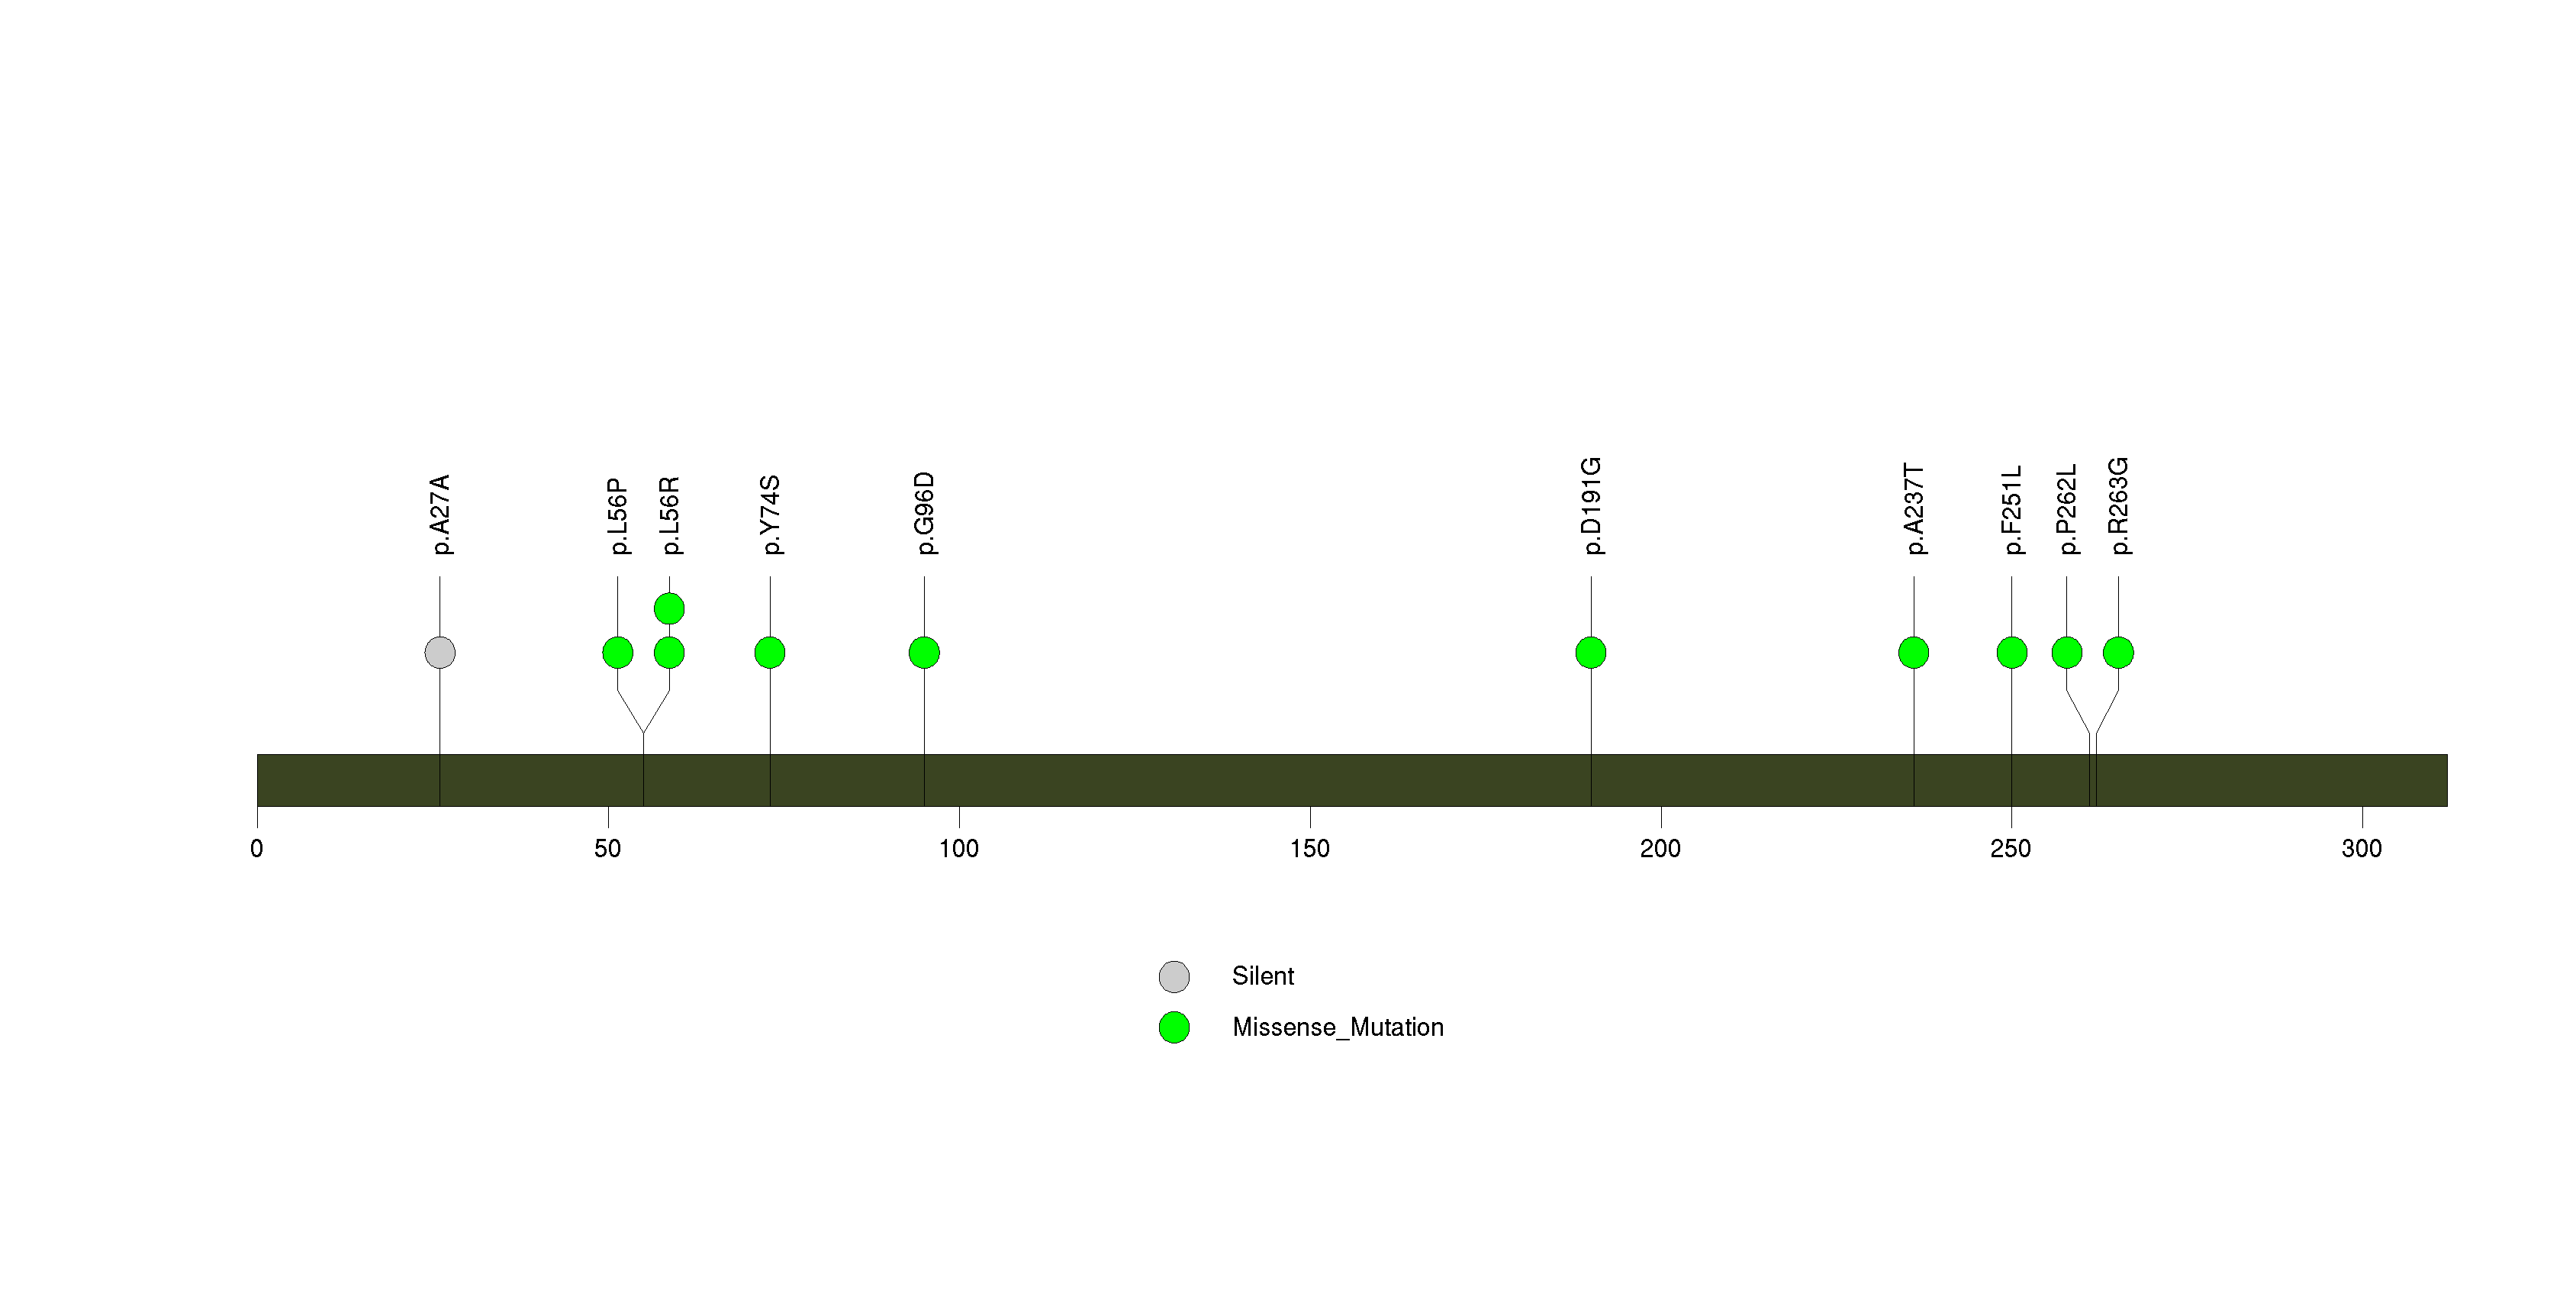
Figure S19. This figure depicts the distribution of mutations and mutation types across the ZNF804B significant gene.
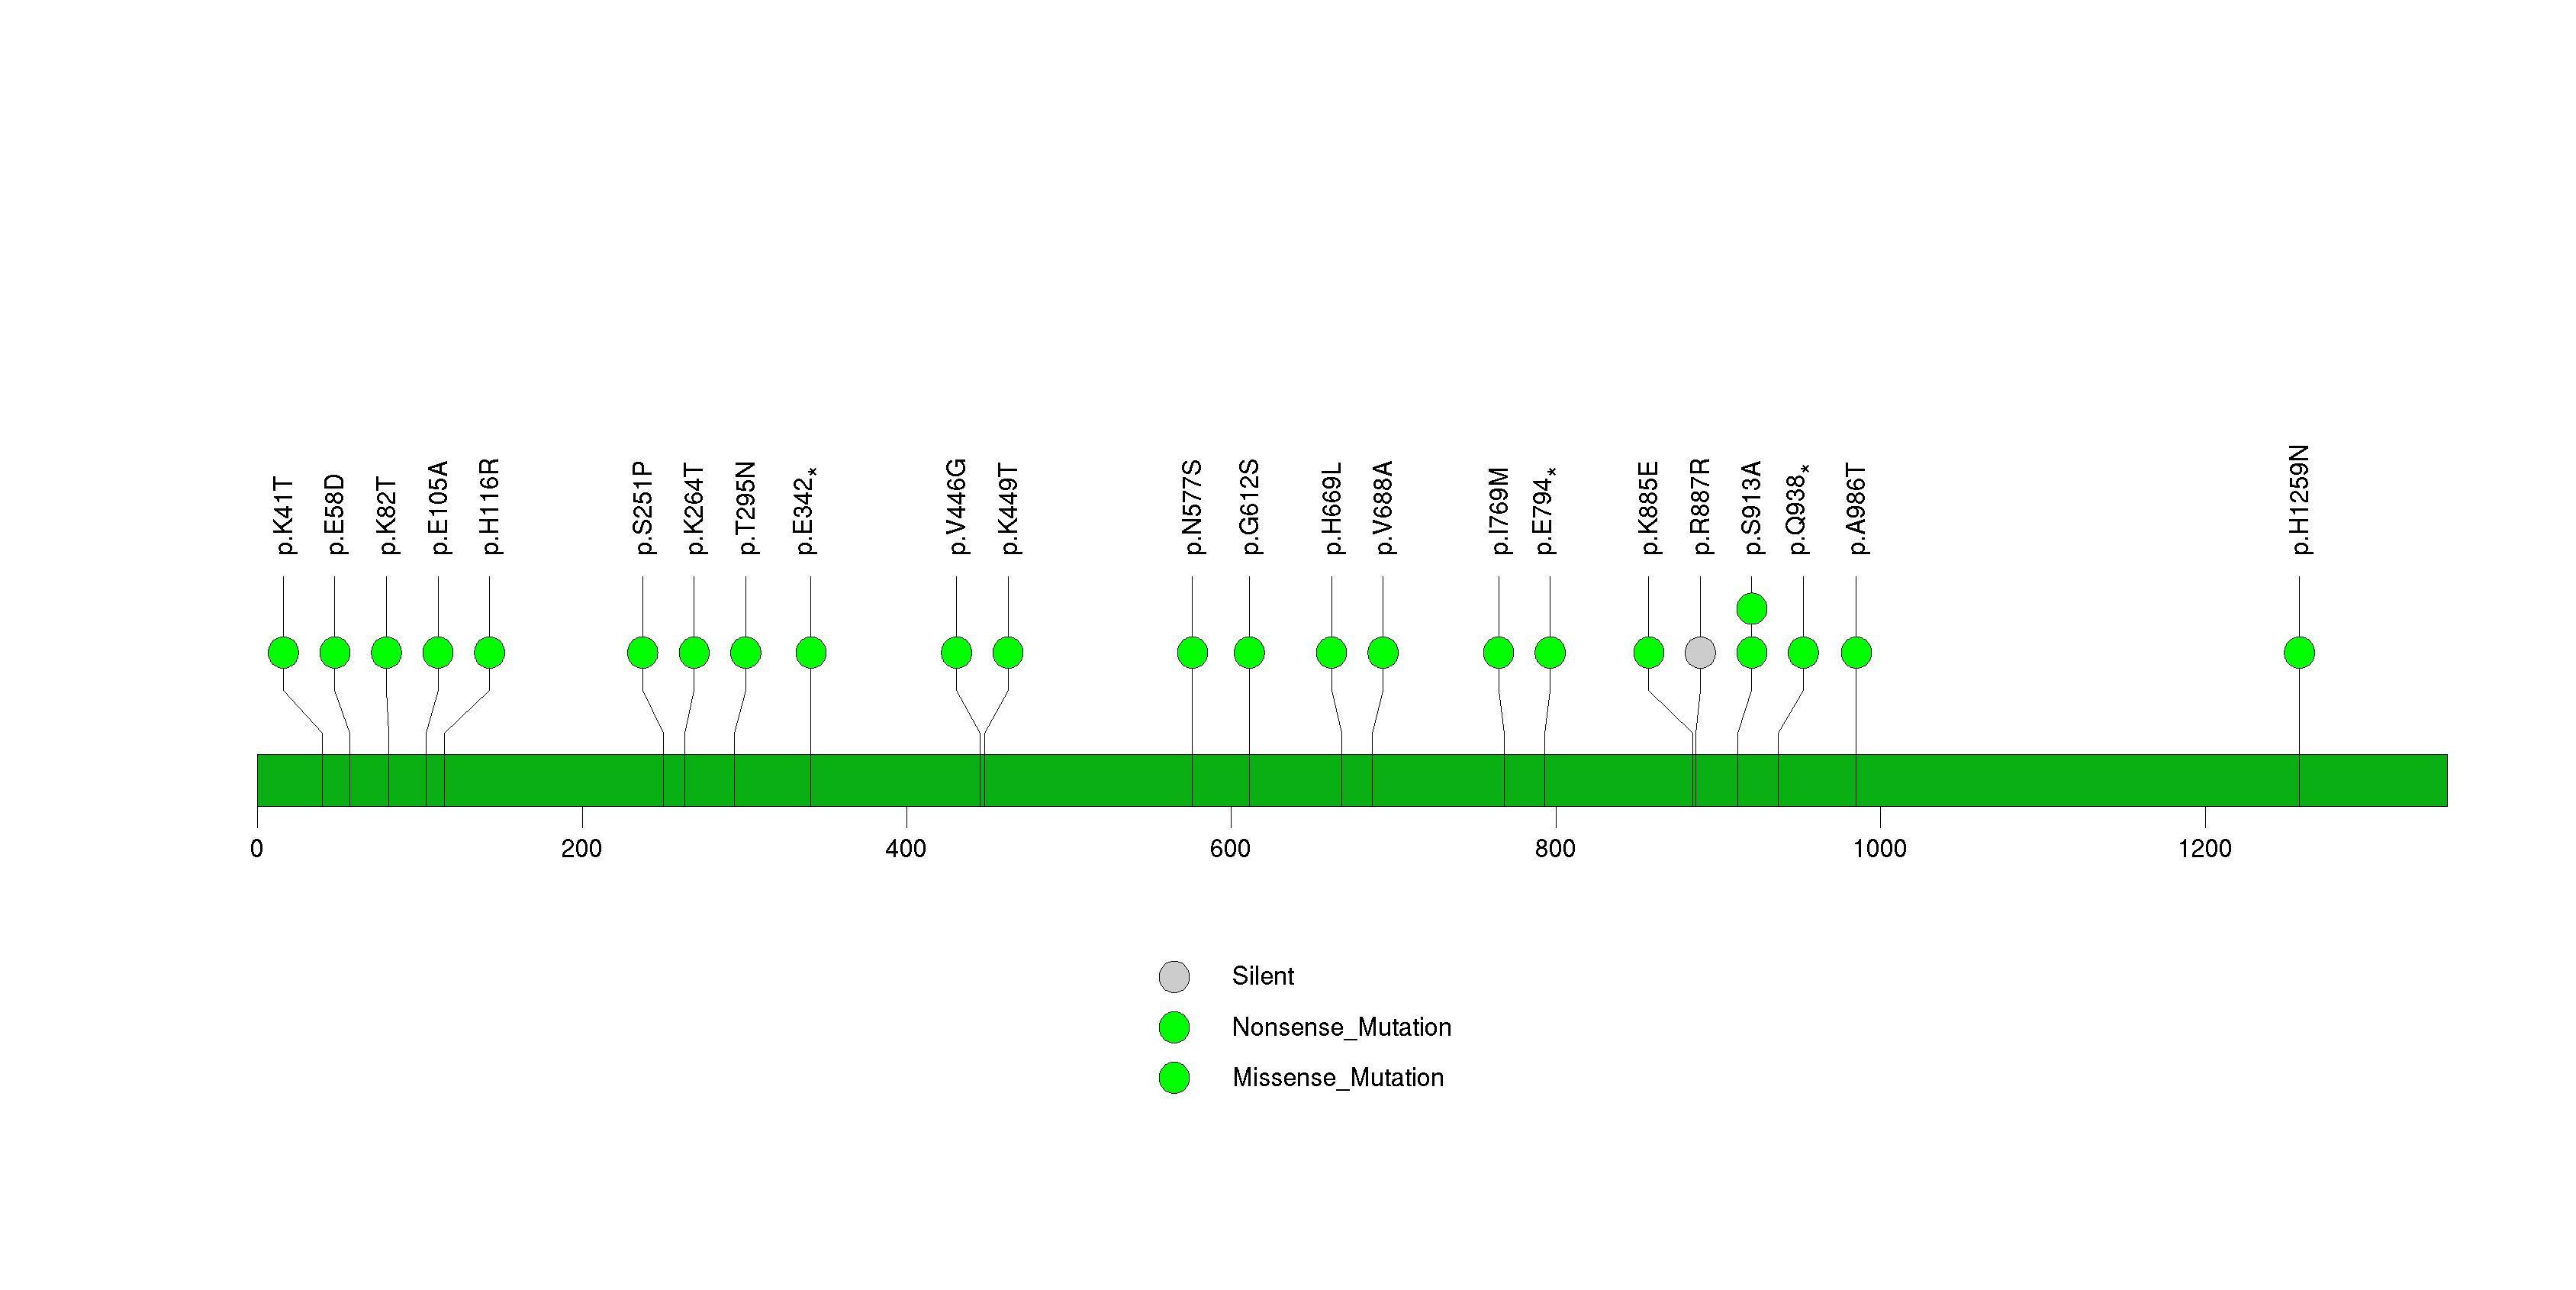
Figure S20. This figure depicts the distribution of mutations and mutation types across the CDH1 significant gene.
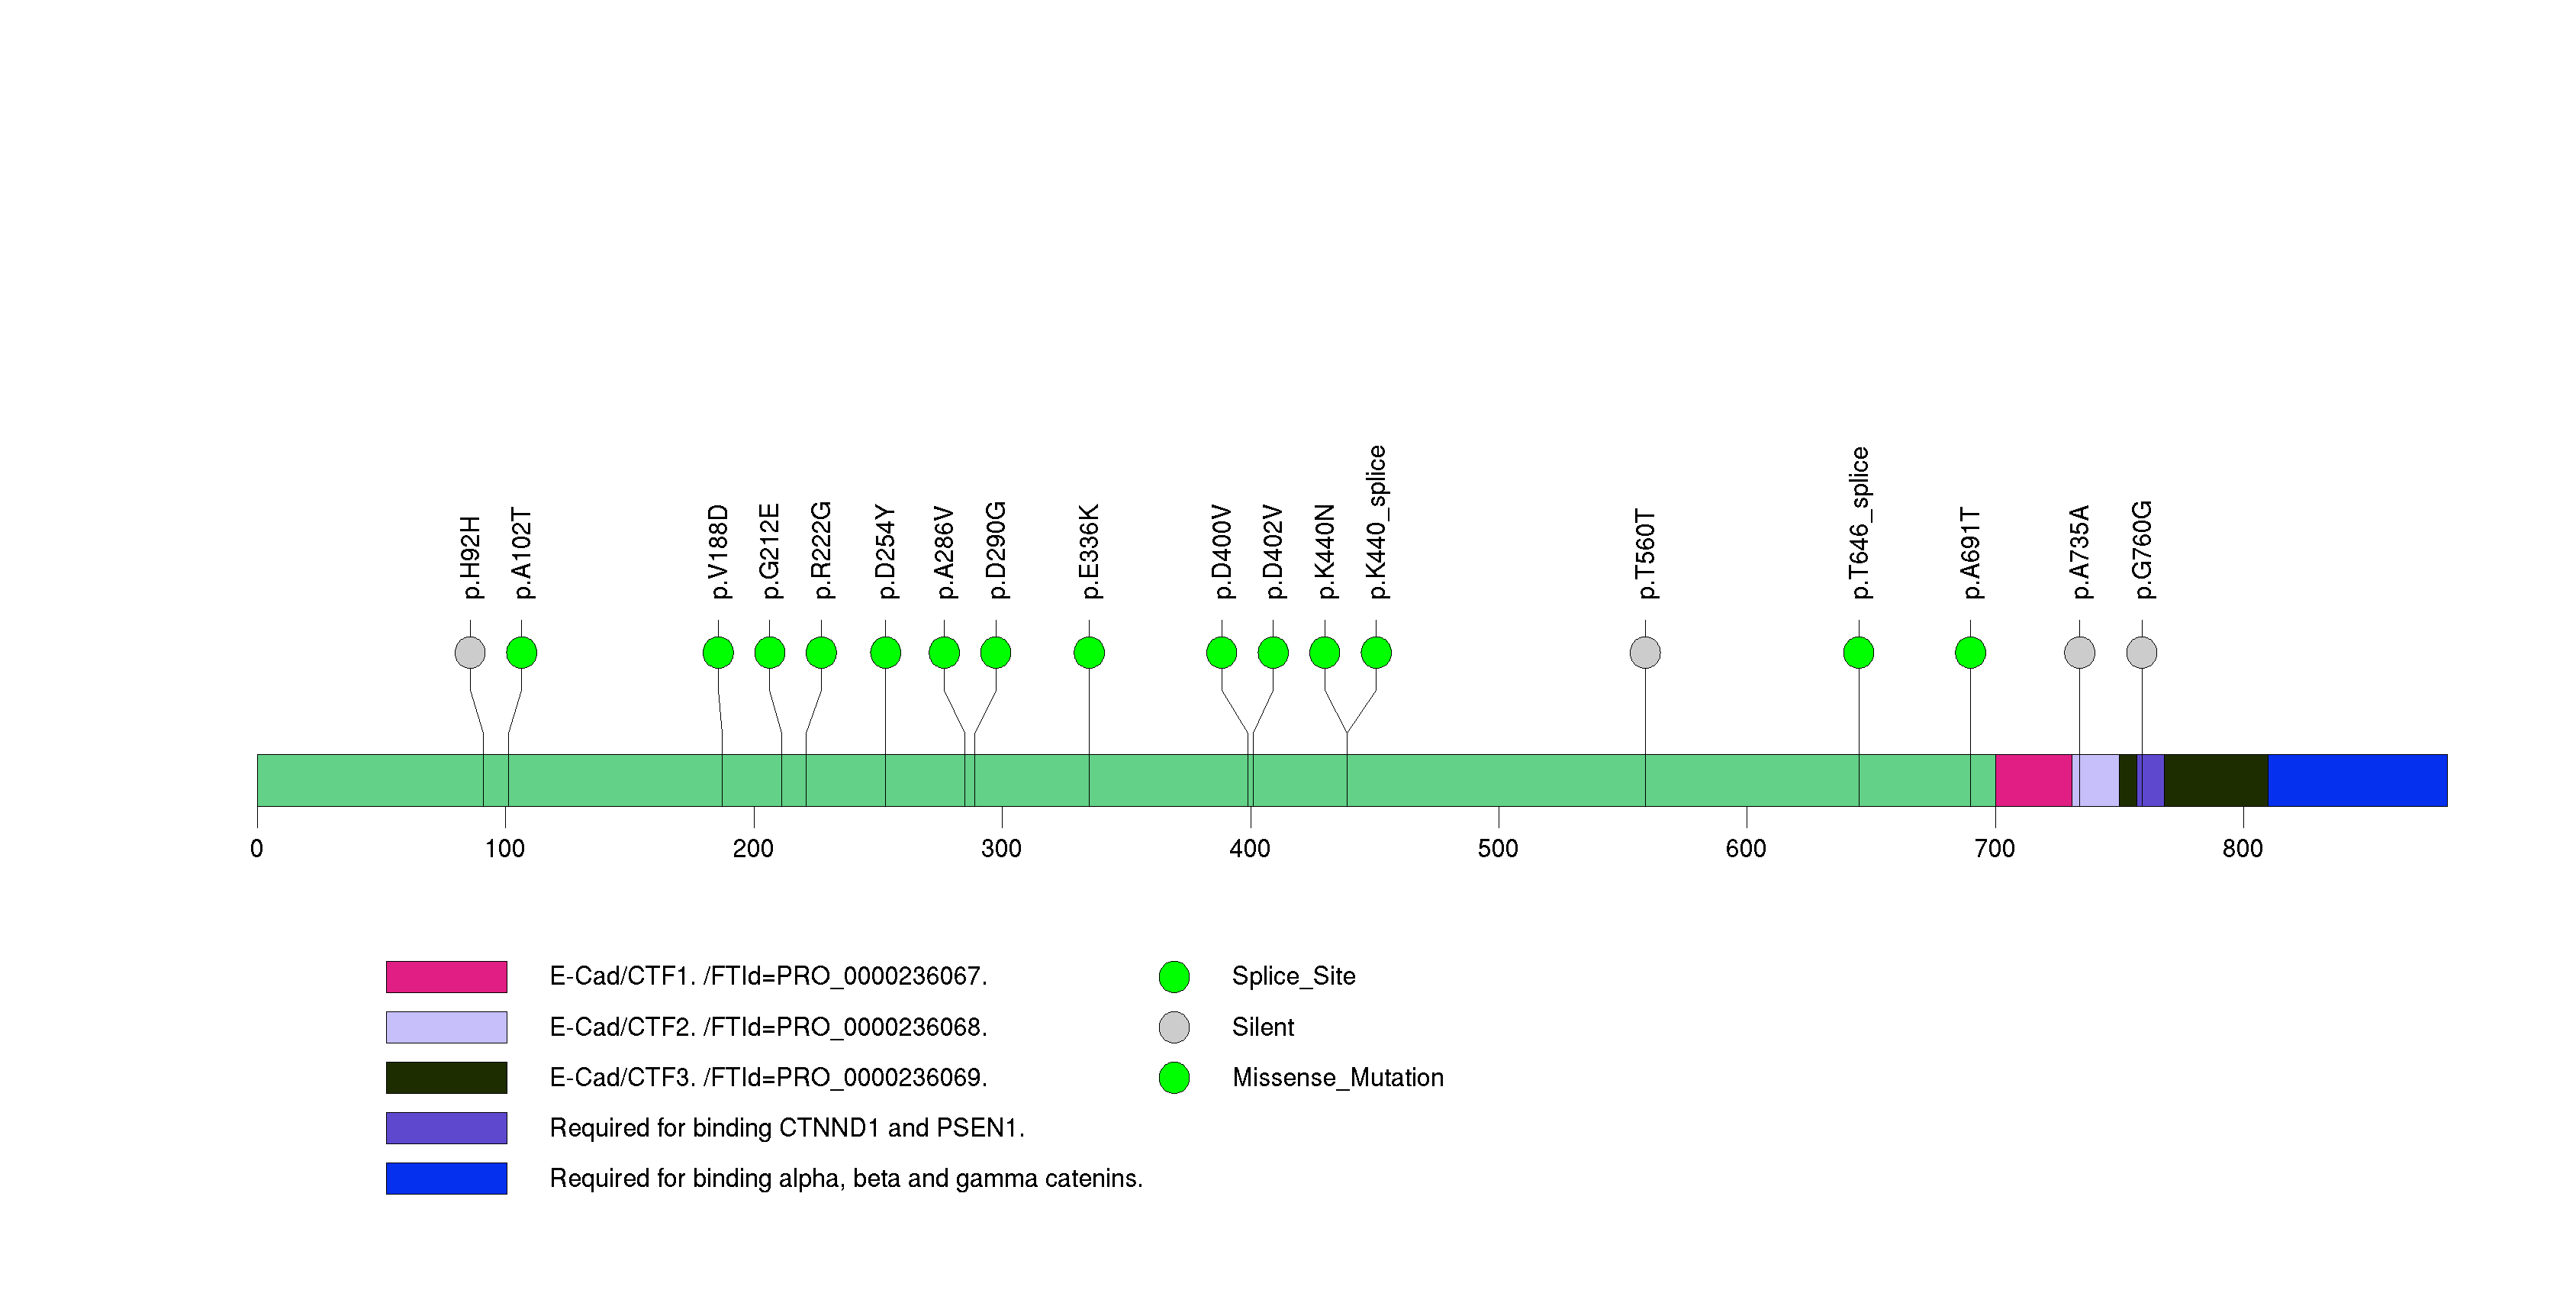
Figure S21. This figure depicts the distribution of mutations and mutation types across the TUSC3 significant gene.
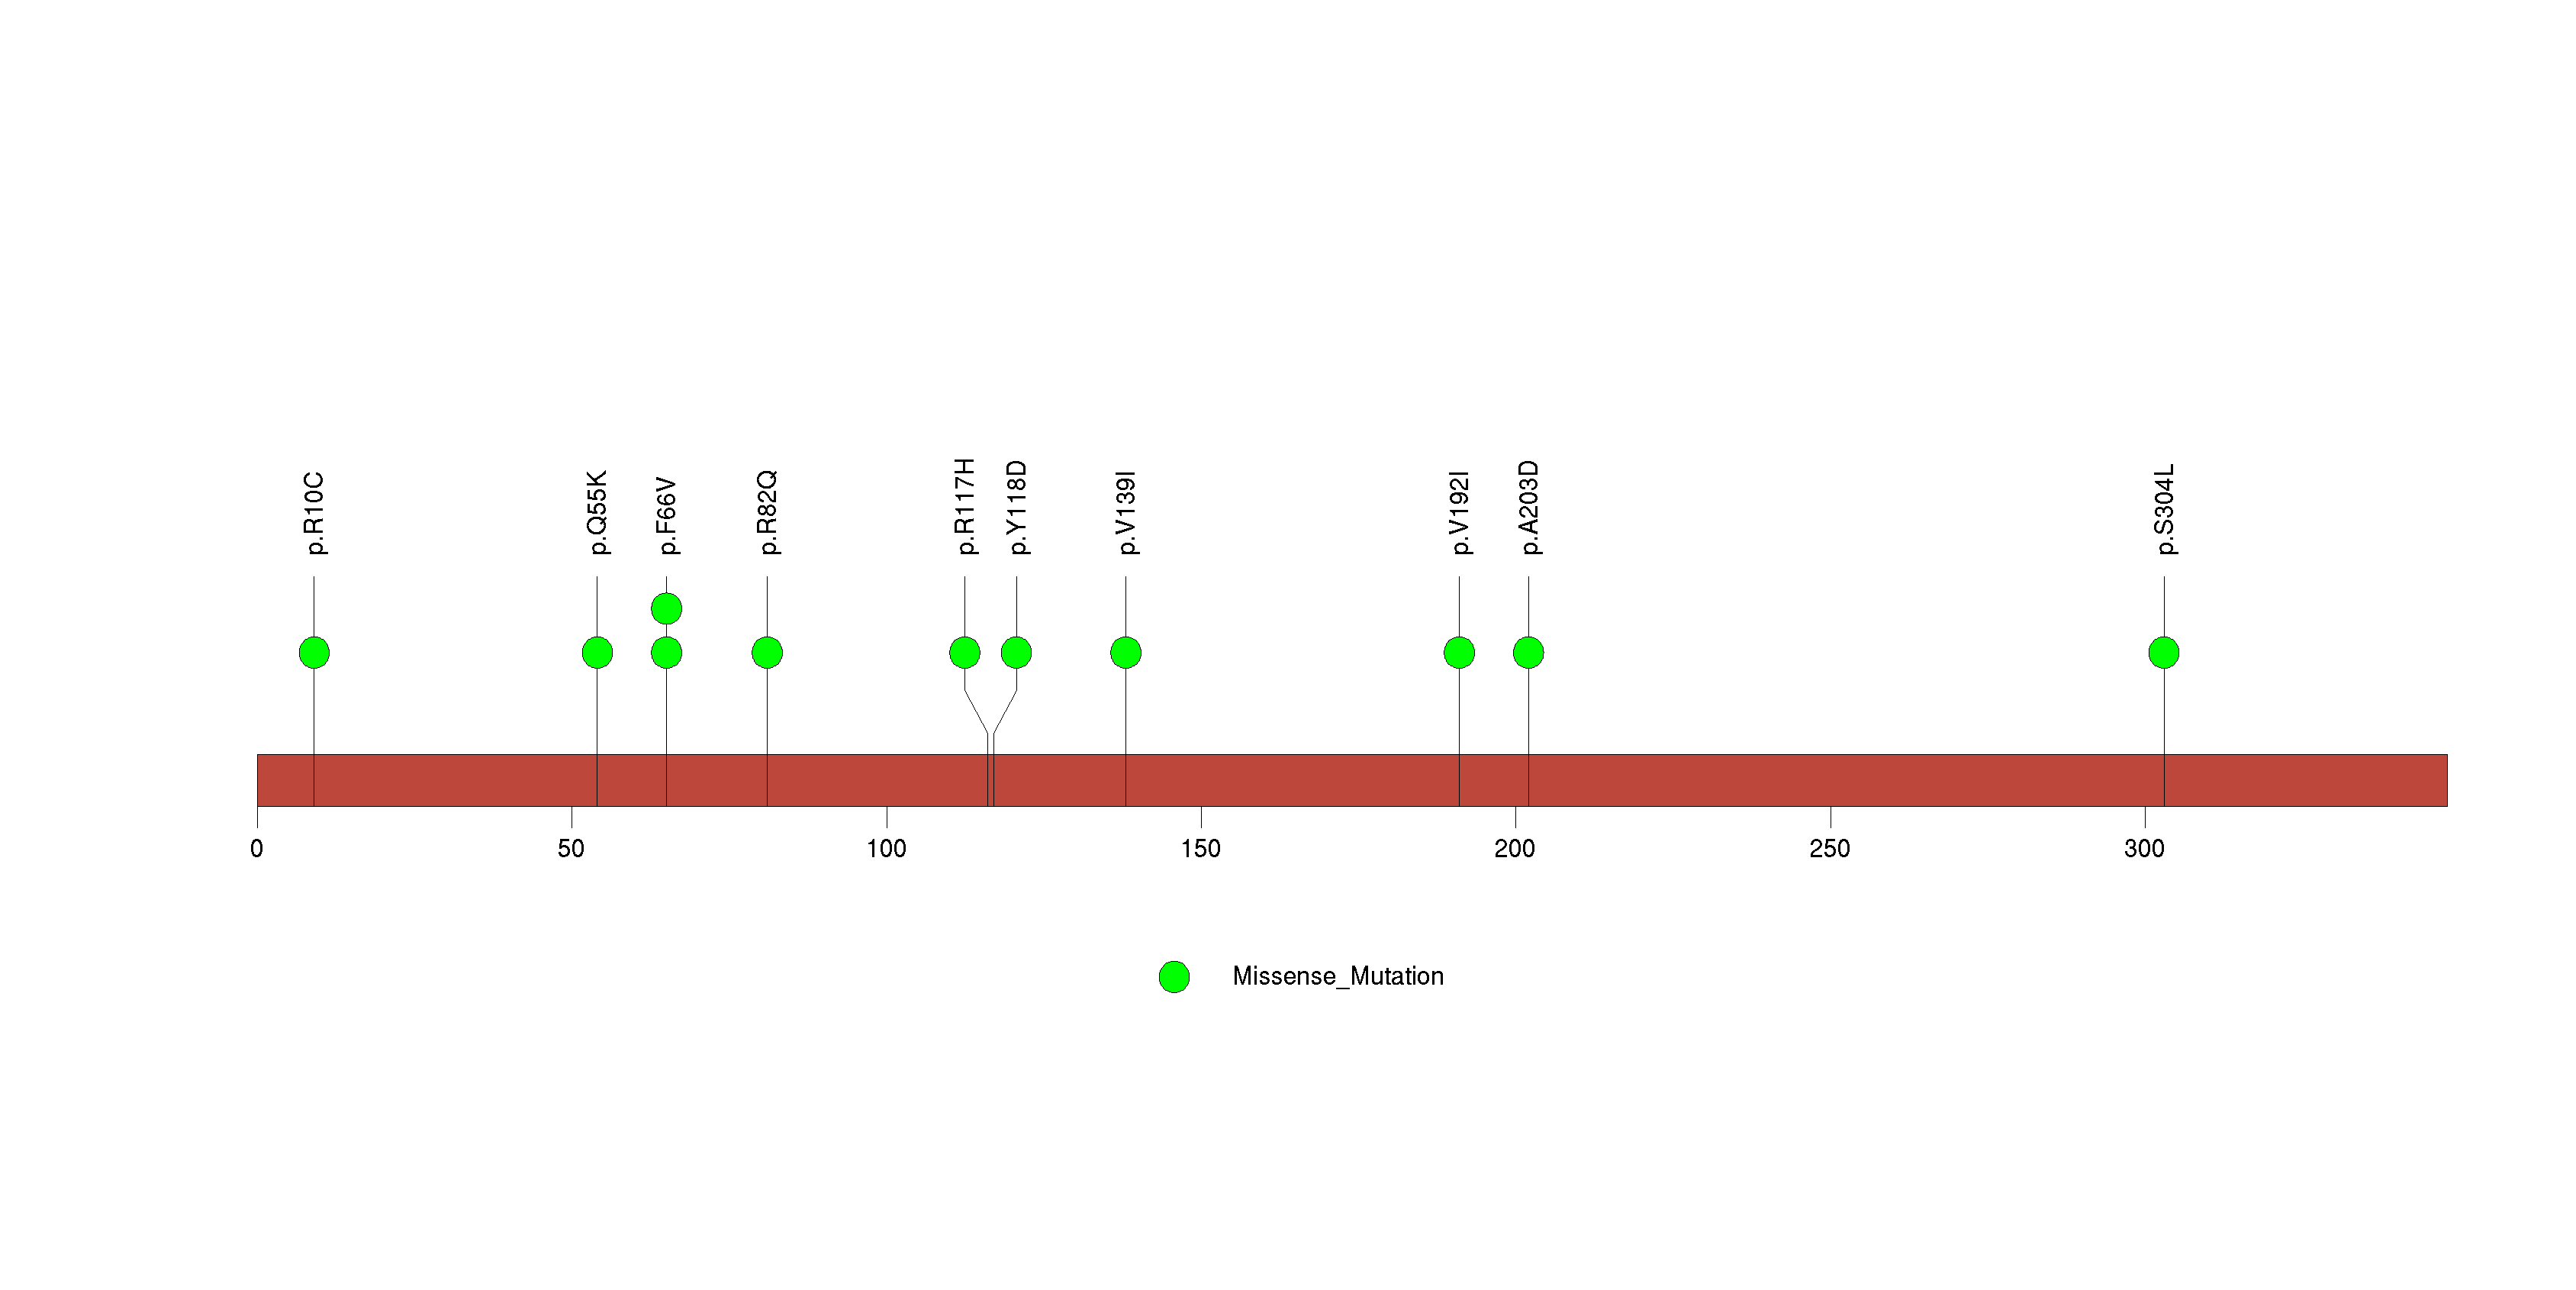
Figure S22. This figure depicts the distribution of mutations and mutation types across the PRRT2 significant gene.
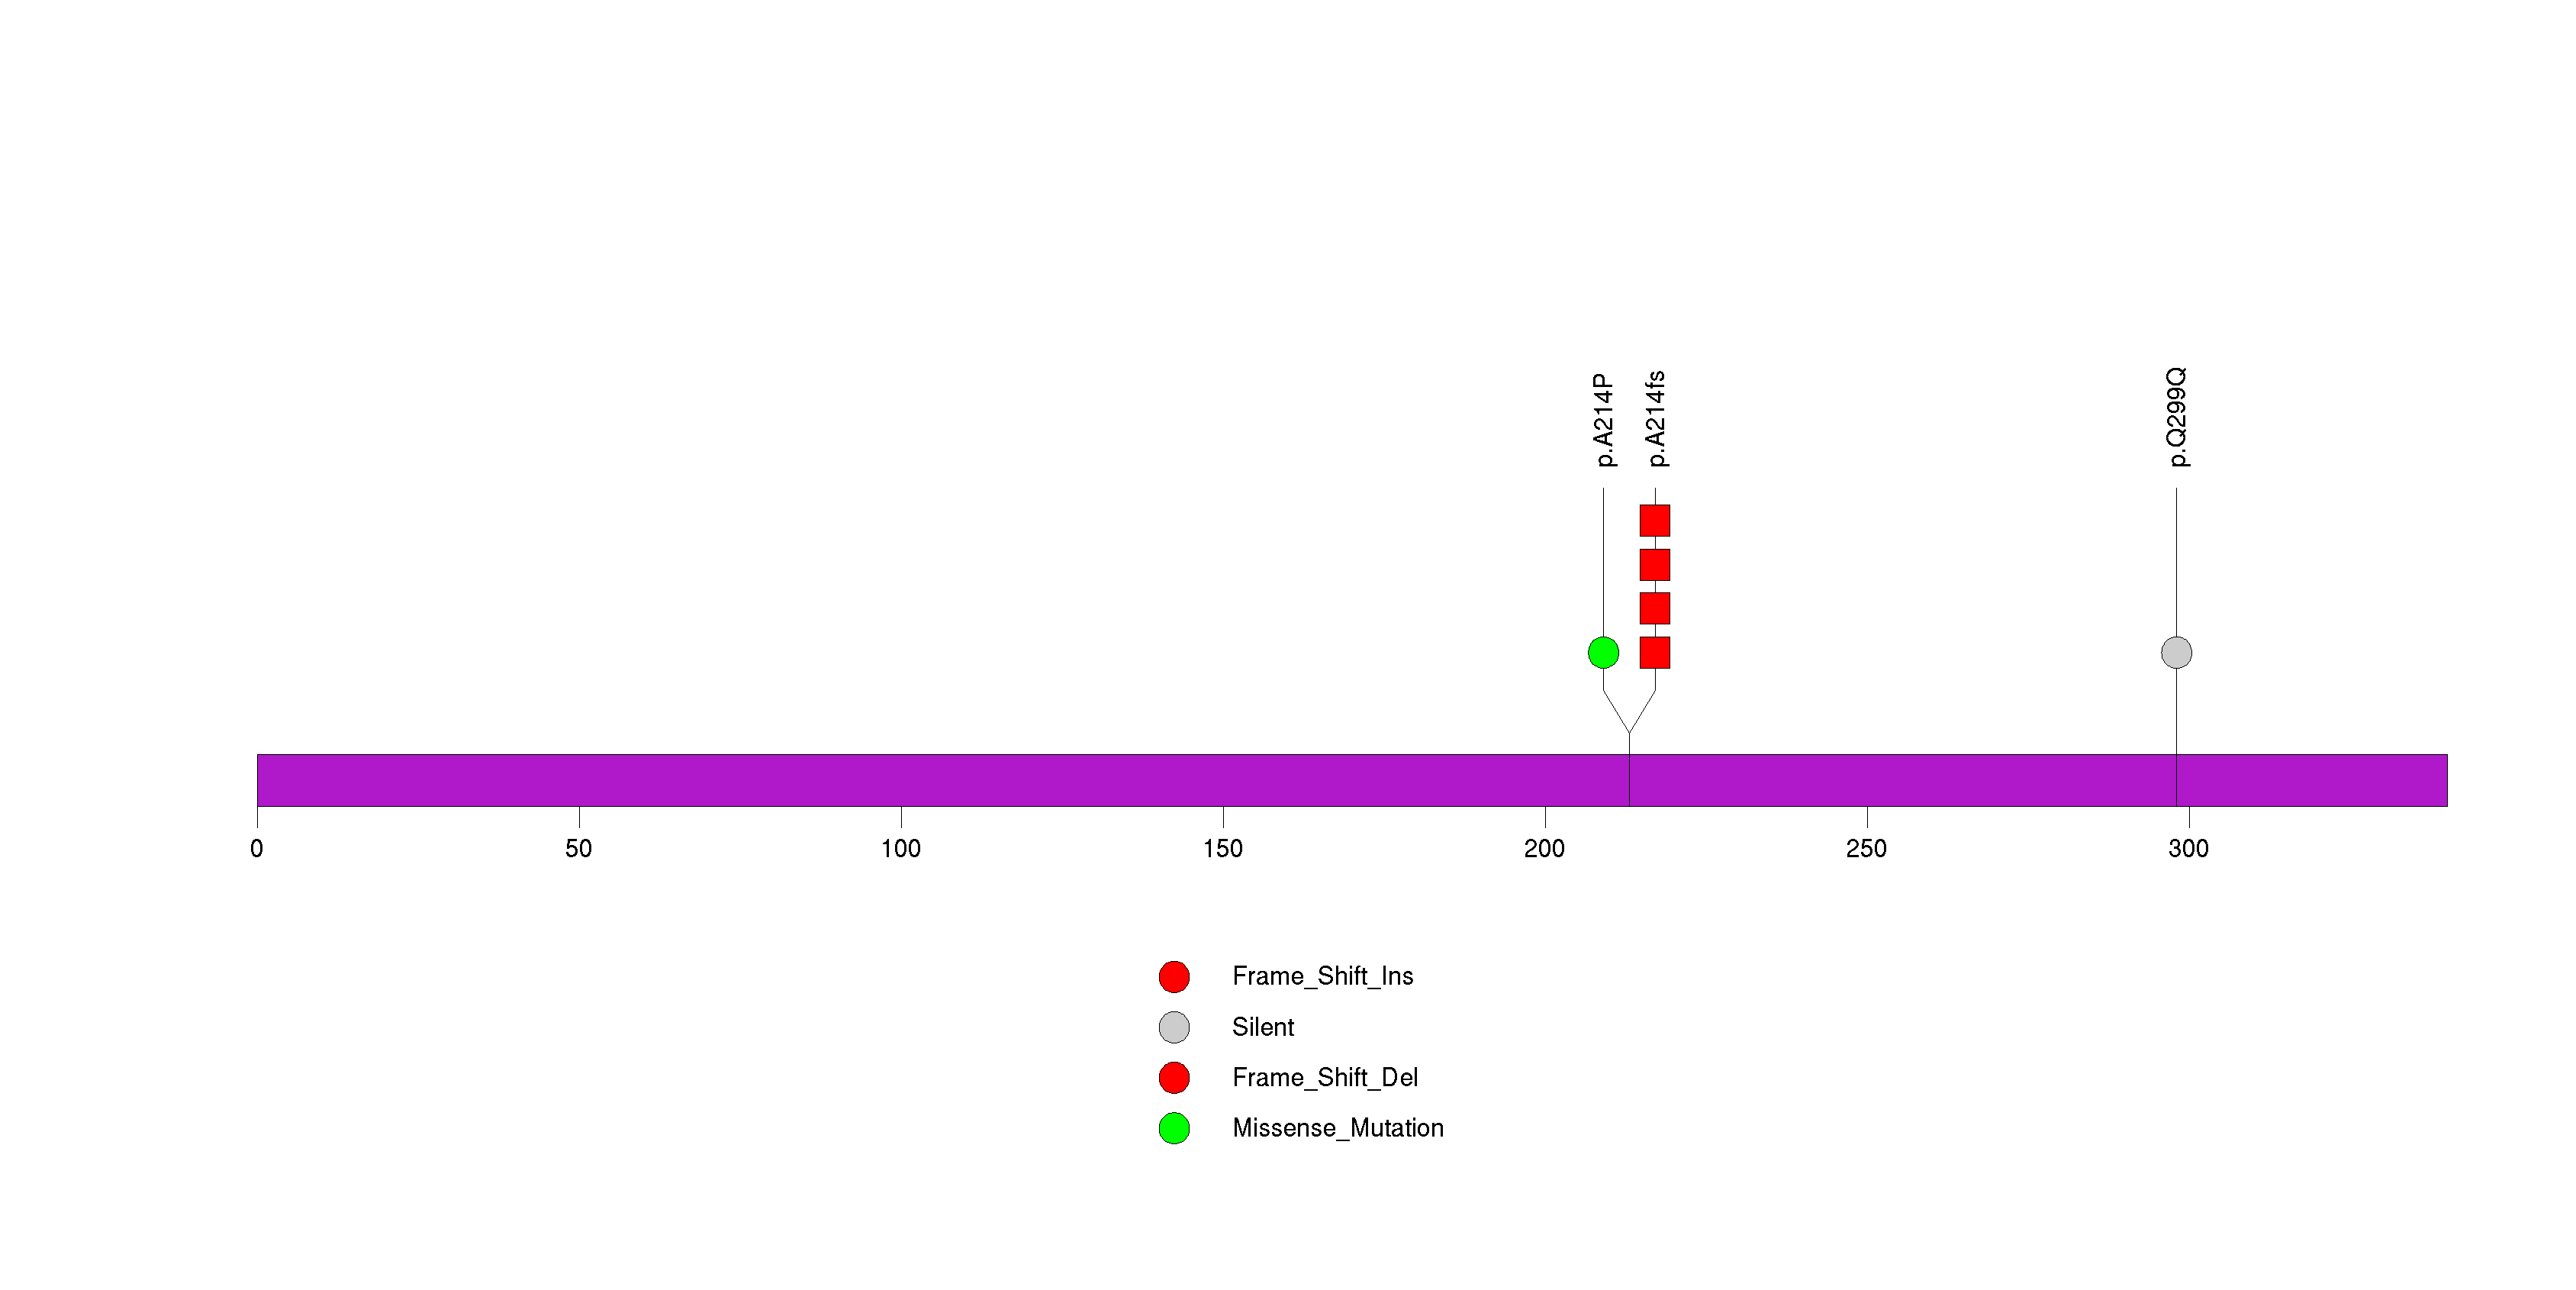
Figure S23. This figure depicts the distribution of mutations and mutation types across the C17orf63 significant gene.
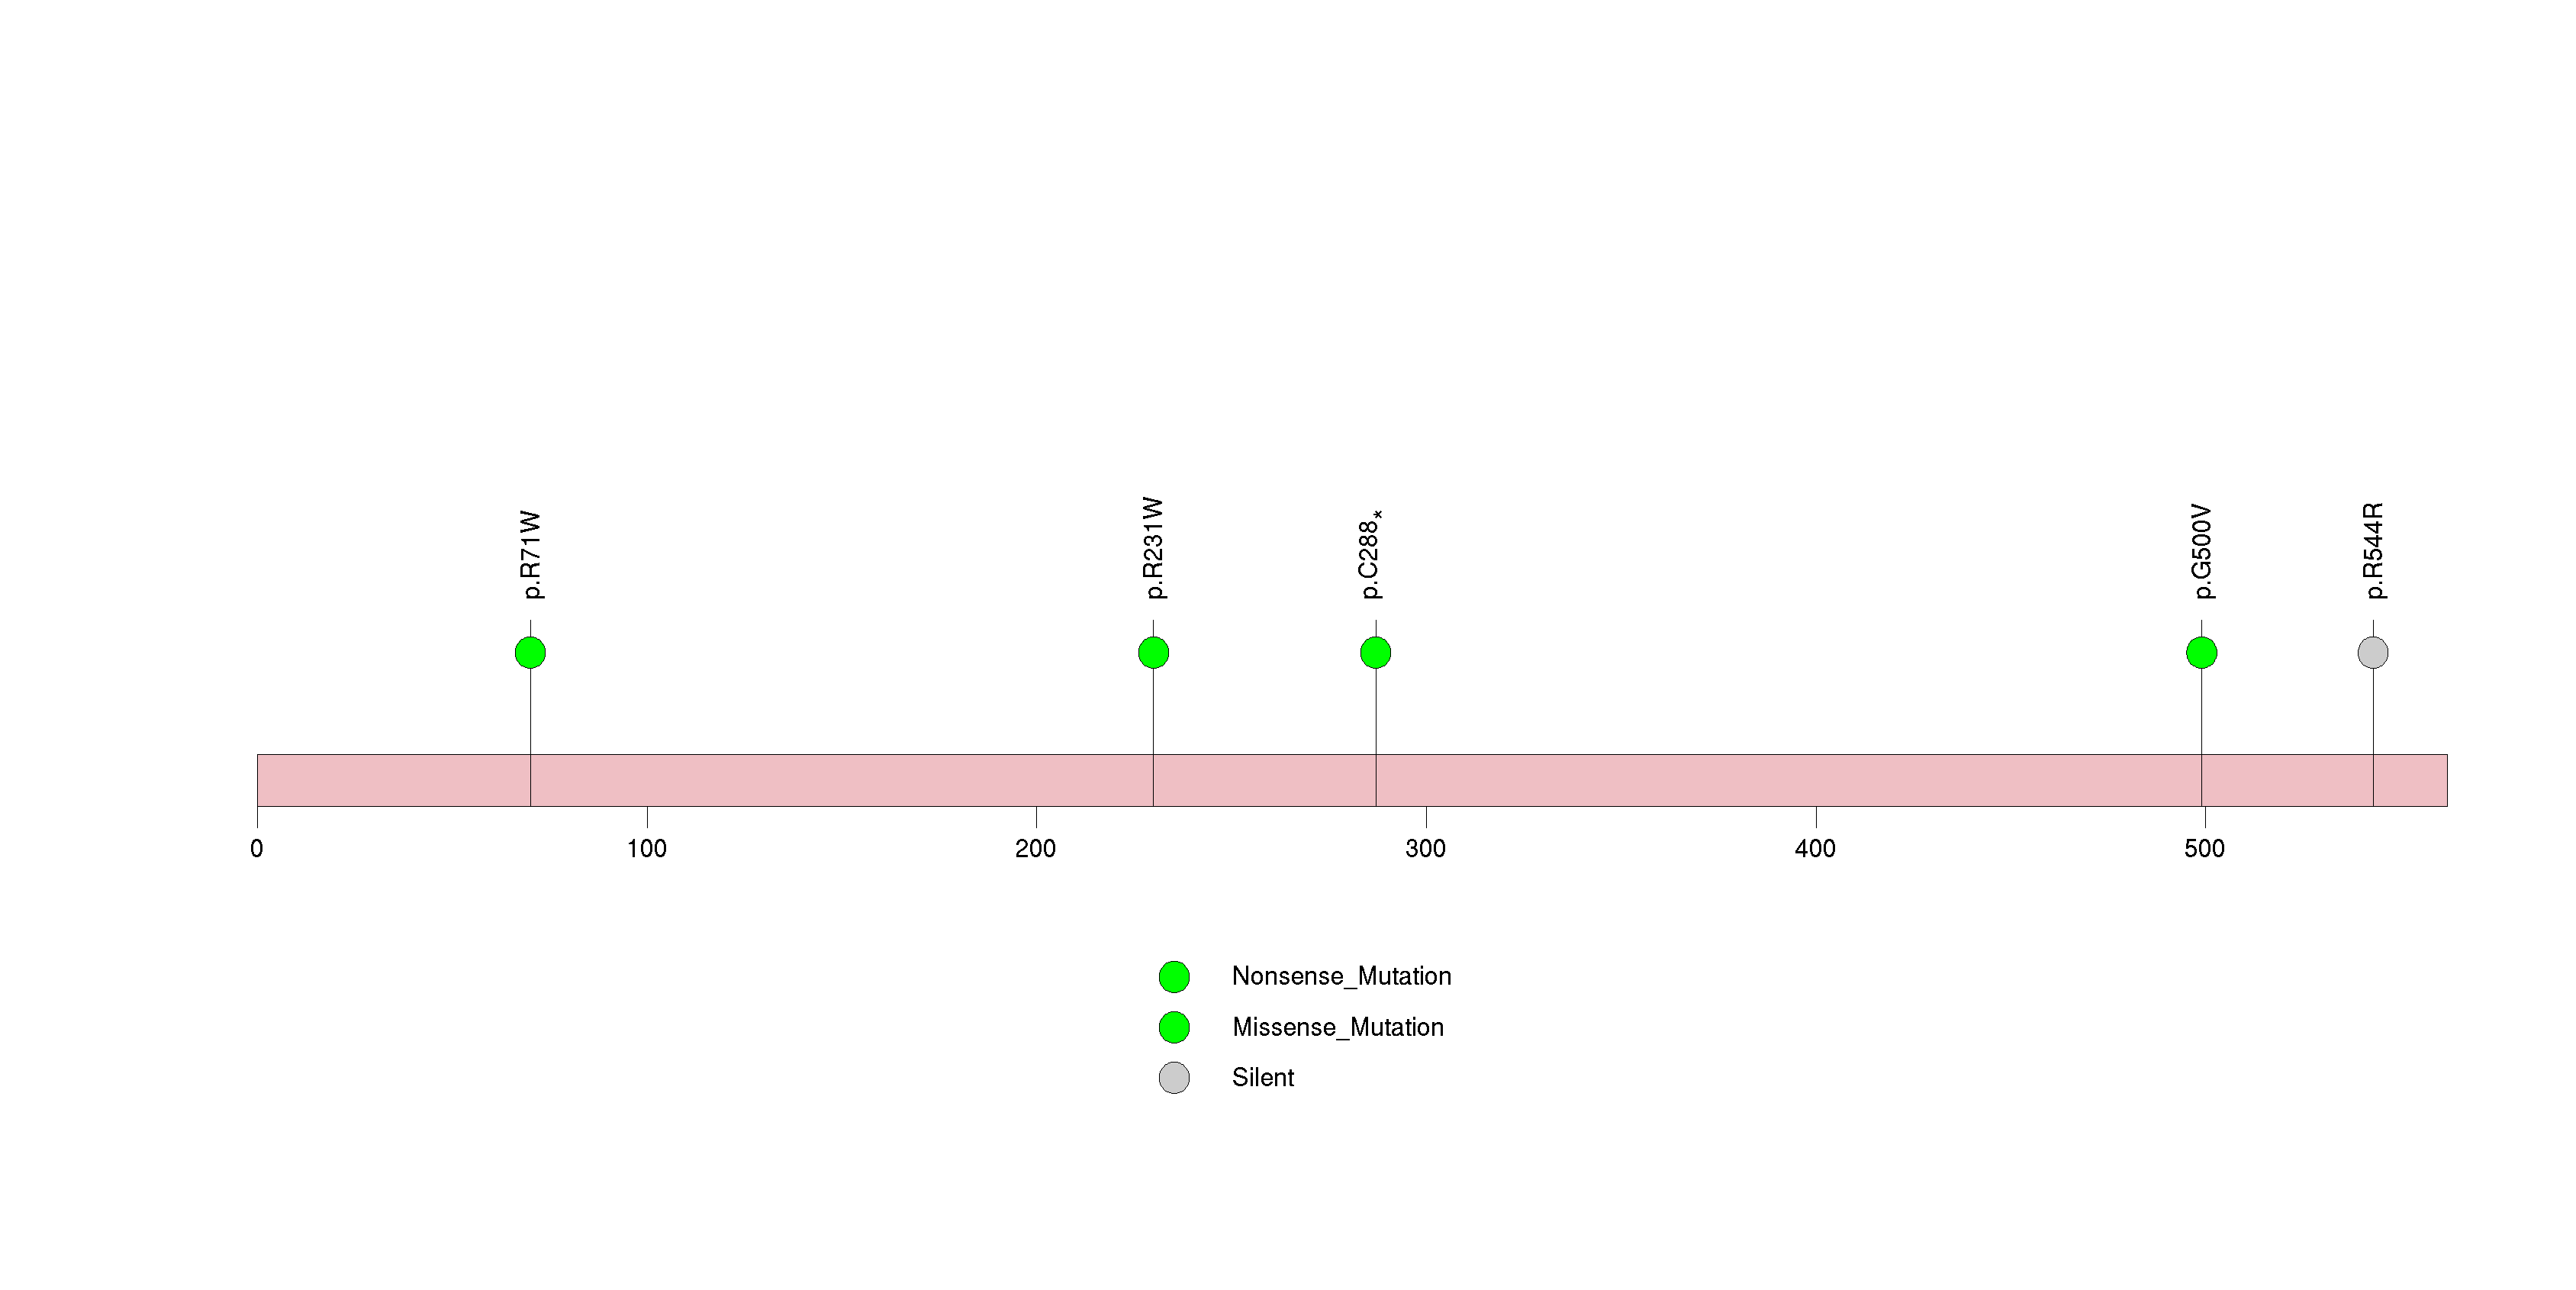
Figure S24. This figure depicts the distribution of mutations and mutation types across the IRF2 significant gene.
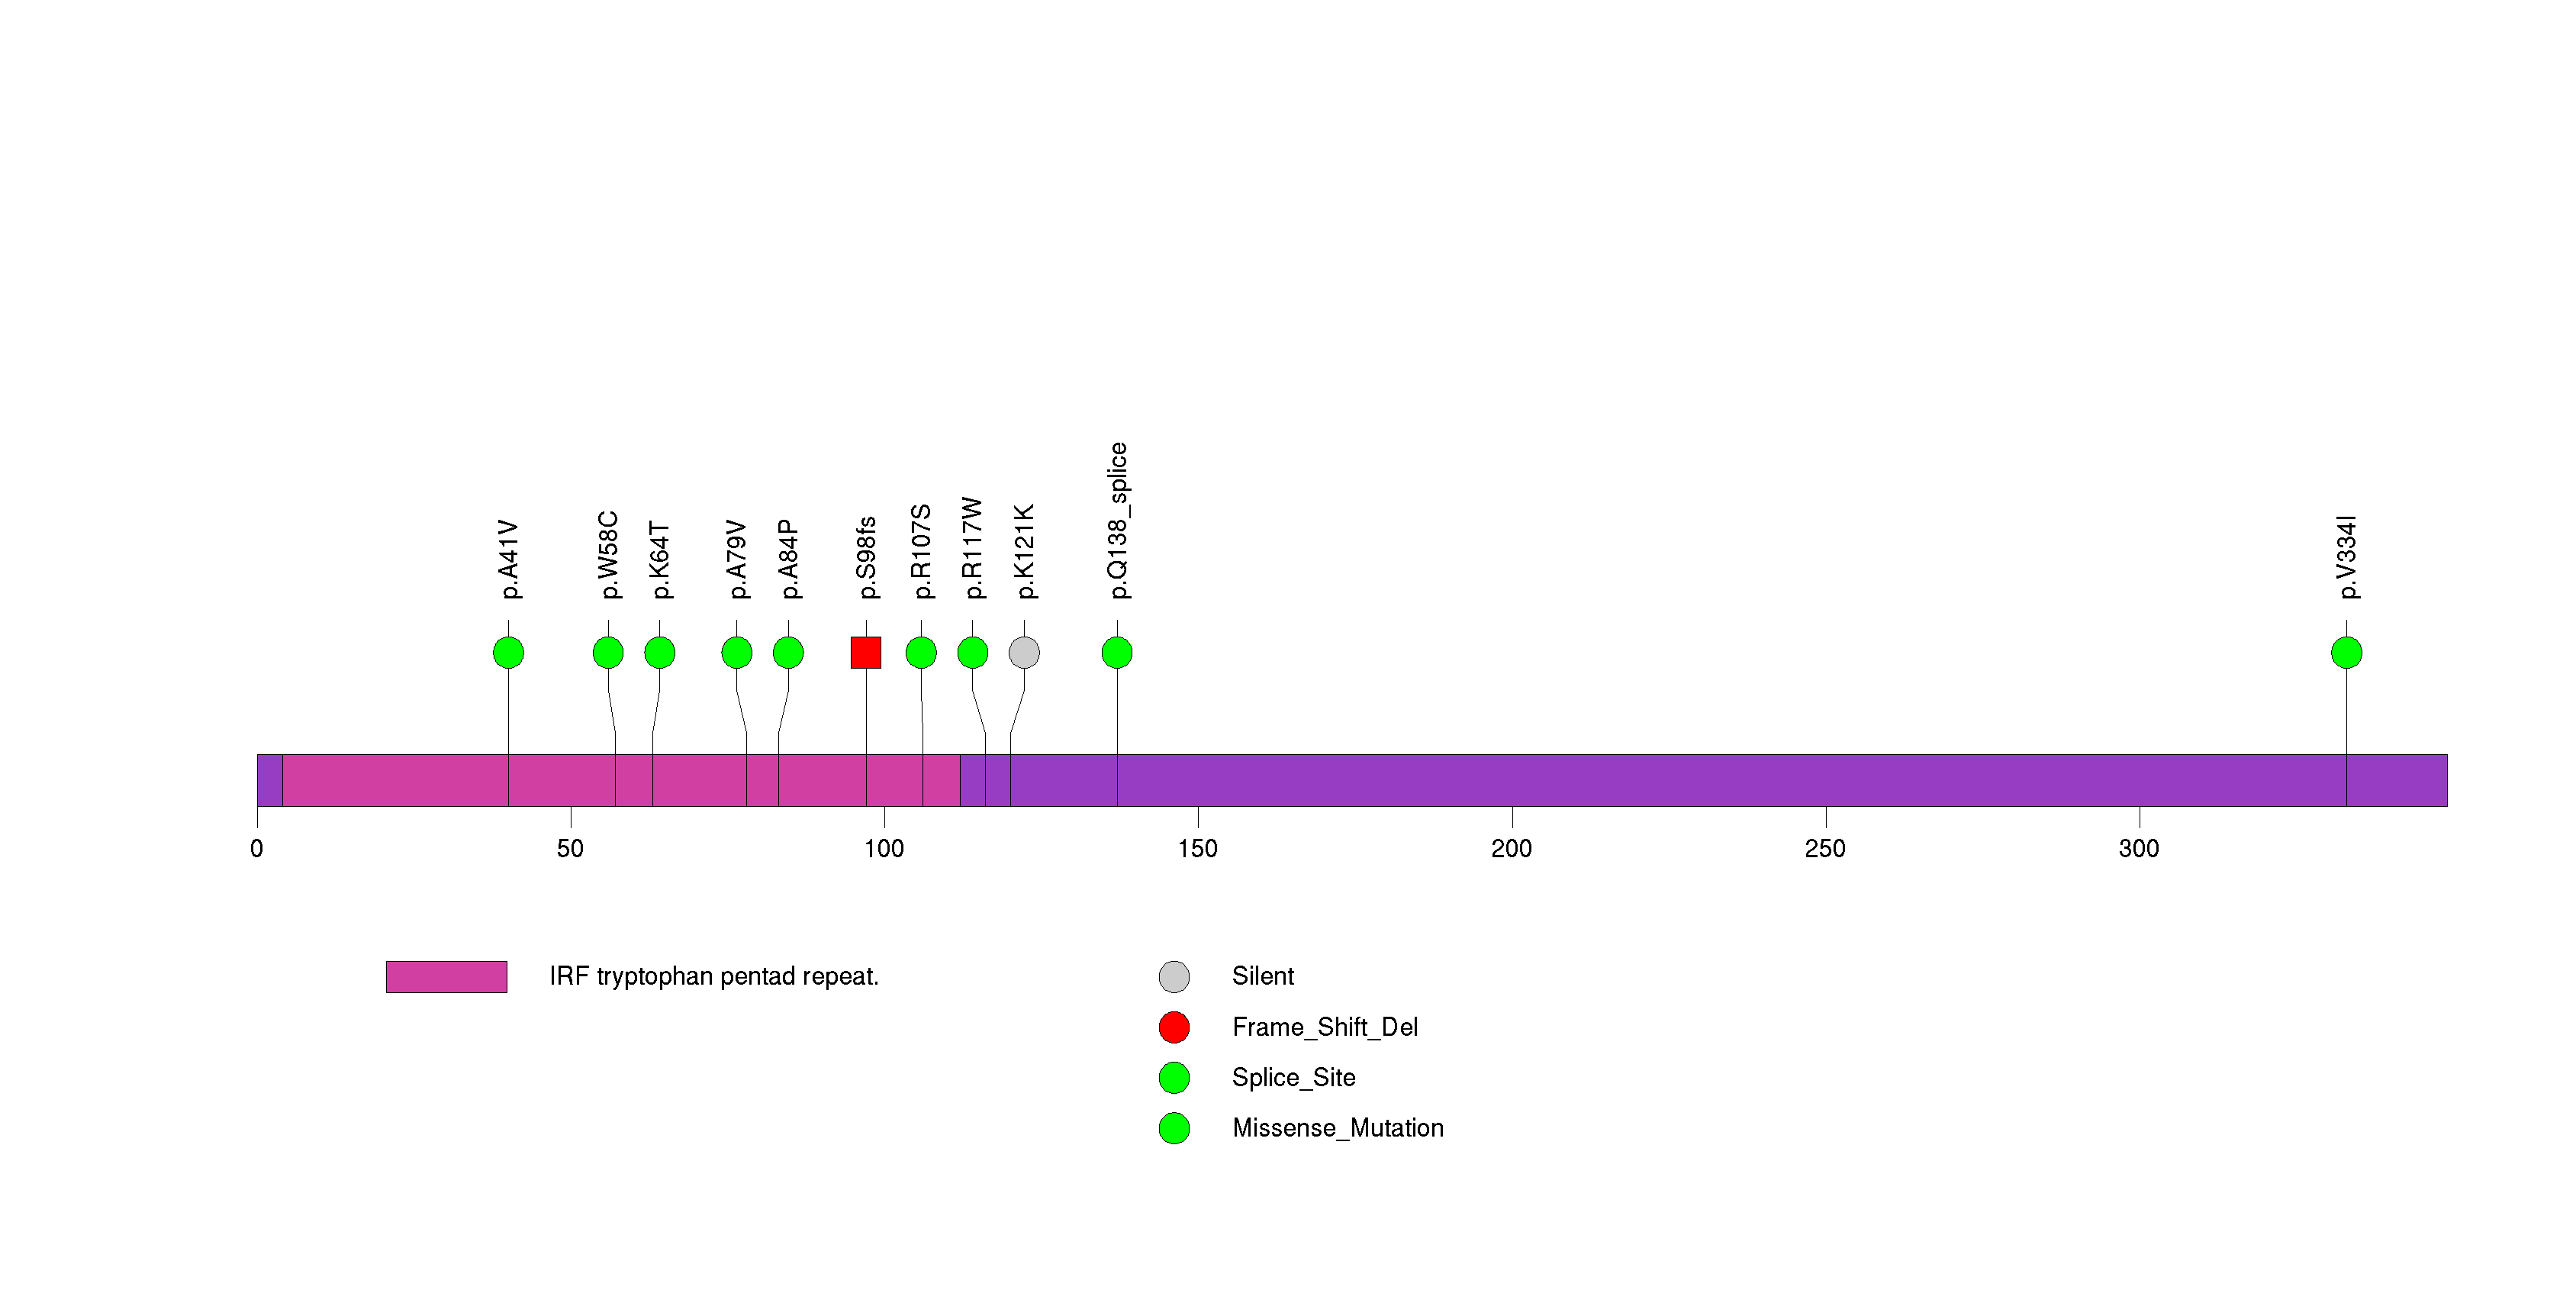
Figure S25. This figure depicts the distribution of mutations and mutation types across the RNF43 significant gene.
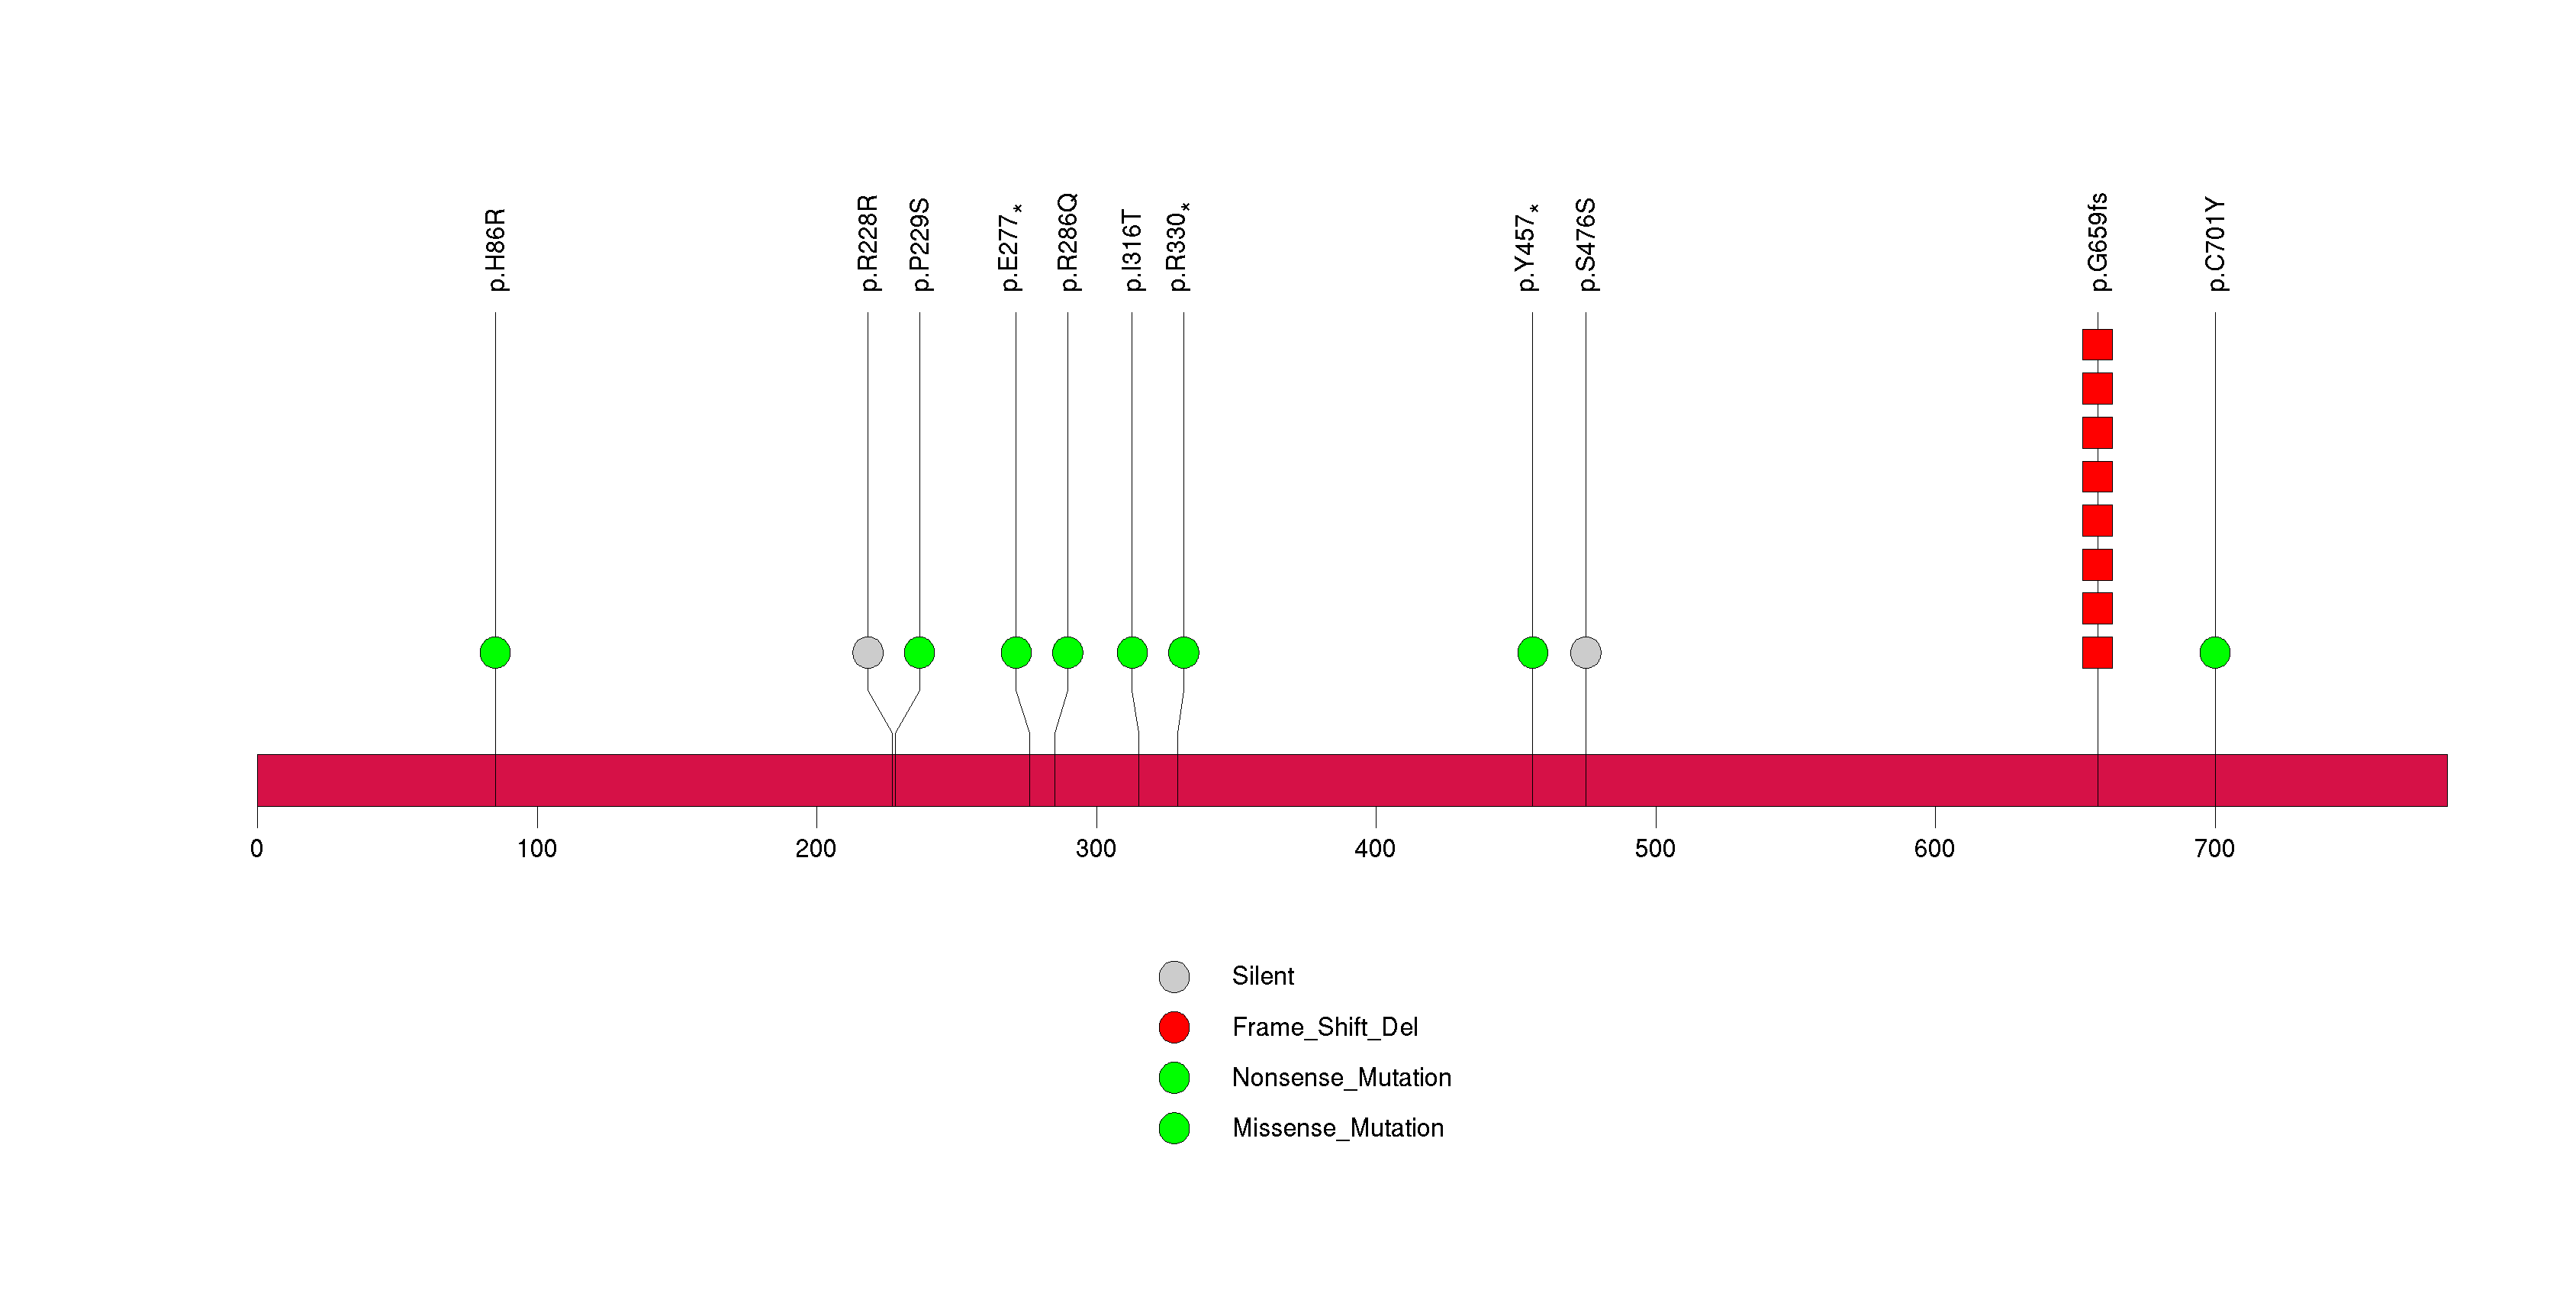
Figure S26. This figure depicts the distribution of mutations and mutation types across the HLA-A significant gene.
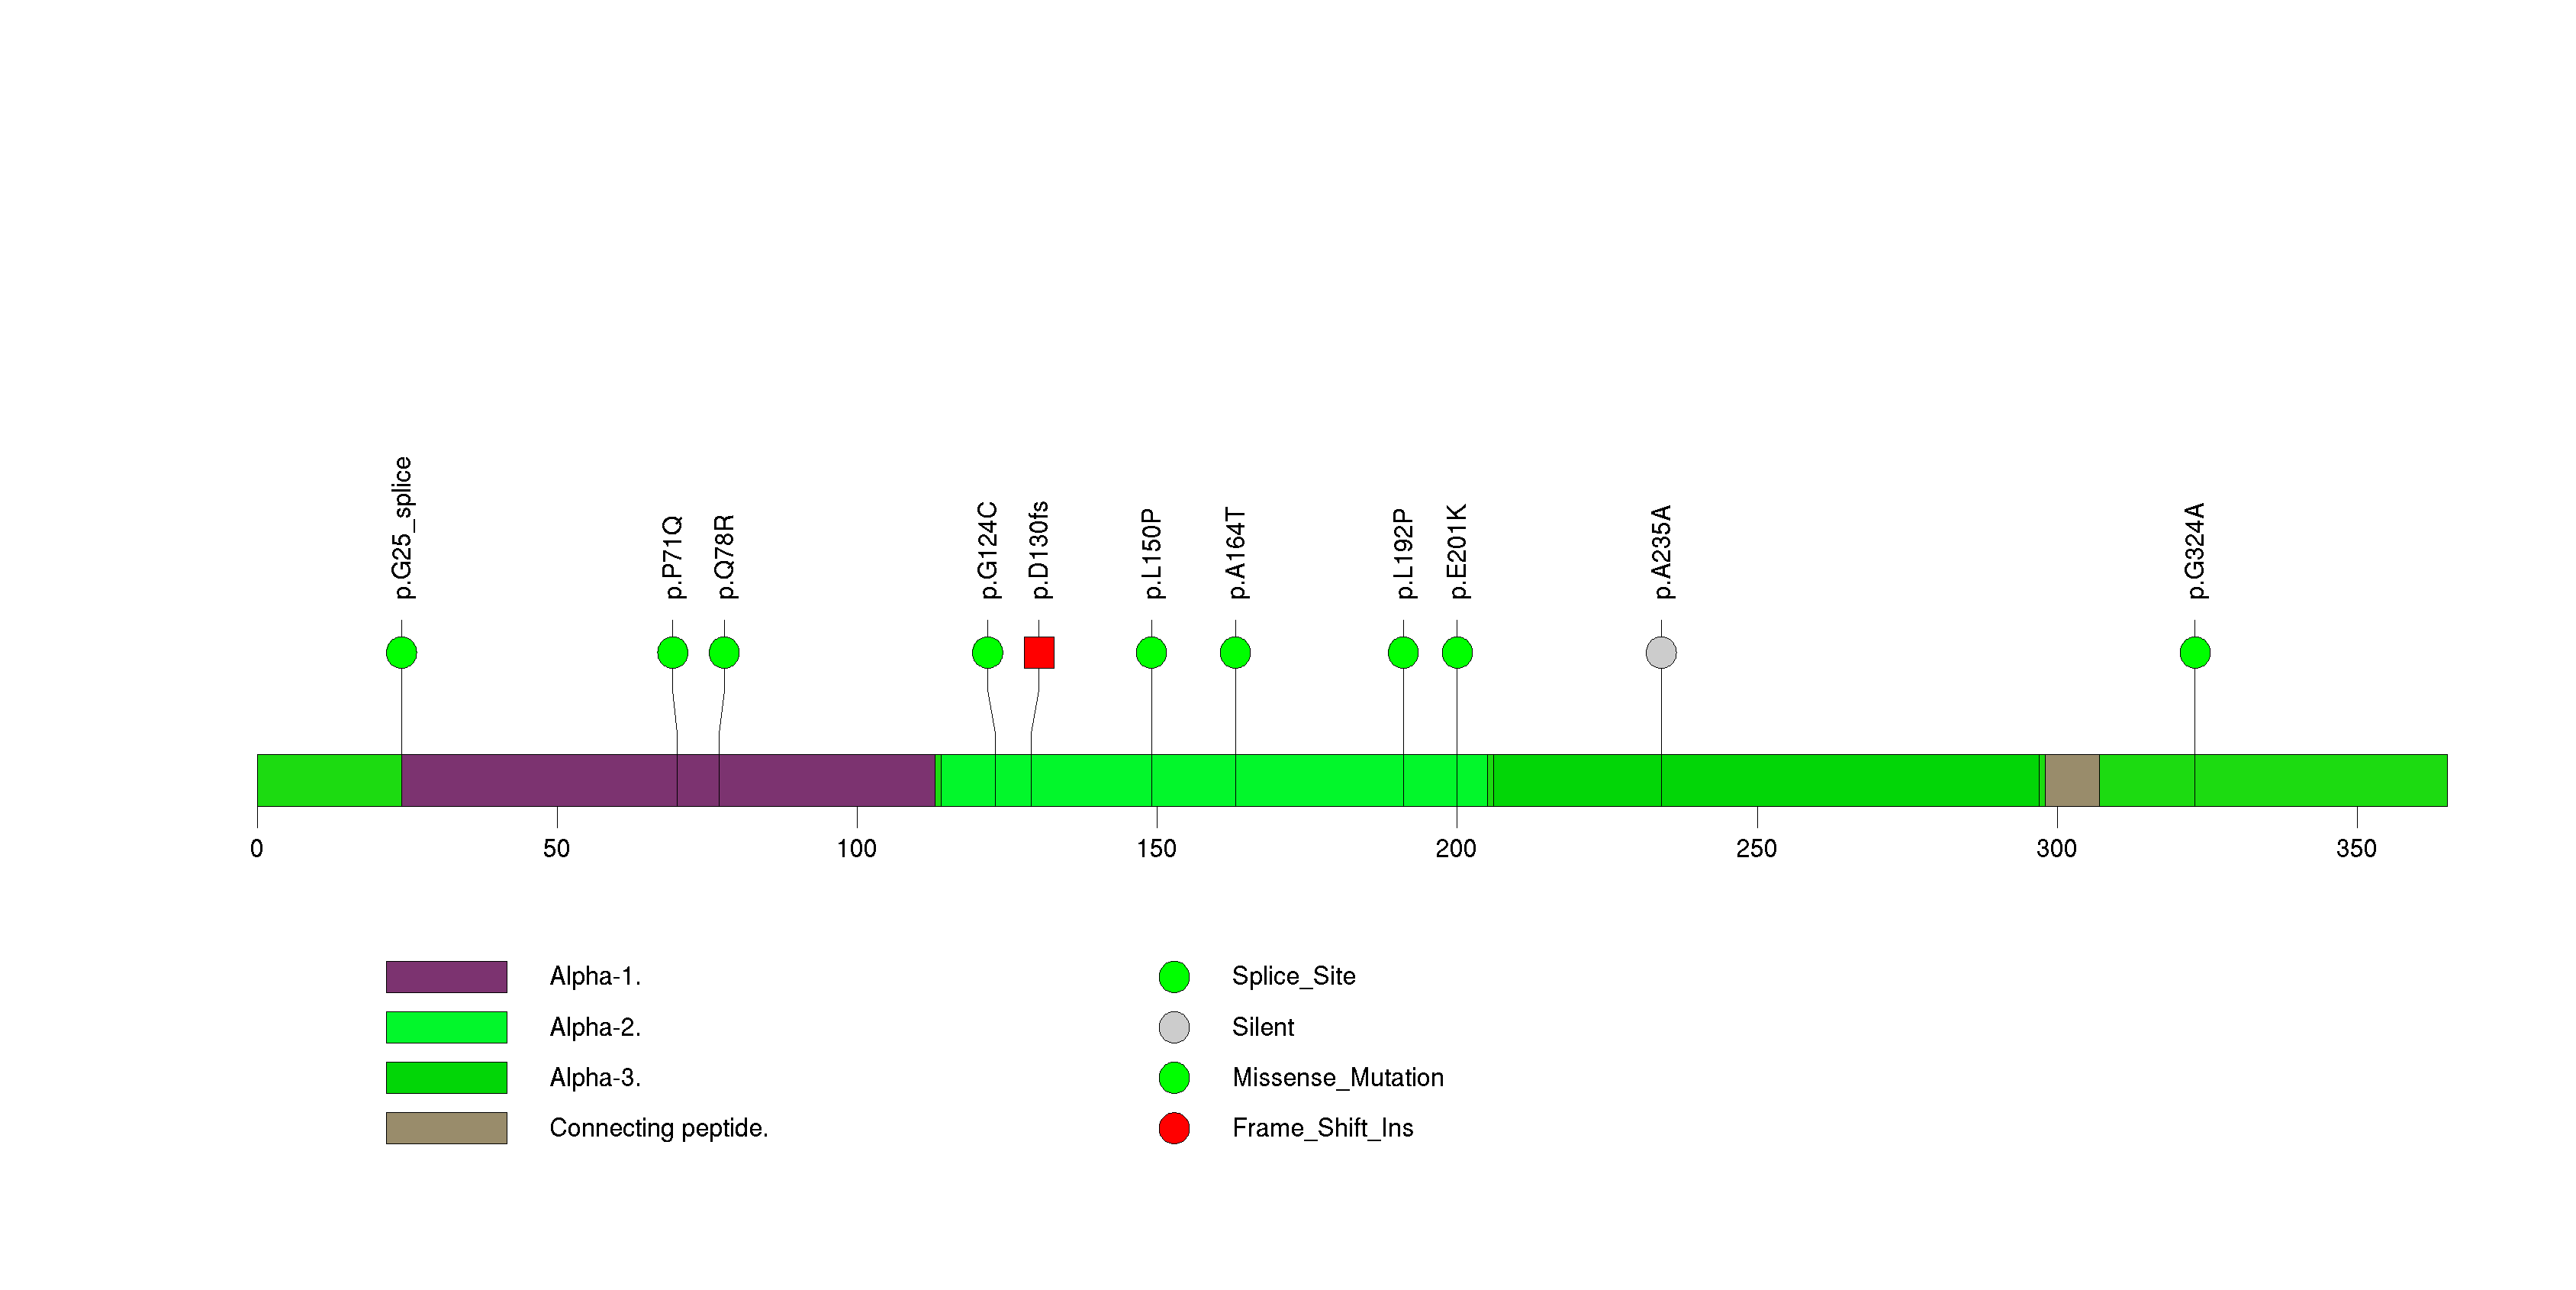
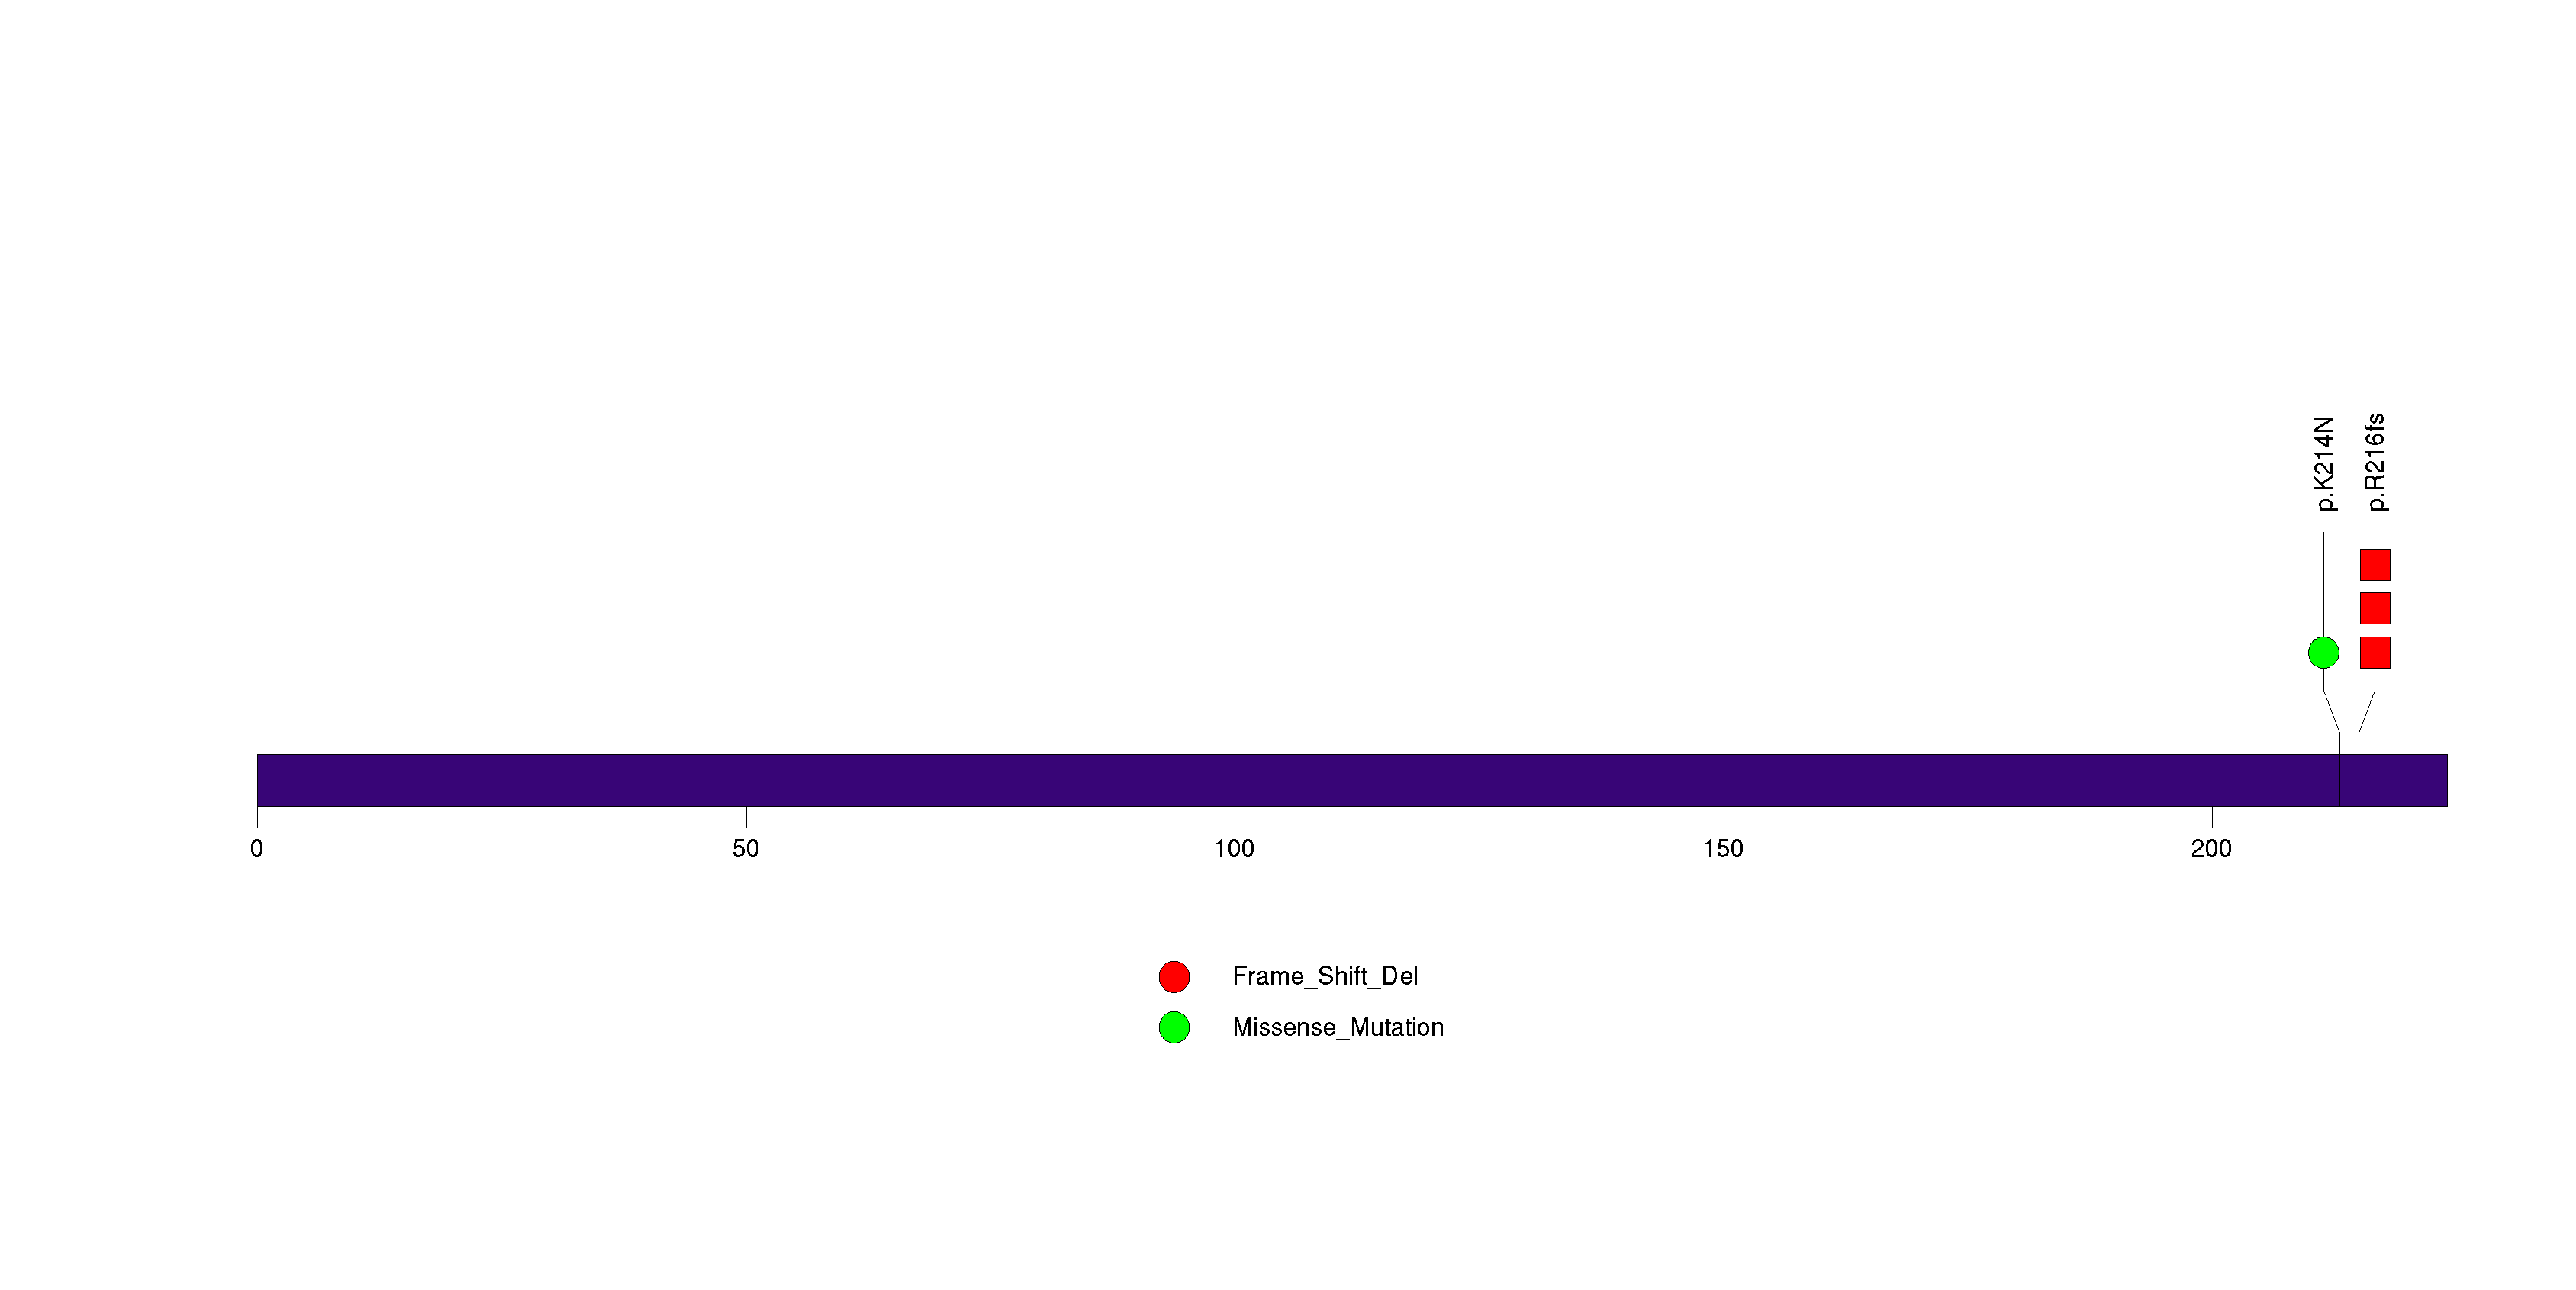
Figure S27. This figure depicts the distribution of mutations and mutation types across the SMAD4 significant gene.
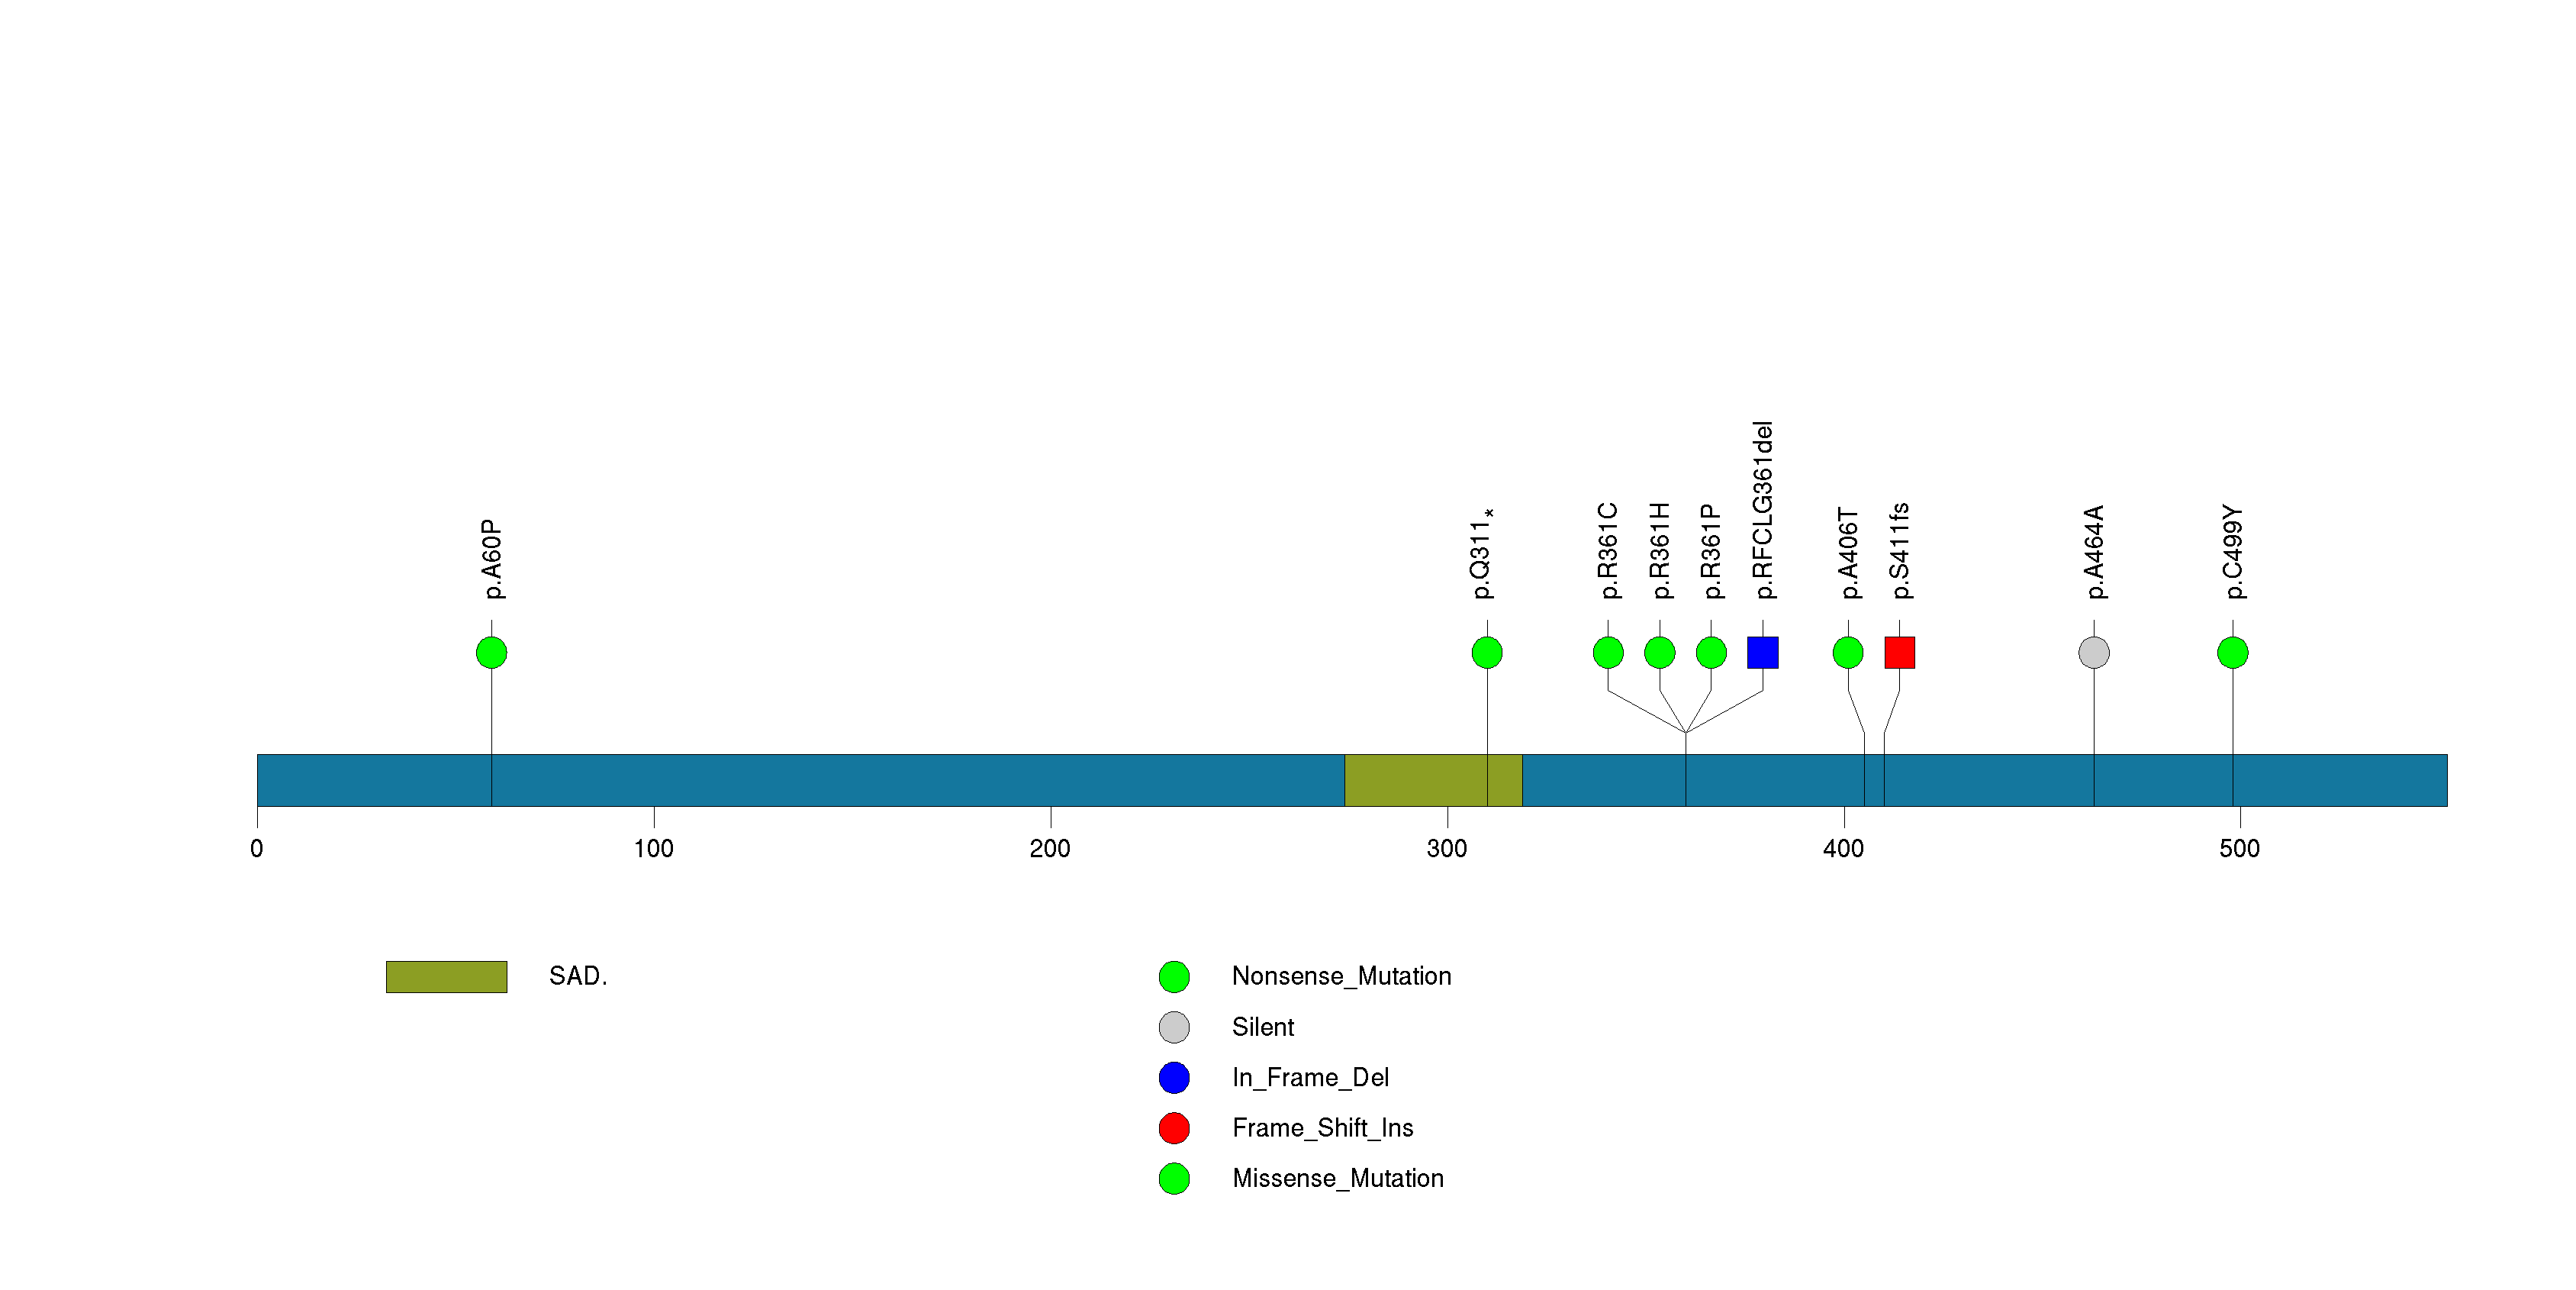
Figure S28. This figure depicts the distribution of mutations and mutation types across the UPF3A significant gene.
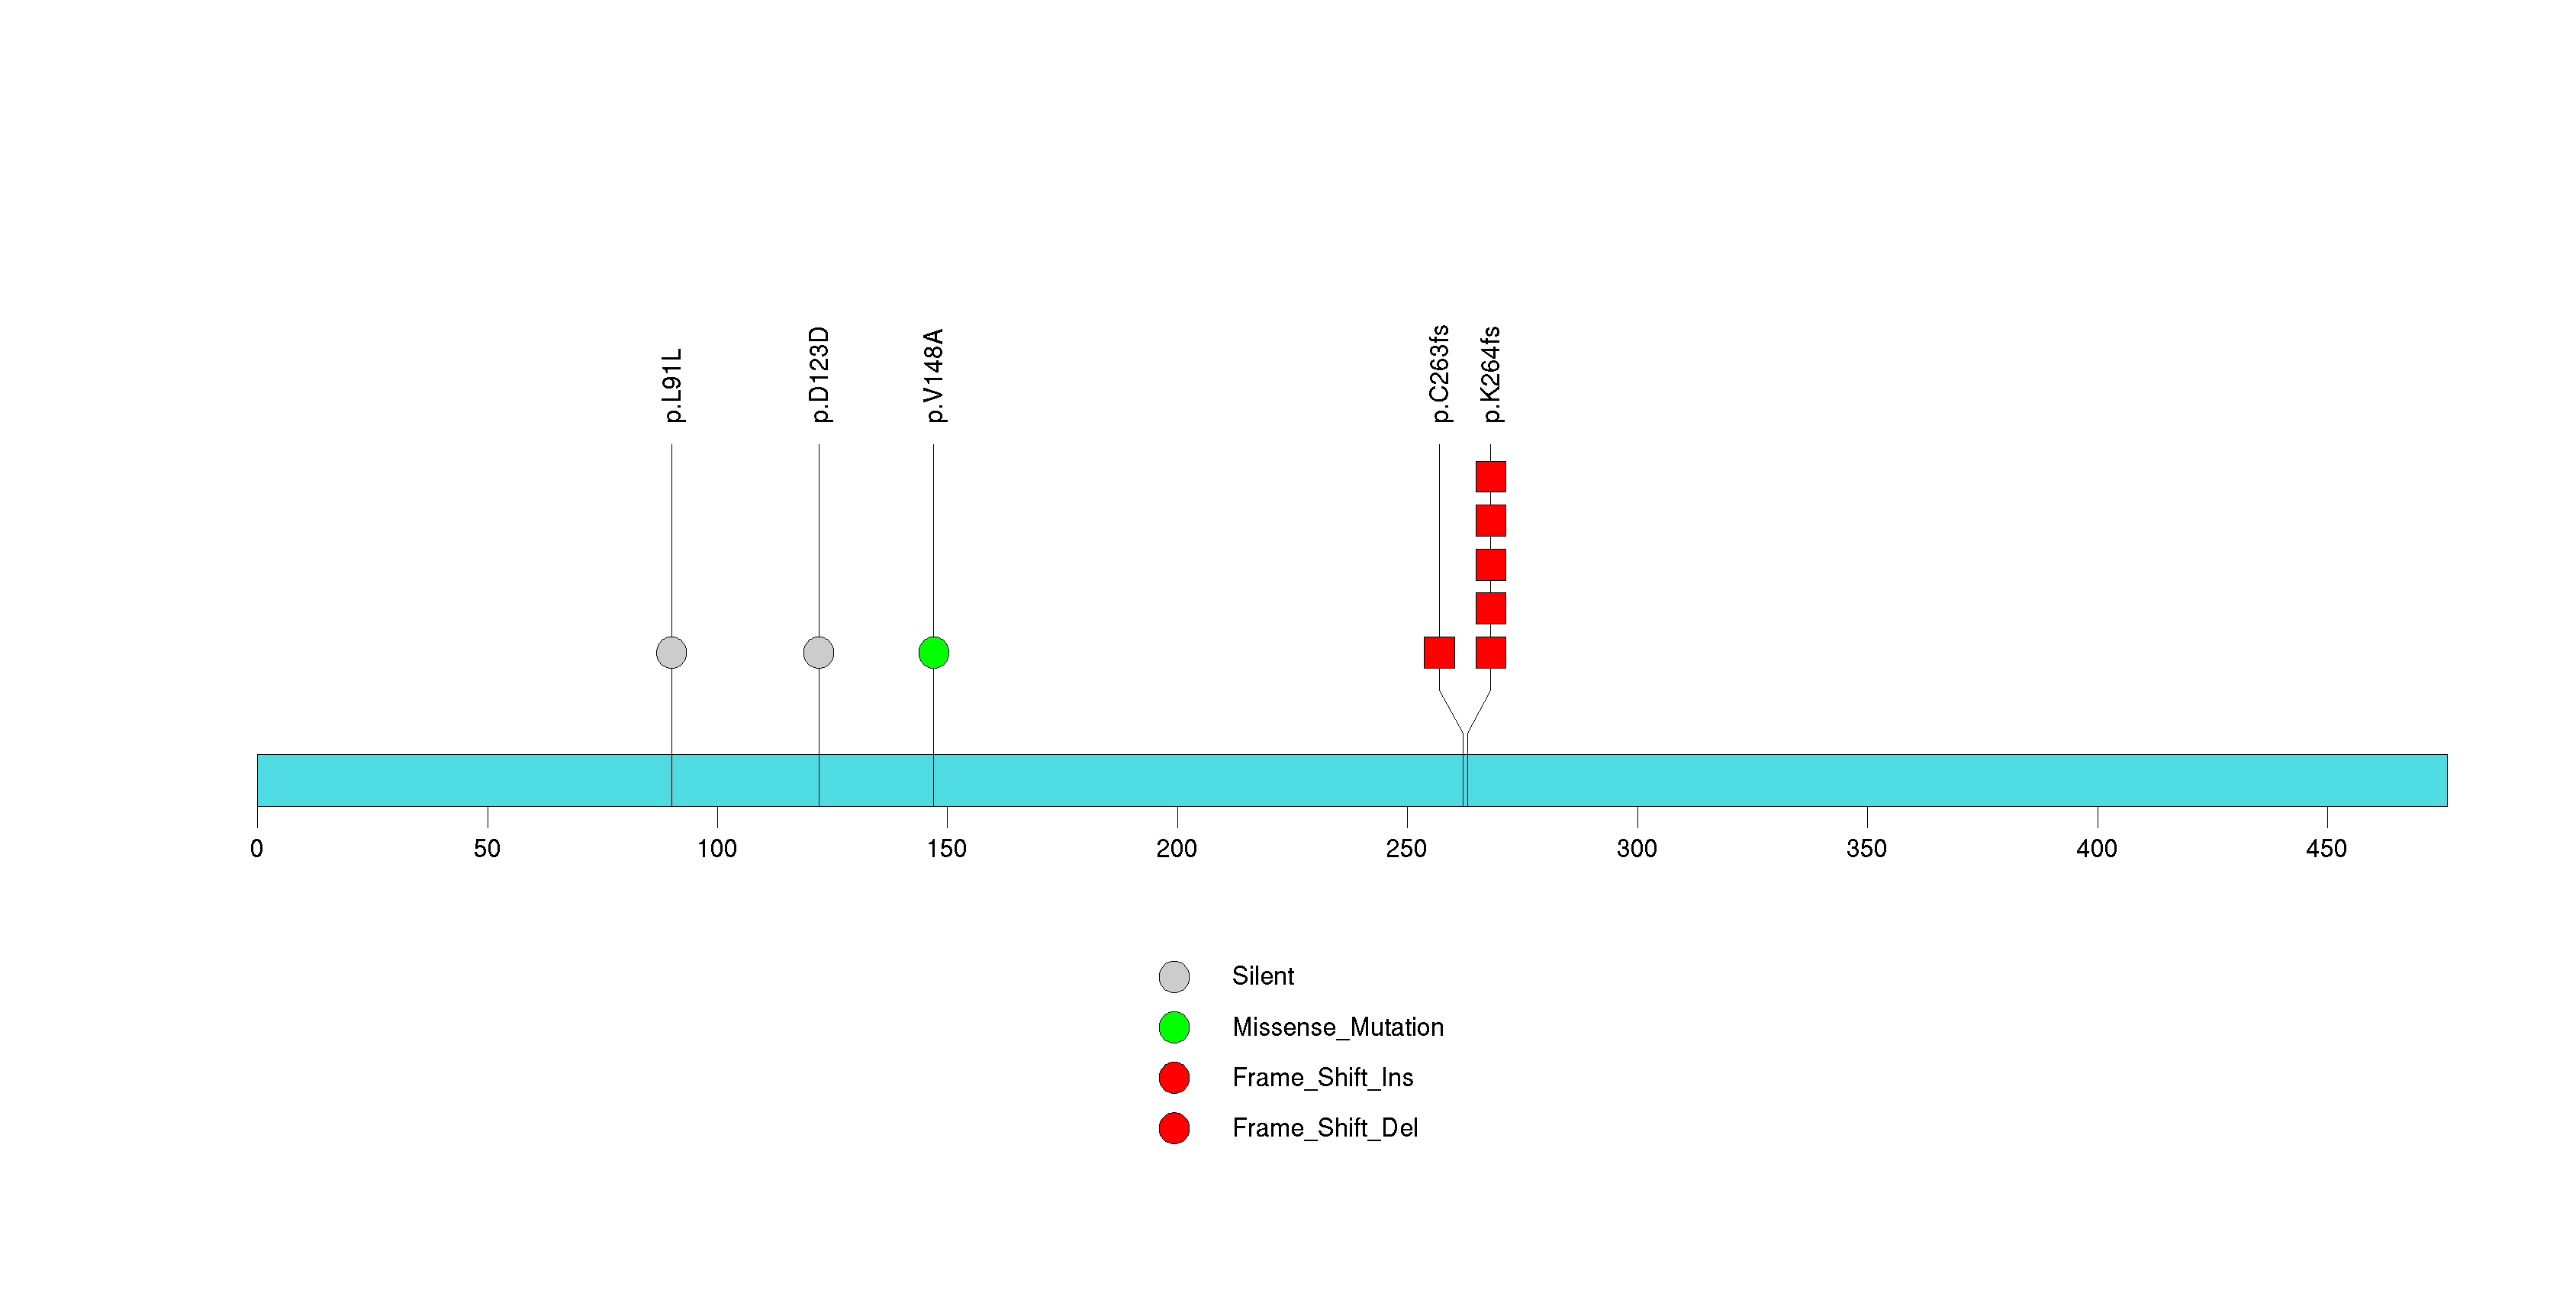
Figure S29. This figure depicts the distribution of mutations and mutation types across the CCDC43 significant gene.
In this analysis, COSMIC is used as a filter to increase power by restricting the territory of each gene. Cosmic version: v48.
Table 4. Get Full Table Significantly mutated genes (COSMIC territory only). To access the database please go to: COSMIC. Number of significant genes found: 22. Number of genes displayed: 10
| rank | gene | description | n | cos | n_cos | N_cos | cos_ev | p | q |
|---|---|---|---|---|---|---|---|---|---|
| 1 | ACVR2A | activin A receptor, type IIA | 18 | 3 | 14 | 399 | 14 | 7.3e-15 | 3.3e-11 |
| 2 | KRAS | v-Ki-ras2 Kirsten rat sarcoma viral oncogene homolog | 17 | 51 | 15 | 6783 | 100690 | 1.1e-13 | 2.5e-10 |
| 3 | PIK3CA | phosphoinositide-3-kinase, catalytic, alpha polypeptide | 33 | 184 | 30 | 24472 | 10503 | 3.2e-13 | 4.7e-10 |
| 4 | TP53 | tumor protein p53 | 67 | 308 | 63 | 40964 | 21281 | 4.2e-13 | 4.7e-10 |
| 5 | SMAD4 | SMAD family member 4 | 9 | 159 | 8 | 21147 | 25 | 1.3e-09 | 1.2e-06 |
| 6 | CDH1 | cadherin 1, type 1, E-cadherin (epithelial) | 14 | 184 | 8 | 24472 | 32 | 4.1e-09 | 3.1e-06 |
| 7 | FBXW7 | F-box and WD repeat domain containing 7 | 11 | 91 | 6 | 12103 | 279 | 3.2e-08 | 0.000021 |
| 8 | ERBB3 | v-erb-b2 erythroblastic leukemia viral oncogene homolog 3 (avian) | 21 | 6 | 3 | 798 | 3 | 2.4e-07 | 0.00014 |
| 9 | PKHD1 | polycystic kidney and hepatic disease 1 (autosomal recessive) | 20 | 8 | 3 | 1064 | 3 | 5.8e-07 | 0.00029 |
| 10 | SMAD2 | SMAD family member 2 | 8 | 10 | 3 | 1330 | 9 | 1.1e-06 | 0.00051 |
Note:
n - number of (nonsilent) mutations in this gene across the individual set.
cos = number of unique mutated sites in this gene in COSMIC
n_cos = overlap between n and cos.
N_cos = number of individuals times cos.
cos_ev = total evidence: number of reports in COSMIC for mutations seen in this gene.
p = p-value for seeing the observed amount of overlap in this gene)
q = q-value, False Discovery Rate (Benjamini-Hochberg procedure)
Table 5. Get Full Table Genes with Clustered Mutations
| num | gene | desc | n | mindist | nmuts0 | nmuts3 | nmuts12 | npairs0 | npairs3 | npairs12 |
|---|---|---|---|---|---|---|---|---|---|---|
| 2085 | CBWD1 | COBW domain containing 1 | 18 | 0 | 120 | 120 | 120 | 120 | 120 | 120 |
| 9398 | PGM5 | phosphoglucomutase 5 | 21 | 0 | 92 | 92 | 120 | 92 | 92 | 120 |
| 13043 | TP53 | tumor protein p53 | 67 | 0 | 70 | 137 | 247 | 70 | 137 | 247 |
| 13160 | TRIM48 | tripartite motif-containing 48 | 14 | 0 | 66 | 66 | 78 | 66 | 66 | 78 |
| 9498 | PIK3CA | phosphoinositide-3-kinase, catalytic, alpha polypeptide | 33 | 0 | 40 | 81 | 95 | 40 | 81 | 95 |
| 6691 | KRAS | v-Ki-ras2 Kirsten rat sarcoma viral oncogene homolog | 17 | 0 | 30 | 68 | 69 | 30 | 68 | 69 |
| 520 | ANAPC1 | anaphase promoting complex subunit 1 | 14 | 0 | 21 | 21 | 21 | 21 | 21 | 21 |
| 13903 | XPOT | exportin, tRNA (nuclear export receptor for tRNAs) | 7 | 0 | 15 | 15 | 15 | 15 | 15 | 15 |
| 10633 | RHOA | ras homolog gene family, member A | 8 | 0 | 10 | 11 | 16 | 10 | 11 | 16 |
| 13333 | TTN | titin | 273 | 0 | 5 | 13 | 29 | 5 | 13 | 29 |
Note:
n - number of mutations in this gene in the individual set.
mindist - distance (in aa) between closest pair of mutations in this gene
npairs3 - how many pairs of mutations are within 3 aa of each other.
npairs12 - how many pairs of mutations are within 12 aa of each other.
Table 6. Get Full Table A Ranked List of Significantly Mutated Genesets. (Source: MSigDB GSEA Cannonical Pathway Set).Number of significant genesets found: 12. Number of genesets displayed: 10
| rank | geneset | description | genes | N_genes | mut_tally | N | n | npat | nsite | nsil | n1 | n2 | n3 | n4 | n5 | n6 | p_ns_s | p | q |
|---|---|---|---|---|---|---|---|---|---|---|---|---|---|---|---|---|---|---|---|
| 1 | RNAPATHWAY | dsRNA-activated protein kinase phosphorylates elF2a, which generally inhibits translation, and activates NF-kB to provoke inflammation. | CHUK, DNAJC3, EIF2S1, EIF2S2, MAP3K14, NFKB1, NFKBIA, PRKR, RELA, TP53 | 9 | DNAJC3(1), EIF2S1(1), EIF2S2(2), MAP3K14(3), NFKB1(5), RELA(2), TP53(67) | 1951817 | 81 | 67 | 62 | 7 | 24 | 16 | 2 | 16 | 22 | 1 | 0.00014 | <1.00e-15 | <4.10e-13 |
| 2 | TERTPATHWAY | hTERC, the RNA subunit of telomerase, and hTERT, the catalytic protein subunit, are required for telomerase activity and are overexpressed in many cancers. | HDAC1, MAX, MYC, SP1, SP3, TP53, WT1, ZNF42 | 7 | HDAC1(2), MAX(1), SP1(3), SP3(3), TP53(67), WT1(1) | 1390783 | 77 | 67 | 58 | 9 | 24 | 17 | 2 | 11 | 22 | 1 | 0.000094 | 1.33e-15 | 4.10e-13 |
| 3 | RBPATHWAY | The ATM protein kinase recognizes DNA damage and blocks cell cycle progression by phosphorylating chk1 and p53, which normally inhibits Rb to allow G1/S transitions. | ATM, CDC2, CDC25A, CDC25B, CDC25C, CDK2, CDK4, CHEK1, MYT1, RB1, TP53, WEE1, YWHAH | 12 | ATM(17), CDC25A(2), CDC25B(4), CDC25C(3), CDK2(2), CHEK1(2), MYT1(12), RB1(8), TP53(67), WEE1(1), YWHAH(1) | 3508527 | 119 | 78 | 98 | 12 | 37 | 31 | 5 | 16 | 28 | 2 | 4.4e-06 | 3.55e-15 | 6.84e-13 |
| 4 | SA_G1_AND_S_PHASES | Cdk2, 4, and 6 bind cyclin D in G1, while cdk2/cyclin E promotes the G1/S transition. | ARF1, ARF3, CCND1, CDK2, CDK4, CDKN1A, CDKN1B, CDKN2A, CFL1, E2F1, E2F2, MDM2, NXT1, PRB1, TP53 | 15 | ARF1(2), CCND1(1), CDK2(2), CDKN1A(1), CDKN2A(4), CFL1(1), E2F2(2), MDM2(3), NXT1(2), PRB1(2), TP53(67) | 1604627 | 87 | 72 | 68 | 11 | 27 | 21 | 3 | 12 | 23 | 1 | 0.00016 | 4.44e-15 | 6.84e-13 |
| 5 | PLK3PATHWAY | Active Plk3 phosphorylates CDC25c, blocking the G2/M transition, and phosphorylates p53 to induce apoptosis. | ATM, ATR, CDC25C, CHEK1, CHEK2, CNK, TP53, YWHAH | 7 | ATM(17), ATR(5), CDC25C(3), CHEK1(2), CHEK2(5), TP53(67), YWHAH(1) | 3188811 | 100 | 77 | 80 | 11 | 32 | 24 | 4 | 13 | 25 | 2 | 0.00047 | 7.77e-15 | 9.57e-13 |
| 6 | ARFPATHWAY | Cyclin-dependent kinase inhibitor 2A is a tumor suppressor that induces G1 arrest and can activate the p53 pathway, leading to G2/M arrest. | ABL1, CDKN2A, E2F1, MDM2, MYC, PIK3CA, PIK3R1, POLR1A, POLR1B, POLR1C, POLR1D, RAC1, RB1, TBX2, TP53, TWIST1 | 16 | ABL1(2), CDKN2A(4), MDM2(3), PIK3CA(33), PIK3R1(7), POLR1A(8), POLR1B(2), POLR1C(2), POLR1D(1), RB1(8), TBX2(4), TP53(67), TWIST1(1) | 4003294 | 142 | 87 | 108 | 24 | 36 | 48 | 6 | 21 | 30 | 1 | 0.000054 | 1.24e-14 | 1.28e-12 |
| 7 | P53HYPOXIAPATHWAY | Hypoxia induces p53 accumulation and consequent apoptosis with p53-mediated cell cycle arrest, which is present under conditions of DNA damage. | ABCB1, AKT1, ATM, BAX, CDKN1A, CPB2, CSNK1A1, CSNK1D, FHL2, GADD45A, HIC1, HIF1A, HSPA1A, HSPCA, IGFBP3, MAPK8, MDM2, NFKBIB, NQO1, TP53 | 19 | ABCB1(10), AKT1(2), ATM(17), CDKN1A(1), CPB2(4), CSNK1D(2), FHL2(2), HIC1(1), HIF1A(2), HSPA1A(1), IGFBP3(4), MAPK8(4), MDM2(3), NFKBIB(4), NQO1(3), TP53(67) | 4118242 | 127 | 84 | 107 | 21 | 40 | 33 | 4 | 19 | 29 | 2 | 0.0002 | 3.99e-13 | 3.51e-11 |
| 8 | TIDPATHWAY | On ligand binding, interferon gamma receptors stimulate JAK2 kinase to phosphorylate STAT transcription factors, which promote expression of interferon responsive genes. | DNAJA3, HSPA1A, IFNG, IFNGR1, IFNGR2, IKBKB, JAK2, LIN7A, NFKB1, NFKBIA, RB1, RELA, TIP-1, TNF, TNFRSF1A, TNFRSF1B, TP53, USH1C, WT1 | 18 | DNAJA3(2), HSPA1A(1), IFNG(2), IFNGR1(2), IFNGR2(1), IKBKB(3), JAK2(8), LIN7A(6), NFKB1(5), RB1(8), RELA(2), TNF(2), TNFRSF1A(3), TNFRSF1B(1), TP53(67), USH1C(1), WT1(1) | 3602378 | 115 | 75 | 94 | 18 | 30 | 27 | 3 | 24 | 30 | 1 | 0.00044 | 5.00e-13 | 3.85e-11 |
| 9 | CHEMICALPATHWAY | DNA damage promotes Bid cleavage, which stimulates mitochondrial cytochrome c release and consequent caspase activation, resulting in apoptosis. | ADPRT, AKT1, APAF1, ATM, BAD, BAX, BCL2, BCL2L1, BID, CASP3, CASP6, CASP7, CASP9, CYCS, EIF2S1, PRKCA, PRKCB1, PTK2, PXN, STAT1, TLN1, TP53 | 20 | AKT1(2), APAF1(2), ATM(17), BAD(1), BCL2(1), BID(1), CASP3(1), CASP6(1), CASP7(2), CASP9(1), CYCS(1), EIF2S1(1), PTK2(7), PXN(2), STAT1(6), TLN1(13), TP53(67) | 5433042 | 126 | 78 | 106 | 18 | 43 | 32 | 7 | 16 | 26 | 2 | 0.000038 | 3.01e-11 | 2.02e-09 |
| 10 | ATMPATHWAY | The tumor-suppressing protein kinase ATM responds to radiation-induced DNA damage by blocking cell-cycle progression and activating DNA repair. | ABL1, ATM, BRCA1, CDKN1A, CHEK1, CHEK2, GADD45A, JUN, MAPK8, MDM2, MRE11A, NBS1, NFKB1, NFKBIA, RAD50, RAD51, RBBP8, RELA, TP53, TP73 | 19 | ABL1(2), ATM(17), BRCA1(9), CDKN1A(1), CHEK1(2), CHEK2(5), JUN(2), MAPK8(4), MDM2(3), MRE11A(2), NFKB1(5), RAD50(6), RAD51(1), RBBP8(4), RELA(2), TP53(67), TP73(5) | 5915081 | 137 | 83 | 117 | 21 | 36 | 36 | 5 | 26 | 32 | 2 | 0.0004 | 3.28e-11 | 2.02e-09 |
Table 7. Get Full Table A Ranked List of Significantly Mutated Genesets (Excluding Significantly Mutated Genes). Number of significant genesets found: 0. Number of genesets displayed: 10
| rank | geneset | description | genes | N_genes | mut_tally | N | n | npat | nsite | nsil | n1 | n2 | n3 | n4 | n5 | n6 | p_ns_s | p | q |
|---|---|---|---|---|---|---|---|---|---|---|---|---|---|---|---|---|---|---|---|
| 1 | HSA00472_D_ARGININE_AND_D_ORNITHINE_METABOLISM | Genes involved in D-arginine and D-ornithine metabolism | DAO | 1 | DAO(5) | 143247 | 5 | 5 | 5 | 1 | 1 | 0 | 1 | 1 | 2 | 0 | 0.55 | 0.018 | 1 |
| 2 | TCRMOLECULE | T Cell Receptor and CD3 Complex | CD3D, CD3E, CD3G, CD3Z, TRA@, TRB@ | 3 | CD3E(3), CD3G(2) | 225536 | 5 | 5 | 4 | 1 | 0 | 2 | 1 | 0 | 2 | 0 | 0.68 | 0.1 | 1 |
| 3 | ERBB4PATHWAY | ErbB4 (aka HER4) is a receptor tyrosine kinase that binds neuregulins as well as members of the EGF family, which also target EGF receptors. | ADAM17, ERBB4, NRG2, NRG3, PRKCA, PRKCB1, PSEN1 | 6 | ADAM17(3), ERBB4(18), NRG2(5), NRG3(9), PSEN1(1) | 1780945 | 36 | 27 | 35 | 6 | 8 | 13 | 4 | 7 | 4 | 0 | 0.03 | 0.19 | 1 |
| 4 | SLRPPATHWAY | Small leucine-rich proteoglycans (SLRPs) interact with and reorganize collagen fibers in the extracellular matrix. | BGN, DCN, DSPG3, FMOD, KERA, LUM | 5 | BGN(2), DCN(2), FMOD(9), KERA(1), LUM(3) | 721456 | 17 | 15 | 17 | 4 | 8 | 3 | 0 | 5 | 1 | 0 | 0.29 | 0.25 | 1 |
| 5 | FLUMAZENILPATHWAY | Flumazenil is a benzodiazepine receptor antagonist that may induce protective preconditioning in ischemic cardiomyocytes. | GABRA1, GABRA2, GABRA3, GABRA4, GABRA5, GABRA6, GPX1, PRKCE, SOD1 | 9 | GABRA1(5), GABRA2(5), GABRA3(5), GABRA4(4), GABRA5(5), GABRA6(5), GPX1(1), PRKCE(6) | 1565795 | 36 | 24 | 36 | 9 | 13 | 7 | 5 | 10 | 1 | 0 | 0.13 | 0.27 | 1 |
| 6 | UREACYCLEPATHWAY | Ammonia released from amino acid deamination is used to produce carbamoyl phosphate, which is used to convert ornithine to citrulline, from which urea is eventually formed. | ARG1, ASL, ASS, CPS1, GLS, GLUD1, GOT1 | 6 | ARG1(2), ASL(5), CPS1(15), GLS(4), GLUD1(4), GOT1(2) | 1545002 | 32 | 25 | 32 | 7 | 9 | 9 | 2 | 10 | 2 | 0 | 0.14 | 0.38 | 1 |
| 7 | EOSINOPHILSPATHWAY | Recruitment of eosinophils in the inflammatory response observed in asthma occurs via the chemoattractant eotaxin binding to the CCR3 receptor. | CCL11, CCL5, CCR3, CSF2, HLA-DRA, HLA-DRB1, IL3, IL5 | 8 | CCL11(1), CCL5(1), CCR3(4), HLA-DRA(3), HLA-DRB1(1), IL3(1) | 602660 | 11 | 10 | 11 | 3 | 4 | 4 | 0 | 2 | 1 | 0 | 0.35 | 0.38 | 1 |
| 8 | GABAPATHWAY | Gamma-aminobutyric acid (GABA) is an inhibitory neurotransmitter whose receptor is regulated by Plic-1, gephyrin, and GABARAP, which promote receptor clustering. | DNM1, GABARAP, GABRA1, GABRA2, GABRA3, GABRA4, GABRA5, GABRA6, GPHN, NSF, SRC, UBQLN1 | 11 | DNM1(5), GABRA1(5), GABRA2(5), GABRA3(5), GABRA4(4), GABRA5(5), GABRA6(5), GPHN(7), UBQLN1(4) | 2211584 | 45 | 26 | 45 | 9 | 11 | 10 | 6 | 13 | 5 | 0 | 0.058 | 0.41 | 1 |
| 9 | IL18PATHWAY | Pro-inflammatory IL-18 is activated in macrophages by caspase-1 cleavage and, in conjunction with IL-12, stimulates Th1 cell differentiation. | CASP1, IFNG, IL12A, IL12B, IL18, IL2 | 6 | CASP1(2), IFNG(2), IL12B(2), IL2(1) | 592301 | 7 | 7 | 7 | 1 | 0 | 3 | 1 | 3 | 0 | 0 | 0.33 | 0.42 | 1 |
| 10 | HSA00660_C5_BRANCHED_DIBASIC_ACID_METABOLISM | Genes involved in C5-branched dibasic acid metabolism | ILVBL, SUCLA2 | 2 | ILVBL(3), SUCLA2(3) | 416247 | 6 | 6 | 6 | 0 | 3 | 0 | 0 | 1 | 2 | 0 | 0.19 | 0.5 | 1 |
In brief, we tabulate the number of mutations and the number of covered bases for each gene. The counts are broken down by mutation context category: four context categories that are discovered by MutSig, and one for indel and 'null' mutations, which include indels, nonsense mutations, splice-site mutations, and non-stop (read-through) mutations. For each gene, we calculate the probability of seeing the observed constellation of mutations, i.e. the product P1 x P2 x ... x Pm, or a more extreme one, given the background mutation rates calculated across the dataset. [1]
This is an experimental feature. The full results of the analysis summarized in this report can be downloaded from the TCGA Data Coordination Center.