This pipeline uses various statistical tests to identify mRNAs whose expression levels correlated to selected clinical features.
Testing the association between 18585 genes and 5 clinical features across 333 samples, statistically thresholded by Q value < 0.05, 4 clinical features related to at least one genes.
-
1 gene correlated to 'Time to Death'.
-
KCNK10|54207
-
259 genes correlated to 'AGE'.
-
DIO2|1734 , MGAT4A|11320 , TNFAIP2|7127 , HIF3A|64344 , DACT1|51339 , ...
-
2047 genes correlated to 'HISTOLOGICAL.TYPE'.
-
L1CAM|3897 , KIAA1324|57535 , CLDN6|9074 , SPDEF|25803 , TFF3|7033 , ...
-
3 genes correlated to 'RADIATIONS.RADIATION.REGIMENINDICATION'.
-
F13A1|2162 , COG5|10466 , C8ORF79|57604
-
No genes correlated to 'NEOADJUVANT.THERAPY'
Complete statistical result table is provided in Supplement Table 1
Table 1. Get Full Table This table shows the clinical features, statistical methods used, and the number of genes that are significantly associated with each clinical feature at Q value < 0.05.
| Clinical feature | Statistical test | Significant genes | Associated with | Associated with | ||
|---|---|---|---|---|---|---|
| Time to Death | Cox regression test | N=1 | shorter survival | N=1 | longer survival | N=0 |
| AGE | Spearman correlation test | N=259 | older | N=148 | younger | N=111 |
| HISTOLOGICAL TYPE | ANOVA test | N=2047 | ||||
| RADIATIONS RADIATION REGIMENINDICATION | t test | N=3 | yes | N=3 | no | N=0 |
| NEOADJUVANT THERAPY | t test | N=0 |
Table S1. Basic characteristics of clinical feature: 'Time to Death'
| Time to Death | Duration (Months) | 0-187.1 (median=18.2) |
| censored | N = 304 | |
| death | N = 28 | |
| Significant markers | N = 1 | |
| associated with shorter survival | 1 | |
| associated with longer survival | 0 |
Table S2. Get Full Table List of one gene significantly associated with 'Time to Death' by Cox regression test
| HazardRatio | Wald_P | Q | C_index | |
|---|---|---|---|---|
| KCNK10|54207 | 1.95 | 2.202e-07 | 0.0041 | 0.738 |
Figure S1. Get High-res Image As an example, this figure shows the association of KCNK10|54207 to 'Time to Death'. four curves present the cumulative survival rates of 4 quartile subsets of patients. P value = 2.2e-07 with univariate Cox regression analysis using continuous log-2 expression values.
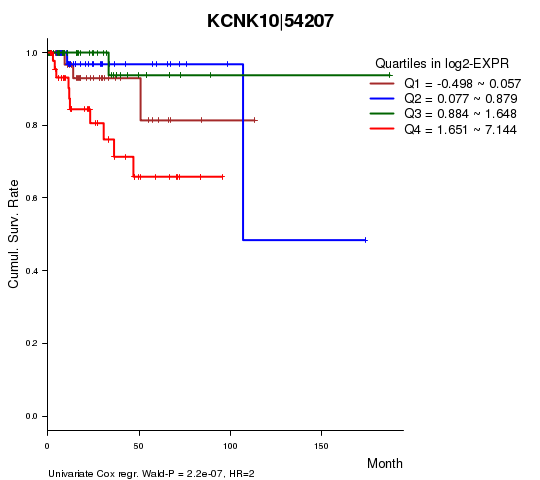
Table S3. Basic characteristics of clinical feature: 'AGE'
| AGE | Mean (SD) | 63.23 (11) |
| Significant markers | N = 259 | |
| pos. correlated | 148 | |
| neg. correlated | 111 |
Table S4. Get Full Table List of top 10 genes significantly correlated to 'AGE' by Spearman correlation test
| SpearmanCorr | corrP | Q | |
|---|---|---|---|
| DIO2|1734 | -0.4205 | 1.069e-15 | 1.99e-11 |
| MGAT4A|11320 | 0.373 | 1.97e-12 | 3.66e-08 |
| TNFAIP2|7127 | 0.3729 | 2.012e-12 | 3.74e-08 |
| HIF3A|64344 | 0.3737 | 3.039e-12 | 5.65e-08 |
| DACT1|51339 | -0.363 | 8.302e-12 | 1.54e-07 |
| FAM107A|11170 | 0.3628 | 8.504e-12 | 1.58e-07 |
| NR2F6|2063 | 0.3548 | 2.57e-11 | 4.77e-07 |
| GPR158|57512 | 0.3951 | 2.949e-11 | 5.48e-07 |
| DUSP9|1852 | 0.3712 | 3.112e-11 | 5.78e-07 |
| AEN|64782 | -0.351 | 4.36e-11 | 8.1e-07 |
Figure S2. Get High-res Image As an example, this figure shows the association of DIO2|1734 to 'AGE'. P value = 1.07e-15 with Spearman correlation analysis. The straight line presents the best linear regression.
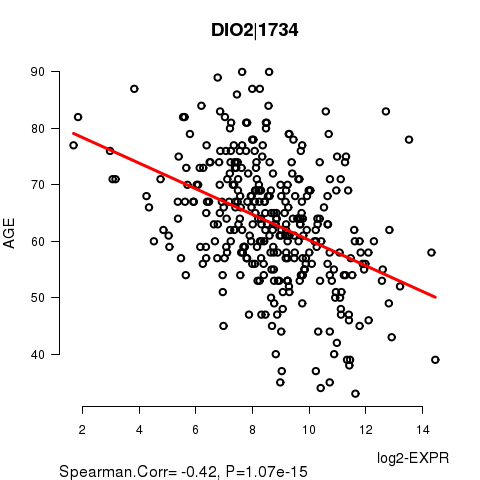
Table S5. Basic characteristics of clinical feature: 'HISTOLOGICAL.TYPE'
| HISTOLOGICAL.TYPE | Labels | N |
| ENDOMETRIOID ENDOMETRIAL ADENOCARCINOMA | 252 | |
| ENDOMETRIOID ENDOMETRIAL ADENOCARCINOMA (GRADE 1 OR 2) | 3 | |
| ENDOMETRIOID ENDOMETRIAL ADENOCARCINOMA (GRADE 1) | 7 | |
| ENDOMETRIOID ENDOMETRIAL ADENOCARCINOMA (GRADE 2) | 2 | |
| ENDOMETRIOID ENDOMETRIAL ADENOCARCINOMA (GRADE 3) | 7 | |
| MIXED SEROUS AND ENDOMETRIOID | 10 | |
| SEROUS ENDOMETRIAL ADENOCARCINOMA | 52 | |
| Significant markers | N = 2047 |
Table S6. Get Full Table List of top 10 genes differentially expressed by 'HISTOLOGICAL.TYPE'
| ANOVA_P | Q | |
|---|---|---|
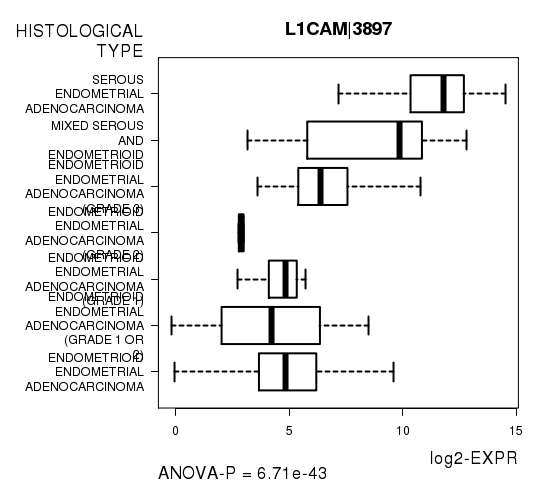
| L1CAM|3897 | 6.712e-43 | 1.25e-38 |
| KIAA1324|57535 | 1.749e-40 | 3.25e-36 |
| CLDN6|9074 | 2.003e-33 | 3.72e-29 |
| SPDEF|25803 | 4.351e-31 | 8.09e-27 |
| TFF3|7033 | 9.558e-31 | 1.78e-26 |
| GRB7|2886 | 1.703e-30 | 3.16e-26 |
| SLC6A12|6539 | 3.543e-30 | 6.58e-26 |
| HIF3A|64344 | 5.31e-28 | 9.87e-24 |
| FOXA2|3170 | 4.914e-27 | 9.13e-23 |
| SLC6A10P|386757 | 5.379e-27 | 9.99e-23 |
Figure S3. Get High-res Image As an example, this figure shows the association of L1CAM|3897 to 'HISTOLOGICAL.TYPE'. P value = 6.71e-43 with ANOVA analysis.
3 genes related to 'RADIATIONS.RADIATION.REGIMENINDICATION'.
Table S7. Basic characteristics of clinical feature: 'RADIATIONS.RADIATION.REGIMENINDICATION'
| RADIATIONS.RADIATION.REGIMENINDICATION | Labels | N |
| NO | 115 | |
| YES | 218 | |
| Significant markers | N = 3 | |
| Higher in YES | 3 | |
| Higher in NO | 0 |
Table S8. Get Full Table List of 3 genes differentially expressed by 'RADIATIONS.RADIATION.REGIMENINDICATION'
| T(pos if higher in 'YES') | ttestP | Q | AUC | |
|---|---|---|---|---|
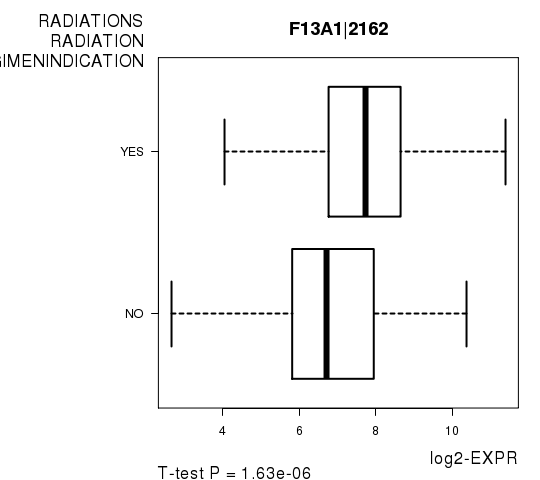
| F13A1|2162 | 4.91 | 1.626e-06 | 0.0302 | 0.6587 |
| COG5|10466 | 4.89 | 1.816e-06 | 0.0337 | 0.6548 |
| C8ORF79|57604 | 4.83 | 2.627e-06 | 0.0488 | 0.6585 |
Figure S4. Get High-res Image As an example, this figure shows the association of F13A1|2162 to 'RADIATIONS.RADIATION.REGIMENINDICATION'. P value = 1.63e-06 with T-test analysis.
-
Expresson data file = UCEC.uncv2.mRNAseq_RSEM_normalized_log2.txt
-
Clinical data file = UCEC.clin.merged.picked.txt
-
Number of patients = 333
-
Number of genes = 18585
-
Number of clinical features = 5
For survival clinical features, Wald's test in univariate Cox regression analysis with proportional hazards model (Andersen and Gill 1982) was used to estimate the P values using the 'coxph' function in R. Kaplan-Meier survival curves were plot using the four quartile subgroups of patients based on expression levels
For continuous numerical clinical features, Spearman's rank correlation coefficients (Spearman 1904) and two-tailed P values were estimated using 'cor.test' function in R
For multi-class clinical features (ordinal or nominal), one-way analysis of variance (Howell 2002) was applied to compare the log2-expression levels between different clinical classes using 'anova' function in R
For two-class clinical features, two-tailed Student's t test with unequal variance (Lehmann and Romano 2005) was applied to compare the log2-expression levels between the two clinical classes using 't.test' function in R
For multiple hypothesis correction, Q value is the False Discovery Rate (FDR) analogue of the P value (Benjamini and Hochberg 1995), defined as the minimum FDR at which the test may be called significant. We used the 'Benjamini and Hochberg' method of 'p.adjust' function in R to convert P values into Q values.
This is an experimental feature. The full results of the analysis summarized in this report can be downloaded from the TCGA Data Coordination Center.