This pipeline uses various statistical tests to identify genes whose promoter methylation levels correlated to selected clinical features.
Testing the association between 17584 genes and 5 clinical features across 220 samples, statistically thresholded by Q value < 0.05, 4 clinical features related to at least one genes.
-
4 genes correlated to 'Time to Death'.
-
TMEM84 , MIB2 , SLC38A8 , DUSP5P
-
100 genes correlated to 'AGE'.
-
SLFN14 , ACAA2 , SCARNA17 , PLA2G15 , ALS2CL , ...
-
1350 genes correlated to 'HISTOLOGICAL.TYPE'.
-
ARL13B , UBE2T , CARD11 , CRYAB , NCRNA00203 , ...
-
4 genes correlated to 'NEOADJUVANT.THERAPY'.
-
DNAH3 , C1GALT1 , RG9MTD3 , LOC647979
-
No genes correlated to 'RADIATIONS.RADIATION.REGIMENINDICATION'
Complete statistical result table is provided in Supplement Table 1
Table 1. Get Full Table This table shows the clinical features, statistical methods used, and the number of genes that are significantly associated with each clinical feature at Q value < 0.05.
| Clinical feature | Statistical test | Significant genes | Associated with | Associated with | ||
|---|---|---|---|---|---|---|
| Time to Death | Cox regression test | N=4 | shorter survival | N=0 | longer survival | N=4 |
| AGE | Spearman correlation test | N=100 | older | N=32 | younger | N=68 |
| HISTOLOGICAL TYPE | ANOVA test | N=1350 | ||||
| RADIATIONS RADIATION REGIMENINDICATION | t test | N=0 | ||||
| NEOADJUVANT THERAPY | t test | N=4 | yes | N=4 | no | N=0 |
Table S1. Basic characteristics of clinical feature: 'Time to Death'
| Time to Death | Duration (Months) | 0-187.1 (median=13.2) |
| censored | N = 202 | |
| death | N = 17 | |
| Significant markers | N = 4 | |
| associated with shorter survival | 0 | |
| associated with longer survival | 4 |
Table S2. Get Full Table List of 4 genes significantly associated with 'Time to Death' by Cox regression test
| HazardRatio | Wald_P | Q | C_index | |
|---|---|---|---|---|
| TMEM84 | 0 | 1.359e-07 | 0.0024 | 0.367 |
| MIB2 | 0 | 2.42e-07 | 0.0043 | 0.377 |
| SLC38A8 | 0 | 1.518e-06 | 0.027 | 0.392 |
| DUSP5P | 0.01 | 2.2e-06 | 0.039 | 0.365 |
Figure S1. Get High-res Image As an example, this figure shows the association of TMEM84 to 'Time to Death'. four curves present the cumulative survival rates of 4 quartile subsets of patients. P value = 1.36e-07 with univariate Cox regression analysis using continuous log-2 expression values.
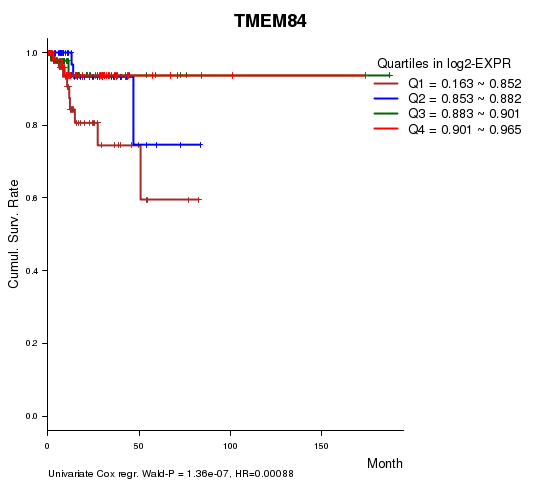
Table S3. Basic characteristics of clinical feature: 'AGE'
| AGE | Mean (SD) | 63.5 (11) |
| Significant markers | N = 100 | |
| pos. correlated | 32 | |
| neg. correlated | 68 |
Table S4. Get Full Table List of top 10 genes significantly correlated to 'AGE' by Spearman correlation test
| SpearmanCorr | corrP | Q | |
|---|---|---|---|
| SLFN14 | 0.4229 | 5.889e-11 | 1.04e-06 |
| ACAA2 | -0.4176 | 1.077e-10 | 1.89e-06 |
| SCARNA17 | -0.4176 | 1.077e-10 | 1.89e-06 |
| PLA2G15 | -0.4043 | 4.663e-10 | 8.2e-06 |
| ALS2CL | -0.3994 | 7.845e-10 | 1.38e-05 |
| LOC100271836 | -0.3872 | 2.792e-09 | 4.91e-05 |
| ADAMTS15 | -0.3843 | 3.731e-09 | 6.56e-05 |
| GPR160 | -0.3793 | 6.134e-09 | 0.000108 |
| CYP1A2 | 0.375 | 9.43e-09 | 0.000166 |
| EPS8L2 | -0.3738 | 1.052e-08 | 0.000185 |
Figure S2. Get High-res Image As an example, this figure shows the association of SLFN14 to 'AGE'. P value = 5.89e-11 with Spearman correlation analysis. The straight line presents the best linear regression.
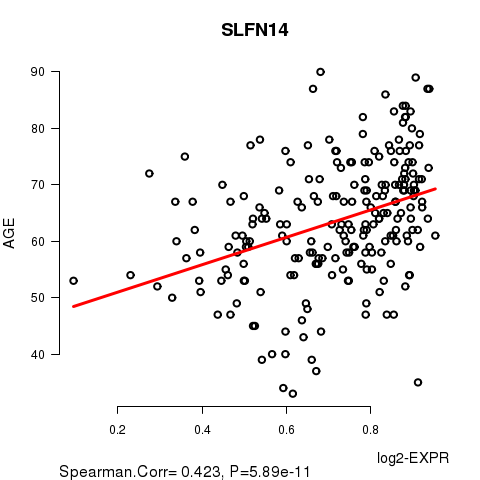
Table S5. Basic characteristics of clinical feature: 'HISTOLOGICAL.TYPE'
| HISTOLOGICAL.TYPE | Labels | N |
| ENDOMETRIOID ENDOMETRIAL ADENOCARCINOMA | 168 | |
| ENDOMETRIOID ENDOMETRIAL ADENOCARCINOMA (GRADE 1) | 4 | |
| ENDOMETRIOID ENDOMETRIAL ADENOCARCINOMA (GRADE 2) | 1 | |
| ENDOMETRIOID ENDOMETRIAL ADENOCARCINOMA (GRADE 3) | 3 | |
| MIXED SEROUS AND ENDOMETRIOID | 9 | |
| SEROUS ENDOMETRIAL ADENOCARCINOMA | 35 | |
| Significant markers | N = 1350 |
Table S6. Get Full Table List of top 10 genes differentially expressed by 'HISTOLOGICAL.TYPE'
| ANOVA_P | Q | |
|---|---|---|
| ARL13B | 2.554e-133 | 4.49e-129 |
| UBE2T | 2.135e-90 | 3.75e-86 |
| CARD11 | 1.218e-32 | 2.14e-28 |
| CRYAB | 6.58e-29 | 1.16e-24 |
| NCRNA00203 | 3.494e-27 | 6.14e-23 |
| ABCB6 | 4.201e-27 | 7.38e-23 |
| APBB1IP | 5.983e-27 | 1.05e-22 |
| KCNIP2 | 7.495e-26 | 1.32e-21 |
| SSTR1 | 1.241e-25 | 2.18e-21 |
| ADAMTS8 | 2.015e-25 | 3.54e-21 |
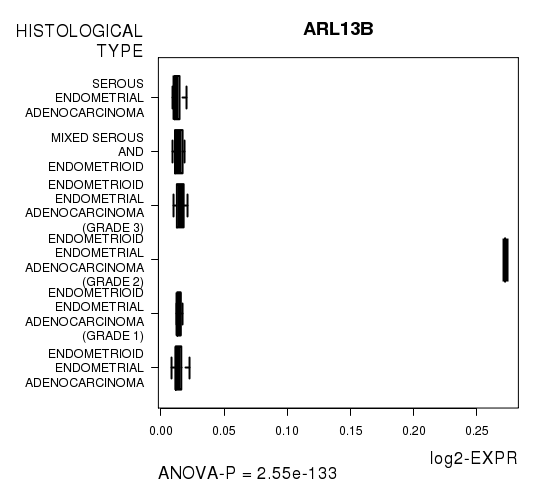
Figure S3. Get High-res Image As an example, this figure shows the association of ARL13B to 'HISTOLOGICAL.TYPE'. P value = 2.55e-133 with ANOVA analysis.
No gene related to 'RADIATIONS.RADIATION.REGIMENINDICATION'.
Table S7. Basic characteristics of clinical feature: 'RADIATIONS.RADIATION.REGIMENINDICATION'
| RADIATIONS.RADIATION.REGIMENINDICATION | Labels | N |
| NO | 62 | |
| YES | 158 | |
| Significant markers | N = 0 |
Table S8. Basic characteristics of clinical feature: 'NEOADJUVANT.THERAPY'
| NEOADJUVANT.THERAPY | Labels | N |
| NO | 60 | |
| YES | 160 | |
| Significant markers | N = 4 | |
| Higher in YES | 4 | |
| Higher in NO | 0 |
Table S9. Get Full Table List of 4 genes differentially expressed by 'NEOADJUVANT.THERAPY'
| T(pos if higher in 'YES') | ttestP | Q | AUC | |
|---|---|---|---|---|
| DNAH3 | 5.11 | 9.407e-07 | 0.0165 | 0.6881 |
| C1GALT1 | 5 | 1.316e-06 | 0.0231 | 0.6549 |
| RG9MTD3 | 5 | 1.481e-06 | 0.026 | 0.6759 |
| LOC647979 | 4.93 | 1.898e-06 | 0.0334 | 0.6685 |
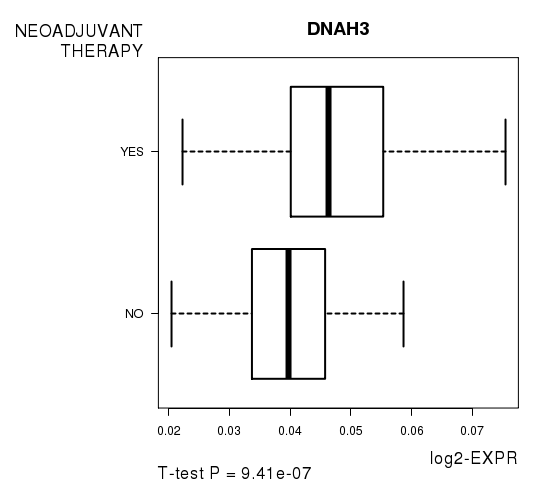
Figure S4. Get High-res Image As an example, this figure shows the association of DNAH3 to 'NEOADJUVANT.THERAPY'. P value = 9.41e-07 with T-test analysis.
-
Expresson data file = UCEC.meth.for_correlation.filtered_data.txt
-
Clinical data file = UCEC.clin.merged.picked.txt
-
Number of patients = 220
-
Number of genes = 17584
-
Number of clinical features = 5
For survival clinical features, Wald's test in univariate Cox regression analysis with proportional hazards model (Andersen and Gill 1982) was used to estimate the P values using the 'coxph' function in R. Kaplan-Meier survival curves were plot using the four quartile subgroups of patients based on expression levels
For continuous numerical clinical features, Spearman's rank correlation coefficients (Spearman 1904) and two-tailed P values were estimated using 'cor.test' function in R
For multi-class clinical features (ordinal or nominal), one-way analysis of variance (Howell 2002) was applied to compare the log2-expression levels between different clinical classes using 'anova' function in R
For two-class clinical features, two-tailed Student's t test with unequal variance (Lehmann and Romano 2005) was applied to compare the log2-expression levels between the two clinical classes using 't.test' function in R
For multiple hypothesis correction, Q value is the False Discovery Rate (FDR) analogue of the P value (Benjamini and Hochberg 1995), defined as the minimum FDR at which the test may be called significant. We used the 'Benjamini and Hochberg' method of 'p.adjust' function in R to convert P values into Q values.
This is an experimental feature. The full results of the analysis summarized in this report can be downloaded from the TCGA Data Coordination Center.