This pipeline computes the correlation between cancer subtypes identified by different molecular patterns and selected clinical features.
Testing the association between subtypes identified by 10 different clustering approaches and 5 clinical features across 451 patients, 32 significant findings detected with P value < 0.05.
-
CNMF clustering analysis on array-based mRNA expression data identified 4 subtypes that correlate to 'AGE', 'HISTOLOGICAL.TYPE', 'RADIATIONS.RADIATION.REGIMENINDICATION', and 'NEOADJUVANT.THERAPY'.
-
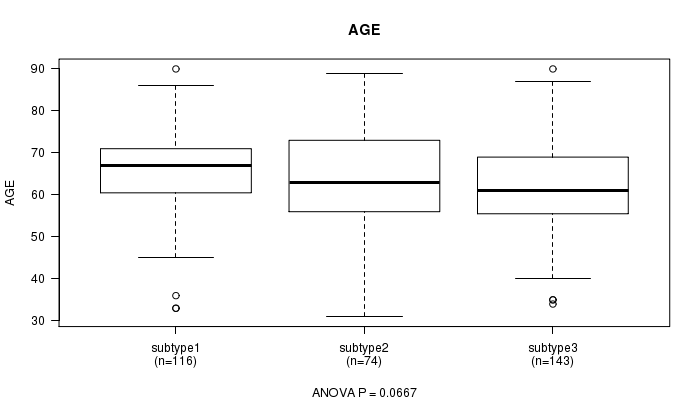
Consensus hierarchical clustering analysis on array-based mRNA expression data identified 3 subtypes that correlate to 'HISTOLOGICAL.TYPE' and 'NEOADJUVANT.THERAPY'.
-
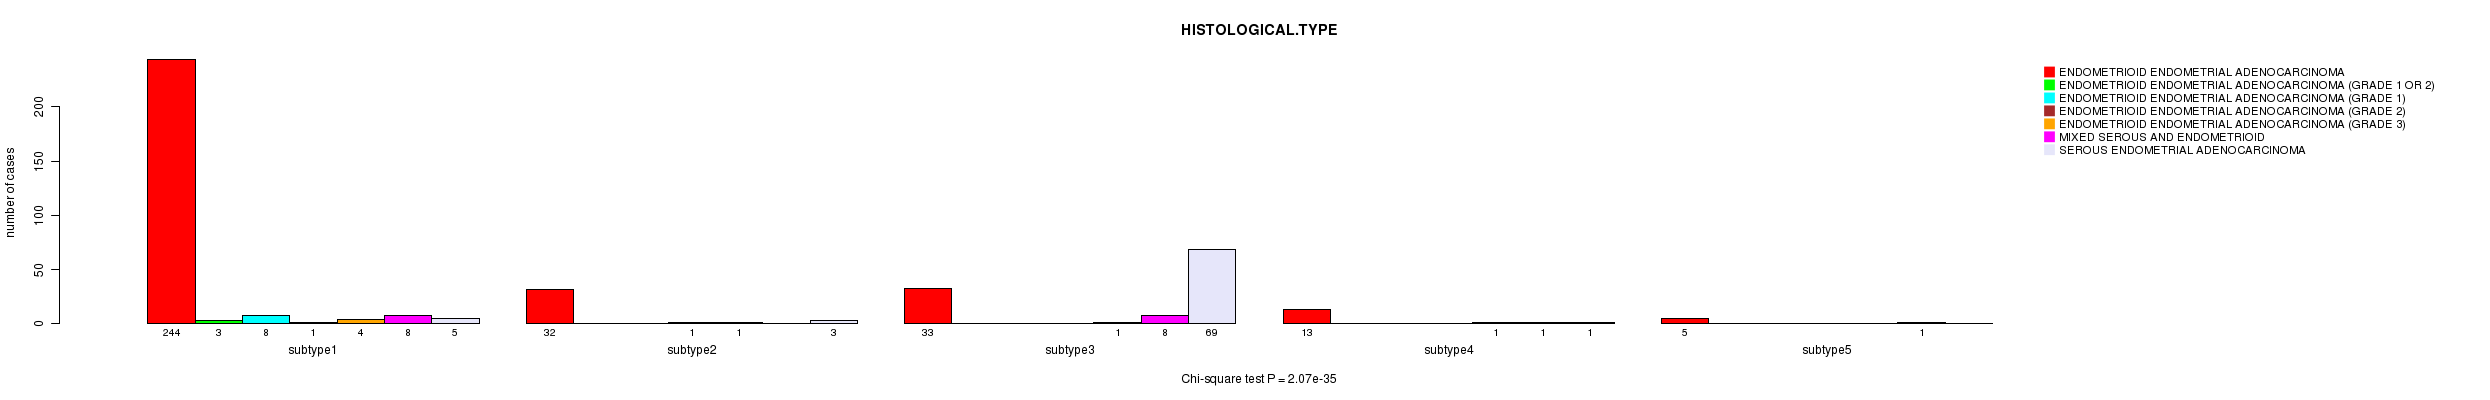
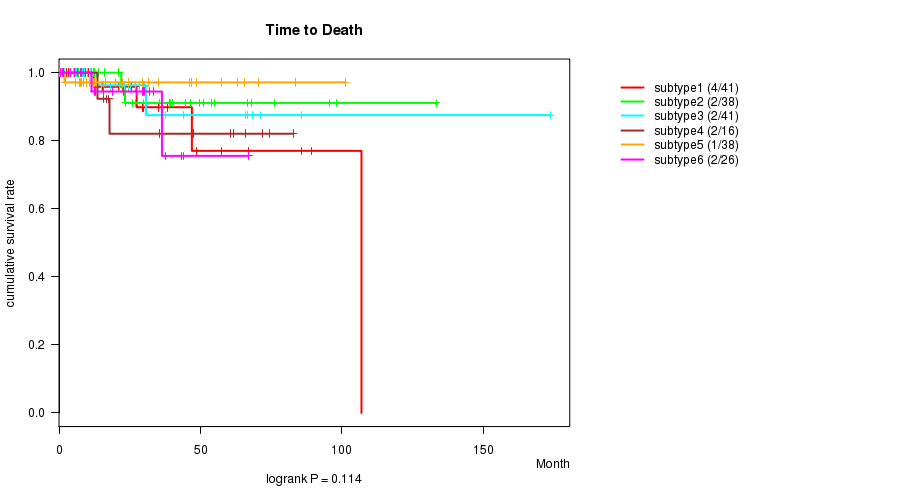
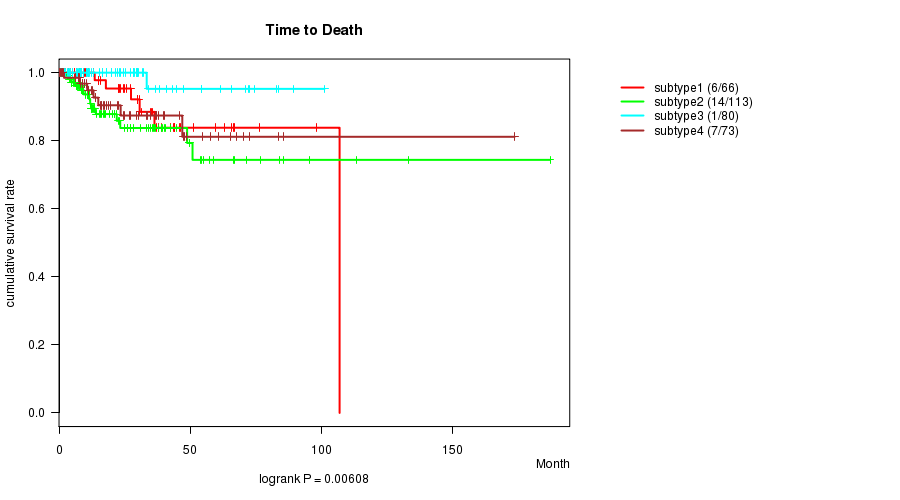
5 subtypes identified in current cancer cohort by 'CN CNMF'. These subtypes correlate to 'Time to Death', 'AGE', 'HISTOLOGICAL.TYPE', and 'NEOADJUVANT.THERAPY'.
-
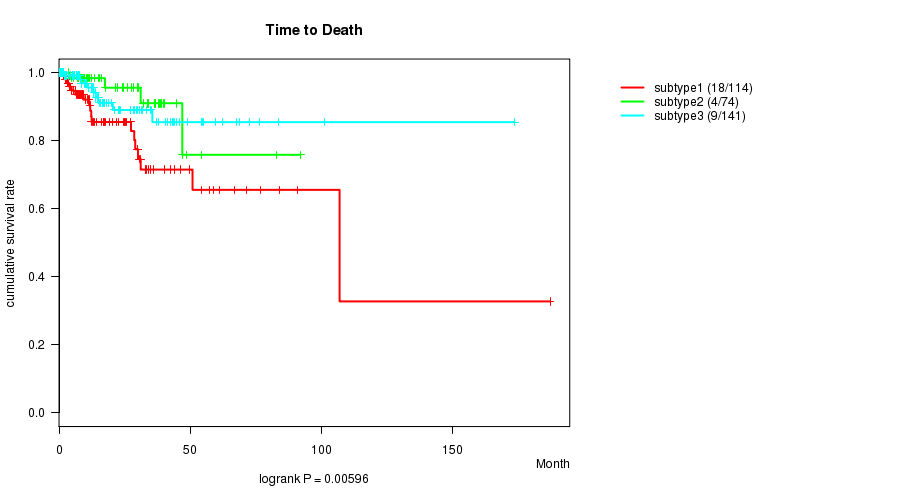
3 subtypes identified in current cancer cohort by 'METHLYATION CNMF'. These subtypes correlate to 'Time to Death', 'HISTOLOGICAL.TYPE', and 'NEOADJUVANT.THERAPY'.
-
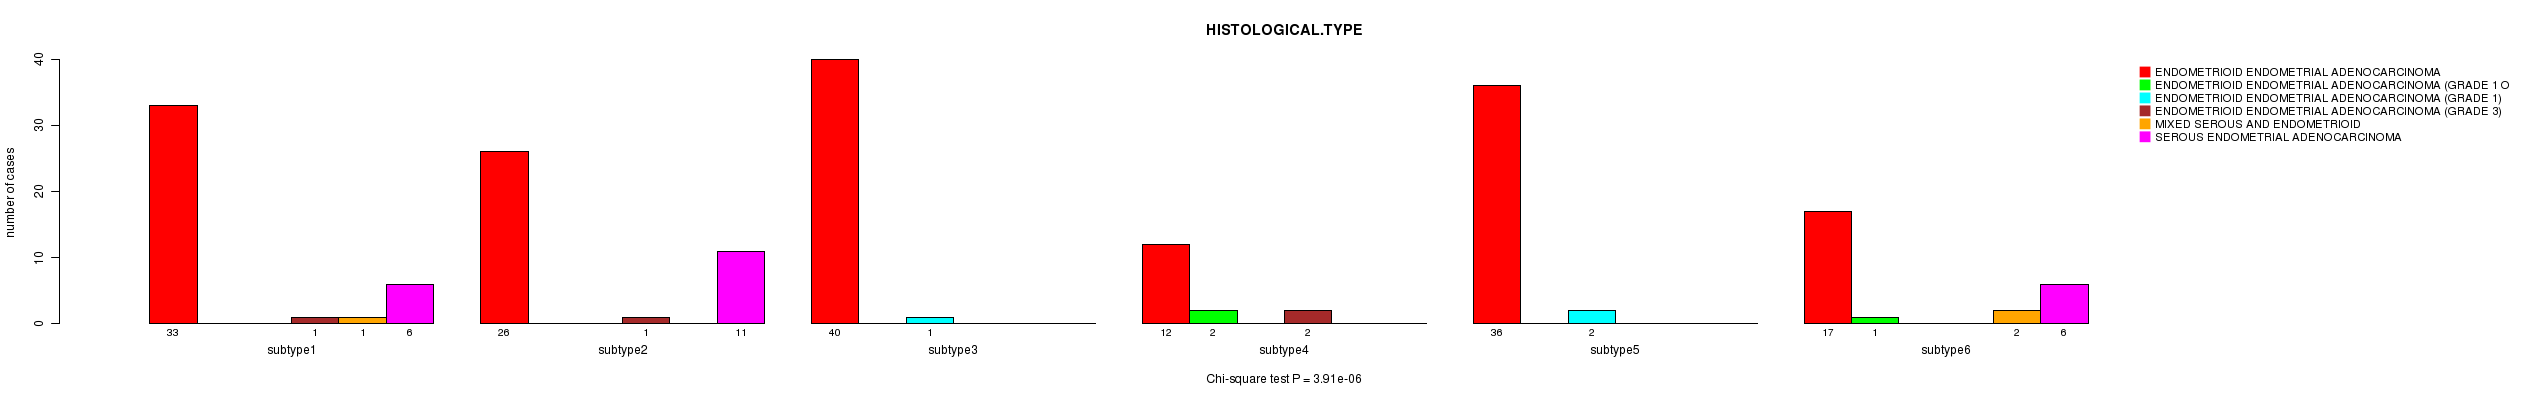
CNMF clustering analysis on RPPA data identified 6 subtypes that correlate to 'HISTOLOGICAL.TYPE'.
-
Consensus hierarchical clustering analysis on RPPA data identified 6 subtypes that correlate to 'HISTOLOGICAL.TYPE'.
-
CNMF clustering analysis on sequencing-based mRNA expression data identified 4 subtypes that correlate to 'Time to Death', 'AGE', 'HISTOLOGICAL.TYPE', 'RADIATIONS.RADIATION.REGIMENINDICATION', and 'NEOADJUVANT.THERAPY'.
-
Consensus hierarchical clustering analysis on sequencing-based mRNA expression data identified 4 subtypes that correlate to 'Time to Death', 'AGE', 'HISTOLOGICAL.TYPE', 'RADIATIONS.RADIATION.REGIMENINDICATION', and 'NEOADJUVANT.THERAPY'.
-
CNMF clustering analysis on sequencing-based miR expression data identified 3 subtypes that correlate to 'Time to Death', 'AGE', and 'HISTOLOGICAL.TYPE'.
-
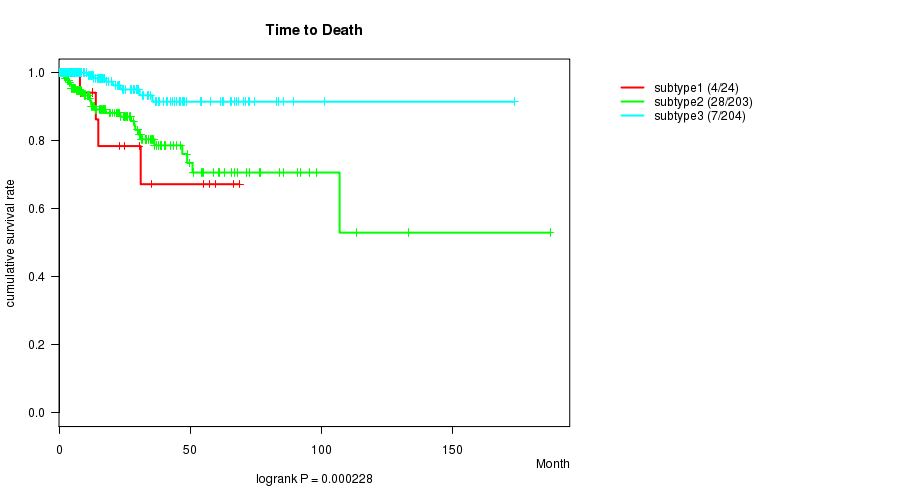
Consensus hierarchical clustering analysis on sequencing-based miR expression data identified 3 subtypes that correlate to 'Time to Death', 'AGE', 'HISTOLOGICAL.TYPE', and 'NEOADJUVANT.THERAPY'.
Table 1. Get Full Table Overview of the association between subtypes identified by 10 different clustering approaches and 5 clinical features. Shown in the table are P values from statistical tests. Thresholded by P value < 0.05, 32 significant findings detected.
|
Clinical Features |
Time to Death |
AGE |
HISTOLOGICAL TYPE |
RADIATIONS RADIATION REGIMENINDICATION |
NEOADJUVANT THERAPY |
| Statistical Tests | logrank test | ANOVA | Chi-square test | Fisher's exact test | Fisher's exact test |
| mRNA CNMF subtypes | 0.53 | 0.0107 | 0.000456 | 0.0317 | 0.0124 |
| mRNA cHierClus subtypes | 0.73 | 0.0598 | 0.00134 | 0.0666 | 0.0114 |
| CN CNMF | 0.000144 | 5.7e-10 | 2.07e-35 | 0.0983 | 0.045 |
| METHLYATION CNMF | 0.00596 | 0.0667 | 2.14e-17 | 0.172 | 0.00338 |
| RPPA CNMF subtypes | 0.114 | 0.343 | 3.91e-06 | 0.327 | 0.0533 |
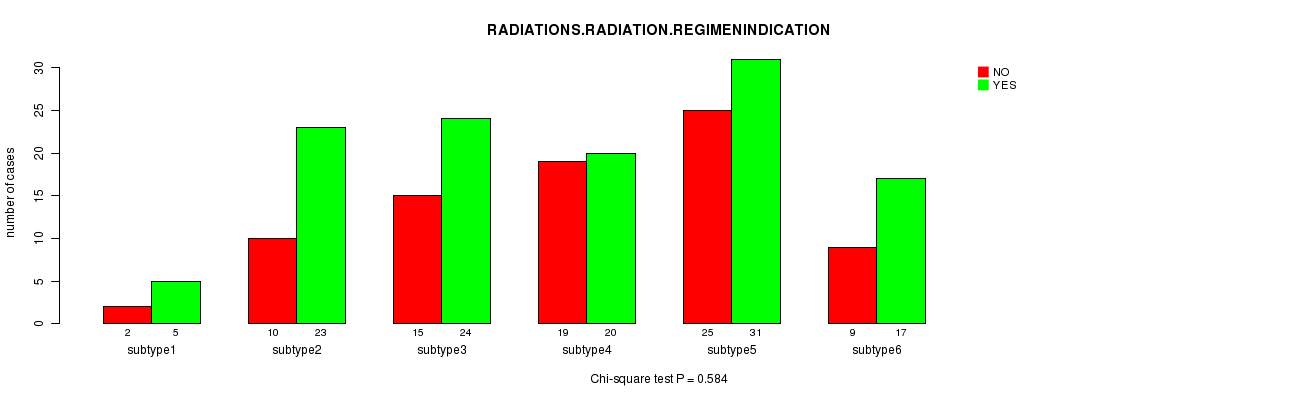
| RPPA cHierClus subtypes | 0.294 | 0.463 | 0.00421 | 0.584 | 0.157 |
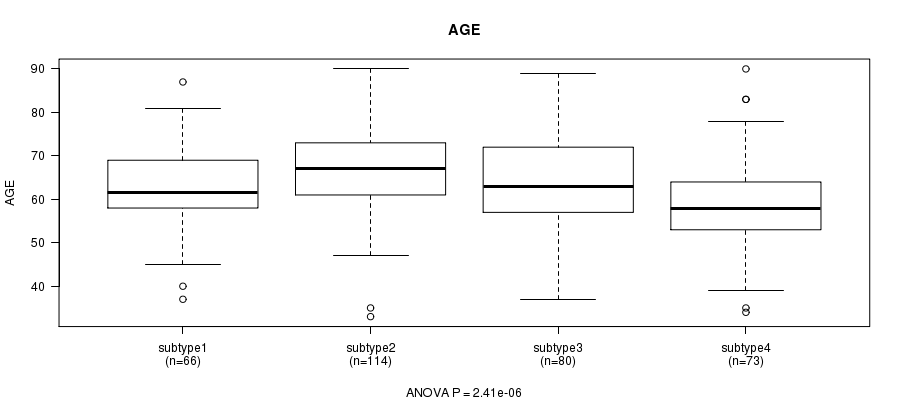
| RNAseq CNMF subtypes | 0.00608 | 2.41e-06 | 2.07e-19 | 0.00811 | 0.0126 |
| RNAseq cHierClus subtypes | 0.00127 | 1.17e-07 | 3.57e-18 | 0.00224 | 0.00482 |
| MIRseq CNMF subtypes | 0.000101 | 1.13e-06 | 5.84e-26 | 0.406 | 0.0772 |
| MIRseq cHierClus subtypes | 0.000228 | 0.00244 | 2.28e-18 | 0.207 | 0.00114 |
Table S1. Get Full Table Description of clustering approach #1: 'mRNA CNMF subtypes'
| Cluster Labels | 1 | 2 | 3 | 4 |
|---|---|---|---|---|
| Number of samples | 13 | 19 | 14 | 8 |
P value = 0.53 (logrank test)
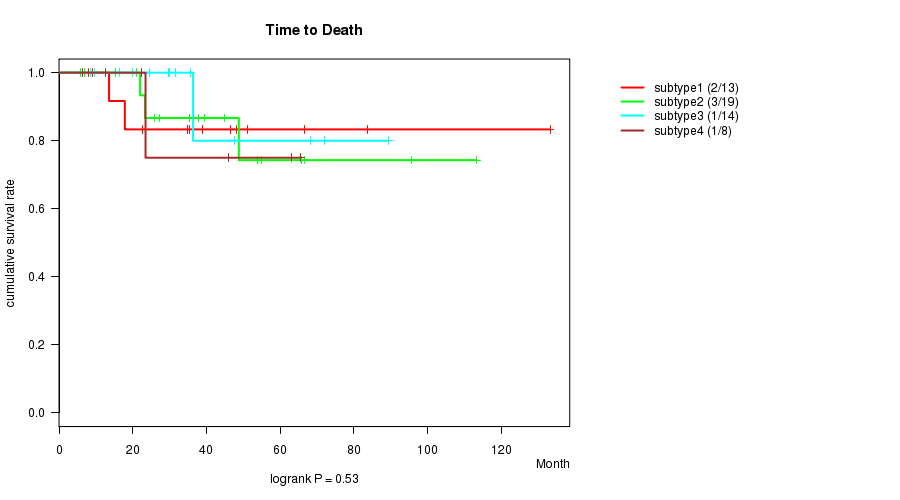
Table S2. Clustering Approach #1: 'mRNA CNMF subtypes' versus Clinical Feature #1: 'Time to Death'
| nPatients | nDeath | Duration Range (Median), Month | |
|---|---|---|---|
| ALL | 54 | 7 | 6.0 - 133.2 (35.4) |
| subtype1 | 13 | 2 | 9.0 - 133.2 (39.0) |
| subtype2 | 19 | 3 | 6.0 - 113.2 (37.7) |
| subtype3 | 14 | 1 | 8.6 - 89.3 (30.9) |
| subtype4 | 8 | 1 | 6.4 - 65.5 (22.9) |
Figure S1. Get High-res Image Clustering Approach #1: 'mRNA CNMF subtypes' versus Clinical Feature #1: 'Time to Death'
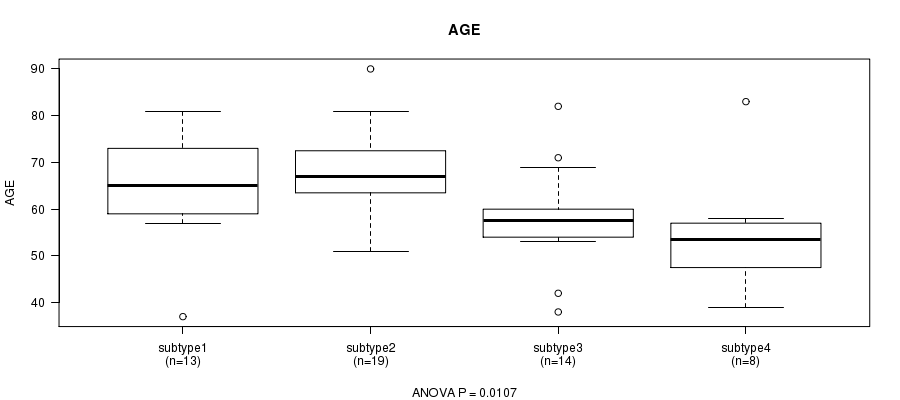
P value = 0.0107 (ANOVA)
Table S3. Clustering Approach #1: 'mRNA CNMF subtypes' versus Clinical Feature #2: 'AGE'
| nPatients | Mean (Std.Dev) | |
|---|---|---|
| ALL | 54 | 62.9 (11.8) |
| subtype1 | 13 | 65.1 (12.0) |
| subtype2 | 19 | 68.4 (9.1) |
| subtype3 | 14 | 58.2 (11.0) |
| subtype4 | 8 | 54.8 (12.9) |
Figure S2. Get High-res Image Clustering Approach #1: 'mRNA CNMF subtypes' versus Clinical Feature #2: 'AGE'
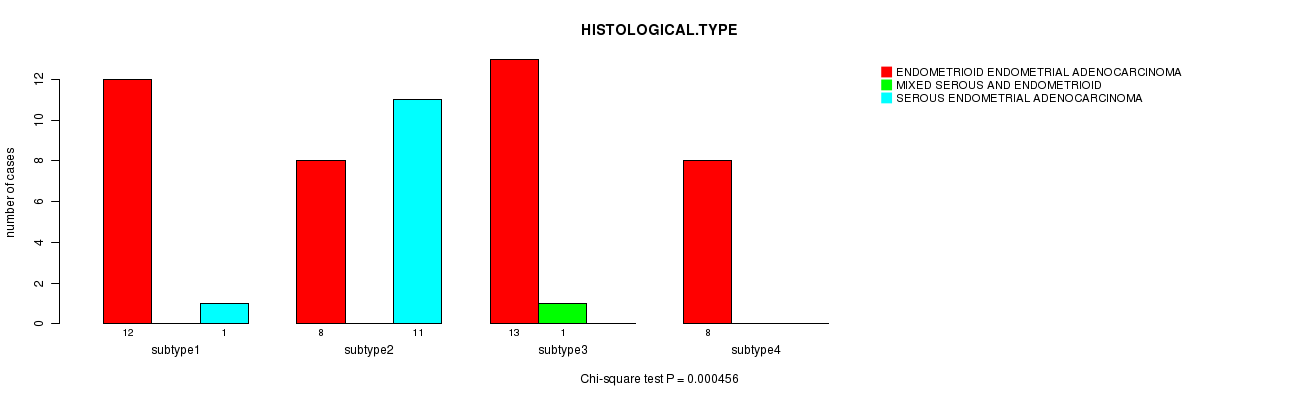
P value = 0.000456 (Chi-square test)
Table S4. Clustering Approach #1: 'mRNA CNMF subtypes' versus Clinical Feature #3: 'HISTOLOGICAL.TYPE'
| nPatients | ENDOMETRIOID ENDOMETRIAL ADENOCARCINOMA | MIXED SEROUS AND ENDOMETRIOID | SEROUS ENDOMETRIAL ADENOCARCINOMA |
|---|---|---|---|
| ALL | 41 | 1 | 12 |
| subtype1 | 12 | 0 | 1 |
| subtype2 | 8 | 0 | 11 |
| subtype3 | 13 | 1 | 0 |
| subtype4 | 8 | 0 | 0 |
Figure S3. Get High-res Image Clustering Approach #1: 'mRNA CNMF subtypes' versus Clinical Feature #3: 'HISTOLOGICAL.TYPE'
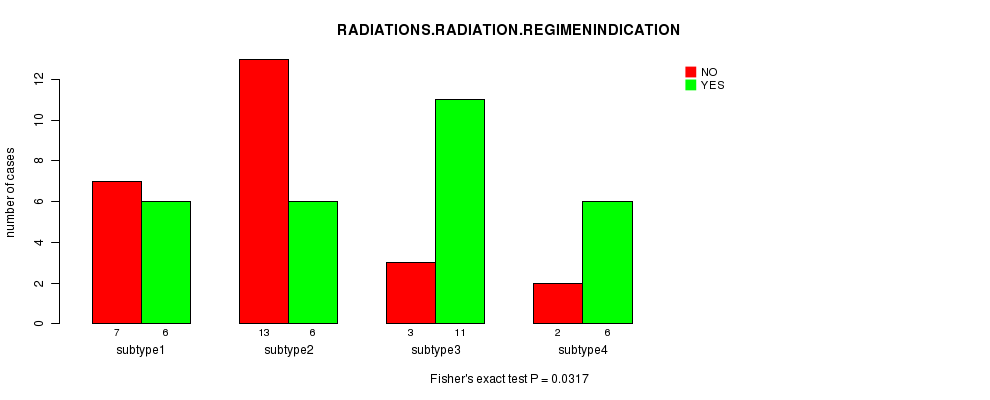
P value = 0.0317 (Fisher's exact test)
Table S5. Clustering Approach #1: 'mRNA CNMF subtypes' versus Clinical Feature #4: 'RADIATIONS.RADIATION.REGIMENINDICATION'
| nPatients | NO | YES |
|---|---|---|
| ALL | 25 | 29 |
| subtype1 | 7 | 6 |
| subtype2 | 13 | 6 |
| subtype3 | 3 | 11 |
| subtype4 | 2 | 6 |
Figure S4. Get High-res Image Clustering Approach #1: 'mRNA CNMF subtypes' versus Clinical Feature #4: 'RADIATIONS.RADIATION.REGIMENINDICATION'
P value = 0.0124 (Fisher's exact test)
Table S6. Clustering Approach #1: 'mRNA CNMF subtypes' versus Clinical Feature #5: 'NEOADJUVANT.THERAPY'
| nPatients | NO | YES |
|---|---|---|
| ALL | 18 | 36 |
| subtype1 | 6 | 7 |
| subtype2 | 10 | 9 |
| subtype3 | 2 | 12 |
| subtype4 | 0 | 8 |
Figure S5. Get High-res Image Clustering Approach #1: 'mRNA CNMF subtypes' versus Clinical Feature #5: 'NEOADJUVANT.THERAPY'
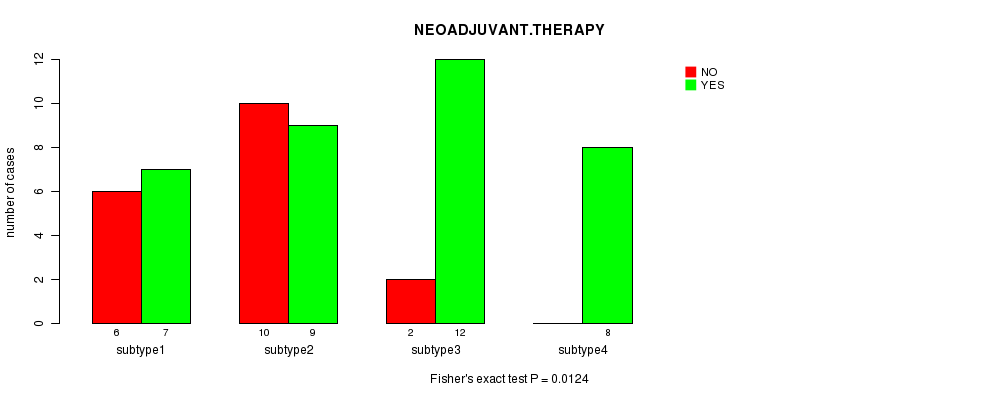
Table S7. Get Full Table Description of clustering approach #2: 'mRNA cHierClus subtypes'
| Cluster Labels | 1 | 2 | 3 |
|---|---|---|---|
| Number of samples | 20 | 15 | 19 |
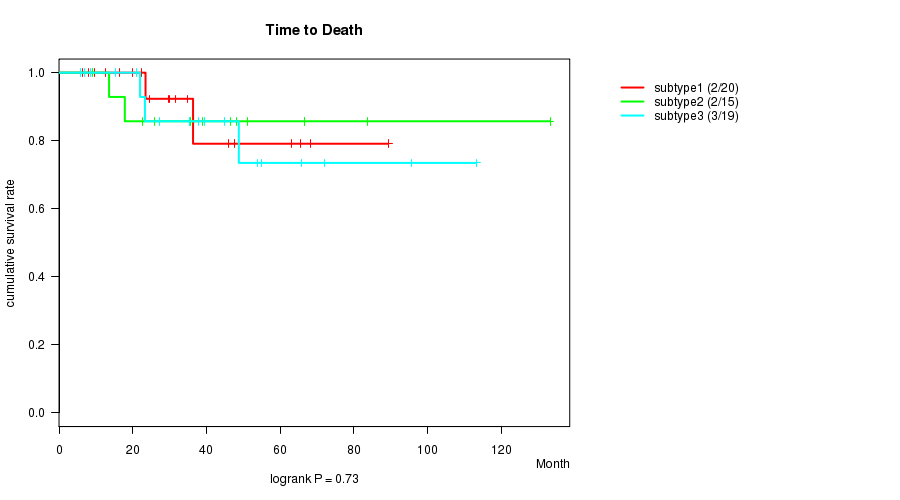
P value = 0.73 (logrank test)
Table S8. Clustering Approach #2: 'mRNA cHierClus subtypes' versus Clinical Feature #1: 'Time to Death'
| nPatients | nDeath | Duration Range (Median), Month | |
|---|---|---|---|
| ALL | 54 | 7 | 6.0 - 133.2 (35.4) |
| subtype1 | 20 | 2 | 6.4 - 89.3 (29.8) |
| subtype2 | 15 | 2 | 9.0 - 133.2 (39.0) |
| subtype3 | 19 | 3 | 6.0 - 113.2 (37.7) |
Figure S6. Get High-res Image Clustering Approach #2: 'mRNA cHierClus subtypes' versus Clinical Feature #1: 'Time to Death'
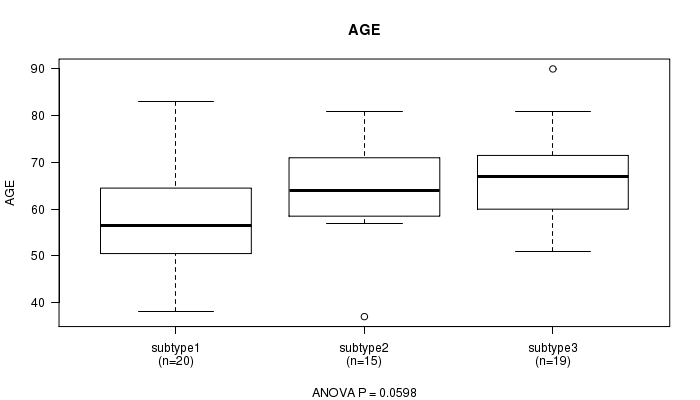
P value = 0.0598 (ANOVA)
Table S9. Clustering Approach #2: 'mRNA cHierClus subtypes' versus Clinical Feature #2: 'AGE'
| nPatients | Mean (Std.Dev) | |
|---|---|---|
| ALL | 54 | 62.9 (11.8) |
| subtype1 | 20 | 58.2 (13.3) |
| subtype2 | 15 | 64.0 (10.6) |
| subtype3 | 19 | 67.1 (9.9) |
Figure S7. Get High-res Image Clustering Approach #2: 'mRNA cHierClus subtypes' versus Clinical Feature #2: 'AGE'
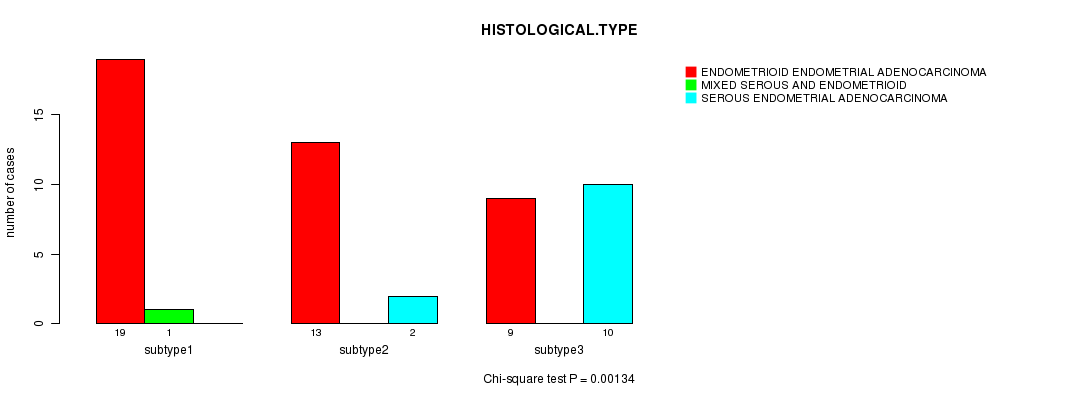
P value = 0.00134 (Chi-square test)
Table S10. Clustering Approach #2: 'mRNA cHierClus subtypes' versus Clinical Feature #3: 'HISTOLOGICAL.TYPE'
| nPatients | ENDOMETRIOID ENDOMETRIAL ADENOCARCINOMA | MIXED SEROUS AND ENDOMETRIOID | SEROUS ENDOMETRIAL ADENOCARCINOMA |
|---|---|---|---|
| ALL | 41 | 1 | 12 |
| subtype1 | 19 | 1 | 0 |
| subtype2 | 13 | 0 | 2 |
| subtype3 | 9 | 0 | 10 |
Figure S8. Get High-res Image Clustering Approach #2: 'mRNA cHierClus subtypes' versus Clinical Feature #3: 'HISTOLOGICAL.TYPE'
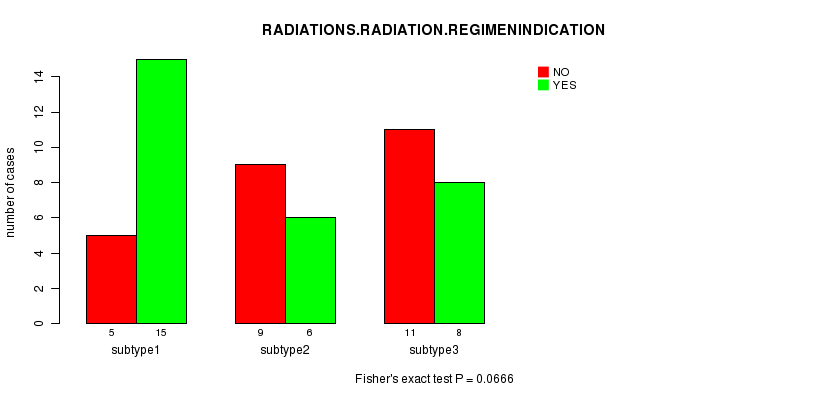
P value = 0.0666 (Fisher's exact test)
Table S11. Clustering Approach #2: 'mRNA cHierClus subtypes' versus Clinical Feature #4: 'RADIATIONS.RADIATION.REGIMENINDICATION'
| nPatients | NO | YES |
|---|---|---|
| ALL | 25 | 29 |
| subtype1 | 5 | 15 |
| subtype2 | 9 | 6 |
| subtype3 | 11 | 8 |
Figure S9. Get High-res Image Clustering Approach #2: 'mRNA cHierClus subtypes' versus Clinical Feature #4: 'RADIATIONS.RADIATION.REGIMENINDICATION'
P value = 0.0114 (Fisher's exact test)
Table S12. Clustering Approach #2: 'mRNA cHierClus subtypes' versus Clinical Feature #5: 'NEOADJUVANT.THERAPY'
| nPatients | NO | YES |
|---|---|---|
| ALL | 18 | 36 |
| subtype1 | 2 | 18 |
| subtype2 | 6 | 9 |
| subtype3 | 10 | 9 |
Figure S10. Get High-res Image Clustering Approach #2: 'mRNA cHierClus subtypes' versus Clinical Feature #5: 'NEOADJUVANT.THERAPY'
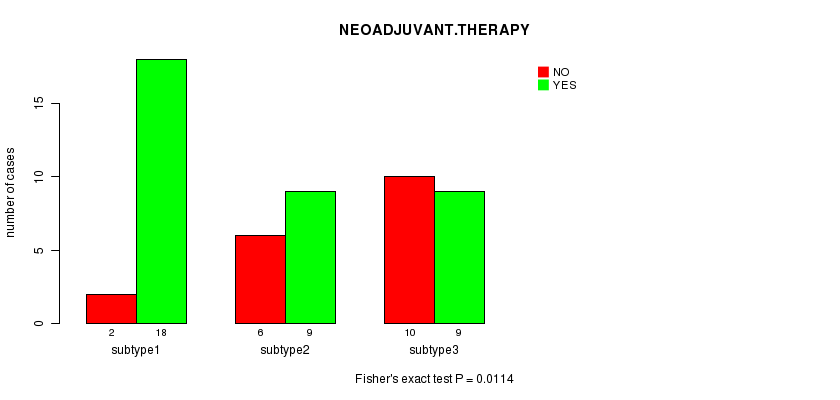
Table S13. Get Full Table Description of clustering approach #3: 'CN CNMF'
| Cluster Labels | 1 | 2 | 3 | 4 | 5 |
|---|---|---|---|---|---|
| Number of samples | 273 | 37 | 111 | 16 | 6 |
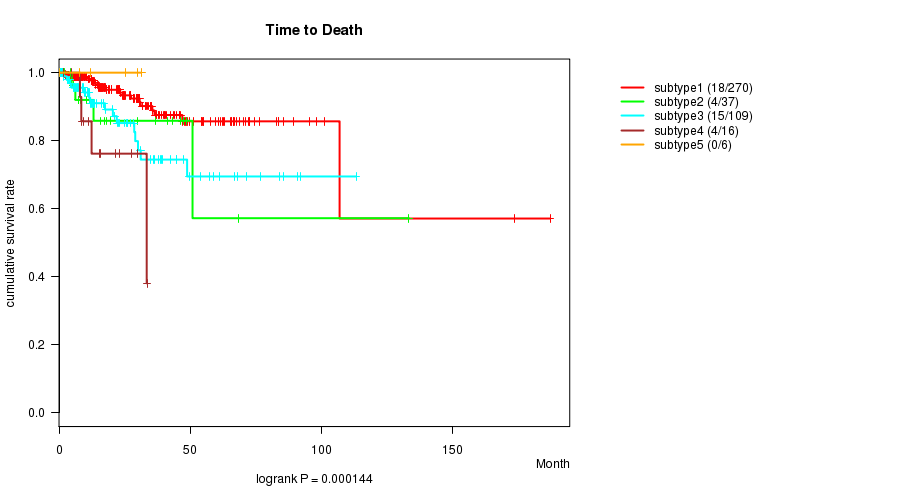
P value = 0.000144 (logrank test)
Table S14. Clustering Approach #3: 'CN CNMF' versus Clinical Feature #1: 'Time to Death'
| nPatients | nDeath | Duration Range (Median), Month | |
|---|---|---|---|
| ALL | 438 | 41 | 0.0 - 187.1 (15.8) |
| subtype1 | 270 | 18 | 0.0 - 187.1 (17.3) |
| subtype2 | 37 | 4 | 0.2 - 133.2 (8.0) |
| subtype3 | 109 | 15 | 0.0 - 113.2 (13.1) |
| subtype4 | 16 | 4 | 1.7 - 33.5 (13.9) |
| subtype5 | 6 | 0 | 0.3 - 31.3 (18.6) |
Figure S11. Get High-res Image Clustering Approach #3: 'CN CNMF' versus Clinical Feature #1: 'Time to Death'
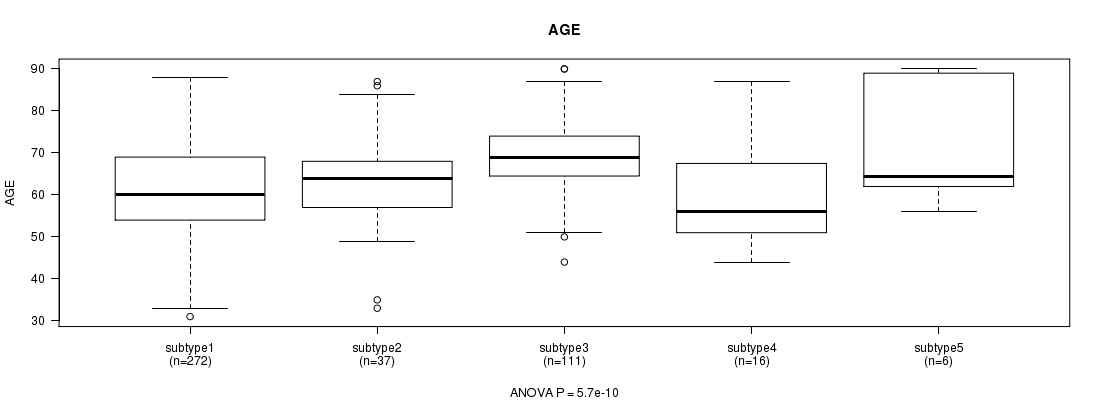
P value = 5.7e-10 (ANOVA)
Table S15. Clustering Approach #3: 'CN CNMF' versus Clinical Feature #2: 'AGE'
| nPatients | Mean (Std.Dev) | |
|---|---|---|
| ALL | 442 | 63.5 (11.2) |
| subtype1 | 272 | 61.2 (11.2) |
| subtype2 | 37 | 63.2 (11.9) |
| subtype3 | 111 | 69.5 (8.2) |
| subtype4 | 16 | 60.2 (12.9) |
| subtype5 | 6 | 71.0 (14.7) |
Figure S12. Get High-res Image Clustering Approach #3: 'CN CNMF' versus Clinical Feature #2: 'AGE'
P value = 2.07e-35 (Chi-square test)
Table S16. Clustering Approach #3: 'CN CNMF' versus Clinical Feature #3: 'HISTOLOGICAL.TYPE'
| nPatients | ENDOMETRIOID ENDOMETRIAL ADENOCARCINOMA | ENDOMETRIOID ENDOMETRIAL ADENOCARCINOMA (GRADE 1 OR 2) | ENDOMETRIOID ENDOMETRIAL ADENOCARCINOMA (GRADE 1) | ENDOMETRIOID ENDOMETRIAL ADENOCARCINOMA (GRADE 2) | ENDOMETRIOID ENDOMETRIAL ADENOCARCINOMA (GRADE 3) | MIXED SEROUS AND ENDOMETRIOID | SEROUS ENDOMETRIAL ADENOCARCINOMA |
|---|---|---|---|---|---|---|---|
| ALL | 327 | 3 | 8 | 2 | 7 | 18 | 78 |
| subtype1 | 244 | 3 | 8 | 1 | 4 | 8 | 5 |
| subtype2 | 32 | 0 | 0 | 1 | 1 | 0 | 3 |
| subtype3 | 33 | 0 | 0 | 0 | 1 | 8 | 69 |
| subtype4 | 13 | 0 | 0 | 0 | 1 | 1 | 1 |
| subtype5 | 5 | 0 | 0 | 0 | 0 | 1 | 0 |
Figure S13. Get High-res Image Clustering Approach #3: 'CN CNMF' versus Clinical Feature #3: 'HISTOLOGICAL.TYPE'
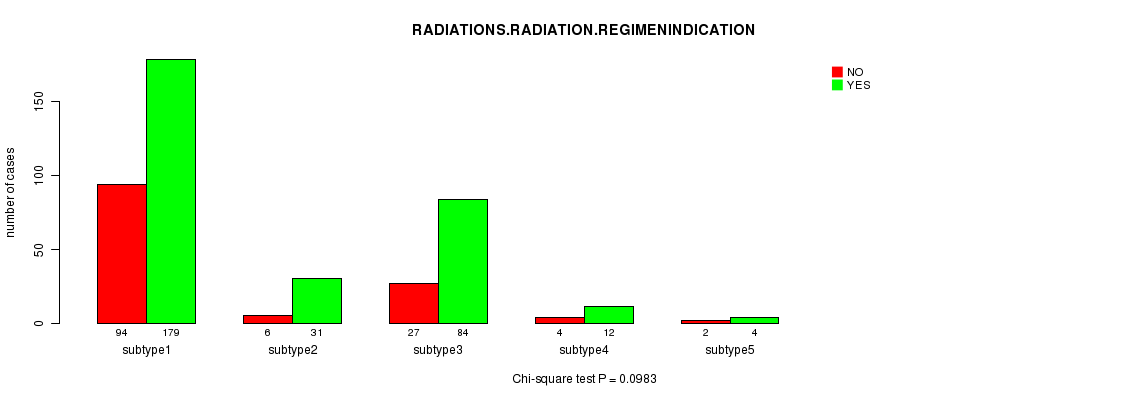
P value = 0.0983 (Chi-square test)
Table S17. Clustering Approach #3: 'CN CNMF' versus Clinical Feature #4: 'RADIATIONS.RADIATION.REGIMENINDICATION'
| nPatients | NO | YES |
|---|---|---|
| ALL | 133 | 310 |
| subtype1 | 94 | 179 |
| subtype2 | 6 | 31 |
| subtype3 | 27 | 84 |
| subtype4 | 4 | 12 |
| subtype5 | 2 | 4 |
Figure S14. Get High-res Image Clustering Approach #3: 'CN CNMF' versus Clinical Feature #4: 'RADIATIONS.RADIATION.REGIMENINDICATION'
P value = 0.045 (Chi-square test)
Table S18. Clustering Approach #3: 'CN CNMF' versus Clinical Feature #5: 'NEOADJUVANT.THERAPY'
| nPatients | NO | YES |
|---|---|---|
| ALL | 105 | 338 |
| subtype1 | 54 | 219 |
| subtype2 | 8 | 29 |
| subtype3 | 38 | 73 |
| subtype4 | 3 | 13 |
| subtype5 | 2 | 4 |
Figure S15. Get High-res Image Clustering Approach #3: 'CN CNMF' versus Clinical Feature #5: 'NEOADJUVANT.THERAPY'
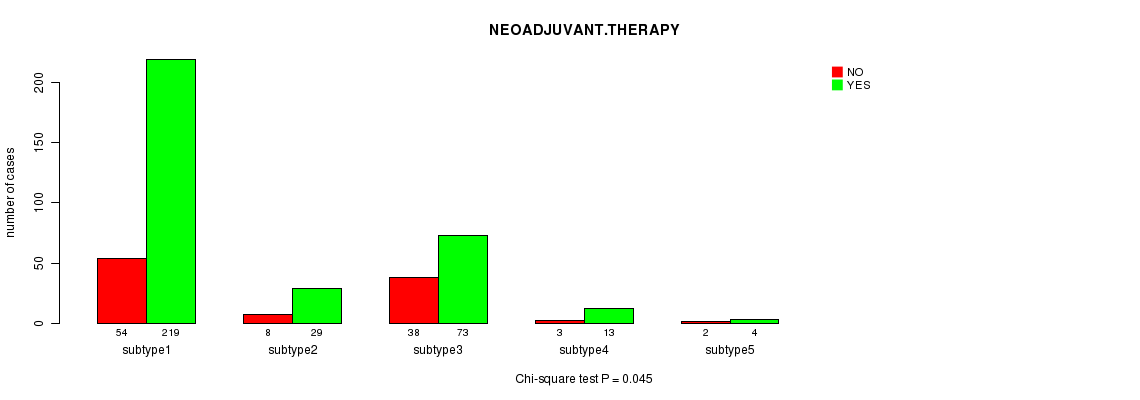
Table S19. Get Full Table Description of clustering approach #4: 'METHLYATION CNMF'
| Cluster Labels | 1 | 2 | 3 |
|---|---|---|---|
| Number of samples | 117 | 74 | 143 |
P value = 0.00596 (logrank test)
Table S20. Clustering Approach #4: 'METHLYATION CNMF' versus Clinical Feature #1: 'Time to Death'
| nPatients | nDeath | Duration Range (Median), Month | |
|---|---|---|---|
| ALL | 329 | 31 | 0.0 - 187.1 (12.3) |
| subtype1 | 114 | 18 | 0.0 - 187.1 (11.5) |
| subtype2 | 74 | 4 | 0.0 - 92.0 (15.2) |
| subtype3 | 141 | 9 | 0.1 - 173.6 (12.2) |
Figure S16. Get High-res Image Clustering Approach #4: 'METHLYATION CNMF' versus Clinical Feature #1: 'Time to Death'
P value = 0.0667 (ANOVA)
Table S21. Clustering Approach #4: 'METHLYATION CNMF' versus Clinical Feature #2: 'AGE'
| nPatients | Mean (Std.Dev) | |
|---|---|---|
| ALL | 333 | 63.6 (11.3) |
| subtype1 | 116 | 65.6 (10.5) |
| subtype2 | 74 | 63.1 (13.1) |
| subtype3 | 143 | 62.3 (10.8) |
Figure S17. Get High-res Image Clustering Approach #4: 'METHLYATION CNMF' versus Clinical Feature #2: 'AGE'
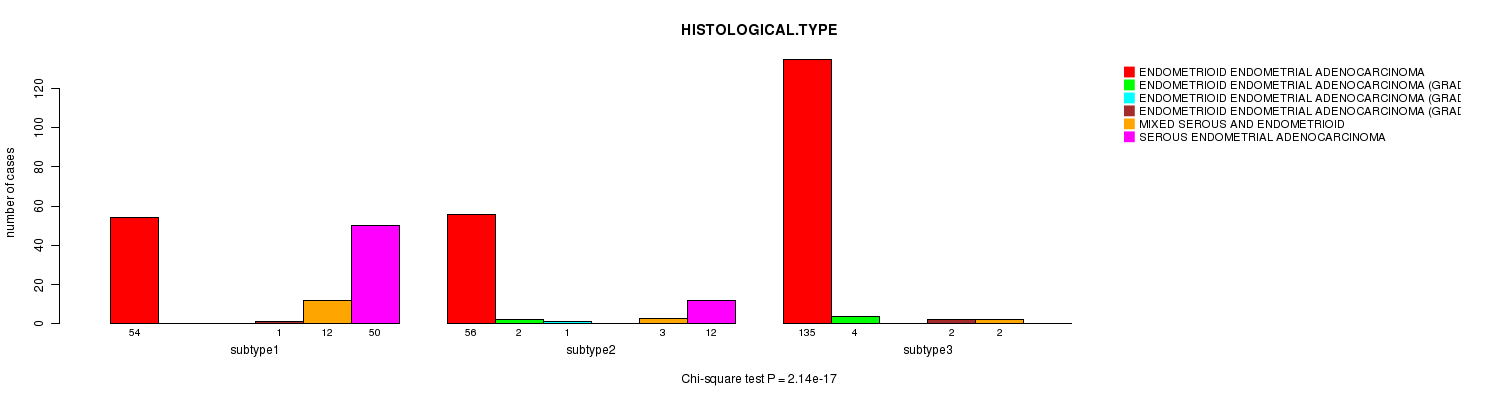
P value = 2.14e-17 (Chi-square test)
Table S22. Clustering Approach #4: 'METHLYATION CNMF' versus Clinical Feature #3: 'HISTOLOGICAL.TYPE'
| nPatients | ENDOMETRIOID ENDOMETRIAL ADENOCARCINOMA | ENDOMETRIOID ENDOMETRIAL ADENOCARCINOMA (GRADE 1) | ENDOMETRIOID ENDOMETRIAL ADENOCARCINOMA (GRADE 2) | ENDOMETRIOID ENDOMETRIAL ADENOCARCINOMA (GRADE 3) | MIXED SEROUS AND ENDOMETRIOID | SEROUS ENDOMETRIAL ADENOCARCINOMA |
|---|---|---|---|---|---|---|
| ALL | 245 | 6 | 1 | 3 | 17 | 62 |
| subtype1 | 54 | 0 | 0 | 1 | 12 | 50 |
| subtype2 | 56 | 2 | 1 | 0 | 3 | 12 |
| subtype3 | 135 | 4 | 0 | 2 | 2 | 0 |
Figure S18. Get High-res Image Clustering Approach #4: 'METHLYATION CNMF' versus Clinical Feature #3: 'HISTOLOGICAL.TYPE'
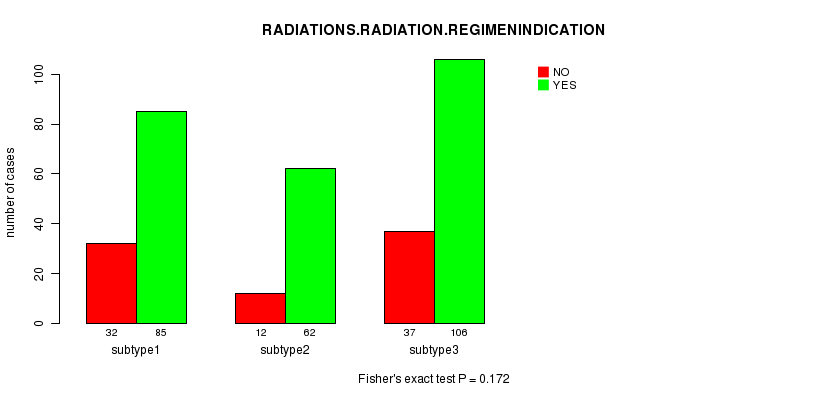
P value = 0.172 (Fisher's exact test)
Table S23. Clustering Approach #4: 'METHLYATION CNMF' versus Clinical Feature #4: 'RADIATIONS.RADIATION.REGIMENINDICATION'
| nPatients | NO | YES |
|---|---|---|
| ALL | 81 | 253 |
| subtype1 | 32 | 85 |
| subtype2 | 12 | 62 |
| subtype3 | 37 | 106 |
Figure S19. Get High-res Image Clustering Approach #4: 'METHLYATION CNMF' versus Clinical Feature #4: 'RADIATIONS.RADIATION.REGIMENINDICATION'
P value = 0.00338 (Fisher's exact test)
Table S24. Clustering Approach #4: 'METHLYATION CNMF' versus Clinical Feature #5: 'NEOADJUVANT.THERAPY'
| nPatients | NO | YES |
|---|---|---|
| ALL | 71 | 263 |
| subtype1 | 37 | 80 |
| subtype2 | 10 | 64 |
| subtype3 | 24 | 119 |
Figure S20. Get High-res Image Clustering Approach #4: 'METHLYATION CNMF' versus Clinical Feature #5: 'NEOADJUVANT.THERAPY'
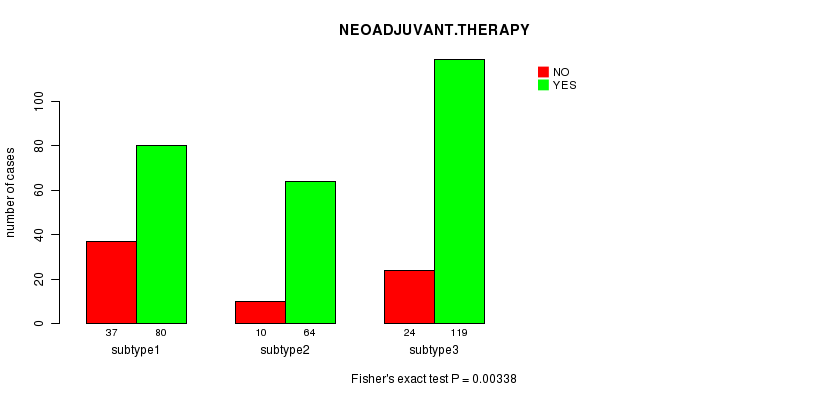
Table S25. Get Full Table Description of clustering approach #5: 'RPPA CNMF subtypes'
| Cluster Labels | 1 | 2 | 3 | 4 | 5 | 6 |
|---|---|---|---|---|---|---|
| Number of samples | 41 | 38 | 41 | 16 | 38 | 26 |
P value = 0.114 (logrank test)
Table S26. Clustering Approach #5: 'RPPA CNMF subtypes' versus Clinical Feature #1: 'Time to Death'
| nPatients | nDeath | Duration Range (Median), Month | |
|---|---|---|---|
| ALL | 200 | 13 | 0.0 - 173.6 (21.7) |
| subtype1 | 41 | 4 | 0.6 - 106.9 (21.0) |
| subtype2 | 38 | 2 | 1.3 - 133.2 (24.7) |
| subtype3 | 41 | 2 | 1.8 - 173.6 (22.6) |
| subtype4 | 16 | 2 | 1.4 - 82.7 (26.6) |
| subtype5 | 38 | 1 | 0.0 - 101.1 (12.4) |
| subtype6 | 26 | 2 | 0.7 - 66.9 (20.8) |
Figure S21. Get High-res Image Clustering Approach #5: 'RPPA CNMF subtypes' versus Clinical Feature #1: 'Time to Death'
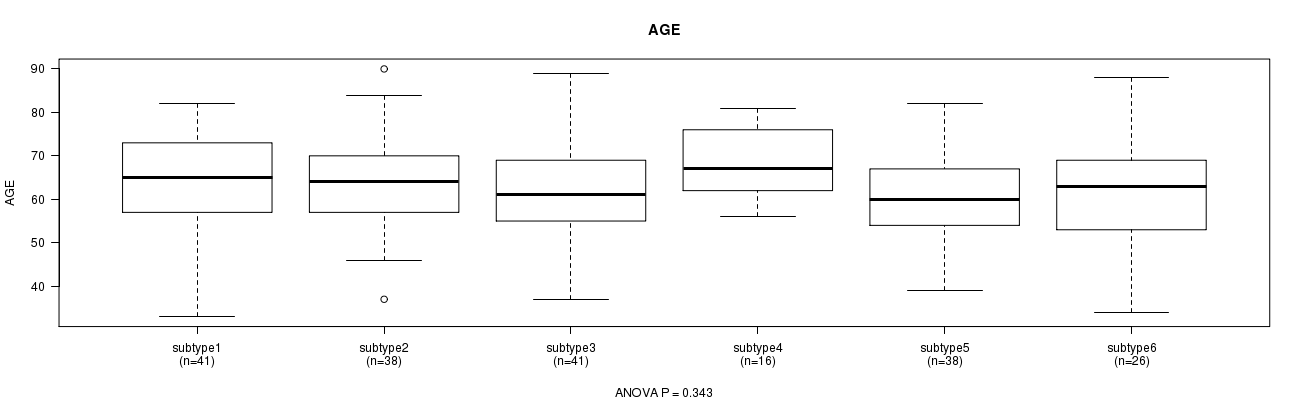
P value = 0.343 (ANOVA)
Table S27. Clustering Approach #5: 'RPPA CNMF subtypes' versus Clinical Feature #2: 'AGE'
| nPatients | Mean (Std.Dev) | |
|---|---|---|
| ALL | 200 | 62.7 (11.1) |
| subtype1 | 41 | 62.9 (12.2) |
| subtype2 | 38 | 63.4 (10.6) |
| subtype3 | 41 | 61.9 (10.8) |
| subtype4 | 16 | 68.1 (8.2) |
| subtype5 | 38 | 60.6 (9.6) |
| subtype6 | 26 | 62.6 (13.3) |
Figure S22. Get High-res Image Clustering Approach #5: 'RPPA CNMF subtypes' versus Clinical Feature #2: 'AGE'
P value = 3.91e-06 (Chi-square test)
Table S28. Clustering Approach #5: 'RPPA CNMF subtypes' versus Clinical Feature #3: 'HISTOLOGICAL.TYPE'
| nPatients | ENDOMETRIOID ENDOMETRIAL ADENOCARCINOMA | ENDOMETRIOID ENDOMETRIAL ADENOCARCINOMA (GRADE 1 OR 2) | ENDOMETRIOID ENDOMETRIAL ADENOCARCINOMA (GRADE 1) | ENDOMETRIOID ENDOMETRIAL ADENOCARCINOMA (GRADE 3) | MIXED SEROUS AND ENDOMETRIOID | SEROUS ENDOMETRIAL ADENOCARCINOMA |
|---|---|---|---|---|---|---|
| ALL | 164 | 3 | 3 | 4 | 3 | 23 |
| subtype1 | 33 | 0 | 0 | 1 | 1 | 6 |
| subtype2 | 26 | 0 | 0 | 1 | 0 | 11 |
| subtype3 | 40 | 0 | 1 | 0 | 0 | 0 |
| subtype4 | 12 | 2 | 0 | 2 | 0 | 0 |
| subtype5 | 36 | 0 | 2 | 0 | 0 | 0 |
| subtype6 | 17 | 1 | 0 | 0 | 2 | 6 |
Figure S23. Get High-res Image Clustering Approach #5: 'RPPA CNMF subtypes' versus Clinical Feature #3: 'HISTOLOGICAL.TYPE'
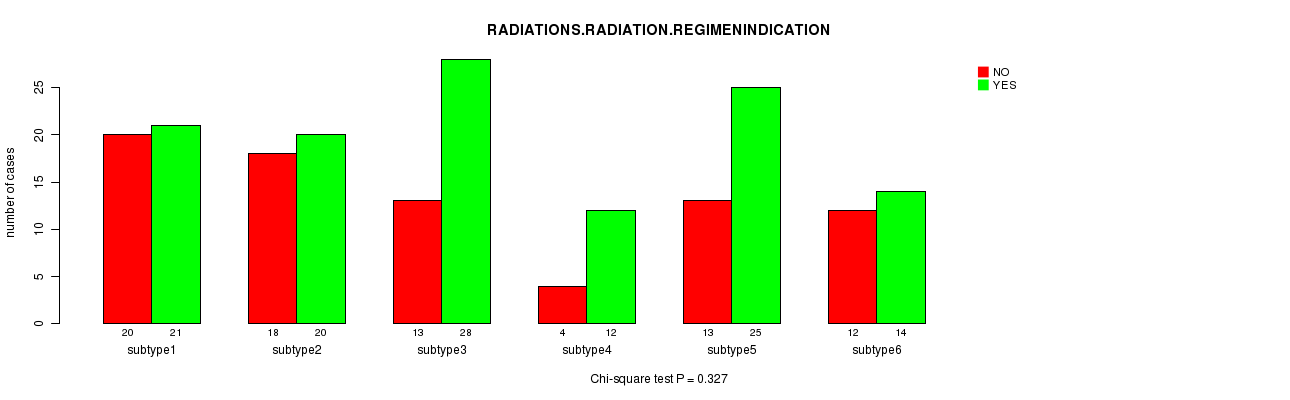
P value = 0.327 (Chi-square test)
Table S29. Clustering Approach #5: 'RPPA CNMF subtypes' versus Clinical Feature #4: 'RADIATIONS.RADIATION.REGIMENINDICATION'
| nPatients | NO | YES |
|---|---|---|
| ALL | 80 | 120 |
| subtype1 | 20 | 21 |
| subtype2 | 18 | 20 |
| subtype3 | 13 | 28 |
| subtype4 | 4 | 12 |
| subtype5 | 13 | 25 |
| subtype6 | 12 | 14 |
Figure S24. Get High-res Image Clustering Approach #5: 'RPPA CNMF subtypes' versus Clinical Feature #4: 'RADIATIONS.RADIATION.REGIMENINDICATION'
P value = 0.0533 (Chi-square test)
Table S30. Clustering Approach #5: 'RPPA CNMF subtypes' versus Clinical Feature #5: 'NEOADJUVANT.THERAPY'
| nPatients | NO | YES |
|---|---|---|
| ALL | 60 | 140 |
| subtype1 | 14 | 27 |
| subtype2 | 15 | 23 |
| subtype3 | 11 | 30 |
| subtype4 | 5 | 11 |
| subtype5 | 4 | 34 |
| subtype6 | 11 | 15 |
Figure S25. Get High-res Image Clustering Approach #5: 'RPPA CNMF subtypes' versus Clinical Feature #5: 'NEOADJUVANT.THERAPY'
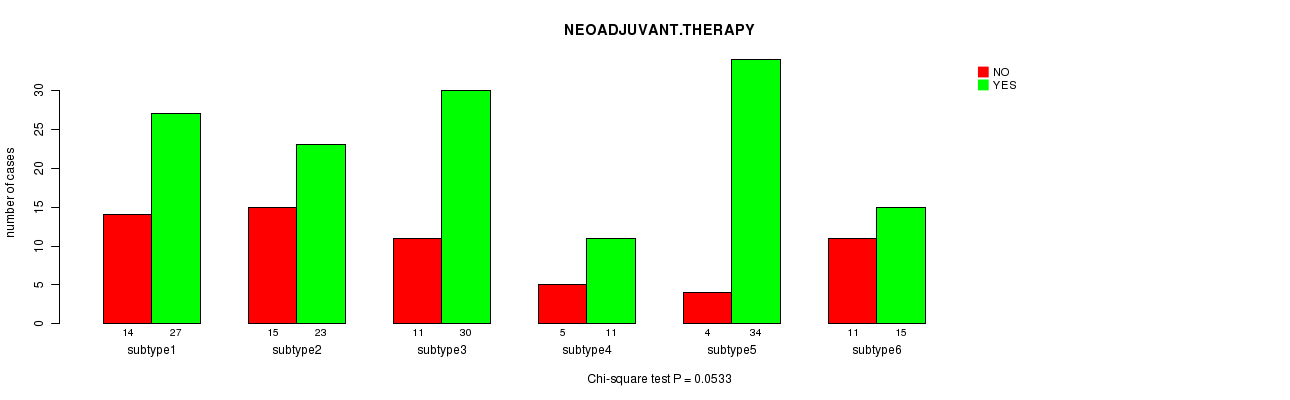
Table S31. Get Full Table Description of clustering approach #6: 'RPPA cHierClus subtypes'
| Cluster Labels | 1 | 2 | 3 | 4 | 5 | 6 |
|---|---|---|---|---|---|---|
| Number of samples | 7 | 33 | 39 | 39 | 56 | 26 |
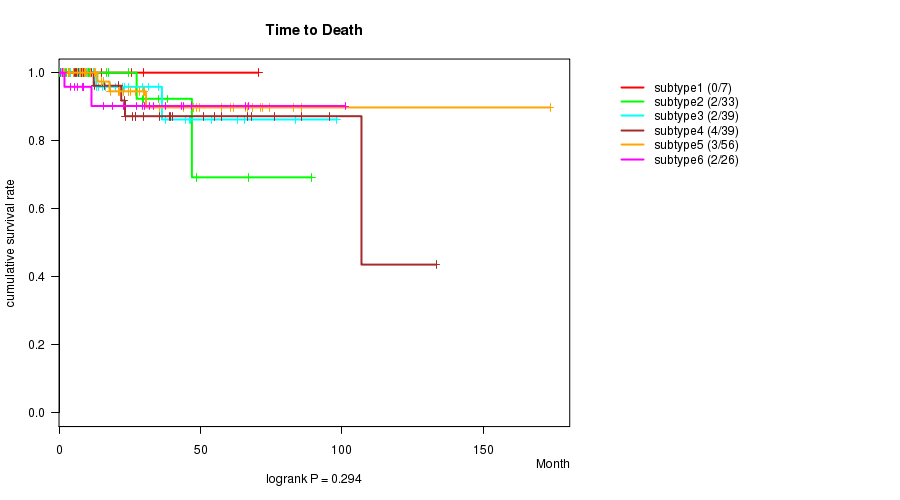
P value = 0.294 (logrank test)
Table S32. Clustering Approach #6: 'RPPA cHierClus subtypes' versus Clinical Feature #1: 'Time to Death'
| nPatients | nDeath | Duration Range (Median), Month | |
|---|---|---|---|
| ALL | 200 | 13 | 0.0 - 173.6 (21.7) |
| subtype1 | 7 | 0 | 9.2 - 70.4 (15.1) |
| subtype2 | 33 | 2 | 0.0 - 89.3 (12.2) |
| subtype3 | 39 | 2 | 0.7 - 98.2 (16.3) |
| subtype4 | 39 | 4 | 1.3 - 133.2 (23.3) |
| subtype5 | 56 | 3 | 1.4 - 173.6 (23.7) |
| subtype6 | 26 | 2 | 0.7 - 101.1 (22.7) |
Figure S26. Get High-res Image Clustering Approach #6: 'RPPA cHierClus subtypes' versus Clinical Feature #1: 'Time to Death'
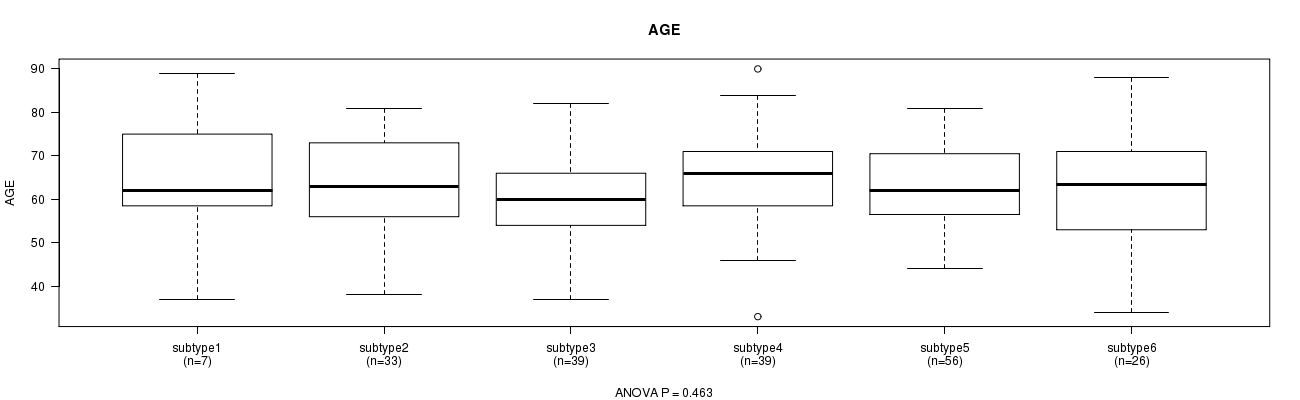
P value = 0.463 (ANOVA)
Table S33. Clustering Approach #6: 'RPPA cHierClus subtypes' versus Clinical Feature #2: 'AGE'
| nPatients | Mean (Std.Dev) | |
|---|---|---|
| ALL | 200 | 62.7 (11.1) |
| subtype1 | 7 | 65.0 (17.0) |
| subtype2 | 33 | 62.5 (11.5) |
| subtype3 | 39 | 59.8 (9.3) |
| subtype4 | 39 | 65.0 (11.3) |
| subtype5 | 56 | 63.1 (9.8) |
| subtype6 | 26 | 62.5 (13.2) |
Figure S27. Get High-res Image Clustering Approach #6: 'RPPA cHierClus subtypes' versus Clinical Feature #2: 'AGE'
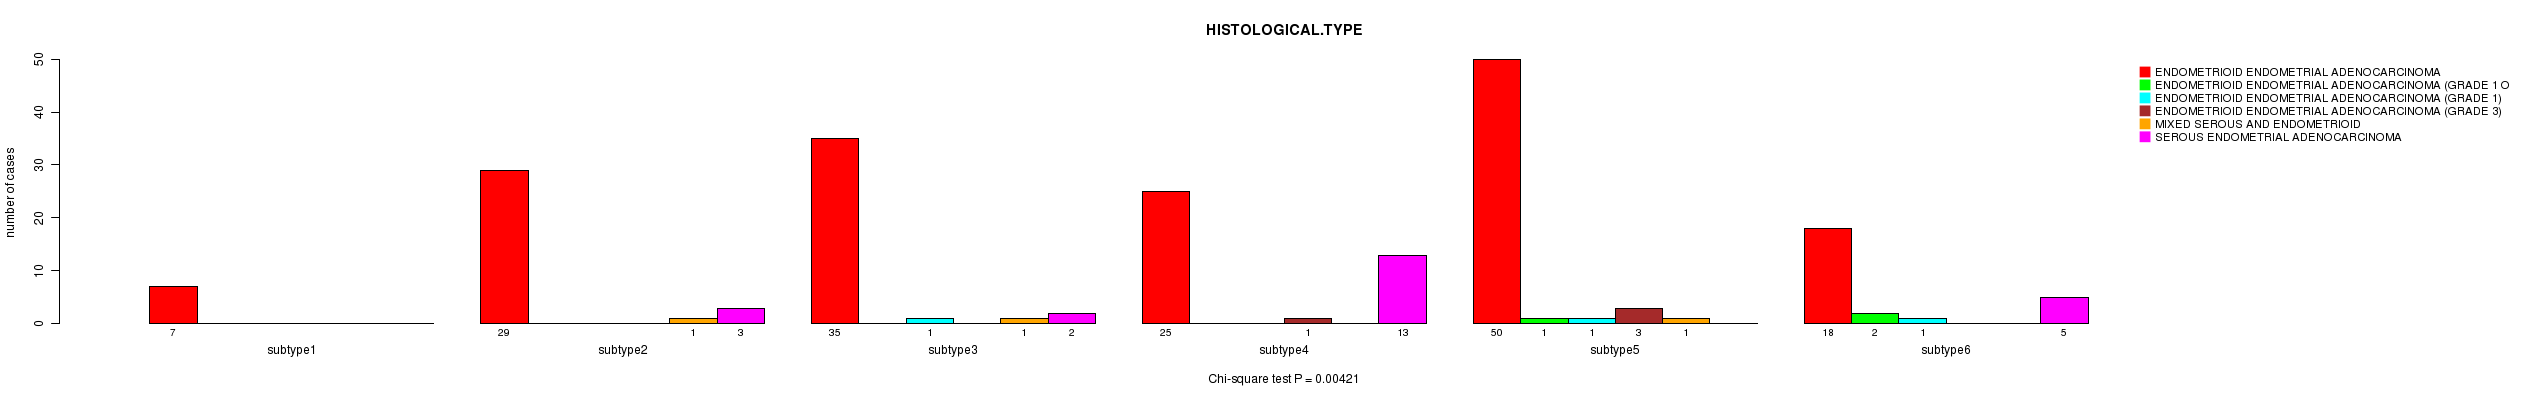
P value = 0.00421 (Chi-square test)
Table S34. Clustering Approach #6: 'RPPA cHierClus subtypes' versus Clinical Feature #3: 'HISTOLOGICAL.TYPE'
| nPatients | ENDOMETRIOID ENDOMETRIAL ADENOCARCINOMA | ENDOMETRIOID ENDOMETRIAL ADENOCARCINOMA (GRADE 1 OR 2) | ENDOMETRIOID ENDOMETRIAL ADENOCARCINOMA (GRADE 1) | ENDOMETRIOID ENDOMETRIAL ADENOCARCINOMA (GRADE 3) | MIXED SEROUS AND ENDOMETRIOID | SEROUS ENDOMETRIAL ADENOCARCINOMA |
|---|---|---|---|---|---|---|
| ALL | 164 | 3 | 3 | 4 | 3 | 23 |
| subtype1 | 7 | 0 | 0 | 0 | 0 | 0 |
| subtype2 | 29 | 0 | 0 | 0 | 1 | 3 |
| subtype3 | 35 | 0 | 1 | 0 | 1 | 2 |
| subtype4 | 25 | 0 | 0 | 1 | 0 | 13 |
| subtype5 | 50 | 1 | 1 | 3 | 1 | 0 |
| subtype6 | 18 | 2 | 1 | 0 | 0 | 5 |
Figure S28. Get High-res Image Clustering Approach #6: 'RPPA cHierClus subtypes' versus Clinical Feature #3: 'HISTOLOGICAL.TYPE'
P value = 0.584 (Chi-square test)
Table S35. Clustering Approach #6: 'RPPA cHierClus subtypes' versus Clinical Feature #4: 'RADIATIONS.RADIATION.REGIMENINDICATION'
| nPatients | NO | YES |
|---|---|---|
| ALL | 80 | 120 |
| subtype1 | 2 | 5 |
| subtype2 | 10 | 23 |
| subtype3 | 15 | 24 |
| subtype4 | 19 | 20 |
| subtype5 | 25 | 31 |
| subtype6 | 9 | 17 |
Figure S29. Get High-res Image Clustering Approach #6: 'RPPA cHierClus subtypes' versus Clinical Feature #4: 'RADIATIONS.RADIATION.REGIMENINDICATION'
P value = 0.157 (Chi-square test)
Table S36. Clustering Approach #6: 'RPPA cHierClus subtypes' versus Clinical Feature #5: 'NEOADJUVANT.THERAPY'
| nPatients | NO | YES |
|---|---|---|
| ALL | 60 | 140 |
| subtype1 | 0 | 7 |
| subtype2 | 7 | 26 |
| subtype3 | 11 | 28 |
| subtype4 | 16 | 23 |
| subtype5 | 20 | 36 |
| subtype6 | 6 | 20 |
Figure S30. Get High-res Image Clustering Approach #6: 'RPPA cHierClus subtypes' versus Clinical Feature #5: 'NEOADJUVANT.THERAPY'
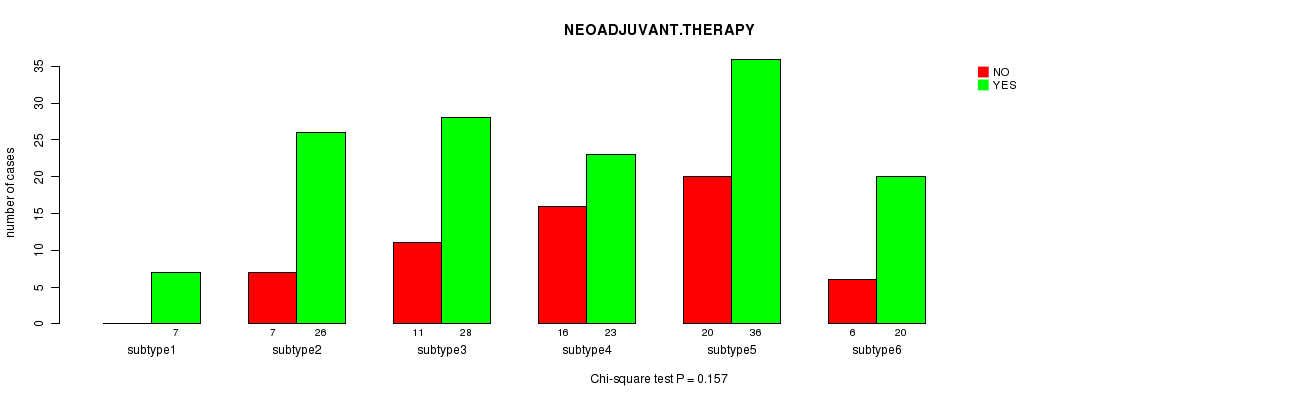
Table S37. Get Full Table Description of clustering approach #7: 'RNAseq CNMF subtypes'
| Cluster Labels | 1 | 2 | 3 | 4 |
|---|---|---|---|---|
| Number of samples | 66 | 114 | 80 | 73 |
P value = 0.00608 (logrank test)
Table S38. Clustering Approach #7: 'RNAseq CNMF subtypes' versus Clinical Feature #1: 'Time to Death'
| nPatients | nDeath | Duration Range (Median), Month | |
|---|---|---|---|
| ALL | 332 | 28 | 0.0 - 187.1 (18.2) |
| subtype1 | 66 | 6 | 0.6 - 106.9 (24.7) |
| subtype2 | 113 | 14 | 0.1 - 187.1 (14.0) |
| subtype3 | 80 | 1 | 0.6 - 101.1 (20.7) |
| subtype4 | 73 | 7 | 0.0 - 173.6 (16.8) |
Figure S31. Get High-res Image Clustering Approach #7: 'RNAseq CNMF subtypes' versus Clinical Feature #1: 'Time to Death'
P value = 2.41e-06 (ANOVA)
Table S39. Clustering Approach #7: 'RNAseq CNMF subtypes' versus Clinical Feature #2: 'AGE'
| nPatients | Mean (Std.Dev) | |
|---|---|---|
| ALL | 333 | 63.2 (10.9) |
| subtype1 | 66 | 62.8 (10.0) |
| subtype2 | 114 | 66.7 (10.2) |
| subtype3 | 80 | 63.2 (10.7) |
| subtype4 | 73 | 58.1 (11.1) |
Figure S32. Get High-res Image Clustering Approach #7: 'RNAseq CNMF subtypes' versus Clinical Feature #2: 'AGE'
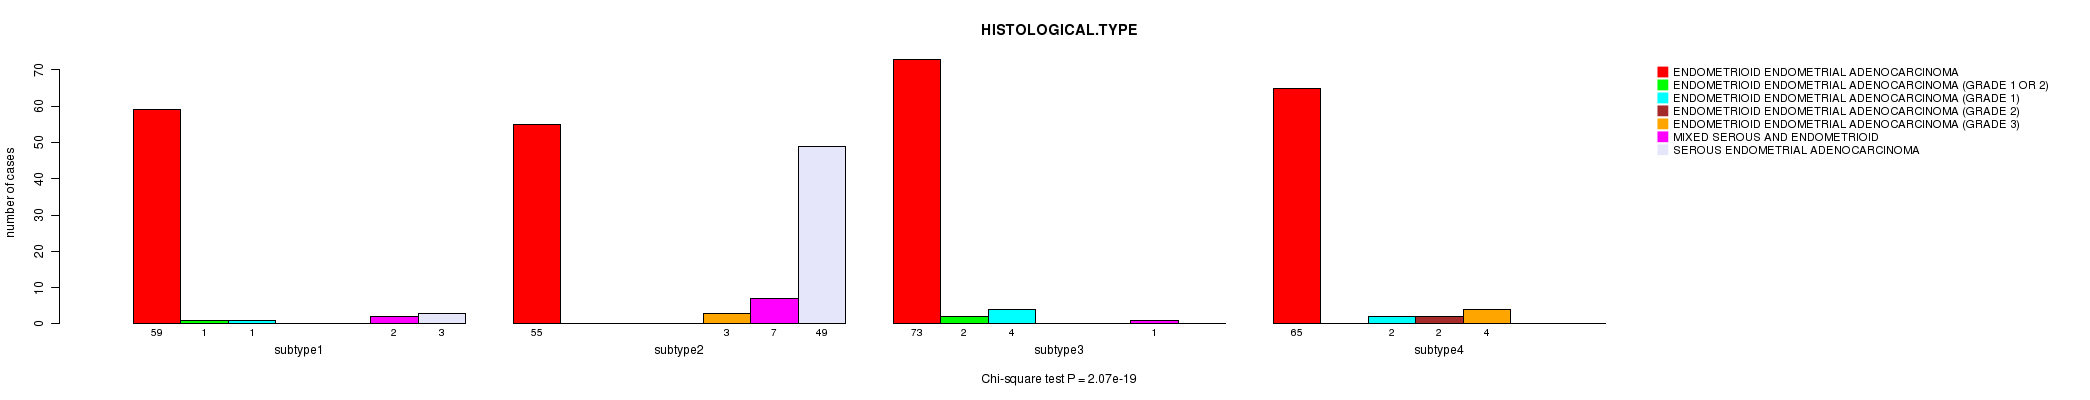
P value = 2.07e-19 (Chi-square test)
Table S40. Clustering Approach #7: 'RNAseq CNMF subtypes' versus Clinical Feature #3: 'HISTOLOGICAL.TYPE'
| nPatients | ENDOMETRIOID ENDOMETRIAL ADENOCARCINOMA | ENDOMETRIOID ENDOMETRIAL ADENOCARCINOMA (GRADE 1 OR 2) | ENDOMETRIOID ENDOMETRIAL ADENOCARCINOMA (GRADE 1) | ENDOMETRIOID ENDOMETRIAL ADENOCARCINOMA (GRADE 2) | ENDOMETRIOID ENDOMETRIAL ADENOCARCINOMA (GRADE 3) | MIXED SEROUS AND ENDOMETRIOID | SEROUS ENDOMETRIAL ADENOCARCINOMA |
|---|---|---|---|---|---|---|---|
| ALL | 252 | 3 | 7 | 2 | 7 | 10 | 52 |
| subtype1 | 59 | 1 | 1 | 0 | 0 | 2 | 3 |
| subtype2 | 55 | 0 | 0 | 0 | 3 | 7 | 49 |
| subtype3 | 73 | 2 | 4 | 0 | 0 | 1 | 0 |
| subtype4 | 65 | 0 | 2 | 2 | 4 | 0 | 0 |
Figure S33. Get High-res Image Clustering Approach #7: 'RNAseq CNMF subtypes' versus Clinical Feature #3: 'HISTOLOGICAL.TYPE'
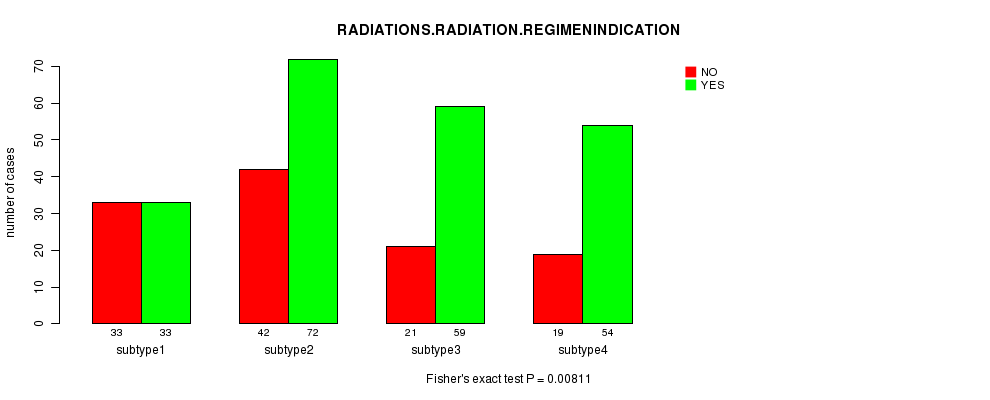
P value = 0.00811 (Fisher's exact test)
Table S41. Clustering Approach #7: 'RNAseq CNMF subtypes' versus Clinical Feature #4: 'RADIATIONS.RADIATION.REGIMENINDICATION'
| nPatients | NO | YES |
|---|---|---|
| ALL | 115 | 218 |
| subtype1 | 33 | 33 |
| subtype2 | 42 | 72 |
| subtype3 | 21 | 59 |
| subtype4 | 19 | 54 |
Figure S34. Get High-res Image Clustering Approach #7: 'RNAseq CNMF subtypes' versus Clinical Feature #4: 'RADIATIONS.RADIATION.REGIMENINDICATION'
P value = 0.0126 (Fisher's exact test)
Table S42. Clustering Approach #7: 'RNAseq CNMF subtypes' versus Clinical Feature #5: 'NEOADJUVANT.THERAPY'
| nPatients | NO | YES |
|---|---|---|
| ALL | 95 | 238 |
| subtype1 | 20 | 46 |
| subtype2 | 44 | 70 |
| subtype3 | 17 | 63 |
| subtype4 | 14 | 59 |
Figure S35. Get High-res Image Clustering Approach #7: 'RNAseq CNMF subtypes' versus Clinical Feature #5: 'NEOADJUVANT.THERAPY'
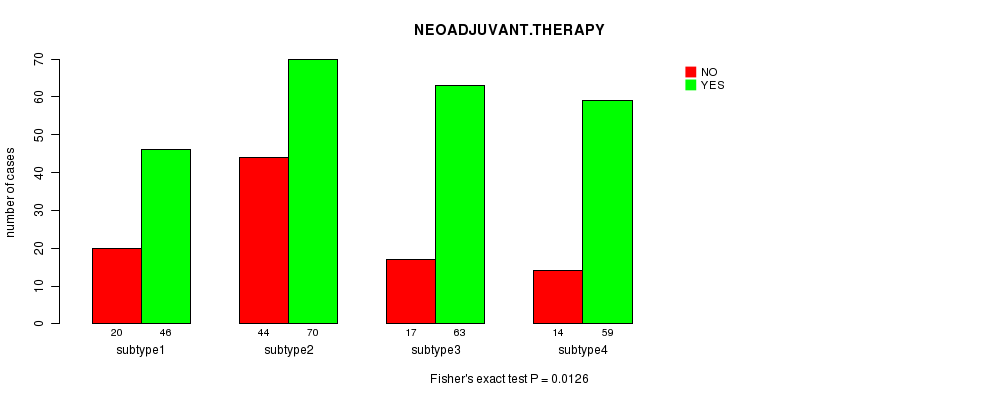
Table S43. Get Full Table Description of clustering approach #8: 'RNAseq cHierClus subtypes'
| Cluster Labels | 1 | 2 | 3 | 4 |
|---|---|---|---|---|
| Number of samples | 96 | 49 | 73 | 115 |
P value = 0.00127 (logrank test)
Table S44. Clustering Approach #8: 'RNAseq cHierClus subtypes' versus Clinical Feature #1: 'Time to Death'
| nPatients | nDeath | Duration Range (Median), Month | |
|---|---|---|---|
| ALL | 332 | 28 | 0.0 - 187.1 (18.2) |
| subtype1 | 96 | 1 | 0.6 - 101.1 (19.1) |
| subtype2 | 49 | 4 | 0.3 - 106.9 (27.4) |
| subtype3 | 73 | 8 | 0.0 - 173.6 (16.8) |
| subtype4 | 114 | 15 | 0.1 - 187.1 (14.1) |
Figure S36. Get High-res Image Clustering Approach #8: 'RNAseq cHierClus subtypes' versus Clinical Feature #1: 'Time to Death'

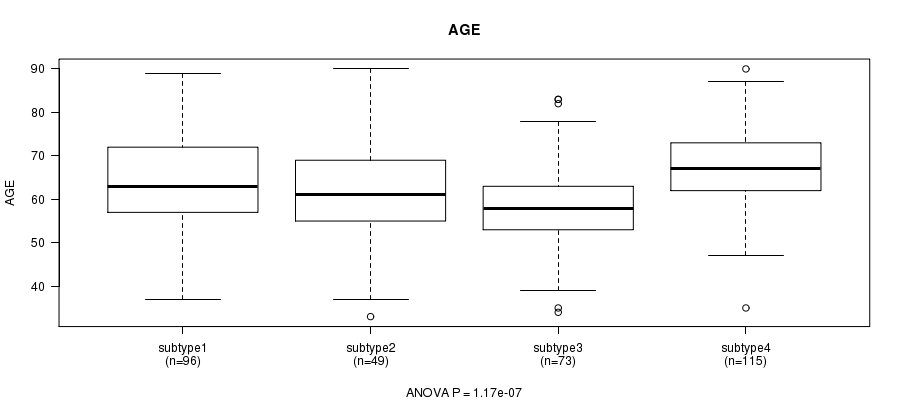
P value = 1.17e-07 (ANOVA)
Table S45. Clustering Approach #8: 'RNAseq cHierClus subtypes' versus Clinical Feature #2: 'AGE'
| nPatients | Mean (Std.Dev) | |
|---|---|---|
| ALL | 333 | 63.2 (10.9) |
| subtype1 | 96 | 63.3 (10.6) |
| subtype2 | 49 | 61.3 (11.4) |
| subtype3 | 73 | 58.1 (10.7) |
| subtype4 | 115 | 67.3 (9.6) |
Figure S37. Get High-res Image Clustering Approach #8: 'RNAseq cHierClus subtypes' versus Clinical Feature #2: 'AGE'
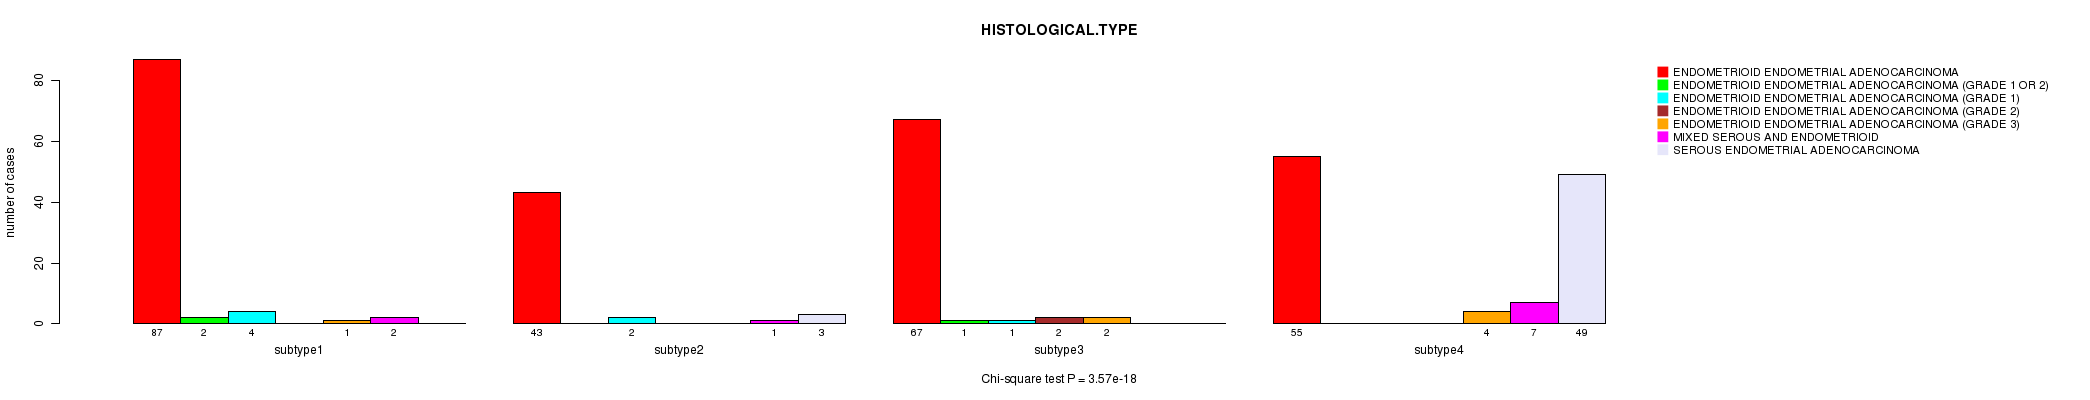
P value = 3.57e-18 (Chi-square test)
Table S46. Clustering Approach #8: 'RNAseq cHierClus subtypes' versus Clinical Feature #3: 'HISTOLOGICAL.TYPE'
| nPatients | ENDOMETRIOID ENDOMETRIAL ADENOCARCINOMA | ENDOMETRIOID ENDOMETRIAL ADENOCARCINOMA (GRADE 1 OR 2) | ENDOMETRIOID ENDOMETRIAL ADENOCARCINOMA (GRADE 1) | ENDOMETRIOID ENDOMETRIAL ADENOCARCINOMA (GRADE 2) | ENDOMETRIOID ENDOMETRIAL ADENOCARCINOMA (GRADE 3) | MIXED SEROUS AND ENDOMETRIOID | SEROUS ENDOMETRIAL ADENOCARCINOMA |
|---|---|---|---|---|---|---|---|
| ALL | 252 | 3 | 7 | 2 | 7 | 10 | 52 |
| subtype1 | 87 | 2 | 4 | 0 | 1 | 2 | 0 |
| subtype2 | 43 | 0 | 2 | 0 | 0 | 1 | 3 |
| subtype3 | 67 | 1 | 1 | 2 | 2 | 0 | 0 |
| subtype4 | 55 | 0 | 0 | 0 | 4 | 7 | 49 |
Figure S38. Get High-res Image Clustering Approach #8: 'RNAseq cHierClus subtypes' versus Clinical Feature #3: 'HISTOLOGICAL.TYPE'
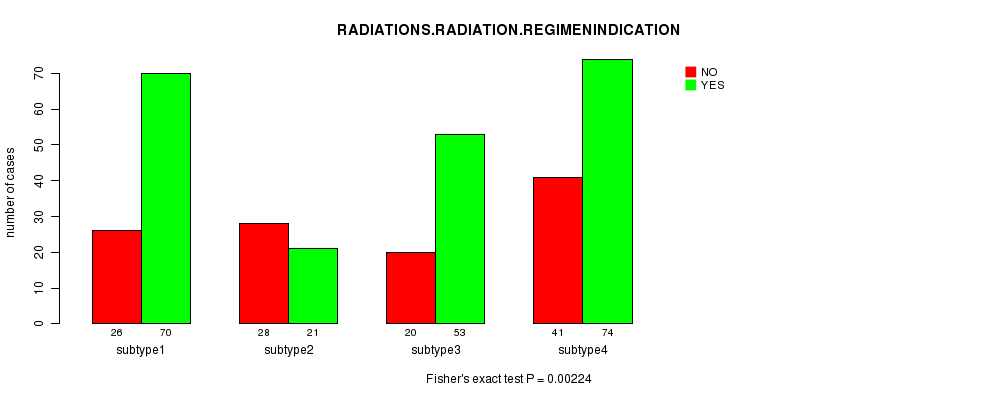
P value = 0.00224 (Fisher's exact test)
Table S47. Clustering Approach #8: 'RNAseq cHierClus subtypes' versus Clinical Feature #4: 'RADIATIONS.RADIATION.REGIMENINDICATION'
| nPatients | NO | YES |
|---|---|---|
| ALL | 115 | 218 |
| subtype1 | 26 | 70 |
| subtype2 | 28 | 21 |
| subtype3 | 20 | 53 |
| subtype4 | 41 | 74 |
Figure S39. Get High-res Image Clustering Approach #8: 'RNAseq cHierClus subtypes' versus Clinical Feature #4: 'RADIATIONS.RADIATION.REGIMENINDICATION'
P value = 0.00482 (Fisher's exact test)
Table S48. Clustering Approach #8: 'RNAseq cHierClus subtypes' versus Clinical Feature #5: 'NEOADJUVANT.THERAPY'
| nPatients | NO | YES |
|---|---|---|
| ALL | 95 | 238 |
| subtype1 | 21 | 75 |
| subtype2 | 16 | 33 |
| subtype3 | 13 | 60 |
| subtype4 | 45 | 70 |
Figure S40. Get High-res Image Clustering Approach #8: 'RNAseq cHierClus subtypes' versus Clinical Feature #5: 'NEOADJUVANT.THERAPY'
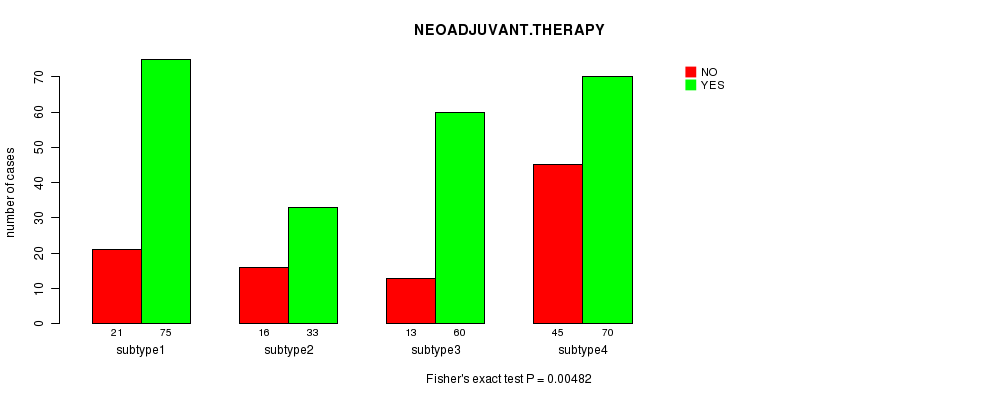
Table S49. Get Full Table Description of clustering approach #9: 'MIRseq CNMF subtypes'
| Cluster Labels | 1 | 2 | 3 |
|---|---|---|---|
| Number of samples | 159 | 146 | 131 |
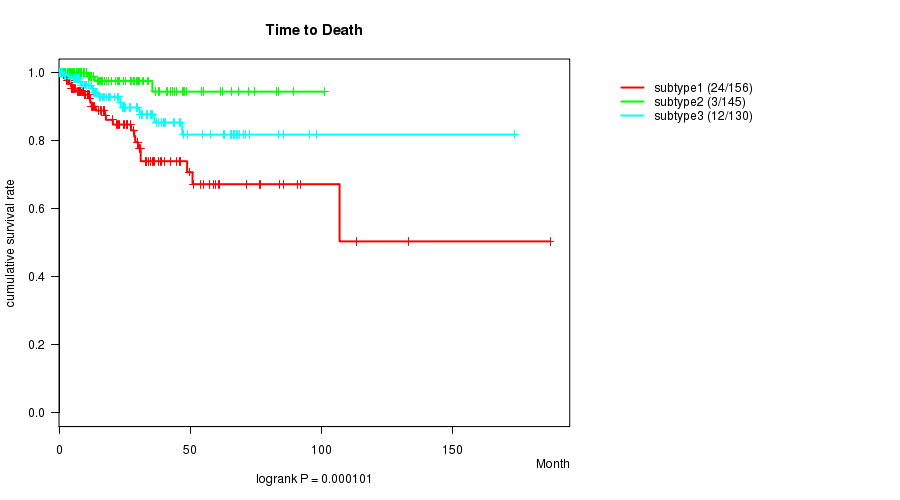
P value = 0.000101 (logrank test)
Table S50. Clustering Approach #9: 'MIRseq CNMF subtypes' versus Clinical Feature #1: 'Time to Death'
| nPatients | nDeath | Duration Range (Median), Month | |
|---|---|---|---|
| ALL | 431 | 39 | 0.0 - 187.1 (15.7) |
| subtype1 | 156 | 24 | 0.0 - 187.1 (12.4) |
| subtype2 | 145 | 3 | 0.1 - 101.1 (15.2) |
| subtype3 | 130 | 12 | 0.2 - 173.6 (19.4) |
Figure S41. Get High-res Image Clustering Approach #9: 'MIRseq CNMF subtypes' versus Clinical Feature #1: 'Time to Death'
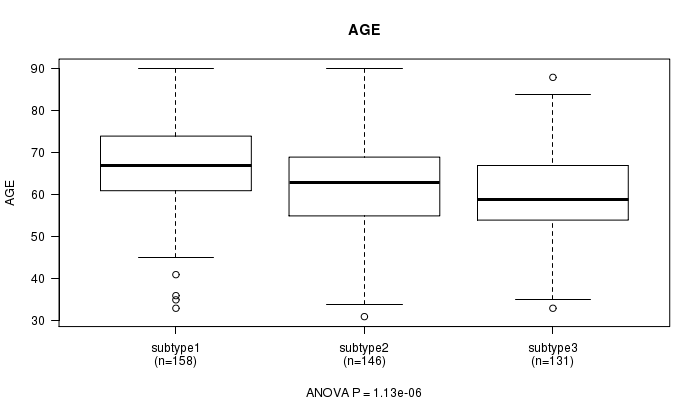
P value = 1.13e-06 (ANOVA)
Table S51. Clustering Approach #9: 'MIRseq CNMF subtypes' versus Clinical Feature #2: 'AGE'
| nPatients | Mean (Std.Dev) | |
|---|---|---|
| ALL | 435 | 63.4 (11.2) |
| subtype1 | 158 | 66.8 (10.5) |
| subtype2 | 146 | 62.5 (11.2) |
| subtype3 | 131 | 60.2 (11.0) |
Figure S42. Get High-res Image Clustering Approach #9: 'MIRseq CNMF subtypes' versus Clinical Feature #2: 'AGE'
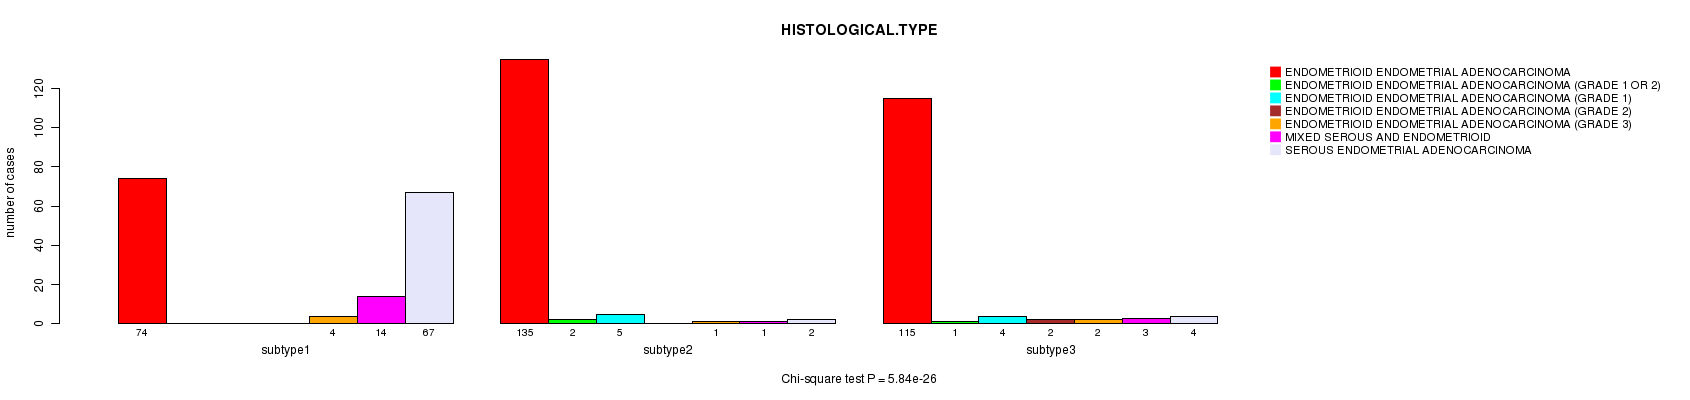
P value = 5.84e-26 (Chi-square test)
Table S52. Clustering Approach #9: 'MIRseq CNMF subtypes' versus Clinical Feature #3: 'HISTOLOGICAL.TYPE'
| nPatients | ENDOMETRIOID ENDOMETRIAL ADENOCARCINOMA | ENDOMETRIOID ENDOMETRIAL ADENOCARCINOMA (GRADE 1 OR 2) | ENDOMETRIOID ENDOMETRIAL ADENOCARCINOMA (GRADE 1) | ENDOMETRIOID ENDOMETRIAL ADENOCARCINOMA (GRADE 2) | ENDOMETRIOID ENDOMETRIAL ADENOCARCINOMA (GRADE 3) | MIXED SEROUS AND ENDOMETRIOID | SEROUS ENDOMETRIAL ADENOCARCINOMA |
|---|---|---|---|---|---|---|---|
| ALL | 324 | 3 | 9 | 2 | 7 | 18 | 73 |
| subtype1 | 74 | 0 | 0 | 0 | 4 | 14 | 67 |
| subtype2 | 135 | 2 | 5 | 0 | 1 | 1 | 2 |
| subtype3 | 115 | 1 | 4 | 2 | 2 | 3 | 4 |
Figure S43. Get High-res Image Clustering Approach #9: 'MIRseq CNMF subtypes' versus Clinical Feature #3: 'HISTOLOGICAL.TYPE'
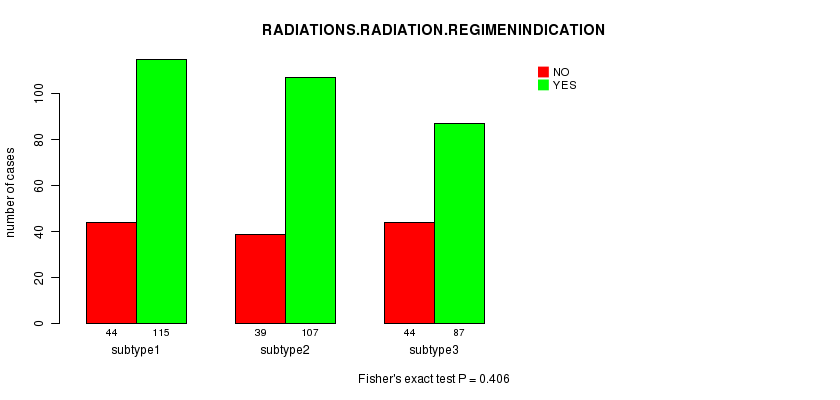
P value = 0.406 (Fisher's exact test)
Table S53. Clustering Approach #9: 'MIRseq CNMF subtypes' versus Clinical Feature #4: 'RADIATIONS.RADIATION.REGIMENINDICATION'
| nPatients | NO | YES |
|---|---|---|
| ALL | 127 | 309 |
| subtype1 | 44 | 115 |
| subtype2 | 39 | 107 |
| subtype3 | 44 | 87 |
Figure S44. Get High-res Image Clustering Approach #9: 'MIRseq CNMF subtypes' versus Clinical Feature #4: 'RADIATIONS.RADIATION.REGIMENINDICATION'
P value = 0.0772 (Fisher's exact test)
Table S54. Clustering Approach #9: 'MIRseq CNMF subtypes' versus Clinical Feature #5: 'NEOADJUVANT.THERAPY'
| nPatients | NO | YES |
|---|---|---|
| ALL | 101 | 335 |
| subtype1 | 44 | 115 |
| subtype2 | 25 | 121 |
| subtype3 | 32 | 99 |
Figure S45. Get High-res Image Clustering Approach #9: 'MIRseq CNMF subtypes' versus Clinical Feature #5: 'NEOADJUVANT.THERAPY'
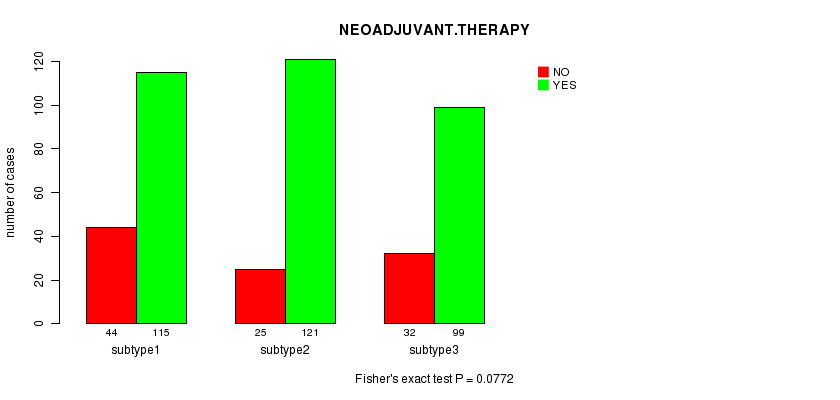
Table S55. Get Full Table Description of clustering approach #10: 'MIRseq cHierClus subtypes'
| Cluster Labels | 1 | 2 | 3 |
|---|---|---|---|
| Number of samples | 24 | 207 | 205 |
P value = 0.000228 (logrank test)
Table S56. Clustering Approach #10: 'MIRseq cHierClus subtypes' versus Clinical Feature #1: 'Time to Death'
| nPatients | nDeath | Duration Range (Median), Month | |
|---|---|---|---|
| ALL | 431 | 39 | 0.0 - 187.1 (15.7) |
| subtype1 | 24 | 4 | 0.5 - 68.7 (13.4) |
| subtype2 | 203 | 28 | 0.0 - 187.1 (14.0) |
| subtype3 | 204 | 7 | 0.0 - 173.6 (16.6) |
Figure S46. Get High-res Image Clustering Approach #10: 'MIRseq cHierClus subtypes' versus Clinical Feature #1: 'Time to Death'
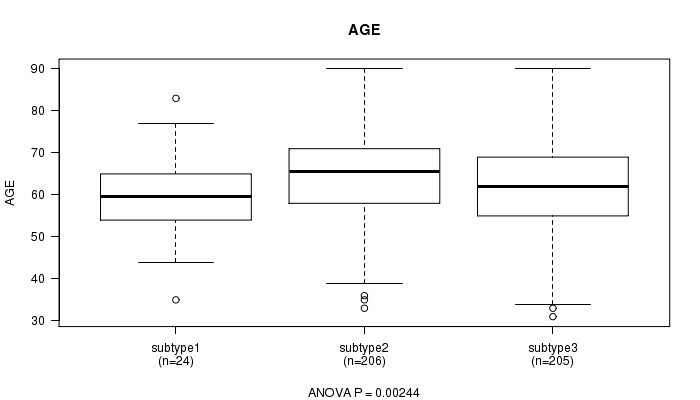
P value = 0.00244 (ANOVA)
Table S57. Clustering Approach #10: 'MIRseq cHierClus subtypes' versus Clinical Feature #2: 'AGE'
| nPatients | Mean (Std.Dev) | |
|---|---|---|
| ALL | 435 | 63.4 (11.2) |
| subtype1 | 24 | 59.6 (11.4) |
| subtype2 | 206 | 65.3 (10.7) |
| subtype3 | 205 | 61.9 (11.4) |
Figure S47. Get High-res Image Clustering Approach #10: 'MIRseq cHierClus subtypes' versus Clinical Feature #2: 'AGE'
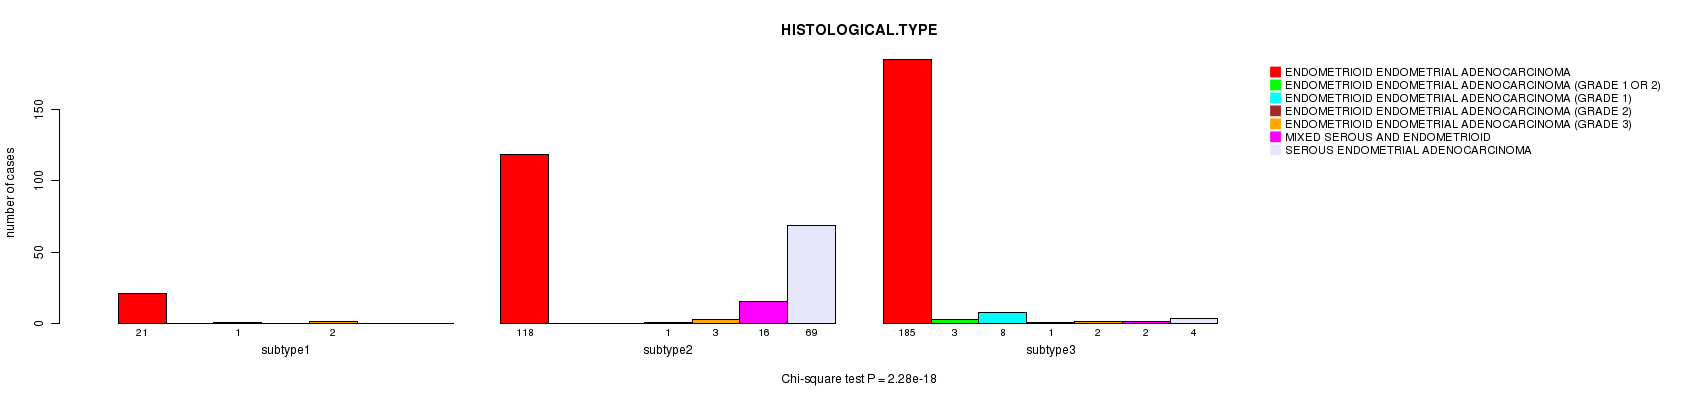
P value = 2.28e-18 (Chi-square test)
Table S58. Clustering Approach #10: 'MIRseq cHierClus subtypes' versus Clinical Feature #3: 'HISTOLOGICAL.TYPE'
| nPatients | ENDOMETRIOID ENDOMETRIAL ADENOCARCINOMA | ENDOMETRIOID ENDOMETRIAL ADENOCARCINOMA (GRADE 1 OR 2) | ENDOMETRIOID ENDOMETRIAL ADENOCARCINOMA (GRADE 1) | ENDOMETRIOID ENDOMETRIAL ADENOCARCINOMA (GRADE 2) | ENDOMETRIOID ENDOMETRIAL ADENOCARCINOMA (GRADE 3) | MIXED SEROUS AND ENDOMETRIOID | SEROUS ENDOMETRIAL ADENOCARCINOMA |
|---|---|---|---|---|---|---|---|
| ALL | 324 | 3 | 9 | 2 | 7 | 18 | 73 |
| subtype1 | 21 | 0 | 1 | 0 | 2 | 0 | 0 |
| subtype2 | 118 | 0 | 0 | 1 | 3 | 16 | 69 |
| subtype3 | 185 | 3 | 8 | 1 | 2 | 2 | 4 |
Figure S48. Get High-res Image Clustering Approach #10: 'MIRseq cHierClus subtypes' versus Clinical Feature #3: 'HISTOLOGICAL.TYPE'
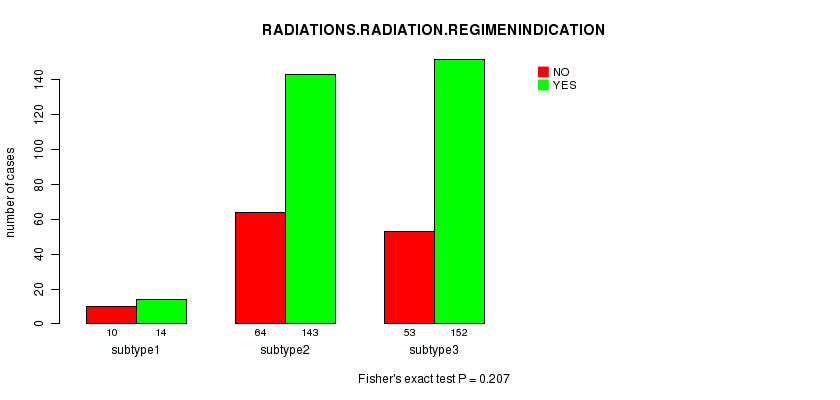
P value = 0.207 (Fisher's exact test)
Table S59. Clustering Approach #10: 'MIRseq cHierClus subtypes' versus Clinical Feature #4: 'RADIATIONS.RADIATION.REGIMENINDICATION'
| nPatients | NO | YES |
|---|---|---|
| ALL | 127 | 309 |
| subtype1 | 10 | 14 |
| subtype2 | 64 | 143 |
| subtype3 | 53 | 152 |
Figure S49. Get High-res Image Clustering Approach #10: 'MIRseq cHierClus subtypes' versus Clinical Feature #4: 'RADIATIONS.RADIATION.REGIMENINDICATION'
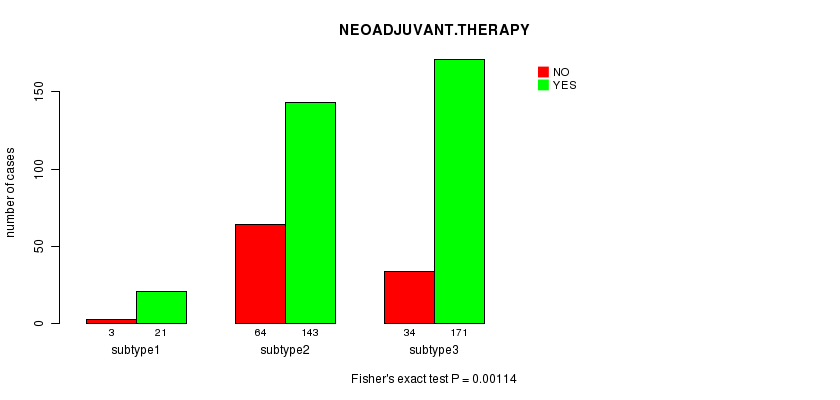
P value = 0.00114 (Fisher's exact test)
Table S60. Clustering Approach #10: 'MIRseq cHierClus subtypes' versus Clinical Feature #5: 'NEOADJUVANT.THERAPY'
| nPatients | NO | YES |
|---|---|---|
| ALL | 101 | 335 |
| subtype1 | 3 | 21 |
| subtype2 | 64 | 143 |
| subtype3 | 34 | 171 |
Figure S50. Get High-res Image Clustering Approach #10: 'MIRseq cHierClus subtypes' versus Clinical Feature #5: 'NEOADJUVANT.THERAPY'
-
Cluster data file = UCEC.mergedcluster.txt
-
Clinical data file = UCEC.clin.merged.picked.txt
-
Number of patients = 451
-
Number of clustering approaches = 10
-
Number of selected clinical features = 5
-
Exclude small clusters that include fewer than K patients, K = 3
consensus non-negative matrix factorization clustering approach (Brunet et al. 2004)
Resampling-based clustering method (Monti et al. 2003)
For survival clinical features, the Kaplan-Meier survival curves of tumors with and without gene mutations were plotted and the statistical significance P values were estimated by logrank test (Bland and Altman 2004) using the 'survdiff' function in R
For continuous numerical clinical features, one-way analysis of variance (Howell 2002) was applied to compare the clinical values between tumor subtypes using 'anova' function in R
For multi-class clinical features (nominal or ordinal), Chi-square tests (Greenwood and Nikulin 1996) were used to estimate the P values using the 'chisq.test' function in R
For binary clinical features, two-tailed Fisher's exact tests (Fisher 1922) were used to estimate the P values using the 'fisher.test' function in R
This is an experimental feature. The full results of the analysis summarized in this report can be downloaded from the TCGA Data Coordination Center.