This pipeline computes the correlation between cancer subtypes identified by different molecular patterns and selected clinical features.
Testing the association between subtypes identified by 8 different clustering approaches and 7 clinical features across 108 patients, one significant finding detected with P value < 0.05.
-
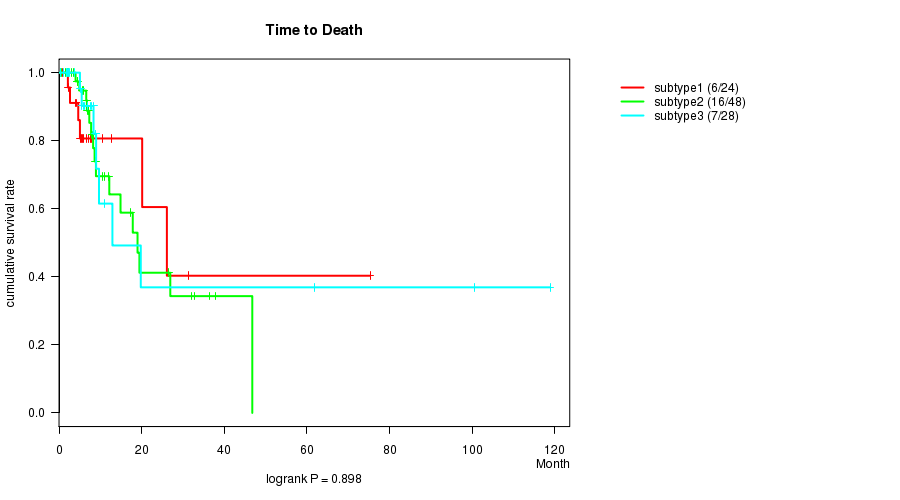
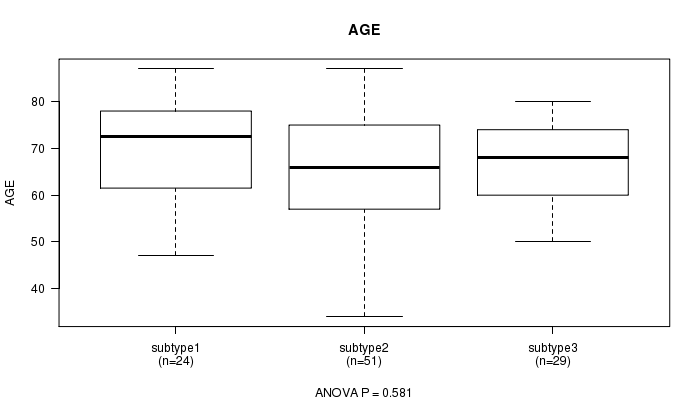
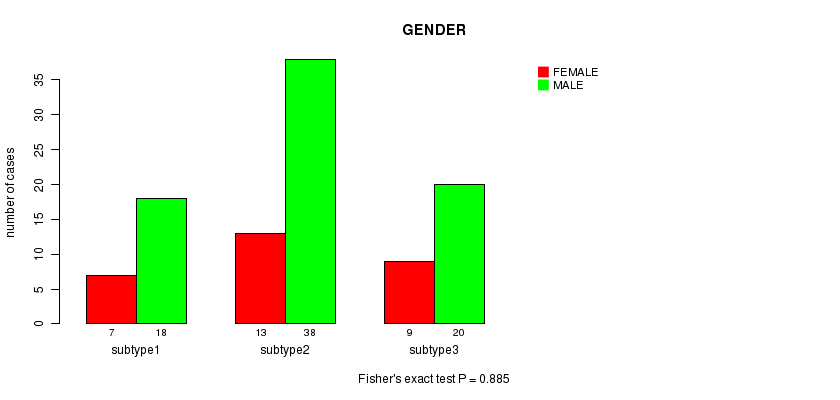
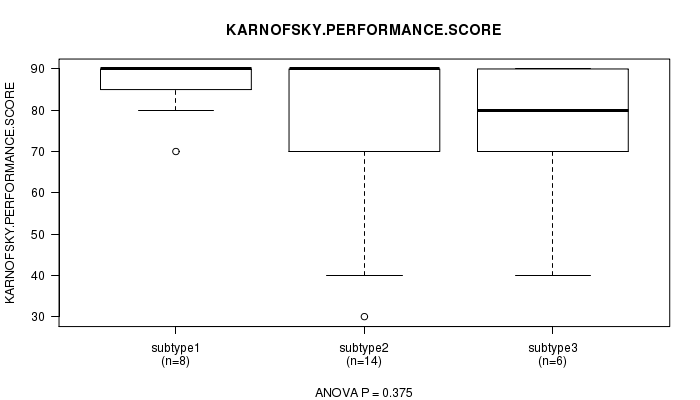
3 subtypes identified in current cancer cohort by 'CN CNMF'. These subtypes do not correlate to any clinical features.
-
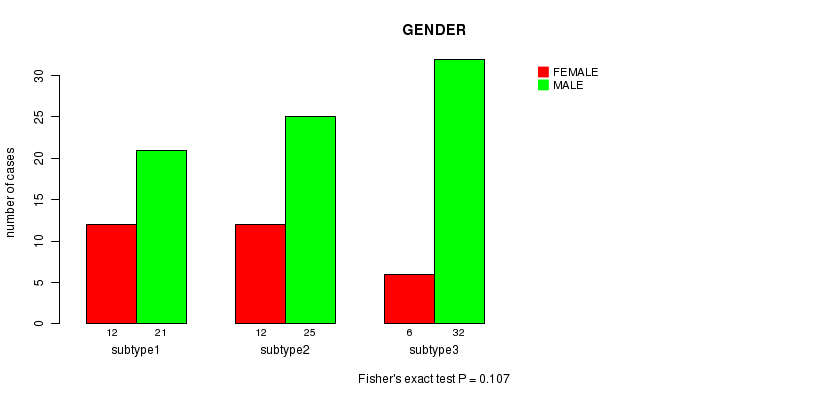
3 subtypes identified in current cancer cohort by 'METHLYATION CNMF'. These subtypes do not correlate to any clinical features.
-
CNMF clustering analysis on RPPA data identified 4 subtypes that do not correlate to any clinical features.
-
Consensus hierarchical clustering analysis on RPPA data identified 3 subtypes that do not correlate to any clinical features.
-
CNMF clustering analysis on sequencing-based mRNA expression data identified 4 subtypes that correlate to 'TOBACCOSMOKINGHISTORYINDICATOR'.
-
Consensus hierarchical clustering analysis on sequencing-based mRNA expression data identified 3 subtypes that do not correlate to any clinical features.
-
CNMF clustering analysis on sequencing-based miR expression data identified 3 subtypes that do not correlate to any clinical features.
-
Consensus hierarchical clustering analysis on sequencing-based miR expression data identified 3 subtypes that do not correlate to any clinical features.
Table 1. Get Full Table Overview of the association between subtypes identified by 8 different clustering approaches and 7 clinical features. Shown in the table are P values from statistical tests. Thresholded by P value < 0.05, one significant finding detected.
|
Clinical Features |
Time to Death |
AGE | GENDER |
KARNOFSKY PERFORMANCE SCORE |
NUMBERPACKYEARSSMOKED | STOPPEDSMOKINGYEAR | TOBACCOSMOKINGHISTORYINDICATOR |
| Statistical Tests | logrank test | ANOVA | Fisher's exact test | ANOVA | ANOVA | ANOVA | ANOVA |
| CN CNMF | 0.898 | 0.581 | 0.885 | 0.375 | 0.795 | 0.706 | 0.977 |
| METHLYATION CNMF | 0.209 | 0.301 | 0.107 | 0.259 | 0.628 | 0.217 | 0.605 |
| RPPA CNMF subtypes | 0.245 | 0.473 | 0.633 | 0.465 | 0.657 | 0.955 | 0.258 |
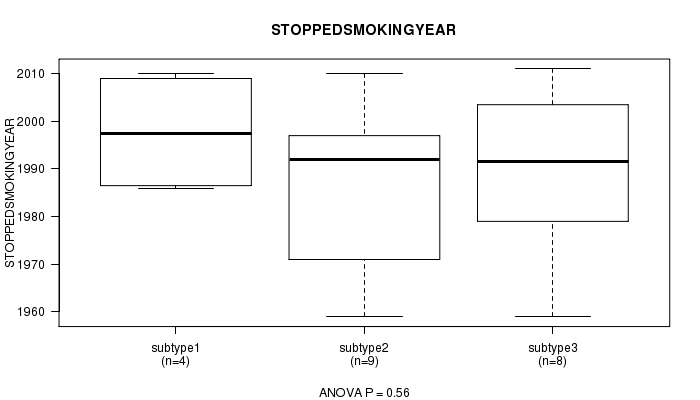
| RPPA cHierClus subtypes | 0.25 | 0.164 | 0.196 | 0.342 | 0.677 | 0.56 | 0.412 |
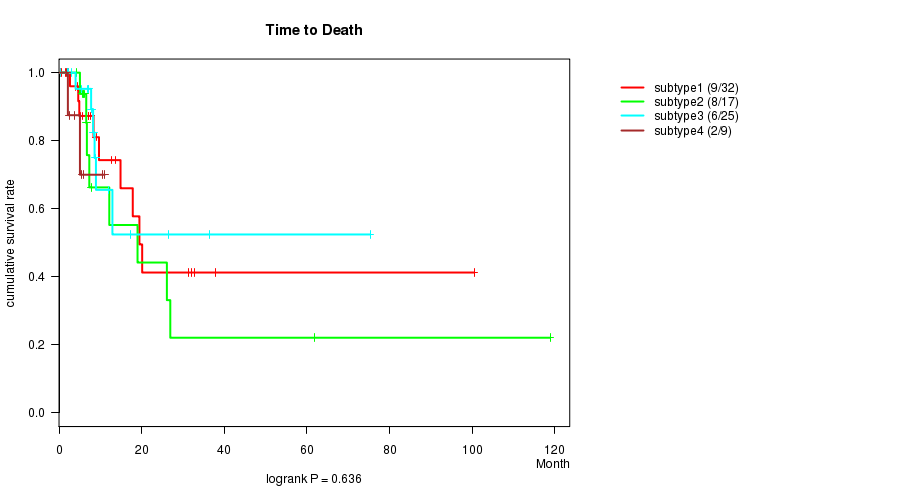
| RNAseq CNMF subtypes | 0.636 | 0.345 | 0.222 | 0.445 | 0.672 | 0.643 | 0.0439 |
| RNAseq cHierClus subtypes | 0.203 | 0.968 | 0.309 | 0.919 | 0.684 | 0.744 | 0.47 |
| MIRseq CNMF subtypes | 0.472 | 0.548 | 0.288 | 0.608 | 0.761 | 0.961 | 0.421 |
| MIRseq cHierClus subtypes | 0.877 | 0.404 | 0.798 | 0.86 | 0.166 | 0.625 | 0.389 |
Table S1. Get Full Table Description of clustering approach #1: 'CN CNMF'
| Cluster Labels | 1 | 2 | 3 |
|---|---|---|---|
| Number of samples | 25 | 51 | 29 |
P value = 0.898 (logrank test)
Table S2. Clustering Approach #1: 'CN CNMF' versus Clinical Feature #1: 'Time to Death'
| nPatients | nDeath | Duration Range (Median), Month | |
|---|---|---|---|
| ALL | 100 | 29 | 0.4 - 118.9 (7.1) |
| subtype1 | 24 | 6 | 0.8 - 75.3 (5.8) |
| subtype2 | 48 | 16 | 0.5 - 46.8 (7.5) |
| subtype3 | 28 | 7 | 0.4 - 118.9 (7.3) |
Figure S1. Get High-res Image Clustering Approach #1: 'CN CNMF' versus Clinical Feature #1: 'Time to Death'
P value = 0.581 (ANOVA)
Table S3. Clustering Approach #1: 'CN CNMF' versus Clinical Feature #2: 'AGE'
| nPatients | Mean (Std.Dev) | |
|---|---|---|
| ALL | 104 | 66.9 (11.1) |
| subtype1 | 24 | 69.0 (11.1) |
| subtype2 | 51 | 66.2 (12.4) |
| subtype3 | 29 | 66.4 (8.7) |
Figure S2. Get High-res Image Clustering Approach #1: 'CN CNMF' versus Clinical Feature #2: 'AGE'
P value = 0.885 (Fisher's exact test)
Table S4. Clustering Approach #1: 'CN CNMF' versus Clinical Feature #3: 'GENDER'
| nPatients | FEMALE | MALE |
|---|---|---|
| ALL | 29 | 76 |
| subtype1 | 7 | 18 |
| subtype2 | 13 | 38 |
| subtype3 | 9 | 20 |
Figure S3. Get High-res Image Clustering Approach #1: 'CN CNMF' versus Clinical Feature #3: 'GENDER'
P value = 0.375 (ANOVA)
Table S5. Clustering Approach #1: 'CN CNMF' versus Clinical Feature #4: 'KARNOFSKY.PERFORMANCE.SCORE'
| nPatients | Mean (Std.Dev) | |
|---|---|---|
| ALL | 28 | 78.9 (17.3) |
| subtype1 | 8 | 86.2 (7.4) |
| subtype2 | 14 | 76.4 (20.2) |
| subtype3 | 6 | 75.0 (18.7) |
Figure S4. Get High-res Image Clustering Approach #1: 'CN CNMF' versus Clinical Feature #4: 'KARNOFSKY.PERFORMANCE.SCORE'
P value = 0.795 (ANOVA)
Table S6. Clustering Approach #1: 'CN CNMF' versus Clinical Feature #5: 'NUMBERPACKYEARSSMOKED'
| nPatients | Mean (Std.Dev) | |
|---|---|---|
| ALL | 64 | 35.1 (22.5) |
| subtype1 | 17 | 34.5 (30.2) |
| subtype2 | 26 | 33.3 (20.0) |
| subtype3 | 21 | 37.8 (18.8) |
Figure S5. Get High-res Image Clustering Approach #1: 'CN CNMF' versus Clinical Feature #5: 'NUMBERPACKYEARSSMOKED'

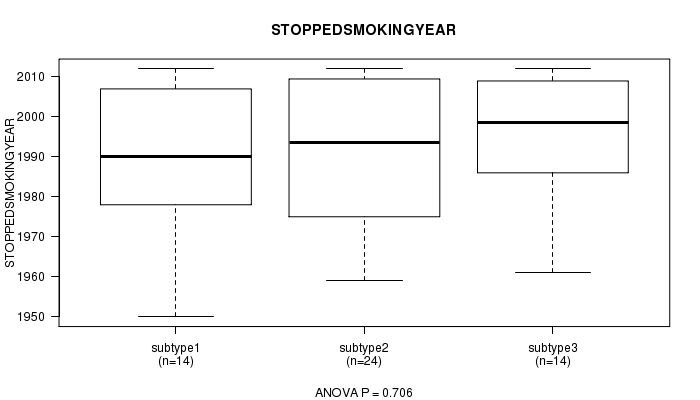
P value = 0.706 (ANOVA)
Table S7. Clustering Approach #1: 'CN CNMF' versus Clinical Feature #6: 'STOPPEDSMOKINGYEAR'
| nPatients | Mean (Std.Dev) | |
|---|---|---|
| ALL | 52 | 1991.8 (18.0) |
| subtype1 | 14 | 1989.6 (19.6) |
| subtype2 | 24 | 1991.1 (18.7) |
| subtype3 | 14 | 1995.1 (16.0) |
Figure S6. Get High-res Image Clustering Approach #1: 'CN CNMF' versus Clinical Feature #6: 'STOPPEDSMOKINGYEAR'
P value = 0.977 (ANOVA)
Table S8. Clustering Approach #1: 'CN CNMF' versus Clinical Feature #7: 'TOBACCOSMOKINGHISTORYINDICATOR'
| nPatients | Mean (Std.Dev) | |
|---|---|---|
| ALL | 99 | 2.6 (1.1) |
| subtype1 | 24 | 2.7 (1.1) |
| subtype2 | 48 | 2.6 (1.2) |
| subtype3 | 27 | 2.6 (1.1) |
Figure S7. Get High-res Image Clustering Approach #1: 'CN CNMF' versus Clinical Feature #7: 'TOBACCOSMOKINGHISTORYINDICATOR'
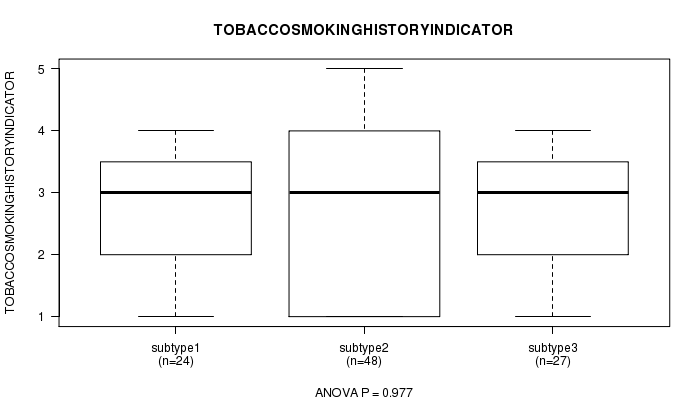
Table S9. Get Full Table Description of clustering approach #2: 'METHLYATION CNMF'
| Cluster Labels | 1 | 2 | 3 |
|---|---|---|---|
| Number of samples | 33 | 37 | 38 |
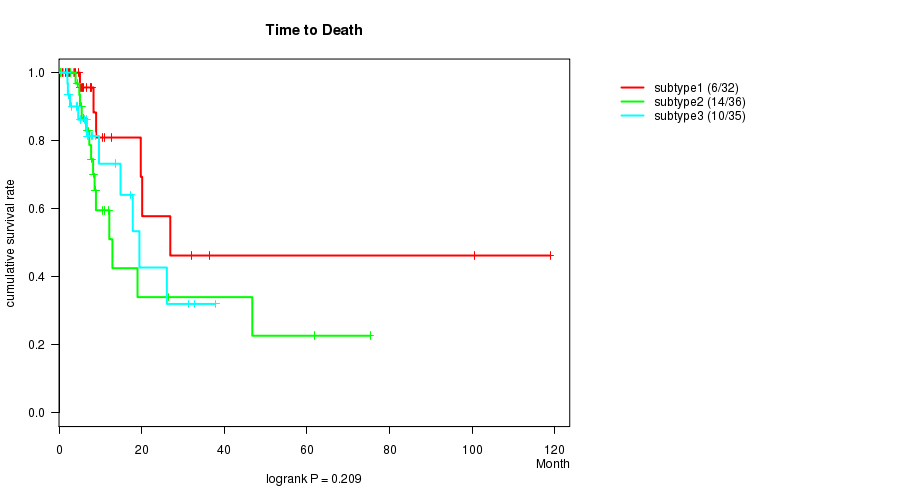
P value = 0.209 (logrank test)
Table S10. Clustering Approach #2: 'METHLYATION CNMF' versus Clinical Feature #1: 'Time to Death'
| nPatients | nDeath | Duration Range (Median), Month | |
|---|---|---|---|
| ALL | 103 | 30 | 0.4 - 118.9 (7.0) |
| subtype1 | 32 | 6 | 0.8 - 118.9 (7.2) |
| subtype2 | 36 | 14 | 0.4 - 75.3 (7.8) |
| subtype3 | 35 | 10 | 0.7 - 37.8 (6.7) |
Figure S8. Get High-res Image Clustering Approach #2: 'METHLYATION CNMF' versus Clinical Feature #1: 'Time to Death'
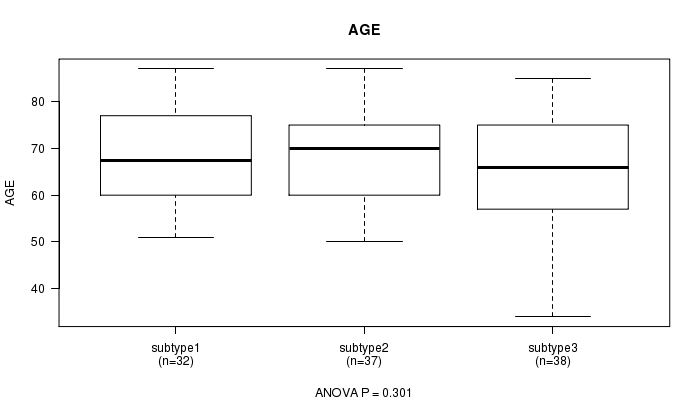
P value = 0.301 (ANOVA)
Table S11. Clustering Approach #2: 'METHLYATION CNMF' versus Clinical Feature #2: 'AGE'
| nPatients | Mean (Std.Dev) | |
|---|---|---|
| ALL | 107 | 67.0 (11.0) |
| subtype1 | 32 | 67.6 (10.1) |
| subtype2 | 37 | 68.6 (10.1) |
| subtype3 | 38 | 64.8 (12.5) |
Figure S9. Get High-res Image Clustering Approach #2: 'METHLYATION CNMF' versus Clinical Feature #2: 'AGE'
P value = 0.107 (Fisher's exact test)
Table S12. Clustering Approach #2: 'METHLYATION CNMF' versus Clinical Feature #3: 'GENDER'
| nPatients | FEMALE | MALE |
|---|---|---|
| ALL | 30 | 78 |
| subtype1 | 12 | 21 |
| subtype2 | 12 | 25 |
| subtype3 | 6 | 32 |
Figure S10. Get High-res Image Clustering Approach #2: 'METHLYATION CNMF' versus Clinical Feature #3: 'GENDER'
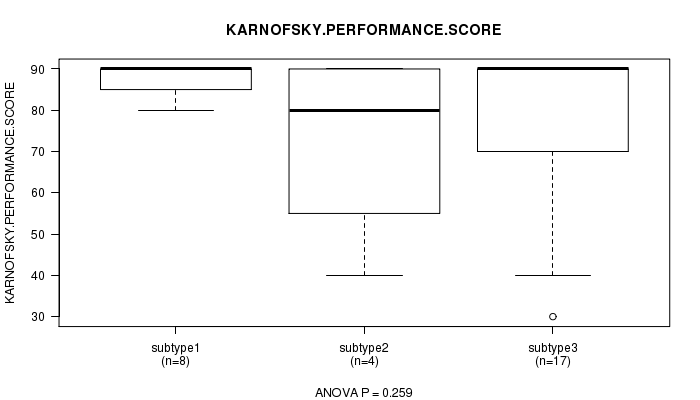
P value = 0.259 (ANOVA)
Table S13. Clustering Approach #2: 'METHLYATION CNMF' versus Clinical Feature #4: 'KARNOFSKY.PERFORMANCE.SCORE'
| nPatients | Mean (Std.Dev) | |
|---|---|---|
| ALL | 29 | 79.3 (17.1) |
| subtype1 | 8 | 87.5 (4.6) |
| subtype2 | 4 | 72.5 (23.6) |
| subtype3 | 17 | 77.1 (18.6) |
Figure S11. Get High-res Image Clustering Approach #2: 'METHLYATION CNMF' versus Clinical Feature #4: 'KARNOFSKY.PERFORMANCE.SCORE'
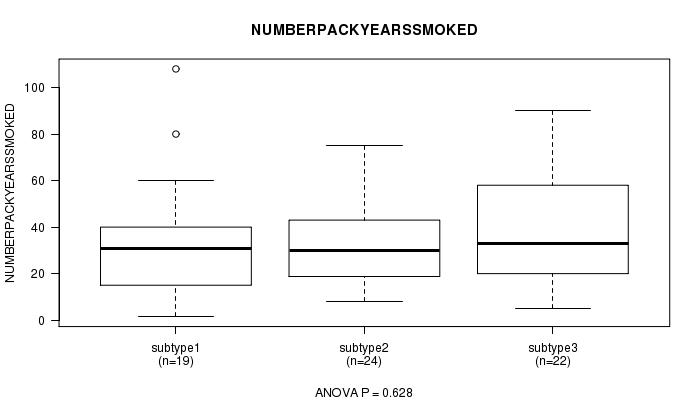
P value = 0.628 (ANOVA)
Table S14. Clustering Approach #2: 'METHLYATION CNMF' versus Clinical Feature #5: 'NUMBERPACKYEARSSMOKED'
| nPatients | Mean (Std.Dev) | |
|---|---|---|
| ALL | 65 | 35.7 (22.9) |
| subtype1 | 19 | 34.0 (26.3) |
| subtype2 | 24 | 33.5 (18.6) |
| subtype3 | 22 | 39.6 (24.4) |
Figure S12. Get High-res Image Clustering Approach #2: 'METHLYATION CNMF' versus Clinical Feature #5: 'NUMBERPACKYEARSSMOKED'
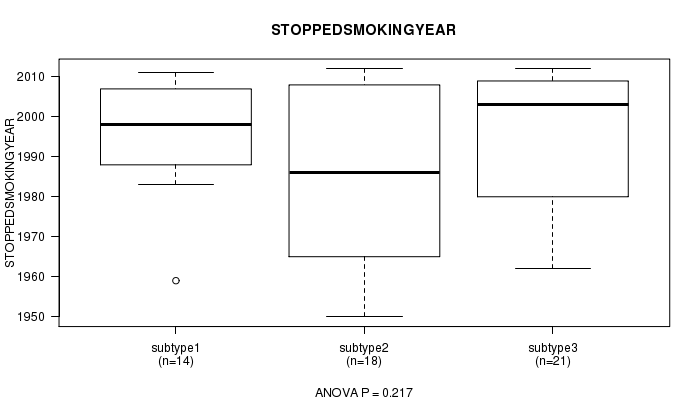
P value = 0.217 (ANOVA)
Table S15. Clustering Approach #2: 'METHLYATION CNMF' versus Clinical Feature #6: 'STOPPEDSMOKINGYEAR'
| nPatients | Mean (Std.Dev) | |
|---|---|---|
| ALL | 53 | 1992.1 (18.0) |
| subtype1 | 14 | 1995.6 (13.9) |
| subtype2 | 18 | 1986.1 (20.8) |
| subtype3 | 21 | 1994.9 (17.3) |
Figure S13. Get High-res Image Clustering Approach #2: 'METHLYATION CNMF' versus Clinical Feature #6: 'STOPPEDSMOKINGYEAR'
P value = 0.605 (ANOVA)
Table S16. Clustering Approach #2: 'METHLYATION CNMF' versus Clinical Feature #7: 'TOBACCOSMOKINGHISTORYINDICATOR'
| nPatients | Mean (Std.Dev) | |
|---|---|---|
| ALL | 102 | 2.6 (1.2) |
| subtype1 | 30 | 2.6 (1.2) |
| subtype2 | 34 | 2.5 (1.0) |
| subtype3 | 38 | 2.8 (1.3) |
Figure S14. Get High-res Image Clustering Approach #2: 'METHLYATION CNMF' versus Clinical Feature #7: 'TOBACCOSMOKINGHISTORYINDICATOR'
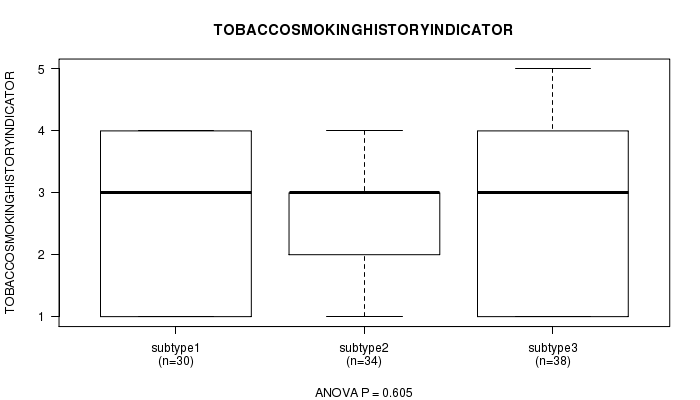
Table S17. Get Full Table Description of clustering approach #3: 'RPPA CNMF subtypes'
| Cluster Labels | 1 | 2 | 3 | 4 |
|---|---|---|---|---|
| Number of samples | 12 | 10 | 14 | 17 |
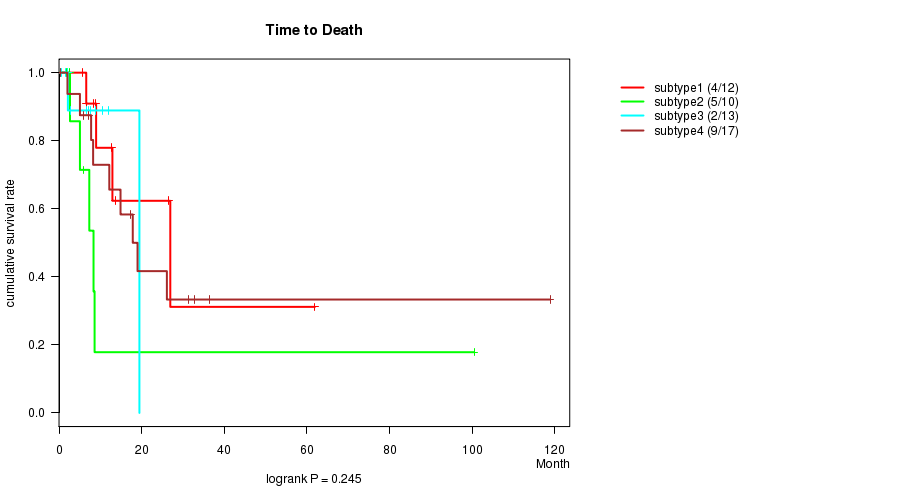
P value = 0.245 (logrank test)
Table S18. Clustering Approach #3: 'RPPA CNMF subtypes' versus Clinical Feature #1: 'Time to Death'
| nPatients | nDeath | Duration Range (Median), Month | |
|---|---|---|---|
| ALL | 52 | 20 | 0.4 - 118.9 (8.3) |
| subtype1 | 12 | 4 | 5.7 - 61.9 (10.9) |
| subtype2 | 10 | 5 | 1.8 - 100.5 (5.5) |
| subtype3 | 13 | 2 | 0.5 - 19.5 (6.6) |
| subtype4 | 17 | 9 | 0.4 - 118.9 (14.9) |
Figure S15. Get High-res Image Clustering Approach #3: 'RPPA CNMF subtypes' versus Clinical Feature #1: 'Time to Death'
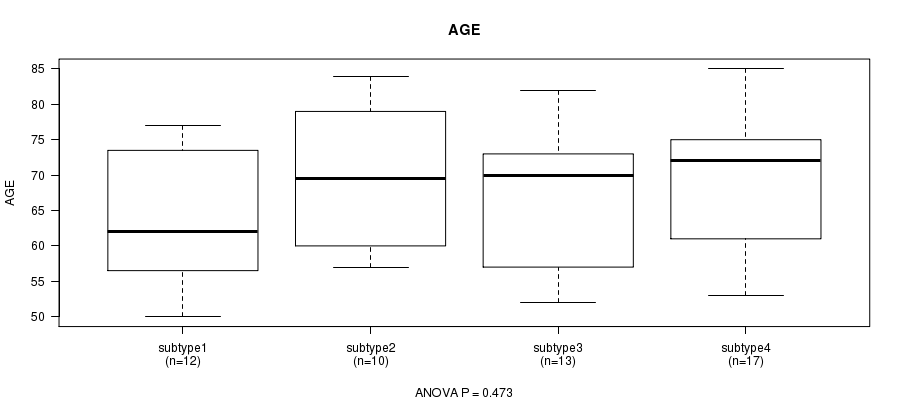
P value = 0.473 (ANOVA)
Table S19. Clustering Approach #3: 'RPPA CNMF subtypes' versus Clinical Feature #2: 'AGE'
| nPatients | Mean (Std.Dev) | |
|---|---|---|
| ALL | 52 | 67.3 (9.8) |
| subtype1 | 12 | 63.9 (9.2) |
| subtype2 | 10 | 69.5 (9.3) |
| subtype3 | 13 | 66.5 (10.2) |
| subtype4 | 17 | 69.1 (10.3) |
Figure S16. Get High-res Image Clustering Approach #3: 'RPPA CNMF subtypes' versus Clinical Feature #2: 'AGE'
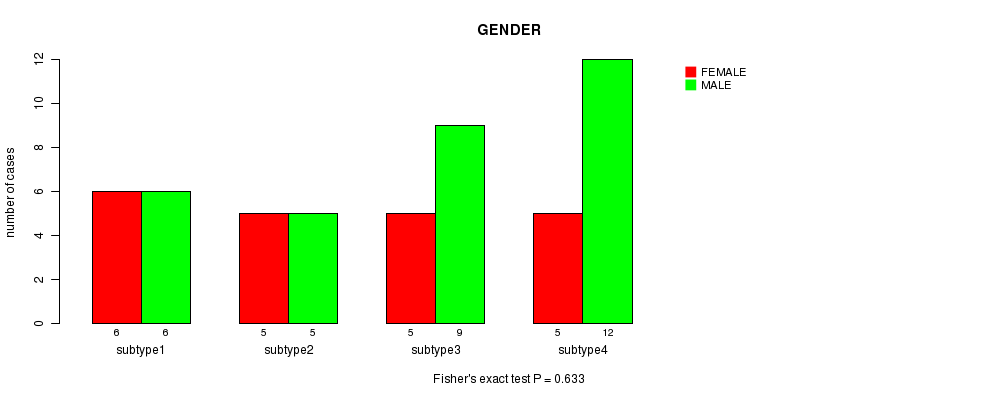
P value = 0.633 (Fisher's exact test)
Table S20. Clustering Approach #3: 'RPPA CNMF subtypes' versus Clinical Feature #3: 'GENDER'
| nPatients | FEMALE | MALE |
|---|---|---|
| ALL | 21 | 32 |
| subtype1 | 6 | 6 |
| subtype2 | 5 | 5 |
| subtype3 | 5 | 9 |
| subtype4 | 5 | 12 |
Figure S17. Get High-res Image Clustering Approach #3: 'RPPA CNMF subtypes' versus Clinical Feature #3: 'GENDER'
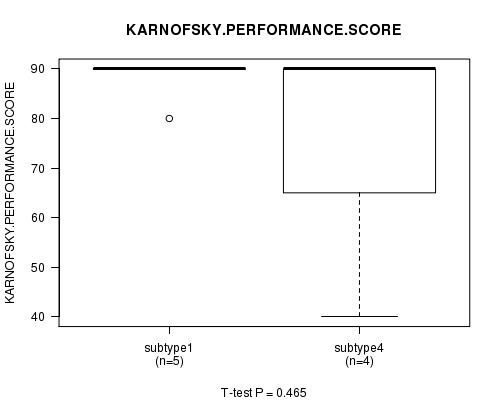
P value = 0.465 (ANOVA)
Table S21. Clustering Approach #3: 'RPPA CNMF subtypes' versus Clinical Feature #4: 'KARNOFSKY.PERFORMANCE.SCORE'
| nPatients | Mean (Std.Dev) | |
|---|---|---|
| ALL | 11 | 80.0 (16.7) |
| subtype1 | 5 | 88.0 (4.5) |
| subtype2 | 1 | 70.0 (NA) |
| subtype3 | 1 | 60.0 (NA) |
| subtype4 | 4 | 77.5 (25.0) |
Figure S18. Get High-res Image Clustering Approach #3: 'RPPA CNMF subtypes' versus Clinical Feature #4: 'KARNOFSKY.PERFORMANCE.SCORE'
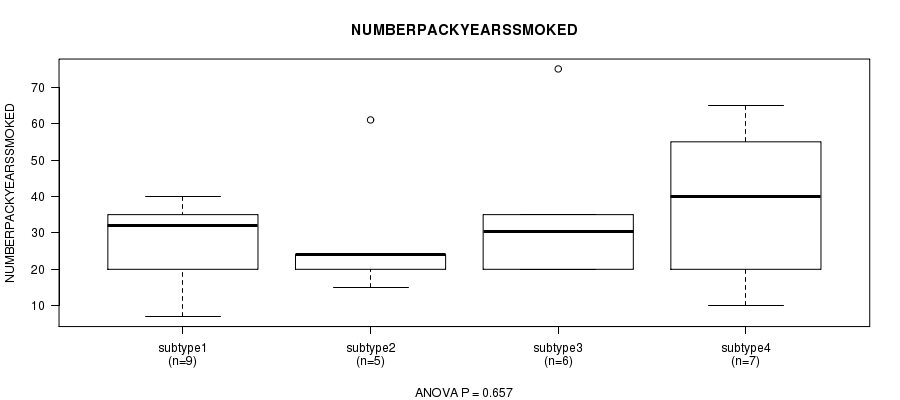
P value = 0.657 (ANOVA)
Table S22. Clustering Approach #3: 'RPPA CNMF subtypes' versus Clinical Feature #5: 'NUMBERPACKYEARSSMOKED'
| nPatients | Mean (Std.Dev) | |
|---|---|---|
| ALL | 27 | 32.1 (17.5) |
| subtype1 | 9 | 27.6 (12.4) |
| subtype2 | 5 | 28.8 (18.4) |
| subtype3 | 6 | 35.2 (20.4) |
| subtype4 | 7 | 37.9 (21.6) |
Figure S19. Get High-res Image Clustering Approach #3: 'RPPA CNMF subtypes' versus Clinical Feature #5: 'NUMBERPACKYEARSSMOKED'
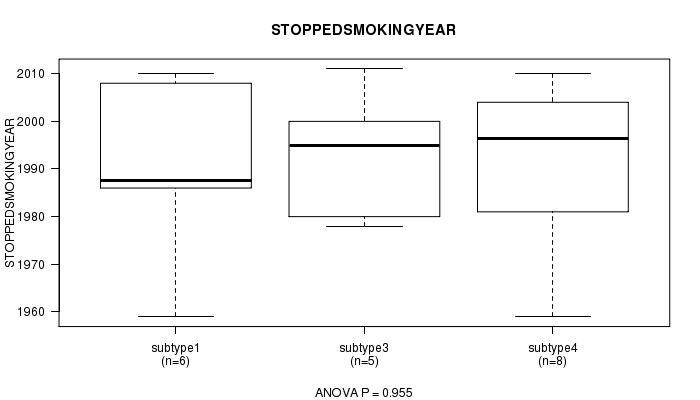
P value = 0.955 (ANOVA)
Table S23. Clustering Approach #3: 'RPPA CNMF subtypes' versus Clinical Feature #6: 'STOPPEDSMOKINGYEAR'
| nPatients | Mean (Std.Dev) | |
|---|---|---|
| ALL | 21 | 1990.1 (16.1) |
| subtype1 | 6 | 1989.7 (18.5) |
| subtype2 | 2 | 1979.0 (11.3) |
| subtype3 | 5 | 1992.8 (13.9) |
| subtype4 | 8 | 1991.5 (17.9) |
Figure S20. Get High-res Image Clustering Approach #3: 'RPPA CNMF subtypes' versus Clinical Feature #6: 'STOPPEDSMOKINGYEAR'
P value = 0.258 (ANOVA)
Table S24. Clustering Approach #3: 'RPPA CNMF subtypes' versus Clinical Feature #7: 'TOBACCOSMOKINGHISTORYINDICATOR'
| nPatients | Mean (Std.Dev) | |
|---|---|---|
| ALL | 48 | 2.3 (1.1) |
| subtype1 | 12 | 2.6 (0.9) |
| subtype2 | 8 | 1.9 (0.8) |
| subtype3 | 14 | 2.1 (1.1) |
| subtype4 | 14 | 2.6 (1.2) |
Figure S21. Get High-res Image Clustering Approach #3: 'RPPA CNMF subtypes' versus Clinical Feature #7: 'TOBACCOSMOKINGHISTORYINDICATOR'
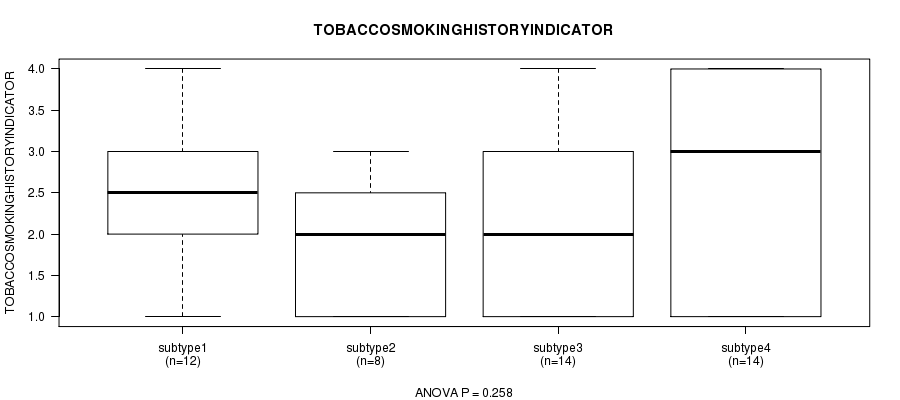
Table S25. Get Full Table Description of clustering approach #4: 'RPPA cHierClus subtypes'
| Cluster Labels | 1 | 2 | 3 |
|---|---|---|---|
| Number of samples | 14 | 17 | 22 |
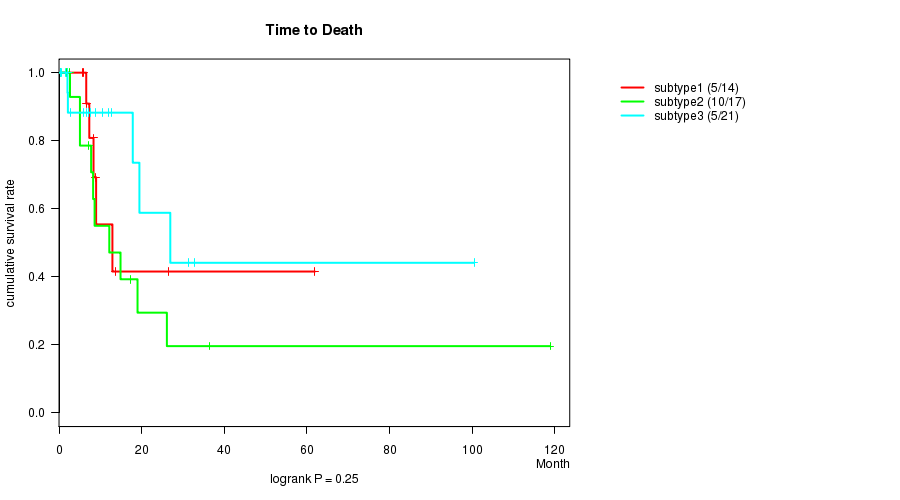
P value = 0.25 (logrank test)
Table S26. Clustering Approach #4: 'RPPA cHierClus subtypes' versus Clinical Feature #1: 'Time to Death'
| nPatients | nDeath | Duration Range (Median), Month | |
|---|---|---|---|
| ALL | 52 | 20 | 0.4 - 118.9 (8.3) |
| subtype1 | 14 | 5 | 1.9 - 61.9 (8.3) |
| subtype2 | 17 | 10 | 0.4 - 118.9 (8.2) |
| subtype3 | 21 | 5 | 0.5 - 100.5 (7.7) |
Figure S22. Get High-res Image Clustering Approach #4: 'RPPA cHierClus subtypes' versus Clinical Feature #1: 'Time to Death'
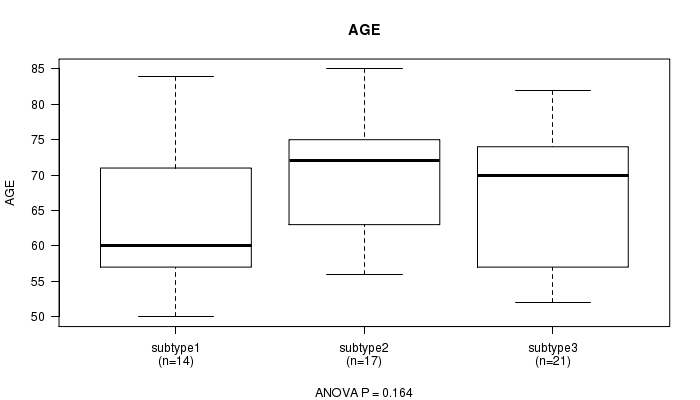
P value = 0.164 (ANOVA)
Table S27. Clustering Approach #4: 'RPPA cHierClus subtypes' versus Clinical Feature #2: 'AGE'
| nPatients | Mean (Std.Dev) | |
|---|---|---|
| ALL | 52 | 67.3 (9.8) |
| subtype1 | 14 | 63.5 (9.6) |
| subtype2 | 17 | 70.2 (9.0) |
| subtype3 | 21 | 67.5 (10.2) |
Figure S23. Get High-res Image Clustering Approach #4: 'RPPA cHierClus subtypes' versus Clinical Feature #2: 'AGE'
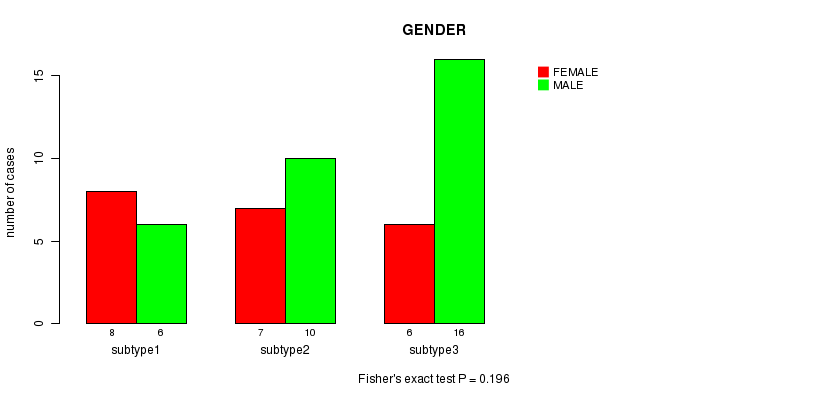
P value = 0.196 (Fisher's exact test)
Table S28. Clustering Approach #4: 'RPPA cHierClus subtypes' versus Clinical Feature #3: 'GENDER'
| nPatients | FEMALE | MALE |
|---|---|---|
| ALL | 21 | 32 |
| subtype1 | 8 | 6 |
| subtype2 | 7 | 10 |
| subtype3 | 6 | 16 |
Figure S24. Get High-res Image Clustering Approach #4: 'RPPA cHierClus subtypes' versus Clinical Feature #3: 'GENDER'
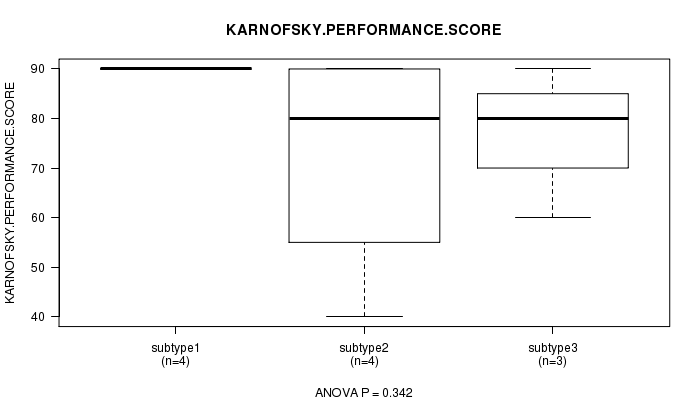
P value = 0.342 (ANOVA)
Table S29. Clustering Approach #4: 'RPPA cHierClus subtypes' versus Clinical Feature #4: 'KARNOFSKY.PERFORMANCE.SCORE'
| nPatients | Mean (Std.Dev) | |
|---|---|---|
| ALL | 11 | 80.0 (16.7) |
| subtype1 | 4 | 90.0 (0.0) |
| subtype2 | 4 | 72.5 (23.6) |
| subtype3 | 3 | 76.7 (15.3) |
Figure S25. Get High-res Image Clustering Approach #4: 'RPPA cHierClus subtypes' versus Clinical Feature #4: 'KARNOFSKY.PERFORMANCE.SCORE'
P value = 0.677 (ANOVA)
Table S30. Clustering Approach #4: 'RPPA cHierClus subtypes' versus Clinical Feature #5: 'NUMBERPACKYEARSSMOKED'
| nPatients | Mean (Std.Dev) | |
|---|---|---|
| ALL | 27 | 32.1 (17.5) |
| subtype1 | 9 | 30.4 (15.6) |
| subtype2 | 8 | 29.1 (18.5) |
| subtype3 | 10 | 36.1 (19.4) |
Figure S26. Get High-res Image Clustering Approach #4: 'RPPA cHierClus subtypes' versus Clinical Feature #5: 'NUMBERPACKYEARSSMOKED'
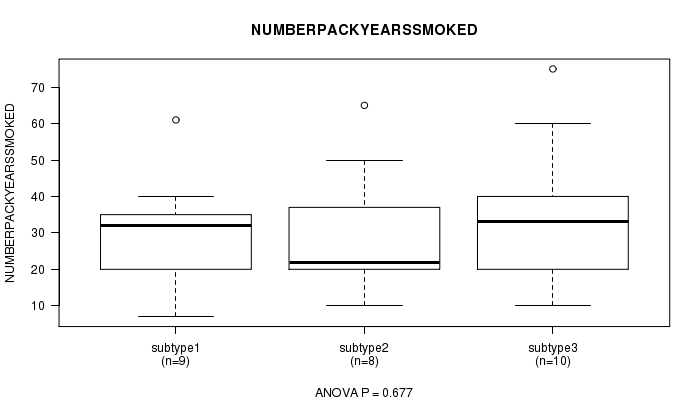
P value = 0.56 (ANOVA)
Table S31. Clustering Approach #4: 'RPPA cHierClus subtypes' versus Clinical Feature #6: 'STOPPEDSMOKINGYEAR'
| nPatients | Mean (Std.Dev) | |
|---|---|---|
| ALL | 21 | 1990.1 (16.1) |
| subtype1 | 4 | 1997.8 (13.0) |
| subtype2 | 9 | 1987.0 (16.8) |
| subtype3 | 8 | 1989.8 (17.2) |
Figure S27. Get High-res Image Clustering Approach #4: 'RPPA cHierClus subtypes' versus Clinical Feature #6: 'STOPPEDSMOKINGYEAR'
P value = 0.412 (ANOVA)
Table S32. Clustering Approach #4: 'RPPA cHierClus subtypes' versus Clinical Feature #7: 'TOBACCOSMOKINGHISTORYINDICATOR'
| nPatients | Mean (Std.Dev) | |
|---|---|---|
| ALL | 48 | 2.3 (1.1) |
| subtype1 | 13 | 2.3 (0.9) |
| subtype2 | 14 | 2.6 (1.1) |
| subtype3 | 21 | 2.1 (1.2) |
Figure S28. Get High-res Image Clustering Approach #4: 'RPPA cHierClus subtypes' versus Clinical Feature #7: 'TOBACCOSMOKINGHISTORYINDICATOR'
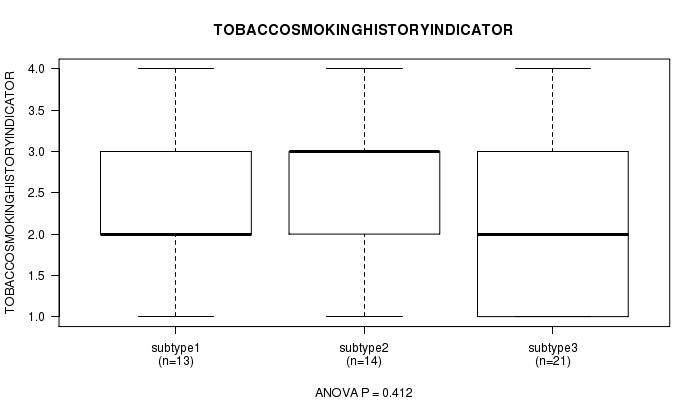
Table S33. Get Full Table Description of clustering approach #5: 'RNAseq CNMF subtypes'
| Cluster Labels | 1 | 2 | 3 | 4 |
|---|---|---|---|---|
| Number of samples | 36 | 17 | 25 | 10 |
P value = 0.636 (logrank test)
Table S34. Clustering Approach #5: 'RNAseq CNMF subtypes' versus Clinical Feature #1: 'Time to Death'
| nPatients | nDeath | Duration Range (Median), Month | |
|---|---|---|---|
| ALL | 83 | 25 | 0.4 - 118.9 (7.2) |
| subtype1 | 32 | 9 | 0.5 - 100.5 (7.1) |
| subtype2 | 17 | 8 | 4.1 - 118.9 (6.7) |
| subtype3 | 25 | 6 | 0.4 - 75.3 (8.2) |
| subtype4 | 9 | 2 | 1.8 - 11.1 (5.1) |
Figure S29. Get High-res Image Clustering Approach #5: 'RNAseq CNMF subtypes' versus Clinical Feature #1: 'Time to Death'
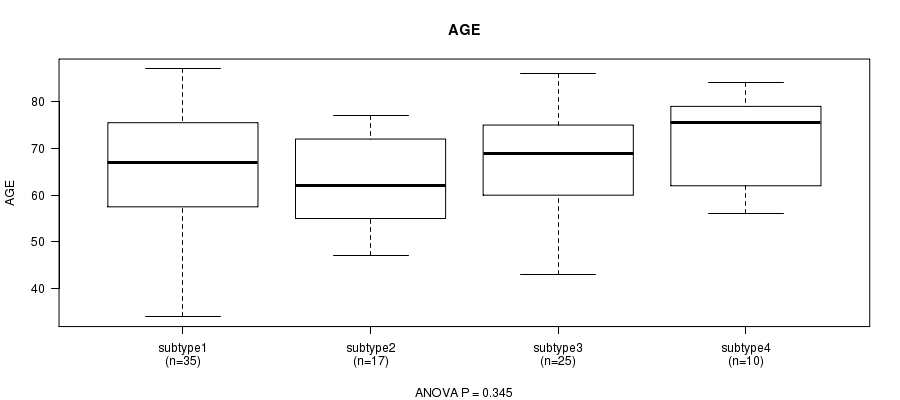
P value = 0.345 (ANOVA)
Table S35. Clustering Approach #5: 'RNAseq CNMF subtypes' versus Clinical Feature #2: 'AGE'
| nPatients | Mean (Std.Dev) | |
|---|---|---|
| ALL | 87 | 66.6 (11.6) |
| subtype1 | 35 | 66.6 (12.4) |
| subtype2 | 17 | 63.2 (9.8) |
| subtype3 | 25 | 66.9 (12.1) |
| subtype4 | 10 | 71.6 (9.9) |
Figure S30. Get High-res Image Clustering Approach #5: 'RNAseq CNMF subtypes' versus Clinical Feature #2: 'AGE'
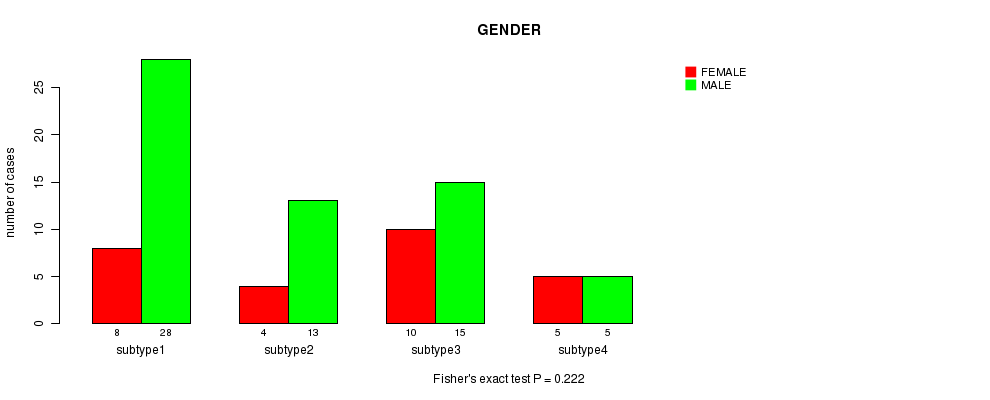
P value = 0.222 (Fisher's exact test)
Table S36. Clustering Approach #5: 'RNAseq CNMF subtypes' versus Clinical Feature #3: 'GENDER'
| nPatients | FEMALE | MALE |
|---|---|---|
| ALL | 27 | 61 |
| subtype1 | 8 | 28 |
| subtype2 | 4 | 13 |
| subtype3 | 10 | 15 |
| subtype4 | 5 | 5 |
Figure S31. Get High-res Image Clustering Approach #5: 'RNAseq CNMF subtypes' versus Clinical Feature #3: 'GENDER'
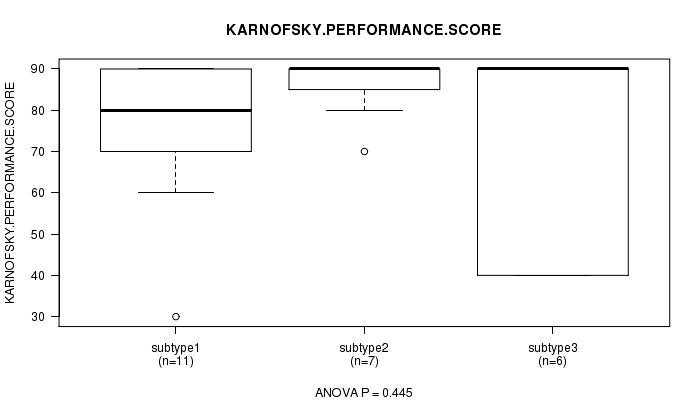
P value = 0.445 (ANOVA)
Table S37. Clustering Approach #5: 'RNAseq CNMF subtypes' versus Clinical Feature #4: 'KARNOFSKY.PERFORMANCE.SCORE'
| nPatients | Mean (Std.Dev) | |
|---|---|---|
| ALL | 25 | 78.0 (18.0) |
| subtype1 | 11 | 76.4 (18.6) |
| subtype2 | 7 | 85.7 (7.9) |
| subtype3 | 6 | 73.3 (25.8) |
| subtype4 | 1 | 70.0 (NA) |
Figure S32. Get High-res Image Clustering Approach #5: 'RNAseq CNMF subtypes' versus Clinical Feature #4: 'KARNOFSKY.PERFORMANCE.SCORE'
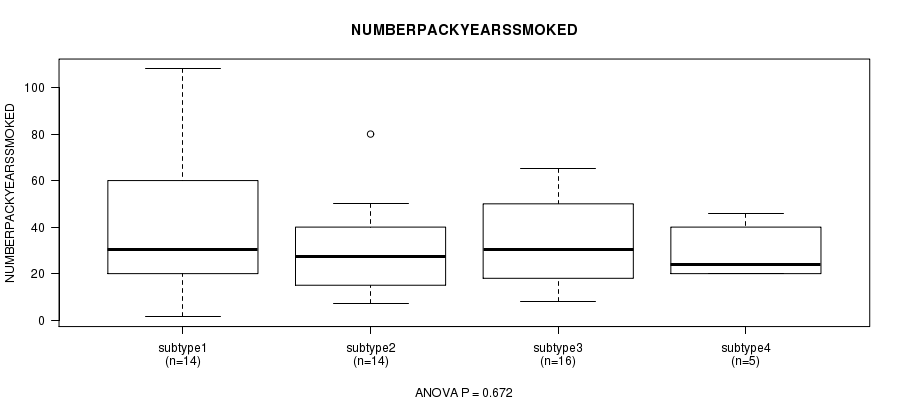
P value = 0.672 (ANOVA)
Table S38. Clustering Approach #5: 'RNAseq CNMF subtypes' versus Clinical Feature #5: 'NUMBERPACKYEARSSMOKED'
| nPatients | Mean (Std.Dev) | |
|---|---|---|
| ALL | 49 | 34.4 (23.2) |
| subtype1 | 14 | 40.8 (32.1) |
| subtype2 | 14 | 31.0 (20.1) |
| subtype3 | 16 | 33.2 (19.5) |
| subtype4 | 5 | 30.0 (12.2) |
Figure S33. Get High-res Image Clustering Approach #5: 'RNAseq CNMF subtypes' versus Clinical Feature #5: 'NUMBERPACKYEARSSMOKED'
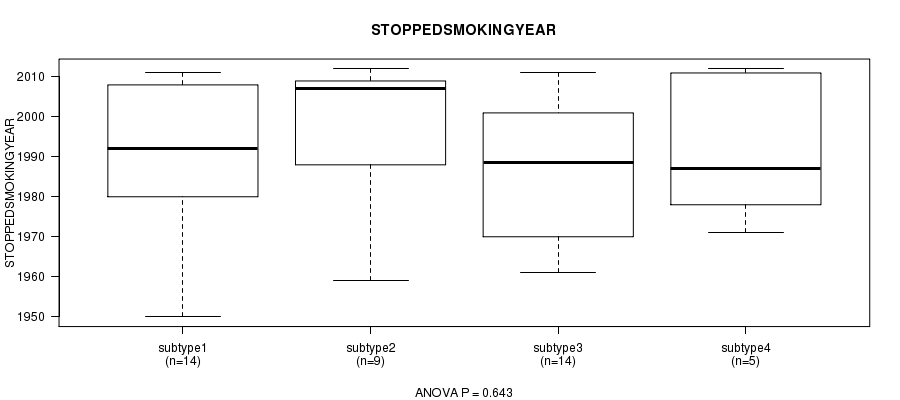
P value = 0.643 (ANOVA)
Table S39. Clustering Approach #5: 'RNAseq CNMF subtypes' versus Clinical Feature #6: 'STOPPEDSMOKINGYEAR'
| nPatients | Mean (Std.Dev) | |
|---|---|---|
| ALL | 42 | 1990.6 (18.5) |
| subtype1 | 14 | 1988.9 (20.8) |
| subtype2 | 9 | 1997.4 (17.3) |
| subtype3 | 14 | 1987.6 (17.6) |
| subtype4 | 5 | 1991.8 (18.9) |
Figure S34. Get High-res Image Clustering Approach #5: 'RNAseq CNMF subtypes' versus Clinical Feature #6: 'STOPPEDSMOKINGYEAR'
P value = 0.0439 (ANOVA)
Table S40. Clustering Approach #5: 'RNAseq CNMF subtypes' versus Clinical Feature #7: 'TOBACCOSMOKINGHISTORYINDICATOR'
| nPatients | Mean (Std.Dev) | |
|---|---|---|
| ALL | 82 | 2.5 (1.1) |
| subtype1 | 33 | 2.2 (1.2) |
| subtype2 | 15 | 3.1 (0.8) |
| subtype3 | 24 | 2.7 (1.0) |
| subtype4 | 10 | 2.1 (1.1) |
Figure S35. Get High-res Image Clustering Approach #5: 'RNAseq CNMF subtypes' versus Clinical Feature #7: 'TOBACCOSMOKINGHISTORYINDICATOR'
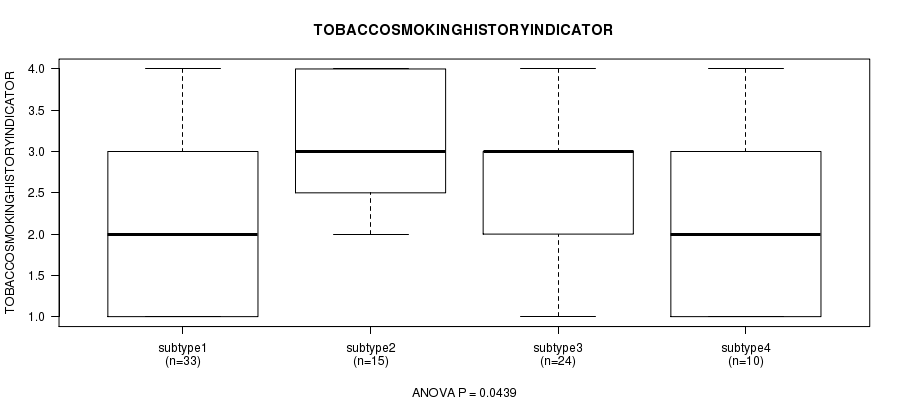
Table S41. Get Full Table Description of clustering approach #6: 'RNAseq cHierClus subtypes'
| Cluster Labels | 1 | 2 | 3 |
|---|---|---|---|
| Number of samples | 25 | 43 | 20 |
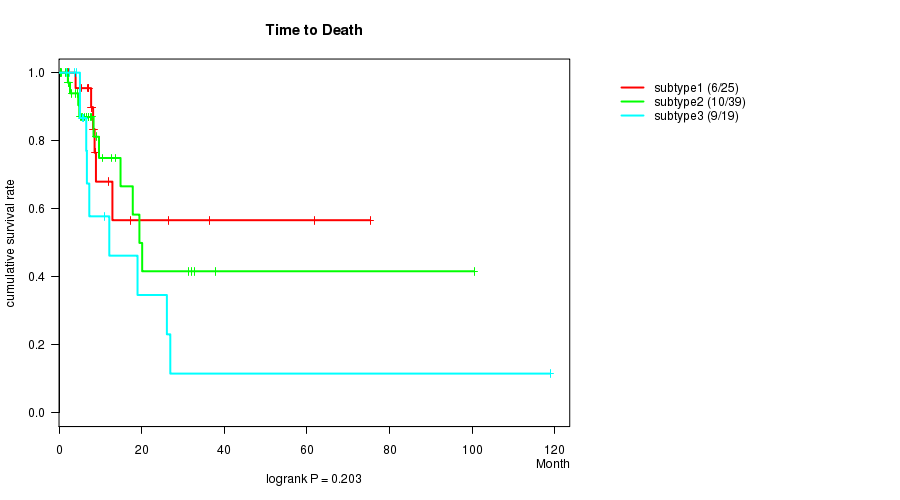
P value = 0.203 (logrank test)
Table S42. Clustering Approach #6: 'RNAseq cHierClus subtypes' versus Clinical Feature #1: 'Time to Death'
| nPatients | nDeath | Duration Range (Median), Month | |
|---|---|---|---|
| ALL | 83 | 25 | 0.4 - 118.9 (7.2) |
| subtype1 | 25 | 6 | 0.4 - 75.3 (8.3) |
| subtype2 | 39 | 10 | 0.5 - 100.5 (6.7) |
| subtype3 | 19 | 9 | 1.8 - 118.9 (5.9) |
Figure S36. Get High-res Image Clustering Approach #6: 'RNAseq cHierClus subtypes' versus Clinical Feature #1: 'Time to Death'
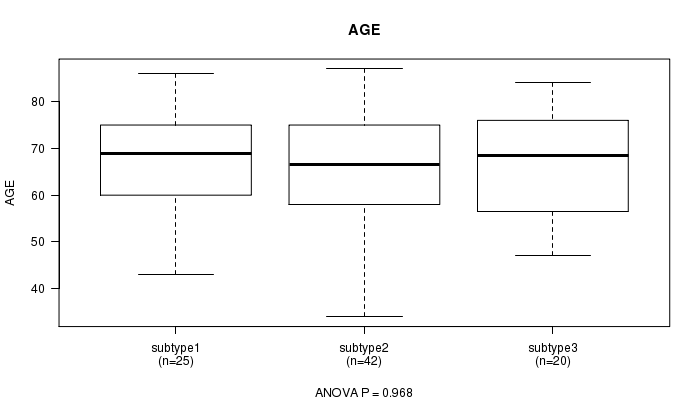
P value = 0.968 (ANOVA)
Table S43. Clustering Approach #6: 'RNAseq cHierClus subtypes' versus Clinical Feature #2: 'AGE'
| nPatients | Mean (Std.Dev) | |
|---|---|---|
| ALL | 87 | 66.6 (11.6) |
| subtype1 | 25 | 67.0 (12.0) |
| subtype2 | 42 | 66.3 (11.9) |
| subtype3 | 20 | 66.8 (11.0) |
Figure S37. Get High-res Image Clustering Approach #6: 'RNAseq cHierClus subtypes' versus Clinical Feature #2: 'AGE'
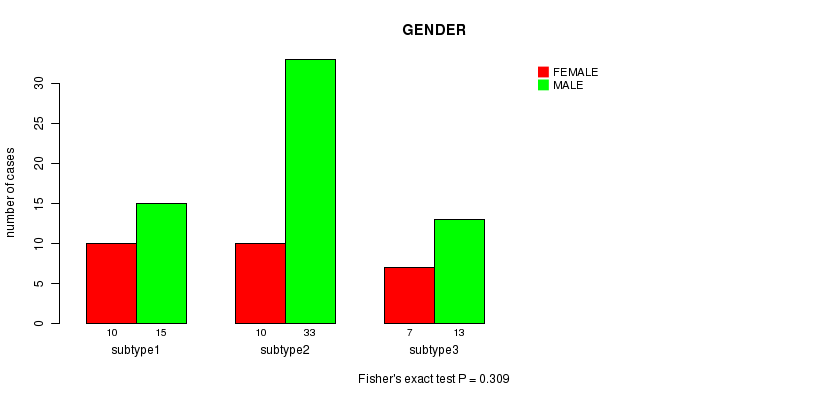
P value = 0.309 (Fisher's exact test)
Table S44. Clustering Approach #6: 'RNAseq cHierClus subtypes' versus Clinical Feature #3: 'GENDER'
| nPatients | FEMALE | MALE |
|---|---|---|
| ALL | 27 | 61 |
| subtype1 | 10 | 15 |
| subtype2 | 10 | 33 |
| subtype3 | 7 | 13 |
Figure S38. Get High-res Image Clustering Approach #6: 'RNAseq cHierClus subtypes' versus Clinical Feature #3: 'GENDER'
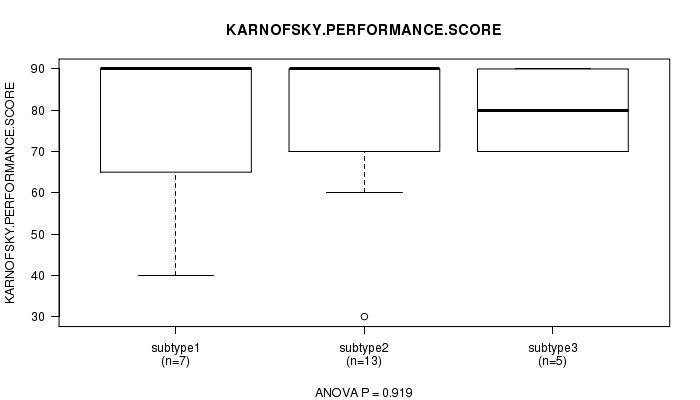
P value = 0.919 (ANOVA)
Table S45. Clustering Approach #6: 'RNAseq cHierClus subtypes' versus Clinical Feature #4: 'KARNOFSKY.PERFORMANCE.SCORE'
| nPatients | Mean (Std.Dev) | |
|---|---|---|
| ALL | 25 | 78.0 (18.0) |
| subtype1 | 7 | 75.7 (24.4) |
| subtype2 | 13 | 78.5 (17.7) |
| subtype3 | 5 | 80.0 (10.0) |
Figure S39. Get High-res Image Clustering Approach #6: 'RNAseq cHierClus subtypes' versus Clinical Feature #4: 'KARNOFSKY.PERFORMANCE.SCORE'
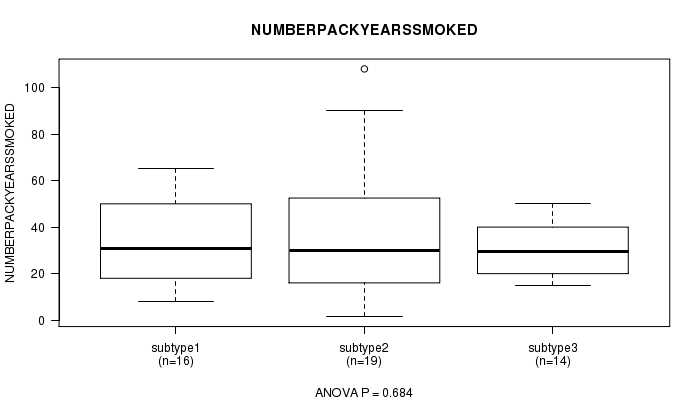
P value = 0.684 (ANOVA)
Table S46. Clustering Approach #6: 'RNAseq cHierClus subtypes' versus Clinical Feature #5: 'NUMBERPACKYEARSSMOKED'
| nPatients | Mean (Std.Dev) | |
|---|---|---|
| ALL | 49 | 34.4 (23.2) |
| subtype1 | 16 | 33.5 (19.5) |
| subtype2 | 19 | 37.9 (31.1) |
| subtype3 | 14 | 30.8 (13.2) |
Figure S40. Get High-res Image Clustering Approach #6: 'RNAseq cHierClus subtypes' versus Clinical Feature #5: 'NUMBERPACKYEARSSMOKED'
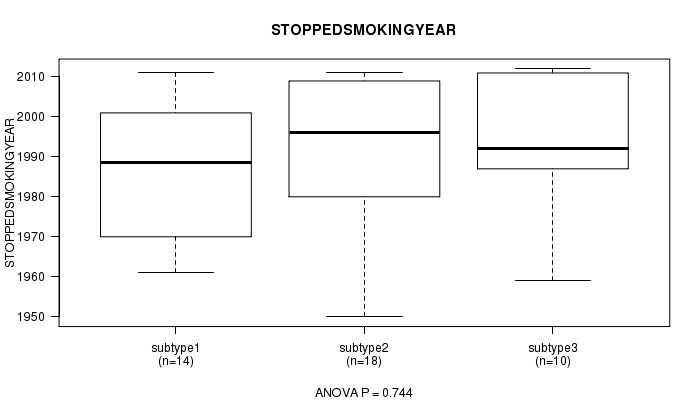
P value = 0.744 (ANOVA)
Table S47. Clustering Approach #6: 'RNAseq cHierClus subtypes' versus Clinical Feature #6: 'STOPPEDSMOKINGYEAR'
| nPatients | Mean (Std.Dev) | |
|---|---|---|
| ALL | 42 | 1990.6 (18.5) |
| subtype1 | 14 | 1987.6 (17.6) |
| subtype2 | 18 | 1991.6 (20.0) |
| subtype3 | 10 | 1993.2 (18.4) |
Figure S41. Get High-res Image Clustering Approach #6: 'RNAseq cHierClus subtypes' versus Clinical Feature #6: 'STOPPEDSMOKINGYEAR'
P value = 0.47 (ANOVA)
Table S48. Clustering Approach #6: 'RNAseq cHierClus subtypes' versus Clinical Feature #7: 'TOBACCOSMOKINGHISTORYINDICATOR'
| nPatients | Mean (Std.Dev) | |
|---|---|---|
| ALL | 82 | 2.5 (1.1) |
| subtype1 | 24 | 2.7 (1.0) |
| subtype2 | 40 | 2.4 (1.2) |
| subtype3 | 18 | 2.6 (1.0) |
Figure S42. Get High-res Image Clustering Approach #6: 'RNAseq cHierClus subtypes' versus Clinical Feature #7: 'TOBACCOSMOKINGHISTORYINDICATOR'
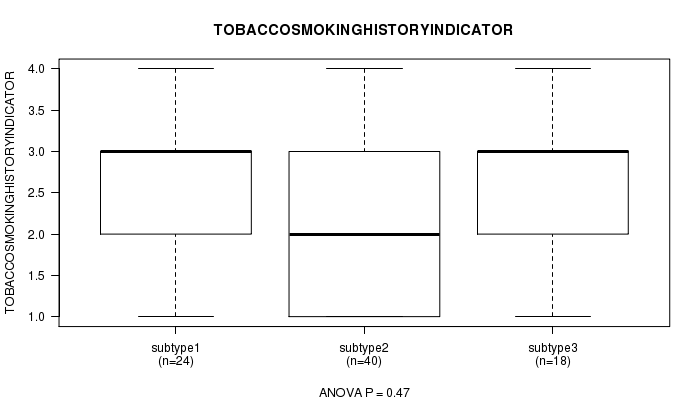
Table S49. Get Full Table Description of clustering approach #7: 'MIRseq CNMF subtypes'
| Cluster Labels | 1 | 2 | 3 |
|---|---|---|---|
| Number of samples | 24 | 52 | 27 |
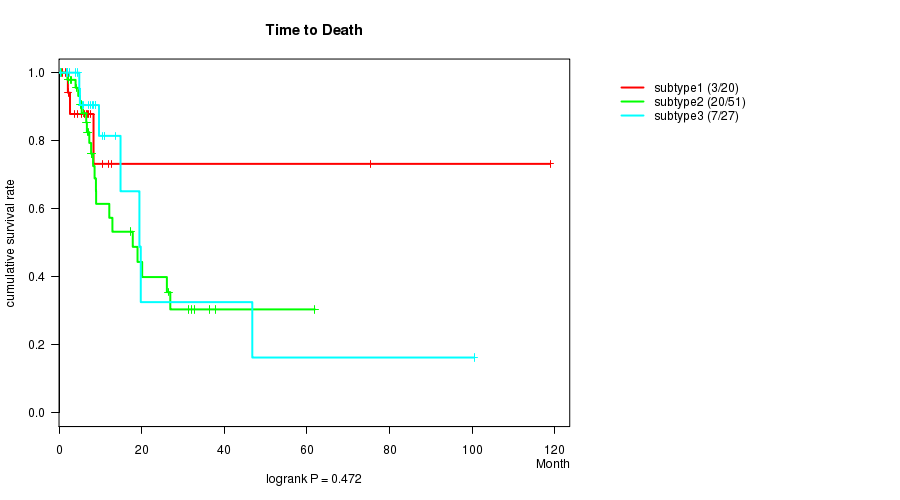
P value = 0.472 (logrank test)
Table S50. Clustering Approach #7: 'MIRseq CNMF subtypes' versus Clinical Feature #1: 'Time to Death'
| nPatients | nDeath | Duration Range (Median), Month | |
|---|---|---|---|
| ALL | 98 | 30 | 0.4 - 118.9 (7.3) |
| subtype1 | 20 | 3 | 0.8 - 118.9 (6.4) |
| subtype2 | 51 | 20 | 0.4 - 61.9 (7.3) |
| subtype3 | 27 | 7 | 0.5 - 100.5 (8.3) |
Figure S43. Get High-res Image Clustering Approach #7: 'MIRseq CNMF subtypes' versus Clinical Feature #1: 'Time to Death'
P value = 0.548 (ANOVA)
Table S51. Clustering Approach #7: 'MIRseq CNMF subtypes' versus Clinical Feature #2: 'AGE'
| nPatients | Mean (Std.Dev) | |
|---|---|---|
| ALL | 102 | 67.1 (11.0) |
| subtype1 | 23 | 68.4 (12.1) |
| subtype2 | 52 | 66.0 (10.9) |
| subtype3 | 27 | 68.3 (10.1) |
Figure S44. Get High-res Image Clustering Approach #7: 'MIRseq CNMF subtypes' versus Clinical Feature #2: 'AGE'

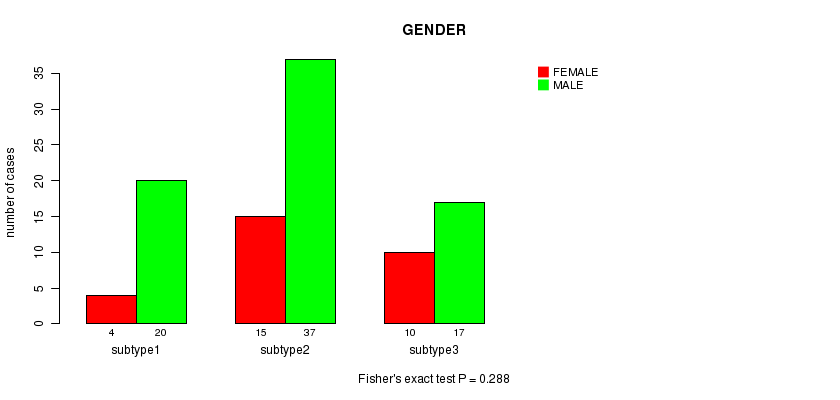
P value = 0.288 (Fisher's exact test)
Table S52. Clustering Approach #7: 'MIRseq CNMF subtypes' versus Clinical Feature #3: 'GENDER'
| nPatients | FEMALE | MALE |
|---|---|---|
| ALL | 29 | 74 |
| subtype1 | 4 | 20 |
| subtype2 | 15 | 37 |
| subtype3 | 10 | 17 |
Figure S45. Get High-res Image Clustering Approach #7: 'MIRseq CNMF subtypes' versus Clinical Feature #3: 'GENDER'
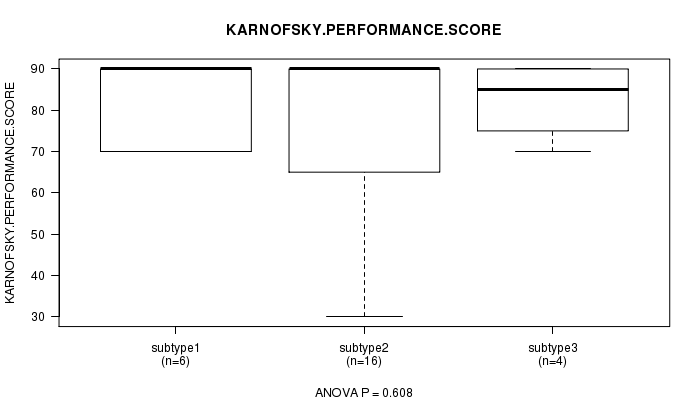
P value = 0.608 (ANOVA)
Table S53. Clustering Approach #7: 'MIRseq CNMF subtypes' versus Clinical Feature #4: 'KARNOFSKY.PERFORMANCE.SCORE'
| nPatients | Mean (Std.Dev) | |
|---|---|---|
| ALL | 26 | 78.5 (17.8) |
| subtype1 | 6 | 83.3 (10.3) |
| subtype2 | 16 | 75.6 (21.3) |
| subtype3 | 4 | 82.5 (9.6) |
Figure S46. Get High-res Image Clustering Approach #7: 'MIRseq CNMF subtypes' versus Clinical Feature #4: 'KARNOFSKY.PERFORMANCE.SCORE'
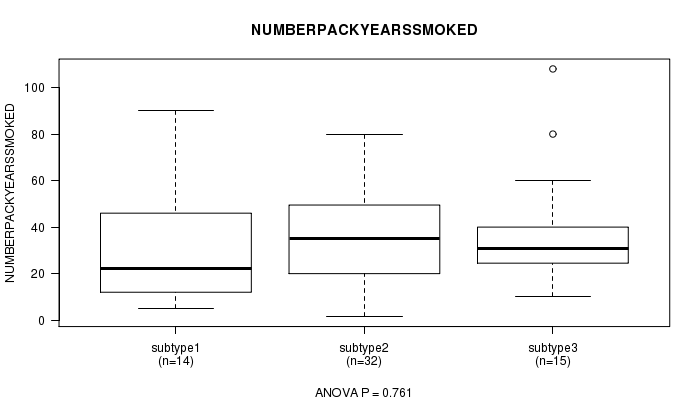
P value = 0.761 (ANOVA)
Table S54. Clustering Approach #7: 'MIRseq CNMF subtypes' versus Clinical Feature #5: 'NUMBERPACKYEARSSMOKED'
| nPatients | Mean (Std.Dev) | |
|---|---|---|
| ALL | 61 | 35.9 (23.1) |
| subtype1 | 14 | 32.1 (27.0) |
| subtype2 | 32 | 36.3 (20.1) |
| subtype3 | 15 | 38.5 (26.2) |
Figure S47. Get High-res Image Clustering Approach #7: 'MIRseq CNMF subtypes' versus Clinical Feature #5: 'NUMBERPACKYEARSSMOKED'
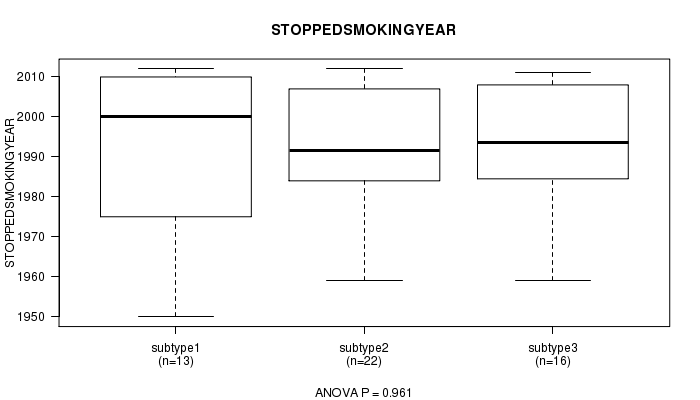
P value = 0.961 (ANOVA)
Table S55. Clustering Approach #7: 'MIRseq CNMF subtypes' versus Clinical Feature #6: 'STOPPEDSMOKINGYEAR'
| nPatients | Mean (Std.Dev) | |
|---|---|---|
| ALL | 51 | 1991.5 (18.1) |
| subtype1 | 13 | 1990.9 (23.0) |
| subtype2 | 22 | 1991.0 (16.9) |
| subtype3 | 16 | 1992.6 (16.2) |
Figure S48. Get High-res Image Clustering Approach #7: 'MIRseq CNMF subtypes' versus Clinical Feature #6: 'STOPPEDSMOKINGYEAR'
P value = 0.421 (ANOVA)
Table S56. Clustering Approach #7: 'MIRseq CNMF subtypes' versus Clinical Feature #7: 'TOBACCOSMOKINGHISTORYINDICATOR'
| nPatients | Mean (Std.Dev) | |
|---|---|---|
| ALL | 97 | 2.6 (1.1) |
| subtype1 | 23 | 2.6 (1.3) |
| subtype2 | 49 | 2.5 (1.0) |
| subtype3 | 25 | 2.8 (1.2) |
Figure S49. Get High-res Image Clustering Approach #7: 'MIRseq CNMF subtypes' versus Clinical Feature #7: 'TOBACCOSMOKINGHISTORYINDICATOR'
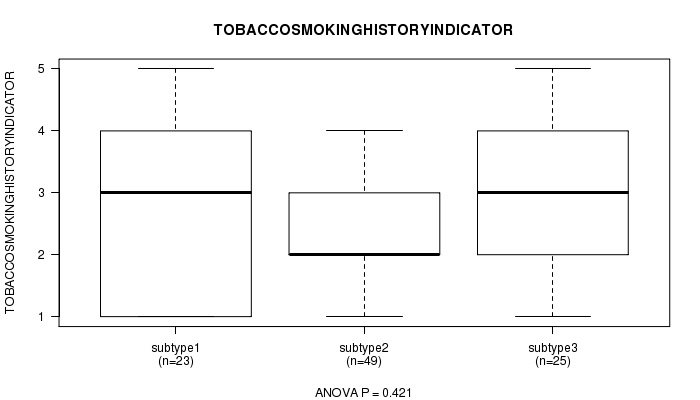
Table S57. Get Full Table Description of clustering approach #8: 'MIRseq cHierClus subtypes'
| Cluster Labels | 1 | 2 | 3 |
|---|---|---|---|
| Number of samples | 23 | 68 | 12 |
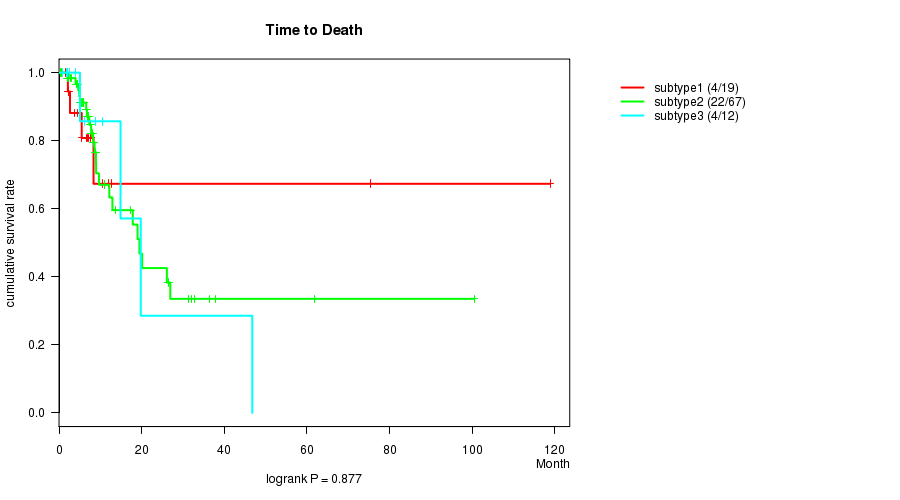
P value = 0.877 (logrank test)
Table S58. Clustering Approach #8: 'MIRseq cHierClus subtypes' versus Clinical Feature #1: 'Time to Death'
| nPatients | nDeath | Duration Range (Median), Month | |
|---|---|---|---|
| ALL | 98 | 30 | 0.4 - 118.9 (7.3) |
| subtype1 | 19 | 4 | 1.5 - 118.9 (6.7) |
| subtype2 | 67 | 22 | 0.4 - 100.5 (7.8) |
| subtype3 | 12 | 4 | 0.8 - 46.8 (5.6) |
Figure S50. Get High-res Image Clustering Approach #8: 'MIRseq cHierClus subtypes' versus Clinical Feature #1: 'Time to Death'
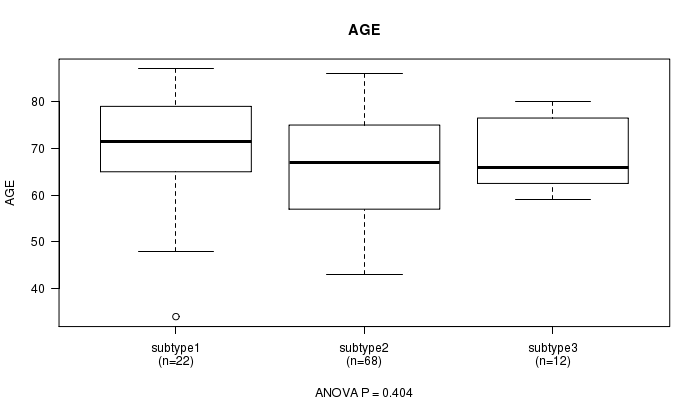
P value = 0.404 (ANOVA)
Table S59. Clustering Approach #8: 'MIRseq cHierClus subtypes' versus Clinical Feature #2: 'AGE'
| nPatients | Mean (Std.Dev) | |
|---|---|---|
| ALL | 102 | 67.1 (11.0) |
| subtype1 | 22 | 69.5 (12.4) |
| subtype2 | 68 | 66.1 (11.0) |
| subtype3 | 12 | 68.5 (7.6) |
Figure S51. Get High-res Image Clustering Approach #8: 'MIRseq cHierClus subtypes' versus Clinical Feature #2: 'AGE'
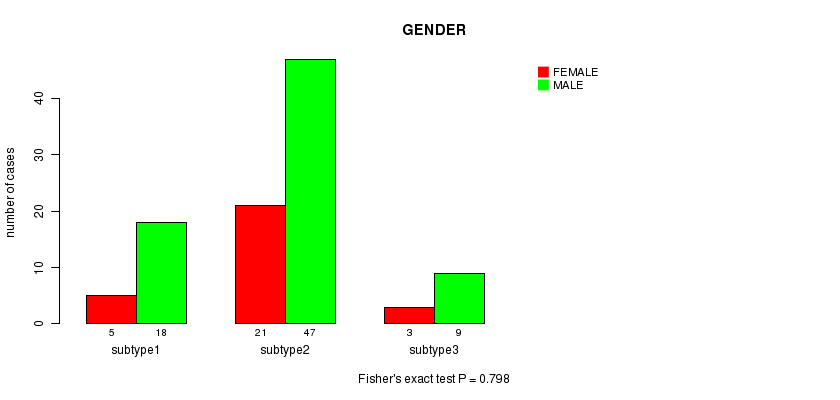
P value = 0.798 (Fisher's exact test)
Table S60. Clustering Approach #8: 'MIRseq cHierClus subtypes' versus Clinical Feature #3: 'GENDER'
| nPatients | FEMALE | MALE |
|---|---|---|
| ALL | 29 | 74 |
| subtype1 | 5 | 18 |
| subtype2 | 21 | 47 |
| subtype3 | 3 | 9 |
Figure S52. Get High-res Image Clustering Approach #8: 'MIRseq cHierClus subtypes' versus Clinical Feature #3: 'GENDER'
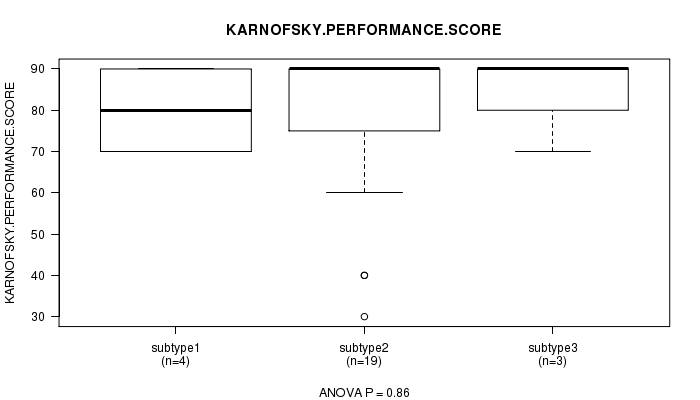
P value = 0.86 (ANOVA)
Table S61. Clustering Approach #8: 'MIRseq cHierClus subtypes' versus Clinical Feature #4: 'KARNOFSKY.PERFORMANCE.SCORE'
| nPatients | Mean (Std.Dev) | |
|---|---|---|
| ALL | 26 | 78.5 (17.8) |
| subtype1 | 4 | 80.0 (11.5) |
| subtype2 | 19 | 77.4 (20.0) |
| subtype3 | 3 | 83.3 (11.5) |
Figure S53. Get High-res Image Clustering Approach #8: 'MIRseq cHierClus subtypes' versus Clinical Feature #4: 'KARNOFSKY.PERFORMANCE.SCORE'
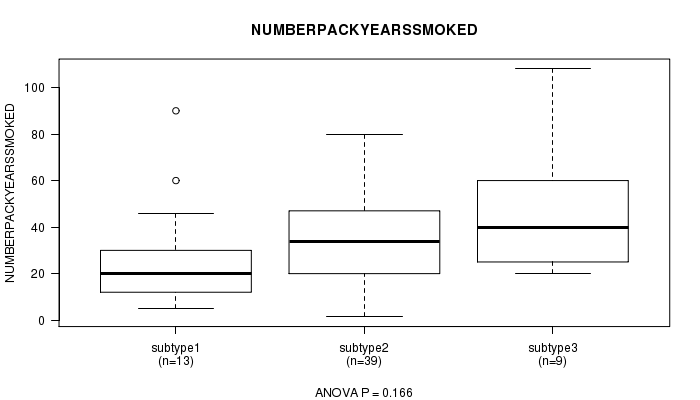
P value = 0.166 (ANOVA)
Table S62. Clustering Approach #8: 'MIRseq cHierClus subtypes' versus Clinical Feature #5: 'NUMBERPACKYEARSSMOKED'
| nPatients | Mean (Std.Dev) | |
|---|---|---|
| ALL | 61 | 35.9 (23.1) |
| subtype1 | 13 | 28.5 (24.2) |
| subtype2 | 39 | 35.6 (20.5) |
| subtype3 | 9 | 47.4 (29.8) |
Figure S54. Get High-res Image Clustering Approach #8: 'MIRseq cHierClus subtypes' versus Clinical Feature #5: 'NUMBERPACKYEARSSMOKED'
P value = 0.625 (ANOVA)
Table S63. Clustering Approach #8: 'MIRseq cHierClus subtypes' versus Clinical Feature #6: 'STOPPEDSMOKINGYEAR'
| nPatients | Mean (Std.Dev) | |
|---|---|---|
| ALL | 51 | 1991.5 (18.1) |
| subtype1 | 12 | 1987.2 (22.3) |
| subtype2 | 30 | 1992.4 (17.6) |
| subtype3 | 9 | 1994.2 (13.8) |
Figure S55. Get High-res Image Clustering Approach #8: 'MIRseq cHierClus subtypes' versus Clinical Feature #6: 'STOPPEDSMOKINGYEAR'
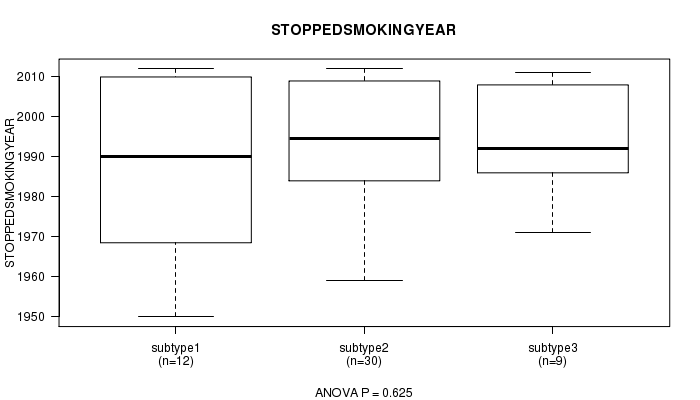
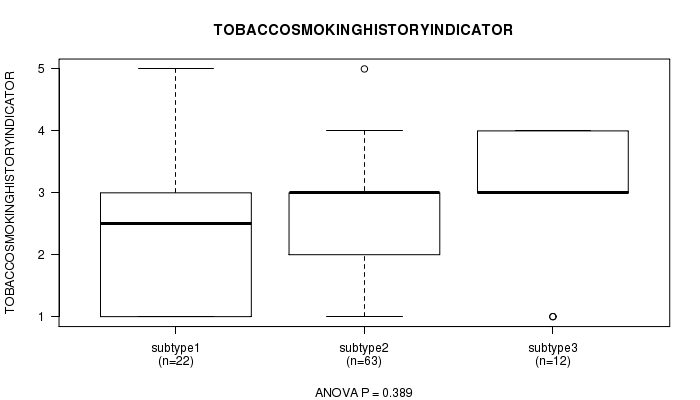
P value = 0.389 (ANOVA)
Table S64. Clustering Approach #8: 'MIRseq cHierClus subtypes' versus Clinical Feature #7: 'TOBACCOSMOKINGHISTORYINDICATOR'
| nPatients | Mean (Std.Dev) | |
|---|---|---|
| ALL | 97 | 2.6 (1.1) |
| subtype1 | 22 | 2.5 (1.3) |
| subtype2 | 63 | 2.6 (1.1) |
| subtype3 | 12 | 3.0 (1.0) |
Figure S56. Get High-res Image Clustering Approach #8: 'MIRseq cHierClus subtypes' versus Clinical Feature #7: 'TOBACCOSMOKINGHISTORYINDICATOR'
-
Cluster data file = BLCA-TP.mergedcluster.txt
-
Clinical data file = BLCA-TP.clin.merged.picked.txt
-
Number of patients = 108
-
Number of clustering approaches = 8
-
Number of selected clinical features = 7
-
Exclude small clusters that include fewer than K patients, K = 3
consensus non-negative matrix factorization clustering approach (Brunet et al. 2004)
Resampling-based clustering method (Monti et al. 2003)
For survival clinical features, the Kaplan-Meier survival curves of tumors with and without gene mutations were plotted and the statistical significance P values were estimated by logrank test (Bland and Altman 2004) using the 'survdiff' function in R
For continuous numerical clinical features, one-way analysis of variance (Howell 2002) was applied to compare the clinical values between tumor subtypes using 'anova' function in R
For binary clinical features, two-tailed Fisher's exact tests (Fisher 1922) were used to estimate the P values using the 'fisher.test' function in R
This is an experimental feature. The full results of the analysis summarized in this report can be downloaded from the TCGA Data Coordination Center.