This pipeline uses various statistical tests to identify genes whose promoter methylation levels correlated to selected clinical features.
Testing the association between 17313 genes and 4 clinical features across 25 samples, statistically thresholded by Q value < 0.05, 1 clinical feature related to at least one genes.
-
1 gene correlated to 'TOBACCOSMOKINGHISTORYINDICATOR'.
-
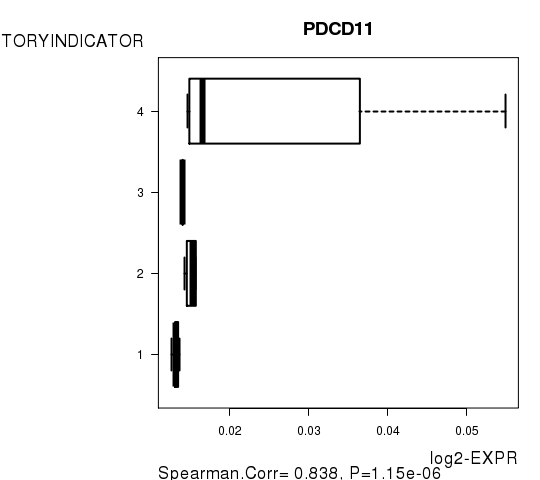
PDCD11
-
No genes correlated to 'AGE', 'RADIATIONS.RADIATION.REGIMENINDICATION', and 'NUMBERPACKYEARSSMOKED'.
Complete statistical result table is provided in Supplement Table 1
Table 1. Get Full Table This table shows the clinical features, statistical methods used, and the number of genes that are significantly associated with each clinical feature at Q value < 0.05.
| Clinical feature | Statistical test | Significant genes | Associated with | Associated with | ||
|---|---|---|---|---|---|---|
| AGE | Spearman correlation test | N=0 | ||||
| RADIATIONS RADIATION REGIMENINDICATION | t test | N=0 | ||||
| NUMBERPACKYEARSSMOKED | Spearman correlation test | N=0 | ||||
| TOBACCOSMOKINGHISTORYINDICATOR | Spearman correlation test | N=1 | higher tobaccosmokinghistoryindicator | N=1 | lower tobaccosmokinghistoryindicator | N=0 |
Table S1. Basic characteristics of clinical feature: 'AGE'
| AGE | Mean (SD) | 47.76 (11) |
| Significant markers | N = 0 |
No gene related to 'RADIATIONS.RADIATION.REGIMENINDICATION'.
Table S2. Basic characteristics of clinical feature: 'RADIATIONS.RADIATION.REGIMENINDICATION'
| RADIATIONS.RADIATION.REGIMENINDICATION | Labels | N |
| NO | 6 | |
| YES | 19 | |
| Significant markers | N = 0 |
Table S3. Basic characteristics of clinical feature: 'NUMBERPACKYEARSSMOKED'
| NUMBERPACKYEARSSMOKED | Mean (SD) | 17.4 (13) |
| Value | N | |
| 5 | 1 | |
| 12 | 1 | |
| 15 | 2 | |
| 40 | 1 | |
| Significant markers | N = 0 |
One gene related to 'TOBACCOSMOKINGHISTORYINDICATOR'.
Table S4. Basic characteristics of clinical feature: 'TOBACCOSMOKINGHISTORYINDICATOR'
| TOBACCOSMOKINGHISTORYINDICATOR | Mean (SD) | 1.91 (1.2) |
| Value | N | |
| 1 | 11 | |
| 2 | 6 | |
| 3 | 1 | |
| 4 | 4 | |
| Significant markers | N = 1 | |
| pos. correlated | 1 | |
| neg. correlated | 0 |
Table S5. Get Full Table List of one gene significantly correlated to 'TOBACCOSMOKINGHISTORYINDICATOR' by Spearman correlation test
| SpearmanCorr | corrP | Q | |
|---|---|---|---|
| PDCD11 | 0.8377 | 1.153e-06 | 0.02 |
Figure S1. Get High-res Image As an example, this figure shows the association of PDCD11 to 'TOBACCOSMOKINGHISTORYINDICATOR'. P value = 1.15e-06 with Spearman correlation analysis.
-
Expresson data file = CESC-TP.meth.for_correlation.filtered_data.txt
-
Clinical data file = CESC-TP.clin.merged.picked.txt
-
Number of patients = 25
-
Number of genes = 17313
-
Number of clinical features = 4
For continuous numerical clinical features, Spearman's rank correlation coefficients (Spearman 1904) and two-tailed P values were estimated using 'cor.test' function in R
For two-class clinical features, two-tailed Student's t test with unequal variance (Lehmann and Romano 2005) was applied to compare the log2-expression levels between the two clinical classes using 't.test' function in R
For multiple hypothesis correction, Q value is the False Discovery Rate (FDR) analogue of the P value (Benjamini and Hochberg 1995), defined as the minimum FDR at which the test may be called significant. We used the 'Benjamini and Hochberg' method of 'p.adjust' function in R to convert P values into Q values.
This is an experimental feature. The full results of the analysis summarized in this report can be downloaded from the TCGA Data Coordination Center.