This pipeline uses various statistical tests to identify mRNAs whose expression levels correlated to selected clinical features.
Testing the association between 17814 genes and 9 clinical features across 224 samples, statistically thresholded by Q value < 0.05, 5 clinical features related to at least one genes.
-
37 genes correlated to 'PRIMARY.SITE.OF.DISEASE'.
-
PRAC , GPX2 , CEACAM5 , LGALS4 , ZNF529 , ...
-
31 genes correlated to 'GENDER'.
-
DDX3Y , EIF1AY , JARID1D , RPS4Y1 , RPS4Y2 , ...
-
390 genes correlated to 'HISTOLOGICAL.TYPE'.
-
SLC11A1 , PLAGL2 , PDGFRL , C20ORF177 , AGR2 , ...
-
1 gene correlated to 'PATHOLOGY.T'.
-
RBP7
-
4 genes correlated to 'PATHOLOGICSPREAD(M)'.
-
KCNC2 , ZNF273 , FLJ44894 , MFNG
-
No genes correlated to 'Time to Death', 'AGE', 'PATHOLOGY.N', and 'TUMOR.STAGE'.
Complete statistical result table is provided in Supplement Table 1
Table 1. Get Full Table This table shows the clinical features, statistical methods used, and the number of genes that are significantly associated with each clinical feature at Q value < 0.05.
| Clinical feature | Statistical test | Significant genes | Associated with | Associated with | ||
|---|---|---|---|---|---|---|
| Time to Death | Cox regression test | N=0 | ||||
| AGE | Spearman correlation test | N=0 | ||||
| PRIMARY SITE OF DISEASE | t test | N=37 | rectum | N=26 | colon | N=11 |
| GENDER | t test | N=31 | male | N=14 | female | N=17 |
| HISTOLOGICAL TYPE | ANOVA test | N=390 | ||||
| PATHOLOGY T | Spearman correlation test | N=1 | higher pT | N=1 | lower pT | N=0 |
| PATHOLOGY N | Spearman correlation test | N=0 | ||||
| PATHOLOGICSPREAD(M) | ANOVA test | N=4 | ||||
| TUMOR STAGE | Spearman correlation test | N=0 |
Table S1. Basic characteristics of clinical feature: 'Time to Death'
| Time to Death | Duration (Months) | 0.9-52 (median=5.5) |
| censored | N = 99 | |
| death | N = 15 | |
| Significant markers | N = 0 |
Table S2. Basic characteristics of clinical feature: 'AGE'
| AGE | Mean (SD) | 69.34 (11) |
| Significant markers | N = 0 |
Table S3. Basic characteristics of clinical feature: 'PRIMARY.SITE.OF.DISEASE'
| PRIMARY.SITE.OF.DISEASE | Labels | N |
| COLON | 154 | |
| RECTUM | 68 | |
| Significant markers | N = 37 | |
| Higher in RECTUM | 26 | |
| Higher in COLON | 11 |
Table S4. Get Full Table List of top 10 genes differentially expressed by 'PRIMARY.SITE.OF.DISEASE'
| T(pos if higher in 'RECTUM') | ttestP | Q | AUC | |
|---|---|---|---|---|
| PRAC | 7.43 | 7.085e-12 | 1.26e-07 | 0.7771 |
| GPX2 | 7.24 | 7.418e-12 | 1.32e-07 | 0.7868 |
| CEACAM5 | 7.27 | 7.521e-12 | 1.34e-07 | 0.7713 |
| LGALS4 | 7.12 | 2.569e-11 | 4.58e-07 | 0.7524 |
| ZNF529 | 6.29 | 1.657e-09 | 2.95e-05 | 0.6826 |
| MLH1 | 5.95 | 1.052e-08 | 0.000187 | 0.6731 |
| HSP90B3P | -5.99 | 1.217e-08 | 0.000217 | 0.732 |
| PPP1R1B | 5.68 | 5.053e-08 | 9e-04 | 0.7348 |
| HOXB13 | 5.85 | 5.063e-08 | 0.000902 | 0.7457 |
| PDZK1IP1 | 5.73 | 5.909e-08 | 0.00105 | 0.7406 |
Figure S1. Get High-res Image As an example, this figure shows the association of PRAC to 'PRIMARY.SITE.OF.DISEASE'. P value = 7.09e-12 with T-test analysis.
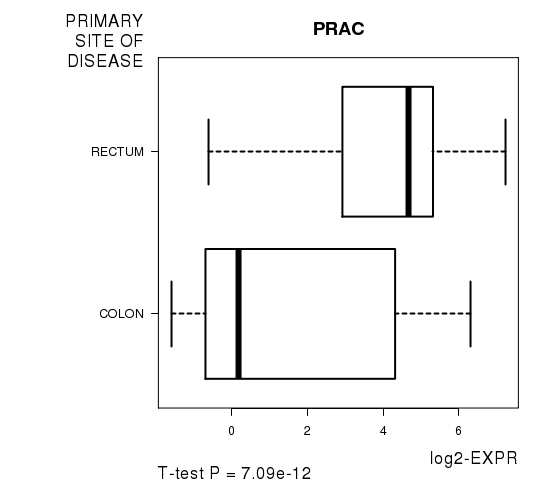
Table S5. Basic characteristics of clinical feature: 'GENDER'
| GENDER | Labels | N |
| FEMALE | 107 | |
| MALE | 117 | |
| Significant markers | N = 31 | |
| Higher in MALE | 14 | |
| Higher in FEMALE | 17 |
Table S6. Get Full Table List of top 10 genes differentially expressed by 'GENDER'
| T(pos if higher in 'MALE') | ttestP | Q | AUC | |
|---|---|---|---|---|
| DDX3Y | 25.36 | 1.631e-67 | 2.91e-63 | 0.9711 |
| EIF1AY | 22.73 | 2.061e-59 | 3.67e-55 | 0.9638 |
| JARID1D | 22.52 | 3.733e-59 | 6.65e-55 | 0.9703 |
| RPS4Y1 | 22.39 | 6.001e-58 | 1.07e-53 | 0.9426 |
| RPS4Y2 | 21.49 | 5.929e-55 | 1.06e-50 | 0.9646 |
| CYORF15A | 20.74 | 6.388e-53 | 1.14e-48 | 0.9539 |
| UTY | 18.72 | 3.543e-46 | 6.31e-42 | 0.9451 |
| CYORF15B | 17.06 | 1.259e-41 | 2.24e-37 | 0.9321 |
| ZFY | 16.7 | 6.085e-41 | 1.08e-36 | 0.9291 |
| NLGN4Y | 12.33 | 6.163e-26 | 1.1e-21 | 0.8686 |
Figure S2. Get High-res Image As an example, this figure shows the association of DDX3Y to 'GENDER'. P value = 1.63e-67 with T-test analysis.
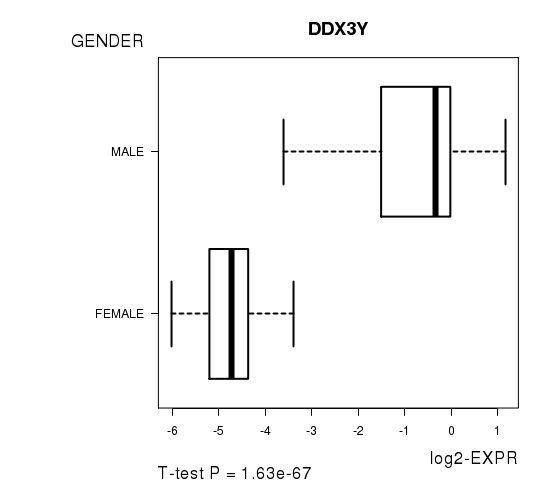
Table S7. Basic characteristics of clinical feature: 'HISTOLOGICAL.TYPE'
| HISTOLOGICAL.TYPE | Labels | N |
| COLON ADENOCARCINOMA | 128 | |
| COLON MUCINOUS ADENOCARCINOMA | 24 | |
| RECTAL ADENOCARCINOMA | 58 | |
| RECTAL MUCINOUS ADENOCARCINOMA | 7 | |
| Significant markers | N = 390 |
Table S8. Get Full Table List of top 10 genes differentially expressed by 'HISTOLOGICAL.TYPE'
| ANOVA_P | Q | |
|---|---|---|
| SLC11A1 | 1.944e-12 | 3.46e-08 |
| PLAGL2 | 2.799e-12 | 4.99e-08 |
| PDGFRL | 1.224e-11 | 2.18e-07 |
| C20ORF177 | 1.233e-11 | 2.2e-07 |
| AGR2 | 7.249e-11 | 1.29e-06 |
| DUSP4 | 7.473e-11 | 1.33e-06 |
| ZNF529 | 8.005e-11 | 1.43e-06 |
| SLC19A3 | 9.183e-11 | 1.64e-06 |
| HPSE | 1.347e-10 | 2.4e-06 |
| ACSL5 | 1.445e-10 | 2.57e-06 |
Figure S3. Get High-res Image As an example, this figure shows the association of SLC11A1 to 'HISTOLOGICAL.TYPE'. P value = 1.94e-12 with ANOVA analysis.
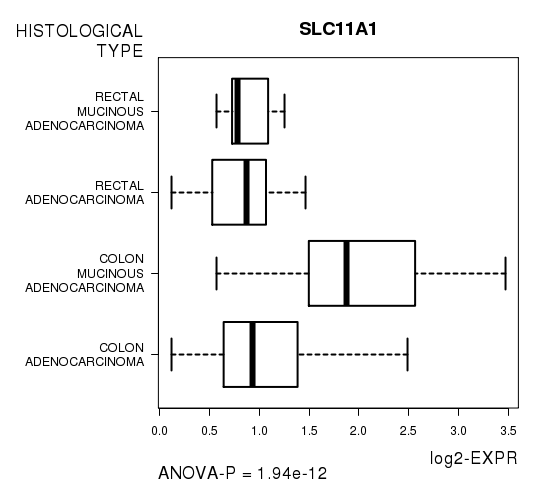
Table S9. Basic characteristics of clinical feature: 'PATHOLOGY.T'
| PATHOLOGY.T | Mean (SD) | 2.79 (0.63) |
| N | ||
| T1 | 9 | |
| T2 | 46 | |
| T3 | 150 | |
| T4 | 17 | |
| Significant markers | N = 1 | |
| pos. correlated | 1 | |
| neg. correlated | 0 |
Table S10. Get Full Table List of one gene significantly correlated to 'PATHOLOGY.T' by Spearman correlation test
| SpearmanCorr | corrP | Q | |
|---|---|---|---|
| RBP7 | 0.31 | 2.481e-06 | 0.0442 |
Figure S4. Get High-res Image As an example, this figure shows the association of RBP7 to 'PATHOLOGY.T'. P value = 2.48e-06 with Spearman correlation analysis.
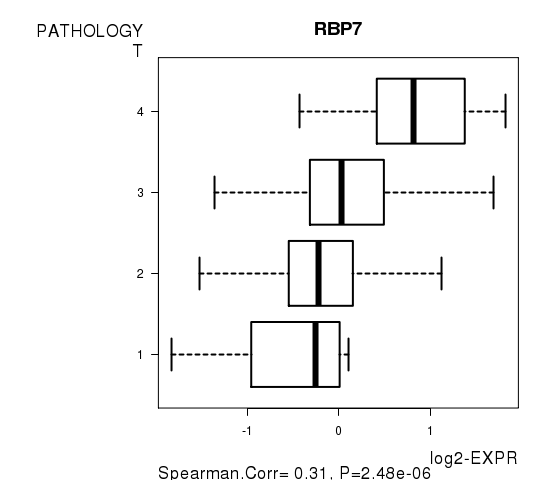
Table S11. Basic characteristics of clinical feature: 'PATHOLOGY.N'
| PATHOLOGY.N | Mean (SD) | 0.58 (0.8) |
| N | ||
| N0 | 137 | |
| N1 | 43 | |
| N2 | 44 | |
| Significant markers | N = 0 |
Table S12. Basic characteristics of clinical feature: 'PATHOLOGICSPREAD(M)'
| PATHOLOGICSPREAD(M) | Labels | N |
| M0 | 186 | |
| M1 | 34 | |
| M1A | 1 | |
| Significant markers | N = 4 |
Table S13. Get Full Table List of 4 genes differentially expressed by 'PATHOLOGICSPREAD(M)'
| ANOVA_P | Q | |
|---|---|---|
| KCNC2 | 9.739e-11 | 1.73e-06 |
| ZNF273 | 1.864e-06 | 0.0332 |
| FLJ44894 | 1.99e-06 | 0.0354 |
| MFNG | 2.089e-06 | 0.0372 |
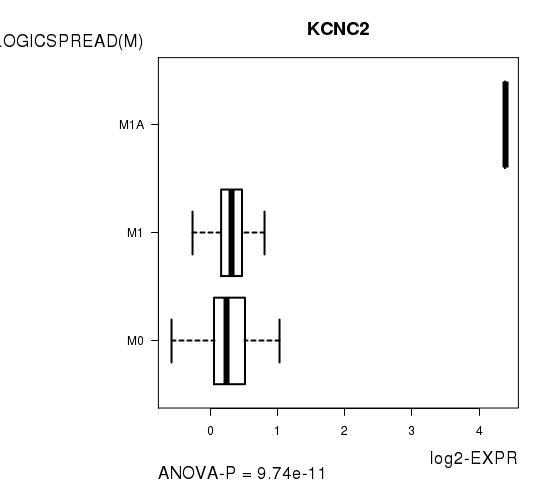
Figure S5. Get High-res Image As an example, this figure shows the association of KCNC2 to 'PATHOLOGICSPREAD(M)'. P value = 9.74e-11 with ANOVA analysis.
-
Expresson data file = COADREAD-TP.medianexp.txt
-
Clinical data file = COADREAD-TP.clin.merged.picked.txt
-
Number of patients = 224
-
Number of genes = 17814
-
Number of clinical features = 9
For survival clinical features, Wald's test in univariate Cox regression analysis with proportional hazards model (Andersen and Gill 1982) was used to estimate the P values using the 'coxph' function in R. Kaplan-Meier survival curves were plot using the four quartile subgroups of patients based on expression levels
For continuous numerical clinical features, Spearman's rank correlation coefficients (Spearman 1904) and two-tailed P values were estimated using 'cor.test' function in R
For two-class clinical features, two-tailed Student's t test with unequal variance (Lehmann and Romano 2005) was applied to compare the log2-expression levels between the two clinical classes using 't.test' function in R
For multi-class clinical features (ordinal or nominal), one-way analysis of variance (Howell 2002) was applied to compare the log2-expression levels between different clinical classes using 'anova' function in R
For multiple hypothesis correction, Q value is the False Discovery Rate (FDR) analogue of the P value (Benjamini and Hochberg 1995), defined as the minimum FDR at which the test may be called significant. We used the 'Benjamini and Hochberg' method of 'p.adjust' function in R to convert P values into Q values.
This is an experimental feature. The full results of the analysis summarized in this report can be downloaded from the TCGA Data Coordination Center.