This pipeline uses various statistical tests to identify mRNAs whose expression levels correlated to selected clinical features.
Testing the association between 17880 genes and 9 clinical features across 264 samples, statistically thresholded by Q value < 0.05, 7 clinical features related to at least one genes.
-
120 genes correlated to 'PRIMARY.SITE.OF.DISEASE'.
-
DRD5|1816 , H1FX|8971 , LOC152217|152217 , C2CD4D|100191040 , CTU1|90353 , ...
-
32 genes correlated to 'GENDER'.
-
RPS4Y1|6192 , ZFY|7544 , XIST|7503 , DDX3Y|8653 , KDM5D|8284 , ...
-
427 genes correlated to 'HISTOLOGICAL.TYPE'.
-
SNHG11|128439 , SLC19A3|80704 , GTF2IRD1|9569 , PLAGL2|5326 , POFUT1|23509 , ...
-
1 gene correlated to 'PATHOLOGY.T'.
-
NRG1|3084
-
1 gene correlated to 'PATHOLOGY.N'.
-
DIRAS2|54769
-
1 gene correlated to 'PATHOLOGICSPREAD(M)'.
-
GFI1|2672
-
2 genes correlated to 'TUMOR.STAGE'.
-
GFI1|2672 , ENOSF1|55556
-
No genes correlated to 'Time to Death', and 'AGE'.
Complete statistical result table is provided in Supplement Table 1
Table 1. Get Full Table This table shows the clinical features, statistical methods used, and the number of genes that are significantly associated with each clinical feature at Q value < 0.05.
| Clinical feature | Statistical test | Significant genes | Associated with | Associated with | ||
|---|---|---|---|---|---|---|
| Time to Death | Cox regression test | N=0 | ||||
| AGE | Spearman correlation test | N=0 | ||||
| PRIMARY SITE OF DISEASE | t test | N=120 | rectum | N=104 | colon | N=16 |
| GENDER | t test | N=32 | male | N=14 | female | N=18 |
| HISTOLOGICAL TYPE | ANOVA test | N=427 | ||||
| PATHOLOGY T | Spearman correlation test | N=1 | higher pT | N=0 | lower pT | N=1 |
| PATHOLOGY N | Spearman correlation test | N=1 | higher pN | N=1 | lower pN | N=0 |
| PATHOLOGICSPREAD(M) | ANOVA test | N=1 | ||||
| TUMOR STAGE | Spearman correlation test | N=2 | higher stage | N=0 | lower stage | N=2 |
Table S1. Basic characteristics of clinical feature: 'Time to Death'
| Time to Death | Duration (Months) | 0.9-72.1 (median=12) |
| censored | N = 131 | |
| death | N = 20 | |
| Significant markers | N = 0 |
Table S2. Basic characteristics of clinical feature: 'AGE'
| AGE | Mean (SD) | 68.86 (12) |
| Significant markers | N = 0 |
Table S3. Basic characteristics of clinical feature: 'PRIMARY.SITE.OF.DISEASE'
| PRIMARY.SITE.OF.DISEASE | Labels | N |
| COLON | 191 | |
| RECTUM | 71 | |
| Significant markers | N = 120 | |
| Higher in RECTUM | 104 | |
| Higher in COLON | 16 |
Table S4. Get Full Table List of top 10 genes differentially expressed by 'PRIMARY.SITE.OF.DISEASE'
| T(pos if higher in 'RECTUM') | ttestP | Q | AUC | |
|---|---|---|---|---|
| DRD5|1816 | -7.58 | 2.08e-11 | 3.72e-07 | 0.7857 |
| H1FX|8971 | 6.83 | 1.277e-10 | 2.28e-06 | 0.7506 |
| LOC152217|152217 | 6.81 | 1.606e-10 | 2.87e-06 | 0.7414 |
| C2CD4D|100191040 | 6.82 | 1.792e-10 | 3.2e-06 | 0.7441 |
| CTU1|90353 | 6.79 | 2.404e-10 | 4.3e-06 | 0.7404 |
| HOXB13|10481 | 6.93 | 3.887e-10 | 6.95e-06 | 0.78 |
| ANKHD1-EIF4EBP3|404734 | 6.64 | 4.925e-10 | 8.8e-06 | 0.7398 |
| TMEM160|54958 | 6.31 | 2.735e-09 | 4.89e-05 | 0.7574 |
| ANKRD9|122416 | 6.3 | 4.725e-09 | 8.44e-05 | 0.7437 |
| ALKBH6|84964 | 6.26 | 5.559e-09 | 9.93e-05 | 0.7481 |
Figure S1. Get High-res Image As an example, this figure shows the association of DRD5|1816 to 'PRIMARY.SITE.OF.DISEASE'. P value = 2.08e-11 with T-test analysis.
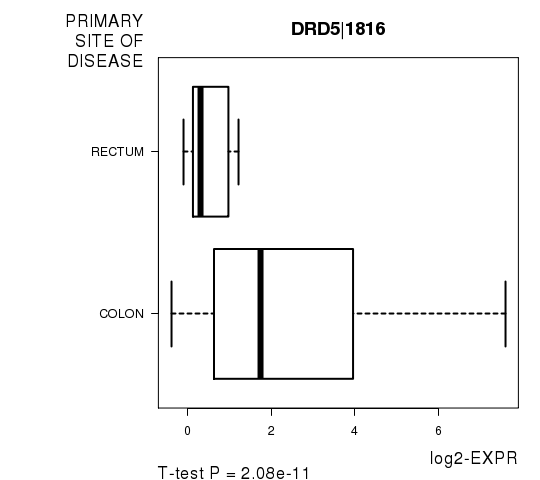
Table S5. Basic characteristics of clinical feature: 'GENDER'
| GENDER | Labels | N |
| FEMALE | 132 | |
| MALE | 132 | |
| Significant markers | N = 32 | |
| Higher in MALE | 14 | |
| Higher in FEMALE | 18 |
Table S6. Get Full Table List of top 10 genes differentially expressed by 'GENDER'
| T(pos if higher in 'MALE') | ttestP | Q | AUC | |
|---|---|---|---|---|
| RPS4Y1|6192 | 29.28 | 6.211e-76 | 1.11e-71 | 0.9969 |
| ZFY|7544 | 28.06 | 7.279e-61 | 1.3e-56 | 0.9887 |
| XIST|7503 | -25.51 | 4.986e-59 | 8.91e-55 | 0.9867 |
| DDX3Y|8653 | 28.71 | 2.332e-53 | 4.17e-49 | 0.9949 |
| KDM5D|8284 | 27.27 | 1.744e-47 | 3.12e-43 | 0.9951 |
| TMSB4Y|9087 | 21.2 | 3.22e-46 | 5.76e-42 | 0.9675 |
| NLGN4Y|22829 | 18.43 | 6.952e-41 | 1.24e-36 | 0.9554 |
| PRKY|5616 | 16.15 | 8.03e-41 | 1.44e-36 | 0.9126 |
| TSIX|9383 | -16.55 | 1.141e-39 | 2.04e-35 | 0.9354 |
| CYORF15A|246126 | 21.5 | 1.241e-39 | 2.22e-35 | 0.9831 |
Figure S2. Get High-res Image As an example, this figure shows the association of RPS4Y1|6192 to 'GENDER'. P value = 6.21e-76 with T-test analysis.
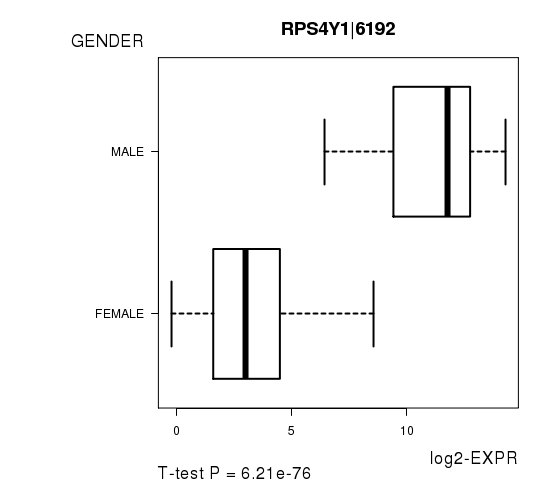
Table S7. Basic characteristics of clinical feature: 'HISTOLOGICAL.TYPE'
| HISTOLOGICAL.TYPE | Labels | N |
| COLON ADENOCARCINOMA | 162 | |
| COLON MUCINOUS ADENOCARCINOMA | 27 | |
| RECTAL ADENOCARCINOMA | 60 | |
| RECTAL MUCINOUS ADENOCARCINOMA | 8 | |
| Significant markers | N = 427 |
Table S8. Get Full Table List of top 10 genes differentially expressed by 'HISTOLOGICAL.TYPE'
| ANOVA_P | Q | |
|---|---|---|
| SNHG11|128439 | 5.651e-15 | 1.01e-10 |
| SLC19A3|80704 | 2.044e-13 | 3.65e-09 |
| GTF2IRD1|9569 | 6.397e-13 | 1.14e-08 |
| PLAGL2|5326 | 1.097e-12 | 1.96e-08 |
| POFUT1|23509 | 1.632e-12 | 2.92e-08 |
| NECAB3|63941 | 2.978e-12 | 5.32e-08 |
| AGR2|10551 | 4.07e-12 | 7.27e-08 |
| FAM46A|55603 | 4.67e-12 | 8.35e-08 |
| HOXB13|10481 | 1.47e-11 | 2.63e-07 |
| ZSWIM1|90204 | 1.835e-11 | 3.28e-07 |
Figure S3. Get High-res Image As an example, this figure shows the association of SNHG11|128439 to 'HISTOLOGICAL.TYPE'. P value = 5.65e-15 with ANOVA analysis.
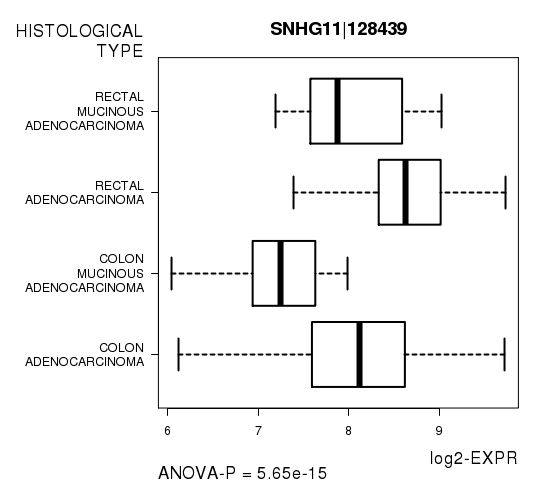
Table S9. Basic characteristics of clinical feature: 'PATHOLOGY.T'
| PATHOLOGY.T | Mean (SD) | 2.8 (0.64) |
| N | ||
| T1 | 11 | |
| T2 | 53 | |
| T3 | 176 | |
| T4 | 22 | |
| Significant markers | N = 1 | |
| pos. correlated | 0 | |
| neg. correlated | 1 |
Table S10. Get Full Table List of one gene significantly correlated to 'PATHOLOGY.T' by Spearman correlation test
| SpearmanCorr | corrP | Q | |
|---|---|---|---|
| NRG1|3084 | -0.2969 | 1.199e-06 | 0.0214 |
Figure S4. Get High-res Image As an example, this figure shows the association of NRG1|3084 to 'PATHOLOGY.T'. P value = 1.2e-06 with Spearman correlation analysis.
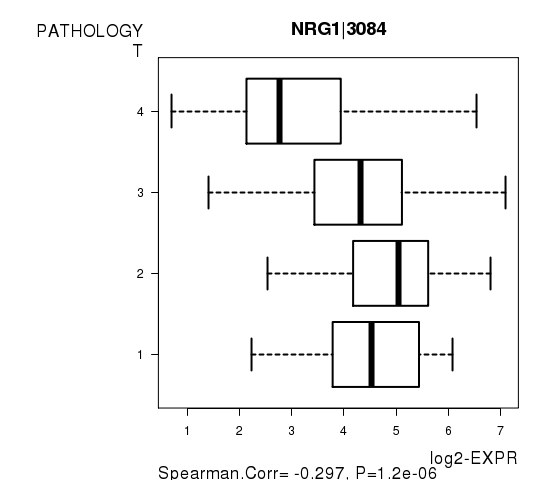
Table S11. Basic characteristics of clinical feature: 'PATHOLOGY.N'
| PATHOLOGY.N | Mean (SD) | 0.58 (0.78) |
| N | ||
| N0 | 158 | |
| N1 | 57 | |
| N2 | 48 | |
| Significant markers | N = 1 | |
| pos. correlated | 1 | |
| neg. correlated | 0 |
Table S12. Get Full Table List of one gene significantly correlated to 'PATHOLOGY.N' by Spearman correlation test
| SpearmanCorr | corrP | Q | |
|---|---|---|---|
| DIRAS2|54769 | 0.4097 | 4.54e-07 | 0.00812 |
Figure S5. Get High-res Image As an example, this figure shows the association of DIRAS2|54769 to 'PATHOLOGY.N'. P value = 4.54e-07 with Spearman correlation analysis.
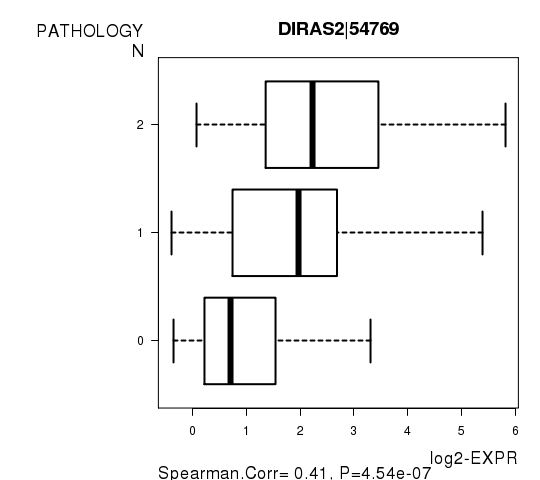
Table S13. Basic characteristics of clinical feature: 'PATHOLOGICSPREAD(M)'
| PATHOLOGICSPREAD(M) | Labels | N |
| M0 | 220 | |
| M1 | 39 | |
| M1A | 2 | |
| Significant markers | N = 1 |
Table S14. Get Full Table List of one gene differentially expressed by 'PATHOLOGICSPREAD(M)'
| ANOVA_P | Q | |
|---|---|---|
| GFI1|2672 | 1.877e-06 | 0.0336 |
Figure S6. Get High-res Image As an example, this figure shows the association of GFI1|2672 to 'PATHOLOGICSPREAD(M)'. P value = 1.88e-06 with ANOVA analysis.
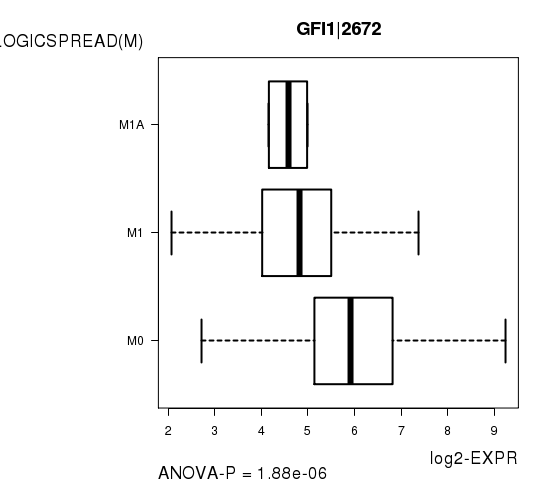
Table S15. Basic characteristics of clinical feature: 'TUMOR.STAGE'
| TUMOR.STAGE | Mean (SD) | 2.35 (0.97) |
| N | ||
| Stage 1 | 53 | |
| Stage 2 | 98 | |
| Stage 3 | 68 | |
| Stage 4 | 37 | |
| Significant markers | N = 2 | |
| pos. correlated | 0 | |
| neg. correlated | 2 |
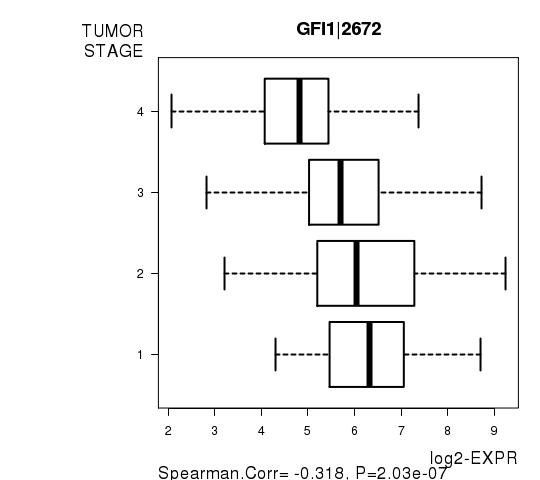
Table S16. Get Full Table List of 2 genes significantly correlated to 'TUMOR.STAGE' by Spearman correlation test
| SpearmanCorr | corrP | Q | |
|---|---|---|---|
| GFI1|2672 | -0.3179 | 2.025e-07 | 0.00362 |
| ENOSF1|55556 | -0.296 | 1.428e-06 | 0.0255 |
Figure S7. Get High-res Image As an example, this figure shows the association of GFI1|2672 to 'TUMOR.STAGE'. P value = 2.03e-07 with Spearman correlation analysis.
-
Expresson data file = COADREAD-TP.uncv2.mRNAseq_RSEM_normalized_log2.txt
-
Clinical data file = COADREAD-TP.clin.merged.picked.txt
-
Number of patients = 264
-
Number of genes = 17880
-
Number of clinical features = 9
For survival clinical features, Wald's test in univariate Cox regression analysis with proportional hazards model (Andersen and Gill 1982) was used to estimate the P values using the 'coxph' function in R. Kaplan-Meier survival curves were plot using the four quartile subgroups of patients based on expression levels
For continuous numerical clinical features, Spearman's rank correlation coefficients (Spearman 1904) and two-tailed P values were estimated using 'cor.test' function in R
For two-class clinical features, two-tailed Student's t test with unequal variance (Lehmann and Romano 2005) was applied to compare the log2-expression levels between the two clinical classes using 't.test' function in R
For multi-class clinical features (ordinal or nominal), one-way analysis of variance (Howell 2002) was applied to compare the log2-expression levels between different clinical classes using 'anova' function in R
For multiple hypothesis correction, Q value is the False Discovery Rate (FDR) analogue of the P value (Benjamini and Hochberg 1995), defined as the minimum FDR at which the test may be called significant. We used the 'Benjamini and Hochberg' method of 'p.adjust' function in R to convert P values into Q values.
This is an experimental feature. The full results of the analysis summarized in this report can be downloaded from the TCGA Data Coordination Center.