This pipeline uses various statistical tests to identify genes whose promoter methylation levels correlated to selected clinical features.
Testing the association between 16969 genes and 9 clinical features across 35 samples, statistically thresholded by Q value < 0.05, 3 clinical features related to at least one genes.
-
131 genes correlated to 'PRIMARY.SITE.OF.DISEASE'.
-
HAGH , PCNP , RBPJ , LOC641367 , HIST1H4K , ...
-
341 genes correlated to 'HISTOLOGICAL.TYPE'.
-
C4ORF38 , PEBP1 , SCNN1G , C4ORF48 , ARPM1 , ...
-
36 genes correlated to 'PATHOLOGICSPREAD(M)'.
-
THAP11 , LRRC14 , UBL5 , N4BP3 , MAP6D1 , ...
-
No genes correlated to 'Time to Death', 'AGE', 'GENDER', 'PATHOLOGY.T', 'PATHOLOGY.N', and 'TUMOR.STAGE'.
Complete statistical result table is provided in Supplement Table 1
Table 1. Get Full Table This table shows the clinical features, statistical methods used, and the number of genes that are significantly associated with each clinical feature at Q value < 0.05.
| Clinical feature | Statistical test | Significant genes | Associated with | Associated with | ||
|---|---|---|---|---|---|---|
| Time to Death | Cox regression test | N=0 | ||||
| AGE | Spearman correlation test | N=0 | ||||
| PRIMARY SITE OF DISEASE | t test | N=131 | rectum | N=51 | colon | N=80 |
| GENDER | t test | N=0 | ||||
| HISTOLOGICAL TYPE | ANOVA test | N=341 | ||||
| PATHOLOGY T | Spearman correlation test | N=0 | ||||
| PATHOLOGY N | Spearman correlation test | N=0 | ||||
| PATHOLOGICSPREAD(M) | ANOVA test | N=36 | ||||
| TUMOR STAGE | Spearman correlation test | N=0 |
Table S1. Basic characteristics of clinical feature: 'Time to Death'
| Time to Death | Duration (Months) | 1-72.1 (median=15.2) |
| censored | N = 27 | |
| death | N = 4 | |
| Significant markers | N = 0 |
Table S2. Basic characteristics of clinical feature: 'AGE'
| AGE | Mean (SD) | 64.03 (13) |
| Significant markers | N = 0 |
Table S3. Basic characteristics of clinical feature: 'PRIMARY.SITE.OF.DISEASE'
| PRIMARY.SITE.OF.DISEASE | Labels | N |
| COLON | 29 | |
| RECTUM | 6 | |
| Significant markers | N = 131 | |
| Higher in RECTUM | 51 | |
| Higher in COLON | 80 |
Table S4. Get Full Table List of top 10 genes differentially expressed by 'PRIMARY.SITE.OF.DISEASE'
| T(pos if higher in 'RECTUM') | ttestP | Q | AUC | |
|---|---|---|---|---|
| HAGH | 14.2 | 1.366e-15 | 2.32e-11 | 1 |
| PCNP | -20.02 | 8.35e-15 | 1.42e-10 | 1 |
| RBPJ | -12.24 | 8.283e-14 | 1.41e-09 | 1 |
| LOC641367 | -12.15 | 1.994e-13 | 3.38e-09 | 1 |
| HIST1H4K | 16.15 | 8.622e-13 | 1.46e-08 | 1 |
| KIAA0430 | -11.17 | 1.306e-12 | 2.22e-08 | 1 |
| CENPM | 12.91 | 5.447e-12 | 9.24e-08 | 1 |
| LOC644936 | -11.16 | 5.965e-12 | 1.01e-07 | 1 |
| PPPDE1 | -18.54 | 6.465e-12 | 1.1e-07 | 1 |
| PRKAB1 | -9.92 | 1.994e-11 | 3.38e-07 | 1 |
Figure S1. Get High-res Image As an example, this figure shows the association of HAGH to 'PRIMARY.SITE.OF.DISEASE'. P value = 1.37e-15 with T-test analysis.
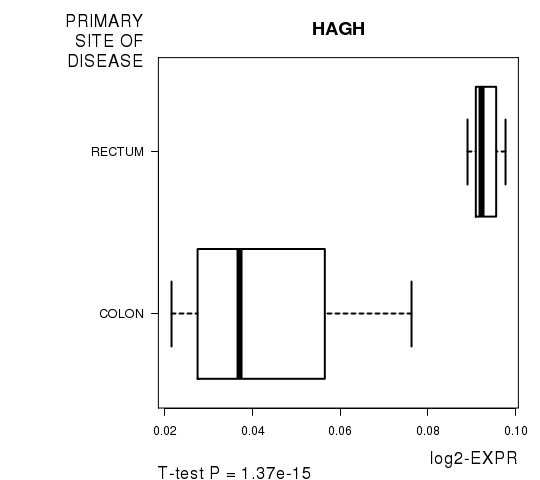
Table S5. Basic characteristics of clinical feature: 'GENDER'
| GENDER | Labels | N |
| FEMALE | 19 | |
| MALE | 16 | |
| Significant markers | N = 0 |
Table S6. Basic characteristics of clinical feature: 'HISTOLOGICAL.TYPE'
| HISTOLOGICAL.TYPE | Labels | N |
| COLON ADENOCARCINOMA | 28 | |
| COLON MUCINOUS ADENOCARCINOMA | 1 | |
| RECTAL ADENOCARCINOMA | 5 | |
| RECTAL MUCINOUS ADENOCARCINOMA | 1 | |
| Significant markers | N = 341 |
Table S7. Get Full Table List of top 10 genes differentially expressed by 'HISTOLOGICAL.TYPE'
| ANOVA_P | Q | |
|---|---|---|
| C4ORF38 | 2.252e-51 | 3.82e-47 |
| PEBP1 | 3.432e-47 | 5.82e-43 |
| SCNN1G | 4.429e-46 | 7.52e-42 |
| C4ORF48 | 1.095e-43 | 1.86e-39 |
| ARPM1 | 1.336e-42 | 2.27e-38 |
| CCDC146 | 2.784e-39 | 4.72e-35 |
| ACAT2 | 1.773e-32 | 3.01e-28 |
| KIAA0141 | 4.199e-31 | 7.12e-27 |
| FAM185A | 1.21e-30 | 2.05e-26 |
| EXD1 | 1.656e-29 | 2.81e-25 |
Figure S2. Get High-res Image As an example, this figure shows the association of C4ORF38 to 'HISTOLOGICAL.TYPE'. P value = 2.25e-51 with ANOVA analysis.
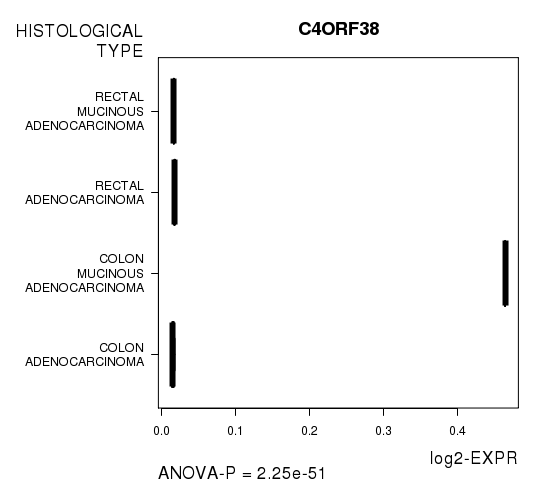
Table S8. Basic characteristics of clinical feature: 'PATHOLOGY.T'
| PATHOLOGY.T | Mean (SD) | 2.86 (0.73) |
| N | ||
| T1 | 2 | |
| T2 | 6 | |
| T3 | 22 | |
| T4 | 5 | |
| Significant markers | N = 0 |
Table S9. Basic characteristics of clinical feature: 'PATHOLOGY.N'
| PATHOLOGY.N | Mean (SD) | 0.46 (0.66) |
| N | ||
| N0 | 22 | |
| N1 | 10 | |
| N2 | 3 | |
| Significant markers | N = 0 |
Table S10. Basic characteristics of clinical feature: 'PATHOLOGICSPREAD(M)'
| PATHOLOGICSPREAD(M) | Labels | N |
| M0 | 28 | |
| M1 | 5 | |
| M1A | 1 | |
| Significant markers | N = 36 |
Table S11. Get Full Table List of top 10 genes differentially expressed by 'PATHOLOGICSPREAD(M)'
| ANOVA_P | Q | |
|---|---|---|
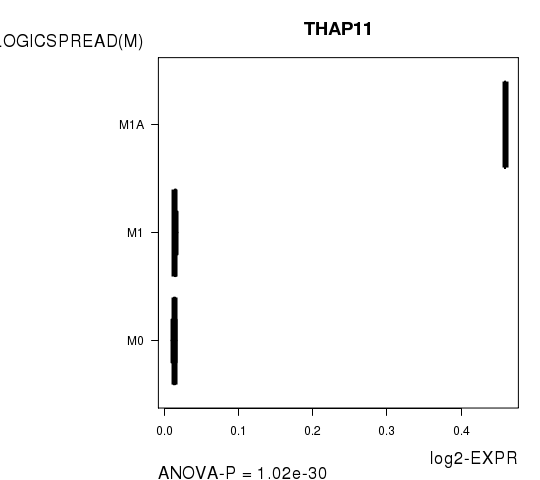
| THAP11 | 1.023e-30 | 1.74e-26 |
| LRRC14 | 3.079e-28 | 5.22e-24 |
| UBL5 | 1.745e-23 | 2.96e-19 |
| N4BP3 | 1.379e-22 | 2.34e-18 |
| MAP6D1 | 7.215e-19 | 1.22e-14 |
| IDUA | 3.37e-17 | 5.72e-13 |
| KLF15 | 1.065e-16 | 1.81e-12 |
| WDR76 | 2.141e-13 | 3.63e-09 |
| RRM1 | 7.246e-13 | 1.23e-08 |
| UGDH | 3.506e-12 | 5.95e-08 |
Figure S3. Get High-res Image As an example, this figure shows the association of THAP11 to 'PATHOLOGICSPREAD(M)'. P value = 1.02e-30 with ANOVA analysis.
-
Expresson data file = COADREAD-TP.meth.for_correlation.filtered_data.txt
-
Clinical data file = COADREAD-TP.clin.merged.picked.txt
-
Number of patients = 35
-
Number of genes = 16969
-
Number of clinical features = 9
For survival clinical features, Wald's test in univariate Cox regression analysis with proportional hazards model (Andersen and Gill 1982) was used to estimate the P values using the 'coxph' function in R. Kaplan-Meier survival curves were plot using the four quartile subgroups of patients based on expression levels
For continuous numerical clinical features, Spearman's rank correlation coefficients (Spearman 1904) and two-tailed P values were estimated using 'cor.test' function in R
For two-class clinical features, two-tailed Student's t test with unequal variance (Lehmann and Romano 2005) was applied to compare the log2-expression levels between the two clinical classes using 't.test' function in R
For multi-class clinical features (ordinal or nominal), one-way analysis of variance (Howell 2002) was applied to compare the log2-expression levels between different clinical classes using 'anova' function in R
For multiple hypothesis correction, Q value is the False Discovery Rate (FDR) analogue of the P value (Benjamini and Hochberg 1995), defined as the minimum FDR at which the test may be called significant. We used the 'Benjamini and Hochberg' method of 'p.adjust' function in R to convert P values into Q values.
This is an experimental feature. The full results of the analysis summarized in this report can be downloaded from the TCGA Data Coordination Center.