This pipeline computes the correlation between cancer subtypes identified by different molecular patterns and selected clinical features.
Testing the association between subtypes identified by 10 different clustering approaches and 5 clinical features across 564 patients, 8 significant findings detected with P value < 0.05.
-
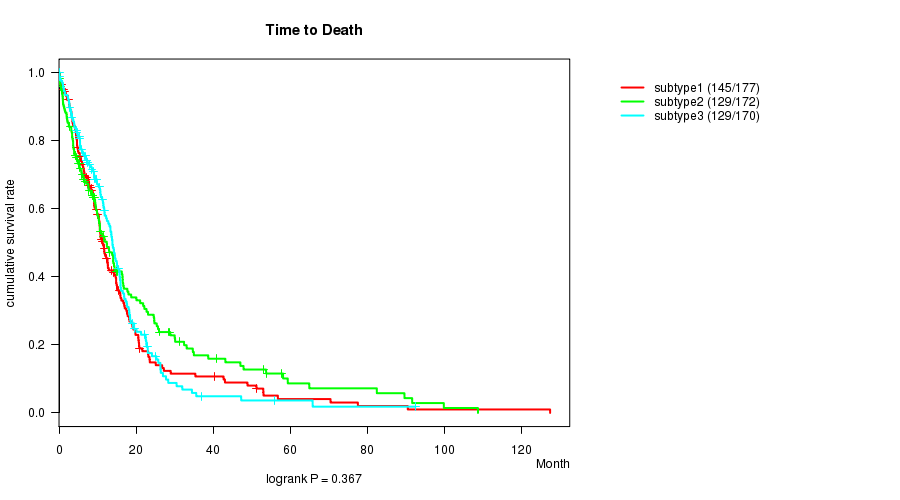
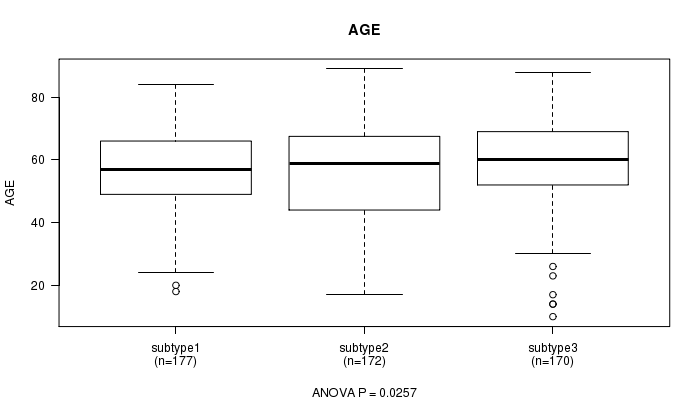
CNMF clustering analysis on array-based mRNA expression data identified 3 subtypes that correlate to 'AGE'.
-
Consensus hierarchical clustering analysis on array-based mRNA expression data identified 3 subtypes that correlate to 'AGE'.
-
CNMF clustering analysis on array-based miR expression data identified 4 subtypes that correlate to 'Time to Death'.
-
Consensus hierarchical clustering analysis on array-based miR expression data identified 3 subtypes that correlate to 'Time to Death' and 'AGE'.
-
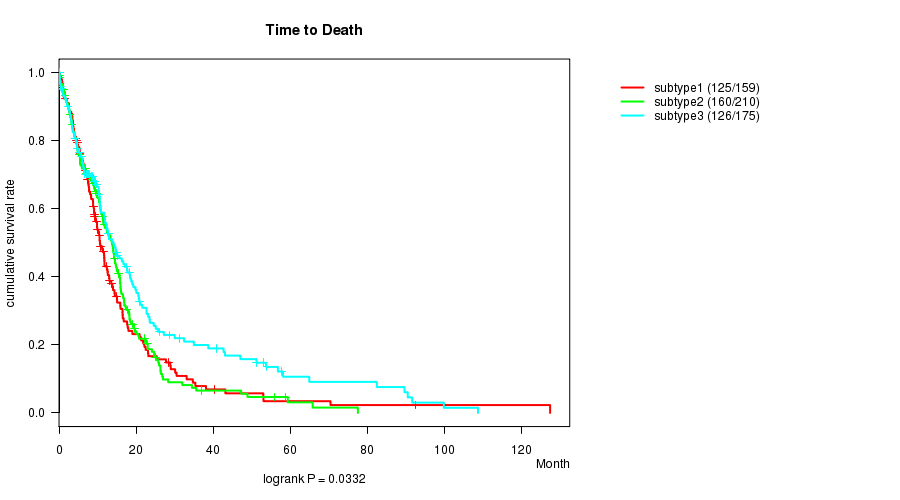
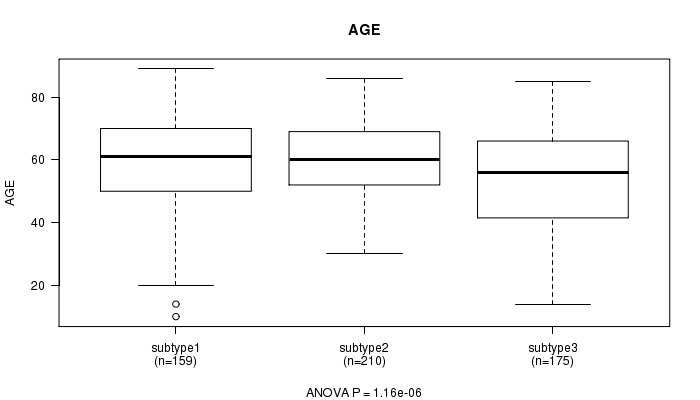
3 subtypes identified in current cancer cohort by 'CN CNMF'. These subtypes correlate to 'Time to Death' and 'AGE'.
-
4 subtypes identified in current cancer cohort by 'METHLYATION CNMF'. These subtypes do not correlate to any clinical features.
-
CNMF clustering analysis on RPPA data identified 4 subtypes that do not correlate to any clinical features.
-
Consensus hierarchical clustering analysis on RPPA data identified 3 subtypes that do not correlate to any clinical features.
-
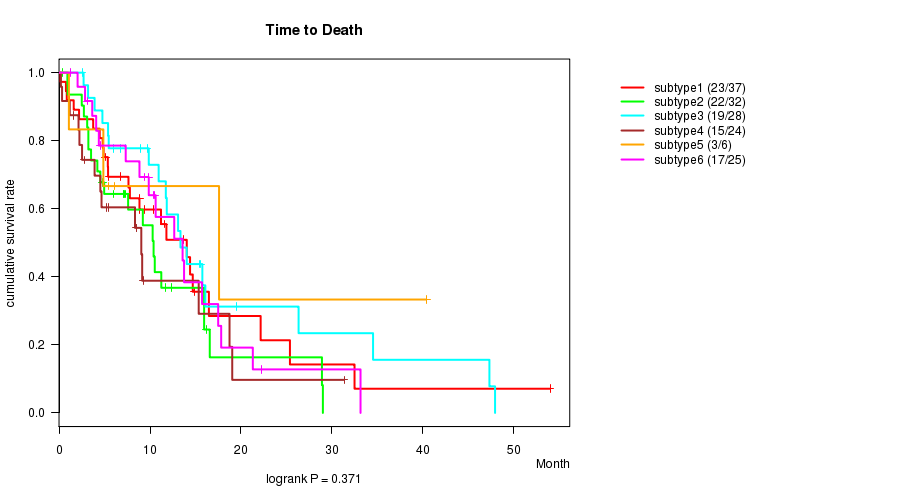
CNMF clustering analysis on sequencing-based mRNA expression data identified 6 subtypes that do not correlate to any clinical features.
-
Consensus hierarchical clustering analysis on sequencing-based mRNA expression data identified 6 subtypes that correlate to 'GENDER'.
Table 1. Get Full Table Overview of the association between subtypes identified by 10 different clustering approaches and 5 clinical features. Shown in the table are P values from statistical tests. Thresholded by P value < 0.05, 8 significant findings detected.
|
Clinical Features |
Time to Death |
AGE | GENDER |
KARNOFSKY PERFORMANCE SCORE |
RADIATIONS RADIATION REGIMENINDICATION |
| Statistical Tests | logrank test | ANOVA | Chi-square test | ANOVA | Chi-square test |
| mRNA CNMF subtypes | 0.367 | 0.0257 | 0.497 | 0.839 | 0.259 |
| mRNA cHierClus subtypes | 0.161 | 0.0276 | 0.563 | 0.487 | 0.122 |
| miR CNMF subtypes | 0.00835 | 0.101 | 0.508 | 0.943 | 0.638 |
| miR cHierClus subtypes | 0.0178 | 0.000872 | 0.119 | 0.785 | 0.758 |
| CN CNMF | 0.0332 | 1.16e-06 | 0.488 | 0.871 | 0.1 |
| METHLYATION CNMF | 0.619 | 0.148 | 0.125 | 0.945 | 0.549 |
| RPPA CNMF subtypes | 0.856 | 0.285 | 0.188 | 0.418 | 0.614 |
| RPPA cHierClus subtypes | 0.964 | 0.457 | 0.528 | 0.438 | 0.303 |
| RNAseq CNMF subtypes | 0.371 | 0.15 | 0.307 | 0.755 | 0.19 |
| RNAseq cHierClus subtypes | 0.35 | 0.349 | 0.0251 | 0.469 | 0.957 |
Table S1. Get Full Table Description of clustering approach #1: 'mRNA CNMF subtypes'
| Cluster Labels | 1 | 2 | 3 |
|---|---|---|---|
| Number of samples | 177 | 172 | 170 |
P value = 0.367 (logrank test)
Table S2. Clustering Approach #1: 'mRNA CNMF subtypes' versus Clinical Feature #1: 'Time to Death'
| nPatients | nDeath | Duration Range (Median), Month | |
|---|---|---|---|
| ALL | 519 | 403 | 0.1 - 127.6 (9.9) |
| subtype1 | 177 | 145 | 0.2 - 127.6 (10.0) |
| subtype2 | 172 | 129 | 0.2 - 108.8 (9.2) |
| subtype3 | 170 | 129 | 0.1 - 92.6 (10.7) |
Figure S1. Get High-res Image Clustering Approach #1: 'mRNA CNMF subtypes' versus Clinical Feature #1: 'Time to Death'
P value = 0.0257 (ANOVA)
Table S3. Clustering Approach #1: 'mRNA CNMF subtypes' versus Clinical Feature #2: 'AGE'
| nPatients | Mean (Std.Dev) | |
|---|---|---|
| ALL | 519 | 57.7 (14.5) |
| subtype1 | 177 | 57.3 (12.8) |
| subtype2 | 172 | 55.8 (16.4) |
| subtype3 | 170 | 60.0 (13.7) |
Figure S2. Get High-res Image Clustering Approach #1: 'mRNA CNMF subtypes' versus Clinical Feature #2: 'AGE'
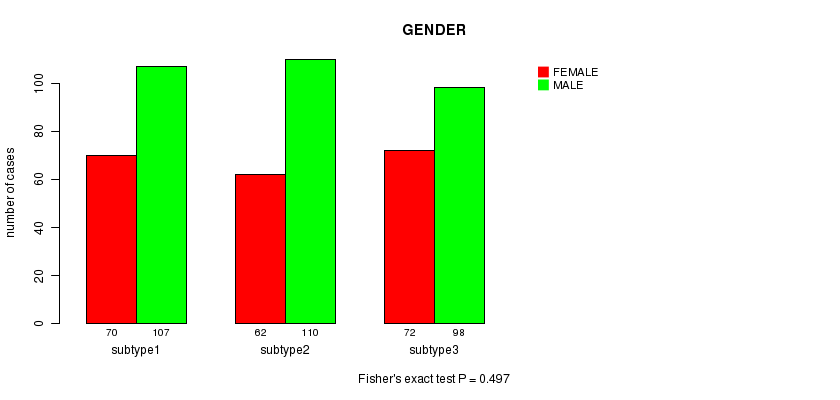
P value = 0.497 (Fisher's exact test)
Table S4. Clustering Approach #1: 'mRNA CNMF subtypes' versus Clinical Feature #3: 'GENDER'
| nPatients | FEMALE | MALE |
|---|---|---|
| ALL | 204 | 315 |
| subtype1 | 70 | 107 |
| subtype2 | 62 | 110 |
| subtype3 | 72 | 98 |
Figure S3. Get High-res Image Clustering Approach #1: 'mRNA CNMF subtypes' versus Clinical Feature #3: 'GENDER'
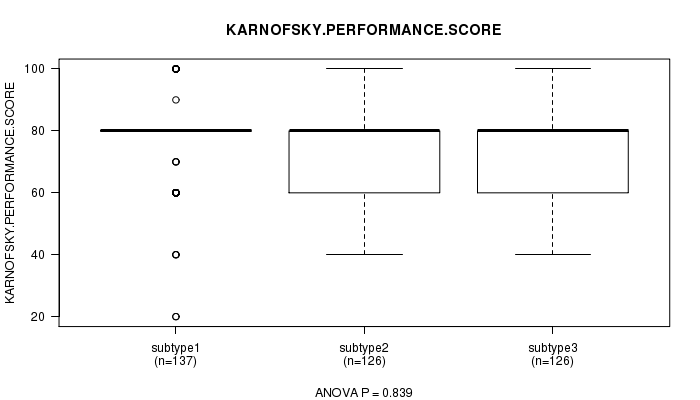
P value = 0.839 (ANOVA)
Table S5. Clustering Approach #1: 'mRNA CNMF subtypes' versus Clinical Feature #4: 'KARNOFSKY.PERFORMANCE.SCORE'
| nPatients | Mean (Std.Dev) | |
|---|---|---|
| ALL | 389 | 77.1 (14.4) |
| subtype1 | 137 | 77.5 (15.0) |
| subtype2 | 126 | 77.3 (13.0) |
| subtype3 | 126 | 76.5 (15.0) |
Figure S4. Get High-res Image Clustering Approach #1: 'mRNA CNMF subtypes' versus Clinical Feature #4: 'KARNOFSKY.PERFORMANCE.SCORE'
P value = 0.259 (Fisher's exact test)
Table S6. Clustering Approach #1: 'mRNA CNMF subtypes' versus Clinical Feature #5: 'RADIATIONS.RADIATION.REGIMENINDICATION'
| nPatients | NO | YES |
|---|---|---|
| ALL | 348 | 171 |
| subtype1 | 119 | 58 |
| subtype2 | 108 | 64 |
| subtype3 | 121 | 49 |
Figure S5. Get High-res Image Clustering Approach #1: 'mRNA CNMF subtypes' versus Clinical Feature #5: 'RADIATIONS.RADIATION.REGIMENINDICATION'
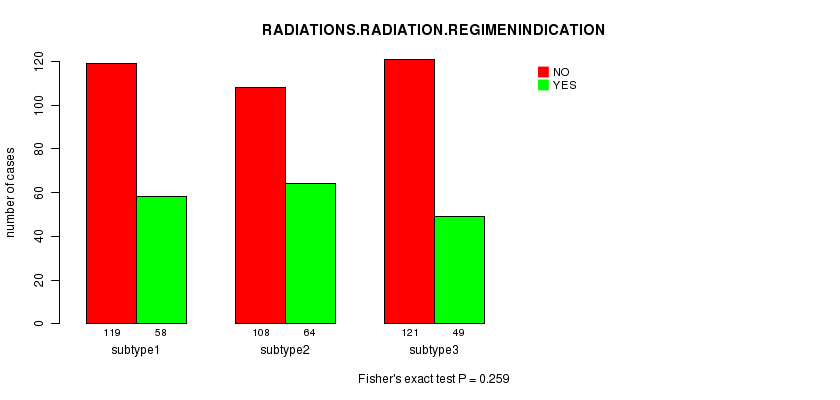
Table S7. Get Full Table Description of clustering approach #2: 'mRNA cHierClus subtypes'
| Cluster Labels | 1 | 2 | 3 |
|---|---|---|---|
| Number of samples | 223 | 127 | 169 |
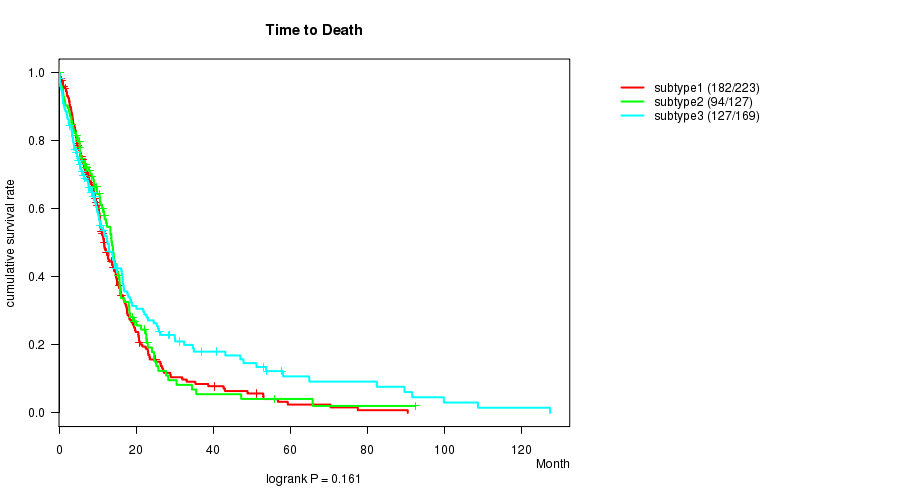
P value = 0.161 (logrank test)
Table S8. Clustering Approach #2: 'mRNA cHierClus subtypes' versus Clinical Feature #1: 'Time to Death'
| nPatients | nDeath | Duration Range (Median), Month | |
|---|---|---|---|
| ALL | 519 | 403 | 0.1 - 127.6 (9.9) |
| subtype1 | 223 | 182 | 0.1 - 90.6 (10.4) |
| subtype2 | 127 | 94 | 0.1 - 92.6 (9.8) |
| subtype3 | 169 | 127 | 0.2 - 127.6 (9.4) |
Figure S6. Get High-res Image Clustering Approach #2: 'mRNA cHierClus subtypes' versus Clinical Feature #1: 'Time to Death'
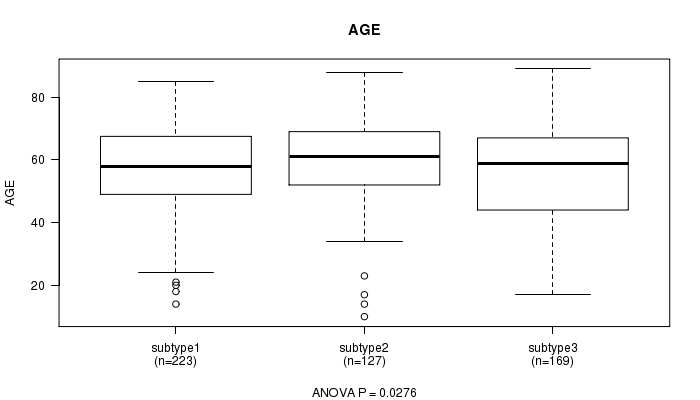
P value = 0.0276 (ANOVA)
Table S9. Clustering Approach #2: 'mRNA cHierClus subtypes' versus Clinical Feature #2: 'AGE'
| nPatients | Mean (Std.Dev) | |
|---|---|---|
| ALL | 519 | 57.7 (14.5) |
| subtype1 | 223 | 57.7 (13.4) |
| subtype2 | 127 | 60.3 (13.8) |
| subtype3 | 169 | 55.7 (16.0) |
Figure S7. Get High-res Image Clustering Approach #2: 'mRNA cHierClus subtypes' versus Clinical Feature #2: 'AGE'
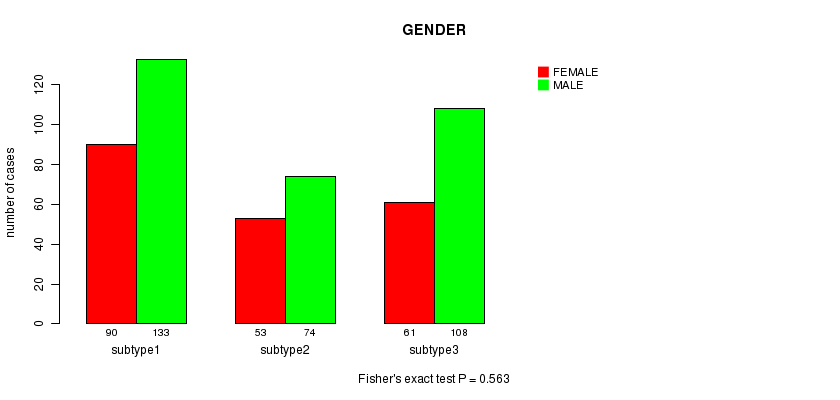
P value = 0.563 (Fisher's exact test)
Table S10. Clustering Approach #2: 'mRNA cHierClus subtypes' versus Clinical Feature #3: 'GENDER'
| nPatients | FEMALE | MALE |
|---|---|---|
| ALL | 204 | 315 |
| subtype1 | 90 | 133 |
| subtype2 | 53 | 74 |
| subtype3 | 61 | 108 |
Figure S8. Get High-res Image Clustering Approach #2: 'mRNA cHierClus subtypes' versus Clinical Feature #3: 'GENDER'
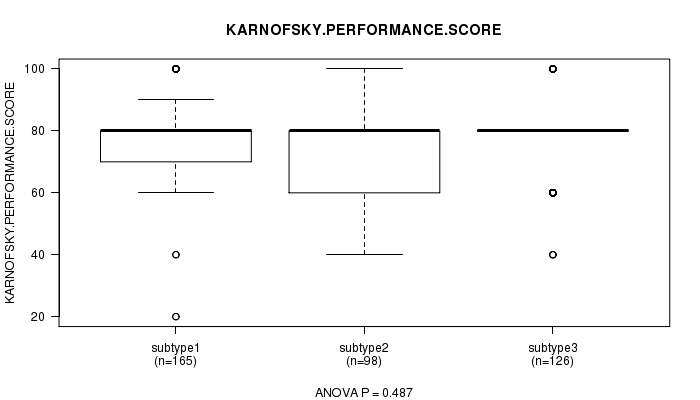
P value = 0.487 (ANOVA)
Table S11. Clustering Approach #2: 'mRNA cHierClus subtypes' versus Clinical Feature #4: 'KARNOFSKY.PERFORMANCE.SCORE'
| nPatients | Mean (Std.Dev) | |
|---|---|---|
| ALL | 389 | 77.1 (14.4) |
| subtype1 | 165 | 77.6 (14.4) |
| subtype2 | 98 | 75.6 (15.4) |
| subtype3 | 126 | 77.6 (13.5) |
Figure S9. Get High-res Image Clustering Approach #2: 'mRNA cHierClus subtypes' versus Clinical Feature #4: 'KARNOFSKY.PERFORMANCE.SCORE'
P value = 0.122 (Fisher's exact test)
Table S12. Clustering Approach #2: 'mRNA cHierClus subtypes' versus Clinical Feature #5: 'RADIATIONS.RADIATION.REGIMENINDICATION'
| nPatients | NO | YES |
|---|---|---|
| ALL | 348 | 171 |
| subtype1 | 156 | 67 |
| subtype2 | 89 | 38 |
| subtype3 | 103 | 66 |
Figure S10. Get High-res Image Clustering Approach #2: 'mRNA cHierClus subtypes' versus Clinical Feature #5: 'RADIATIONS.RADIATION.REGIMENINDICATION'
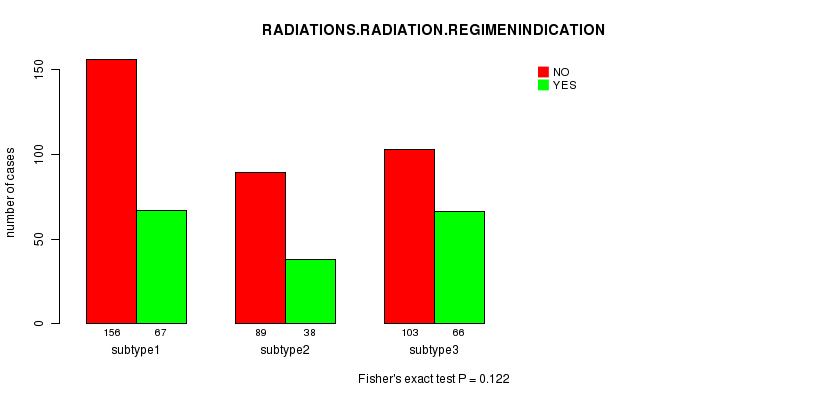
Table S13. Get Full Table Description of clustering approach #3: 'miR CNMF subtypes'
| Cluster Labels | 1 | 2 | 3 | 4 |
|---|---|---|---|---|
| Number of samples | 144 | 159 | 74 | 105 |
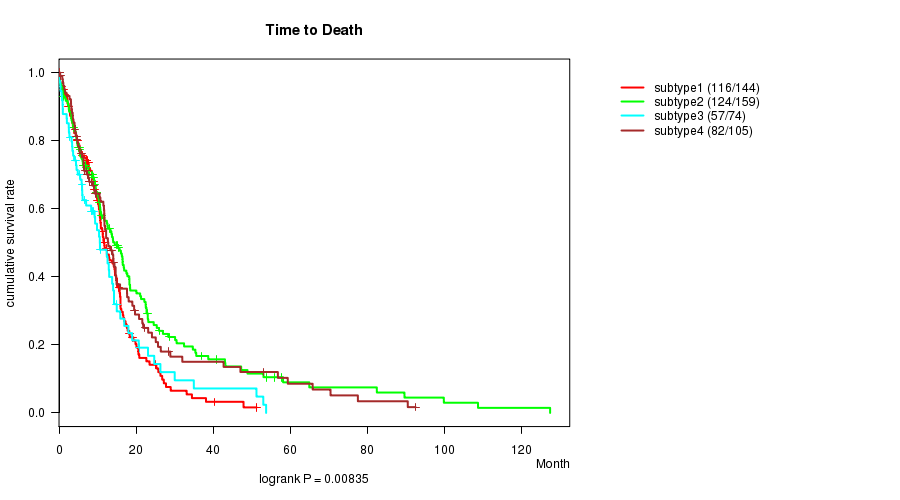
P value = 0.00835 (logrank test)
Table S14. Clustering Approach #3: 'miR CNMF subtypes' versus Clinical Feature #1: 'Time to Death'
| nPatients | nDeath | Duration Range (Median), Month | |
|---|---|---|---|
| ALL | 482 | 379 | 0.1 - 127.6 (10.3) |
| subtype1 | 144 | 116 | 0.1 - 51.3 (10.6) |
| subtype2 | 159 | 124 | 0.1 - 127.6 (10.6) |
| subtype3 | 74 | 57 | 0.1 - 53.8 (8.4) |
| subtype4 | 105 | 82 | 0.1 - 92.6 (10.8) |
Figure S11. Get High-res Image Clustering Approach #3: 'miR CNMF subtypes' versus Clinical Feature #1: 'Time to Death'
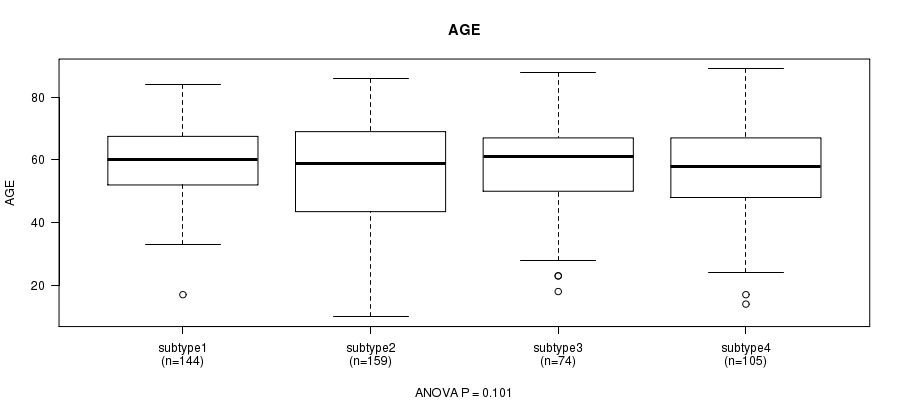
P value = 0.101 (ANOVA)
Table S15. Clustering Approach #3: 'miR CNMF subtypes' versus Clinical Feature #2: 'AGE'
| nPatients | Mean (Std.Dev) | |
|---|---|---|
| ALL | 482 | 57.5 (14.6) |
| subtype1 | 144 | 59.7 (11.4) |
| subtype2 | 159 | 55.5 (17.0) |
| subtype3 | 74 | 57.9 (15.3) |
| subtype4 | 105 | 57.4 (13.7) |
Figure S12. Get High-res Image Clustering Approach #3: 'miR CNMF subtypes' versus Clinical Feature #2: 'AGE'
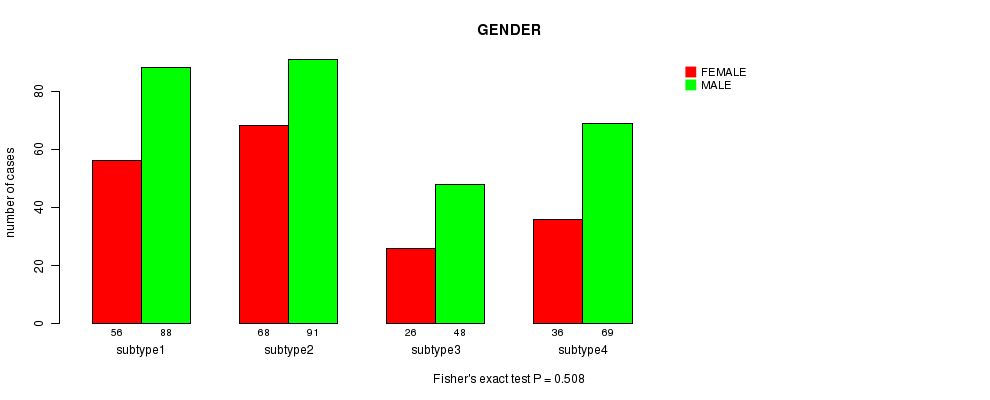
P value = 0.508 (Fisher's exact test)
Table S16. Clustering Approach #3: 'miR CNMF subtypes' versus Clinical Feature #3: 'GENDER'
| nPatients | FEMALE | MALE |
|---|---|---|
| ALL | 186 | 296 |
| subtype1 | 56 | 88 |
| subtype2 | 68 | 91 |
| subtype3 | 26 | 48 |
| subtype4 | 36 | 69 |
Figure S13. Get High-res Image Clustering Approach #3: 'miR CNMF subtypes' versus Clinical Feature #3: 'GENDER'
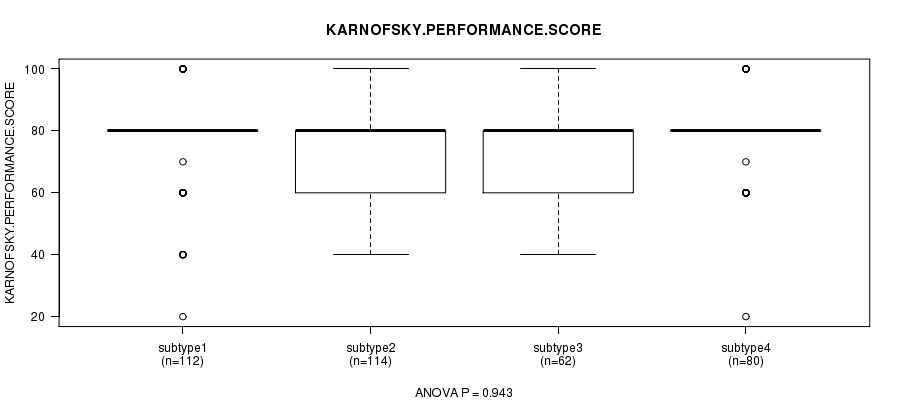
P value = 0.943 (ANOVA)
Table S17. Clustering Approach #3: 'miR CNMF subtypes' versus Clinical Feature #4: 'KARNOFSKY.PERFORMANCE.SCORE'
| nPatients | Mean (Std.Dev) | |
|---|---|---|
| ALL | 368 | 77.6 (14.1) |
| subtype1 | 112 | 77.6 (14.4) |
| subtype2 | 114 | 77.5 (14.1) |
| subtype3 | 62 | 76.9 (14.4) |
| subtype4 | 80 | 78.4 (13.8) |
Figure S14. Get High-res Image Clustering Approach #3: 'miR CNMF subtypes' versus Clinical Feature #4: 'KARNOFSKY.PERFORMANCE.SCORE'
P value = 0.638 (Fisher's exact test)
Table S18. Clustering Approach #3: 'miR CNMF subtypes' versus Clinical Feature #5: 'RADIATIONS.RADIATION.REGIMENINDICATION'
| nPatients | NO | YES |
|---|---|---|
| ALL | 327 | 155 |
| subtype1 | 102 | 42 |
| subtype2 | 108 | 51 |
| subtype3 | 46 | 28 |
| subtype4 | 71 | 34 |
Figure S15. Get High-res Image Clustering Approach #3: 'miR CNMF subtypes' versus Clinical Feature #5: 'RADIATIONS.RADIATION.REGIMENINDICATION'
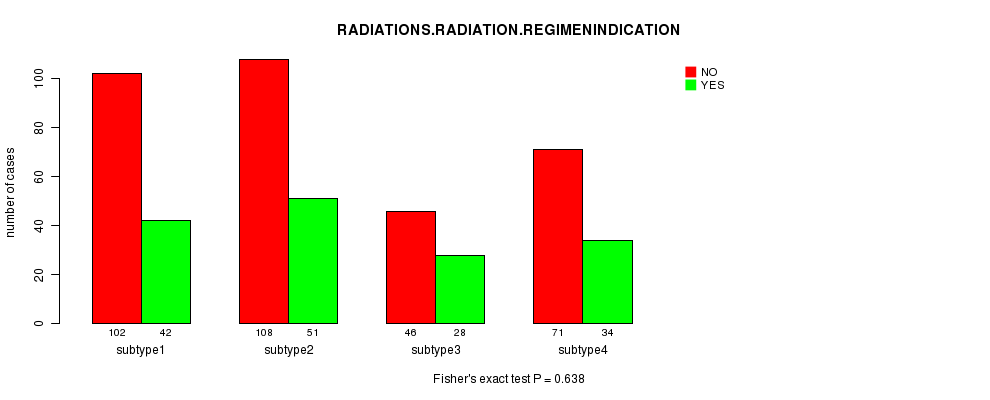
Table S19. Get Full Table Description of clustering approach #4: 'miR cHierClus subtypes'
| Cluster Labels | 1 | 2 | 3 |
|---|---|---|---|
| Number of samples | 170 | 180 | 132 |
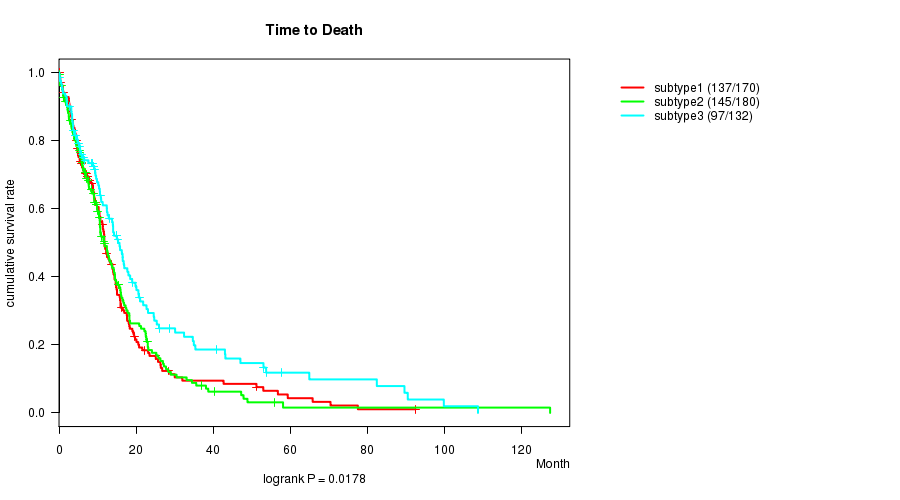
P value = 0.0178 (logrank test)
Table S20. Clustering Approach #4: 'miR cHierClus subtypes' versus Clinical Feature #1: 'Time to Death'
| nPatients | nDeath | Duration Range (Median), Month | |
|---|---|---|---|
| ALL | 482 | 379 | 0.1 - 127.6 (10.3) |
| subtype1 | 170 | 137 | 0.1 - 92.6 (9.8) |
| subtype2 | 180 | 145 | 0.1 - 127.6 (10.0) |
| subtype3 | 132 | 97 | 0.1 - 108.8 (10.7) |
Figure S16. Get High-res Image Clustering Approach #4: 'miR cHierClus subtypes' versus Clinical Feature #1: 'Time to Death'
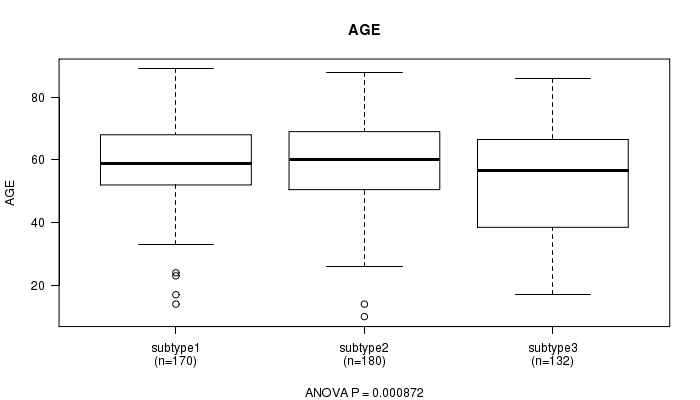
P value = 0.000872 (ANOVA)
Table S21. Clustering Approach #4: 'miR cHierClus subtypes' versus Clinical Feature #2: 'AGE'
| nPatients | Mean (Std.Dev) | |
|---|---|---|
| ALL | 482 | 57.5 (14.6) |
| subtype1 | 170 | 59.2 (12.6) |
| subtype2 | 180 | 58.9 (13.3) |
| subtype3 | 132 | 53.5 (17.6) |
Figure S17. Get High-res Image Clustering Approach #4: 'miR cHierClus subtypes' versus Clinical Feature #2: 'AGE'
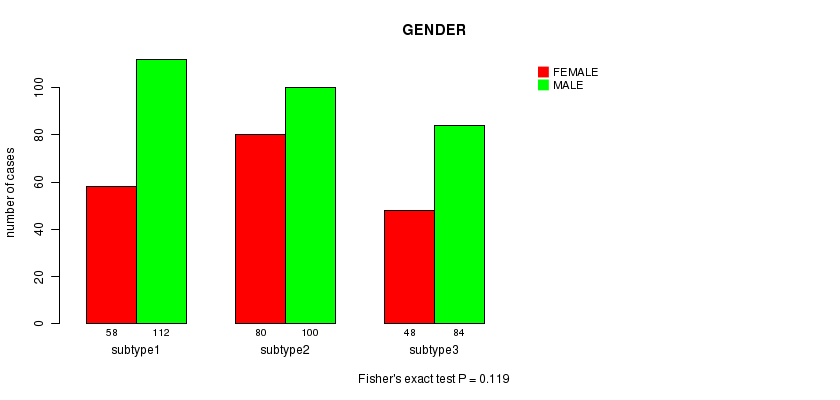
P value = 0.119 (Fisher's exact test)
Table S22. Clustering Approach #4: 'miR cHierClus subtypes' versus Clinical Feature #3: 'GENDER'
| nPatients | FEMALE | MALE |
|---|---|---|
| ALL | 186 | 296 |
| subtype1 | 58 | 112 |
| subtype2 | 80 | 100 |
| subtype3 | 48 | 84 |
Figure S18. Get High-res Image Clustering Approach #4: 'miR cHierClus subtypes' versus Clinical Feature #3: 'GENDER'
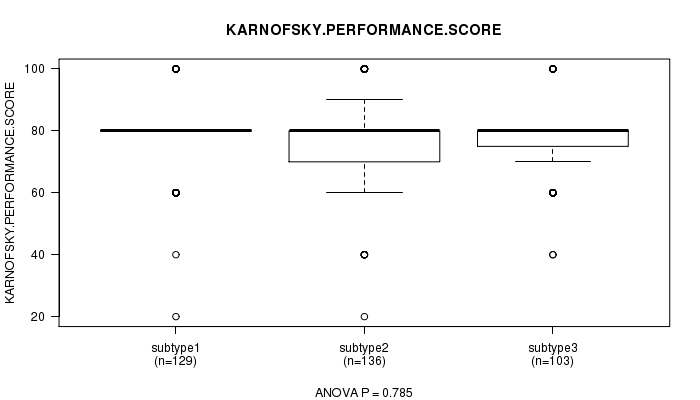
P value = 0.785 (ANOVA)
Table S23. Clustering Approach #4: 'miR cHierClus subtypes' versus Clinical Feature #4: 'KARNOFSKY.PERFORMANCE.SCORE'
| nPatients | Mean (Std.Dev) | |
|---|---|---|
| ALL | 368 | 77.6 (14.1) |
| subtype1 | 129 | 78.3 (13.5) |
| subtype2 | 136 | 77.1 (15.5) |
| subtype3 | 103 | 77.4 (13.1) |
Figure S19. Get High-res Image Clustering Approach #4: 'miR cHierClus subtypes' versus Clinical Feature #4: 'KARNOFSKY.PERFORMANCE.SCORE'
P value = 0.758 (Fisher's exact test)
Table S24. Clustering Approach #4: 'miR cHierClus subtypes' versus Clinical Feature #5: 'RADIATIONS.RADIATION.REGIMENINDICATION'
| nPatients | NO | YES |
|---|---|---|
| ALL | 327 | 155 |
| subtype1 | 113 | 57 |
| subtype2 | 121 | 59 |
| subtype3 | 93 | 39 |
Figure S20. Get High-res Image Clustering Approach #4: 'miR cHierClus subtypes' versus Clinical Feature #5: 'RADIATIONS.RADIATION.REGIMENINDICATION'
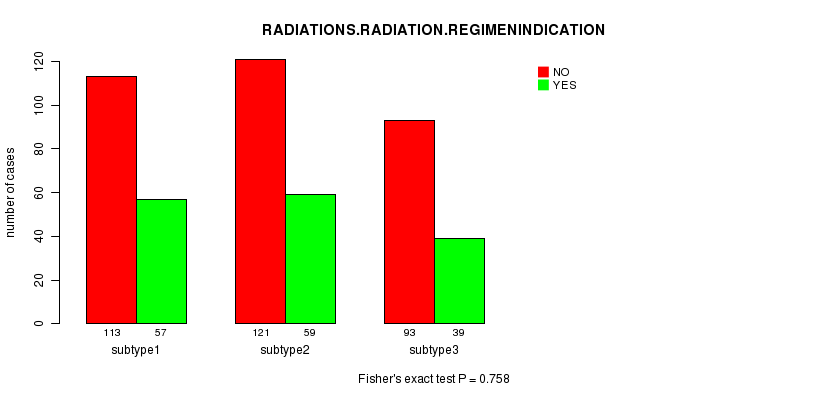
Table S25. Get Full Table Description of clustering approach #5: 'CN CNMF'
| Cluster Labels | 1 | 2 | 3 |
|---|---|---|---|
| Number of samples | 159 | 210 | 175 |
P value = 0.0332 (logrank test)
Table S26. Clustering Approach #5: 'CN CNMF' versus Clinical Feature #1: 'Time to Death'
| nPatients | nDeath | Duration Range (Median), Month | |
|---|---|---|---|
| ALL | 544 | 411 | 0.1 - 127.6 (9.6) |
| subtype1 | 159 | 125 | 0.1 - 127.6 (9.1) |
| subtype2 | 210 | 160 | 0.1 - 77.6 (9.9) |
| subtype3 | 175 | 126 | 0.1 - 108.8 (10.3) |
Figure S21. Get High-res Image Clustering Approach #5: 'CN CNMF' versus Clinical Feature #1: 'Time to Death'
P value = 1.16e-06 (ANOVA)
Table S27. Clustering Approach #5: 'CN CNMF' versus Clinical Feature #2: 'AGE'
| nPatients | Mean (Std.Dev) | |
|---|---|---|
| ALL | 544 | 57.8 (14.3) |
| subtype1 | 159 | 59.1 (14.7) |
| subtype2 | 210 | 60.6 (10.6) |
| subtype3 | 175 | 53.3 (16.6) |
Figure S22. Get High-res Image Clustering Approach #5: 'CN CNMF' versus Clinical Feature #2: 'AGE'
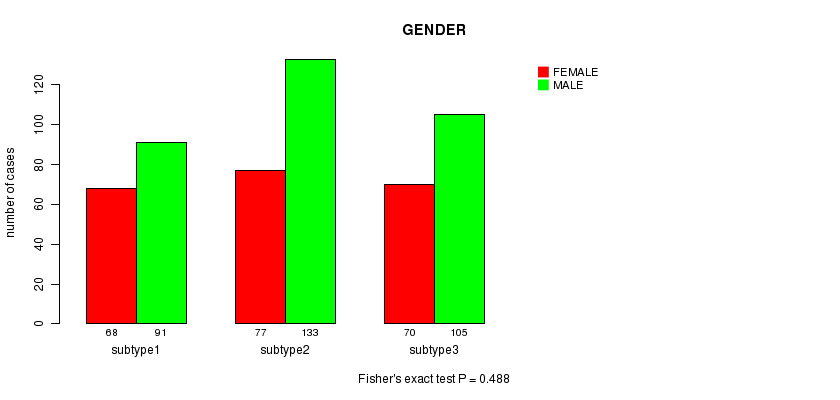
P value = 0.488 (Fisher's exact test)
Table S28. Clustering Approach #5: 'CN CNMF' versus Clinical Feature #3: 'GENDER'
| nPatients | FEMALE | MALE |
|---|---|---|
| ALL | 215 | 329 |
| subtype1 | 68 | 91 |
| subtype2 | 77 | 133 |
| subtype3 | 70 | 105 |
Figure S23. Get High-res Image Clustering Approach #5: 'CN CNMF' versus Clinical Feature #3: 'GENDER'
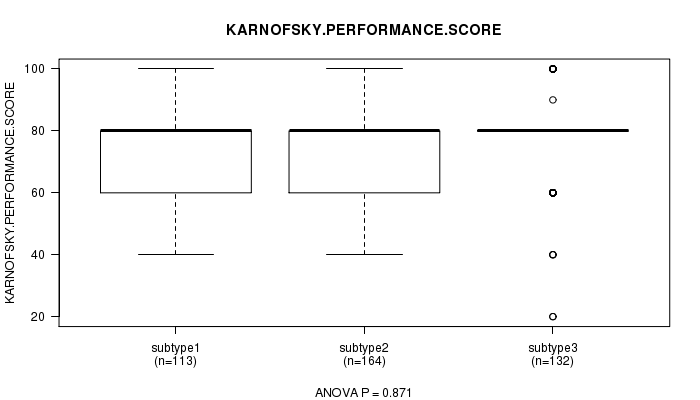
P value = 0.871 (ANOVA)
Table S29. Clustering Approach #5: 'CN CNMF' versus Clinical Feature #4: 'KARNOFSKY.PERFORMANCE.SCORE'
| nPatients | Mean (Std.Dev) | |
|---|---|---|
| ALL | 409 | 77.3 (14.7) |
| subtype1 | 113 | 76.8 (14.0) |
| subtype2 | 164 | 77.3 (15.7) |
| subtype3 | 132 | 77.8 (14.2) |
Figure S24. Get High-res Image Clustering Approach #5: 'CN CNMF' versus Clinical Feature #4: 'KARNOFSKY.PERFORMANCE.SCORE'
P value = 0.1 (Fisher's exact test)
Table S30. Clustering Approach #5: 'CN CNMF' versus Clinical Feature #5: 'RADIATIONS.RADIATION.REGIMENINDICATION'
| nPatients | NO | YES |
|---|---|---|
| ALL | 369 | 175 |
| subtype1 | 98 | 61 |
| subtype2 | 144 | 66 |
| subtype3 | 127 | 48 |
Figure S25. Get High-res Image Clustering Approach #5: 'CN CNMF' versus Clinical Feature #5: 'RADIATIONS.RADIATION.REGIMENINDICATION'
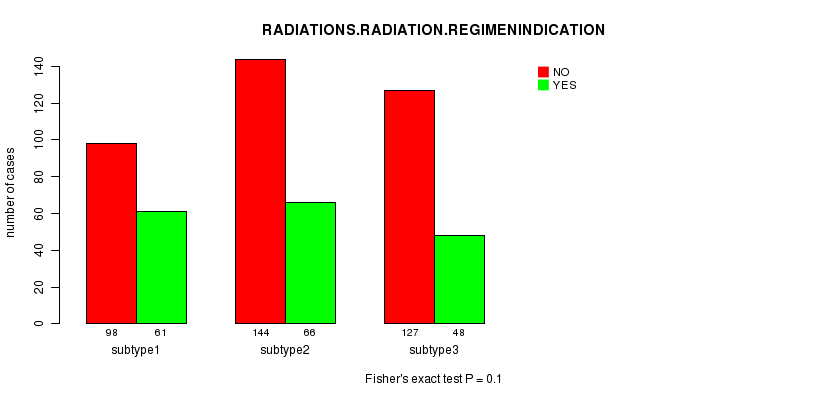
Table S31. Get Full Table Description of clustering approach #6: 'METHLYATION CNMF'
| Cluster Labels | 1 | 2 | 3 | 4 |
|---|---|---|---|---|
| Number of samples | 34 | 19 | 26 | 27 |
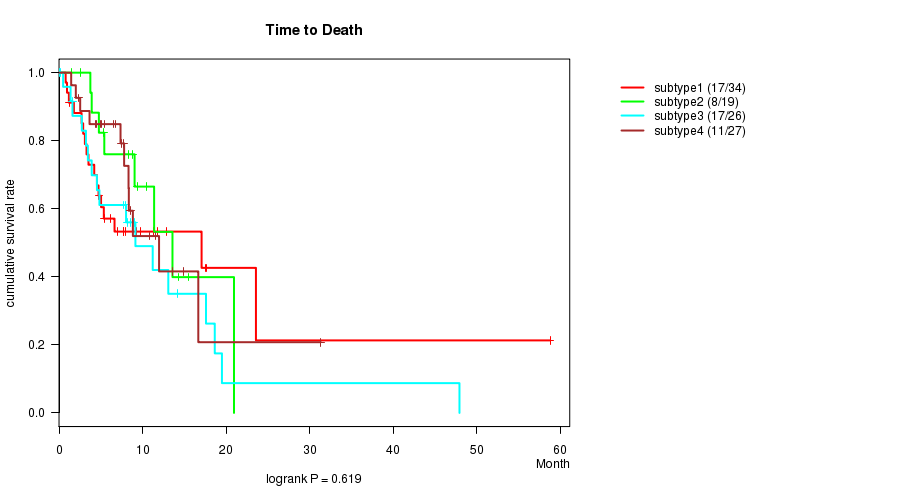
P value = 0.619 (logrank test)
Table S32. Clustering Approach #6: 'METHLYATION CNMF' versus Clinical Feature #1: 'Time to Death'
| nPatients | nDeath | Duration Range (Median), Month | |
|---|---|---|---|
| ALL | 106 | 53 | 0.1 - 58.8 (6.9) |
| subtype1 | 34 | 17 | 0.8 - 58.8 (5.4) |
| subtype2 | 19 | 8 | 1.6 - 20.9 (8.3) |
| subtype3 | 26 | 17 | 0.1 - 47.9 (7.9) |
| subtype4 | 27 | 11 | 1.4 - 31.3 (7.5) |
Figure S26. Get High-res Image Clustering Approach #6: 'METHLYATION CNMF' versus Clinical Feature #1: 'Time to Death'
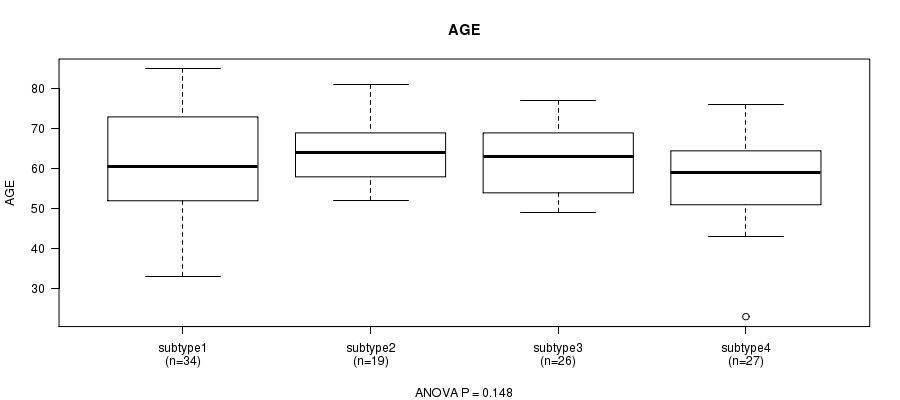
P value = 0.148 (ANOVA)
Table S33. Clustering Approach #6: 'METHLYATION CNMF' versus Clinical Feature #2: 'AGE'
| nPatients | Mean (Std.Dev) | |
|---|---|---|
| ALL | 106 | 61.2 (11.5) |
| subtype1 | 34 | 61.3 (14.1) |
| subtype2 | 19 | 64.8 (8.0) |
| subtype3 | 26 | 62.5 (8.5) |
| subtype4 | 27 | 57.3 (11.8) |
Figure S27. Get High-res Image Clustering Approach #6: 'METHLYATION CNMF' versus Clinical Feature #2: 'AGE'
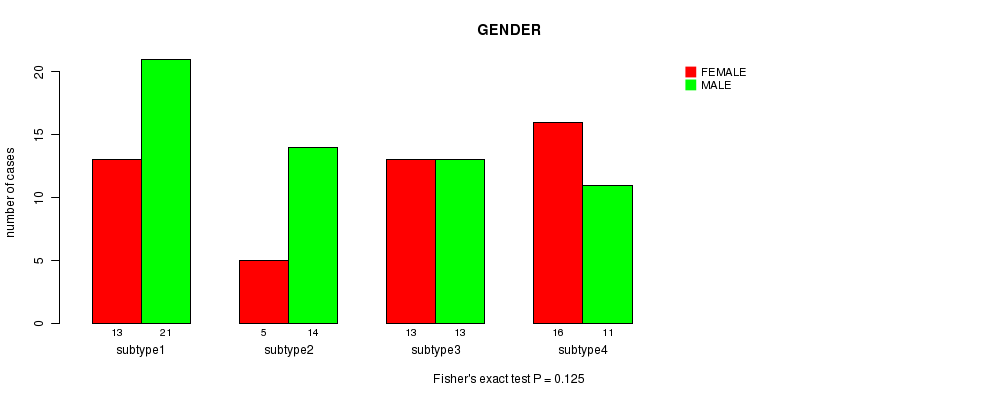
P value = 0.125 (Fisher's exact test)
Table S34. Clustering Approach #6: 'METHLYATION CNMF' versus Clinical Feature #3: 'GENDER'
| nPatients | FEMALE | MALE |
|---|---|---|
| ALL | 47 | 59 |
| subtype1 | 13 | 21 |
| subtype2 | 5 | 14 |
| subtype3 | 13 | 13 |
| subtype4 | 16 | 11 |
Figure S28. Get High-res Image Clustering Approach #6: 'METHLYATION CNMF' versus Clinical Feature #3: 'GENDER'
P value = 0.945 (ANOVA)
Table S35. Clustering Approach #6: 'METHLYATION CNMF' versus Clinical Feature #4: 'KARNOFSKY.PERFORMANCE.SCORE'
| nPatients | Mean (Std.Dev) | |
|---|---|---|
| ALL | 80 | 76.5 (15.2) |
| subtype1 | 23 | 77.0 (17.9) |
| subtype2 | 13 | 76.2 (16.6) |
| subtype3 | 22 | 75.0 (15.0) |
| subtype4 | 22 | 77.7 (11.9) |
Figure S29. Get High-res Image Clustering Approach #6: 'METHLYATION CNMF' versus Clinical Feature #4: 'KARNOFSKY.PERFORMANCE.SCORE'
P value = 0.549 (Fisher's exact test)
Table S36. Clustering Approach #6: 'METHLYATION CNMF' versus Clinical Feature #5: 'RADIATIONS.RADIATION.REGIMENINDICATION'
| nPatients | NO | YES |
|---|---|---|
| ALL | 74 | 32 |
| subtype1 | 26 | 8 |
| subtype2 | 12 | 7 |
| subtype3 | 16 | 10 |
| subtype4 | 20 | 7 |
Figure S30. Get High-res Image Clustering Approach #6: 'METHLYATION CNMF' versus Clinical Feature #5: 'RADIATIONS.RADIATION.REGIMENINDICATION'
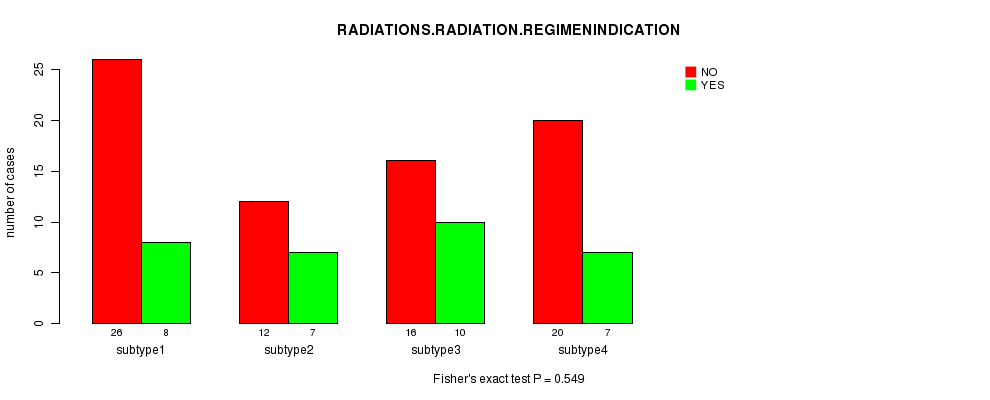
Table S37. Get Full Table Description of clustering approach #7: 'RPPA CNMF subtypes'
| Cluster Labels | 1 | 2 | 3 | 4 |
|---|---|---|---|---|
| Number of samples | 58 | 60 | 43 | 49 |
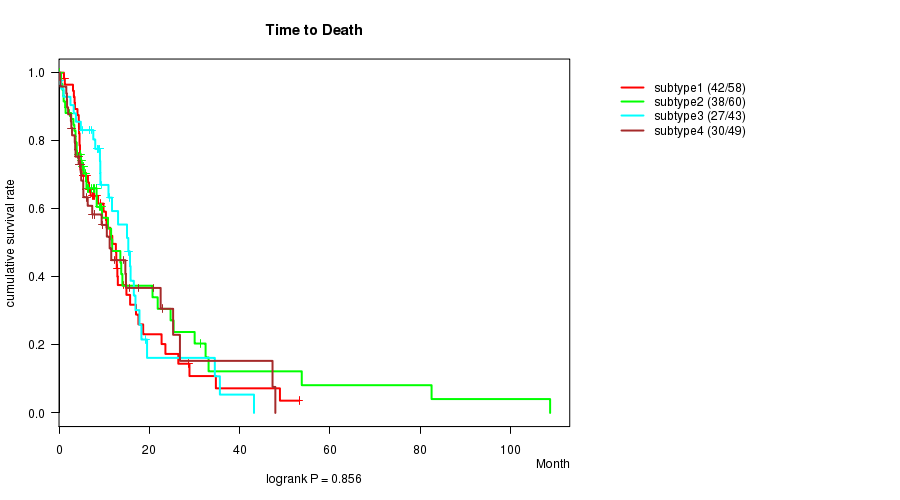
P value = 0.856 (logrank test)
Table S38. Clustering Approach #7: 'RPPA CNMF subtypes' versus Clinical Feature #1: 'Time to Death'
| nPatients | nDeath | Duration Range (Median), Month | |
|---|---|---|---|
| ALL | 210 | 137 | 0.1 - 108.8 (7.9) |
| subtype1 | 58 | 42 | 0.1 - 53.2 (8.1) |
| subtype2 | 60 | 38 | 0.2 - 108.8 (6.5) |
| subtype3 | 43 | 27 | 0.1 - 43.2 (9.1) |
| subtype4 | 49 | 30 | 0.2 - 47.9 (6.3) |
Figure S31. Get High-res Image Clustering Approach #7: 'RPPA CNMF subtypes' versus Clinical Feature #1: 'Time to Death'
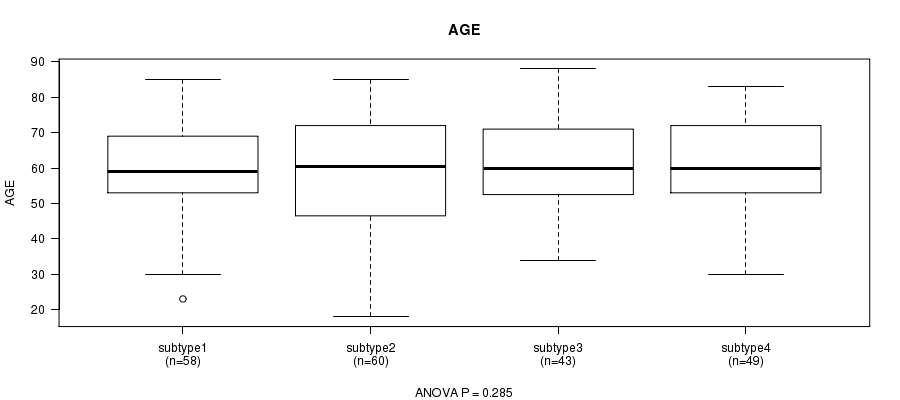
P value = 0.285 (ANOVA)
Table S39. Clustering Approach #7: 'RPPA CNMF subtypes' versus Clinical Feature #2: 'AGE'
| nPatients | Mean (Std.Dev) | |
|---|---|---|
| ALL | 210 | 59.9 (14.1) |
| subtype1 | 58 | 59.5 (13.6) |
| subtype2 | 60 | 57.4 (16.9) |
| subtype3 | 43 | 61.8 (12.1) |
| subtype4 | 49 | 62.0 (12.0) |
Figure S32. Get High-res Image Clustering Approach #7: 'RPPA CNMF subtypes' versus Clinical Feature #2: 'AGE'
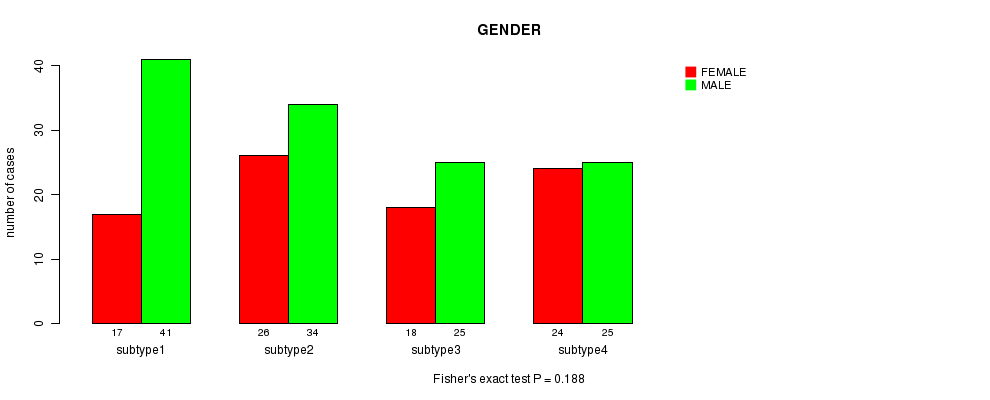
P value = 0.188 (Fisher's exact test)
Table S40. Clustering Approach #7: 'RPPA CNMF subtypes' versus Clinical Feature #3: 'GENDER'
| nPatients | FEMALE | MALE |
|---|---|---|
| ALL | 85 | 125 |
| subtype1 | 17 | 41 |
| subtype2 | 26 | 34 |
| subtype3 | 18 | 25 |
| subtype4 | 24 | 25 |
Figure S33. Get High-res Image Clustering Approach #7: 'RPPA CNMF subtypes' versus Clinical Feature #3: 'GENDER'
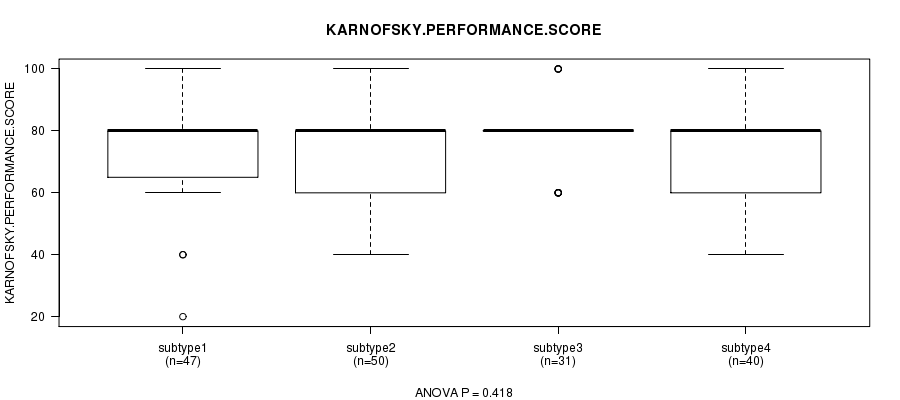
P value = 0.418 (ANOVA)
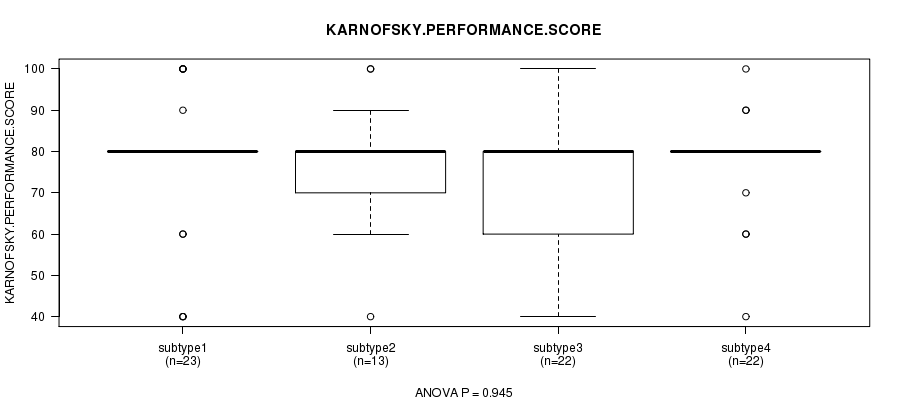
Table S41. Clustering Approach #7: 'RPPA CNMF subtypes' versus Clinical Feature #4: 'KARNOFSKY.PERFORMANCE.SCORE'
| nPatients | Mean (Std.Dev) | |
|---|---|---|
| ALL | 168 | 75.6 (15.3) |
| subtype1 | 47 | 75.1 (15.7) |
| subtype2 | 50 | 76.4 (16.5) |
| subtype3 | 31 | 78.7 (11.5) |
| subtype4 | 40 | 72.8 (15.8) |
Figure S34. Get High-res Image Clustering Approach #7: 'RPPA CNMF subtypes' versus Clinical Feature #4: 'KARNOFSKY.PERFORMANCE.SCORE'
P value = 0.614 (Fisher's exact test)
Table S42. Clustering Approach #7: 'RPPA CNMF subtypes' versus Clinical Feature #5: 'RADIATIONS.RADIATION.REGIMENINDICATION'
| nPatients | NO | YES |
|---|---|---|
| ALL | 150 | 60 |
| subtype1 | 40 | 18 |
| subtype2 | 43 | 17 |
| subtype3 | 34 | 9 |
| subtype4 | 33 | 16 |
Figure S35. Get High-res Image Clustering Approach #7: 'RPPA CNMF subtypes' versus Clinical Feature #5: 'RADIATIONS.RADIATION.REGIMENINDICATION'
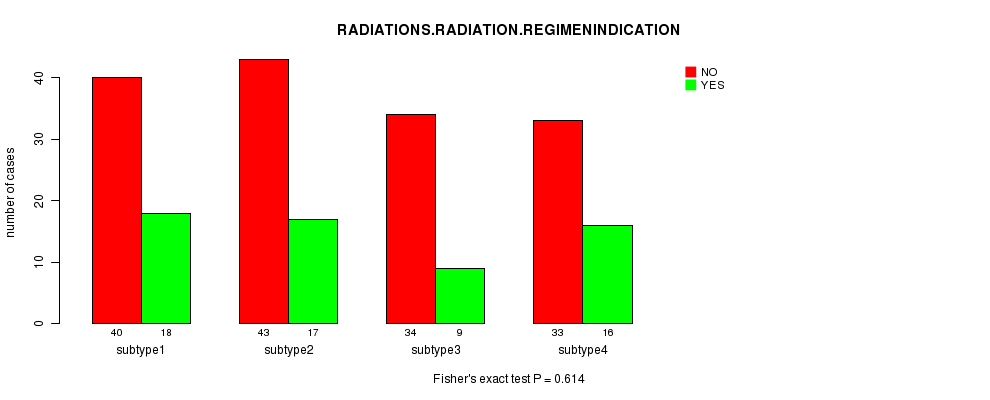
Table S43. Get Full Table Description of clustering approach #8: 'RPPA cHierClus subtypes'
| Cluster Labels | 1 | 2 | 3 |
|---|---|---|---|
| Number of samples | 97 | 72 | 41 |
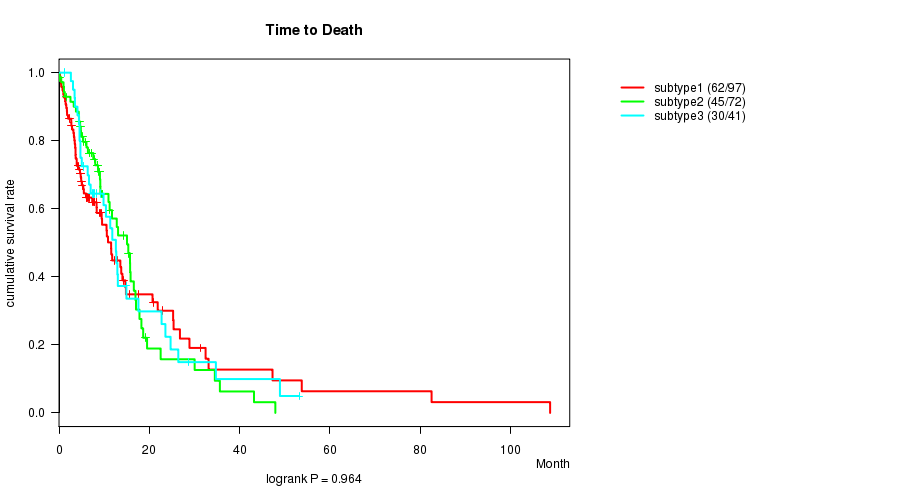
P value = 0.964 (logrank test)
Table S44. Clustering Approach #8: 'RPPA cHierClus subtypes' versus Clinical Feature #1: 'Time to Death'
| nPatients | nDeath | Duration Range (Median), Month | |
|---|---|---|---|
| ALL | 210 | 137 | 0.1 - 108.8 (7.9) |
| subtype1 | 97 | 62 | 0.2 - 108.8 (6.5) |
| subtype2 | 72 | 45 | 0.1 - 47.9 (8.7) |
| subtype3 | 41 | 30 | 1.2 - 53.2 (8.3) |
Figure S36. Get High-res Image Clustering Approach #8: 'RPPA cHierClus subtypes' versus Clinical Feature #1: 'Time to Death'
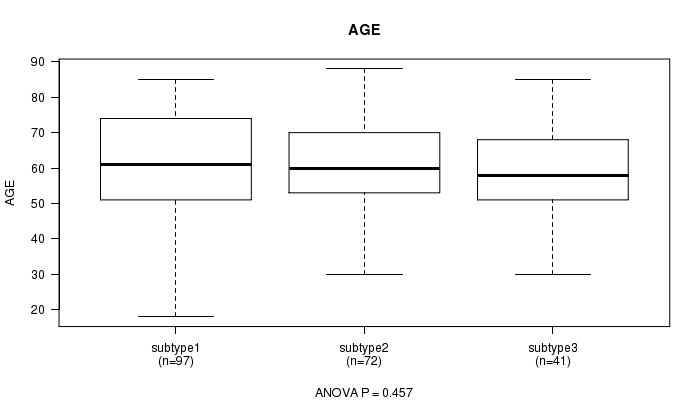
P value = 0.457 (ANOVA)
Table S45. Clustering Approach #8: 'RPPA cHierClus subtypes' versus Clinical Feature #2: 'AGE'
| nPatients | Mean (Std.Dev) | |
|---|---|---|
| ALL | 210 | 59.9 (14.1) |
| subtype1 | 97 | 59.9 (15.6) |
| subtype2 | 72 | 61.2 (12.1) |
| subtype3 | 41 | 57.8 (13.6) |
Figure S37. Get High-res Image Clustering Approach #8: 'RPPA cHierClus subtypes' versus Clinical Feature #2: 'AGE'
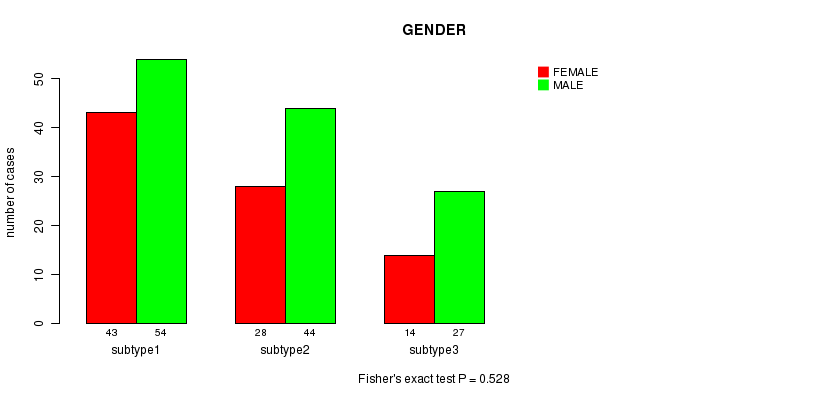
P value = 0.528 (Fisher's exact test)
Table S46. Clustering Approach #8: 'RPPA cHierClus subtypes' versus Clinical Feature #3: 'GENDER'
| nPatients | FEMALE | MALE |
|---|---|---|
| ALL | 85 | 125 |
| subtype1 | 43 | 54 |
| subtype2 | 28 | 44 |
| subtype3 | 14 | 27 |
Figure S38. Get High-res Image Clustering Approach #8: 'RPPA cHierClus subtypes' versus Clinical Feature #3: 'GENDER'
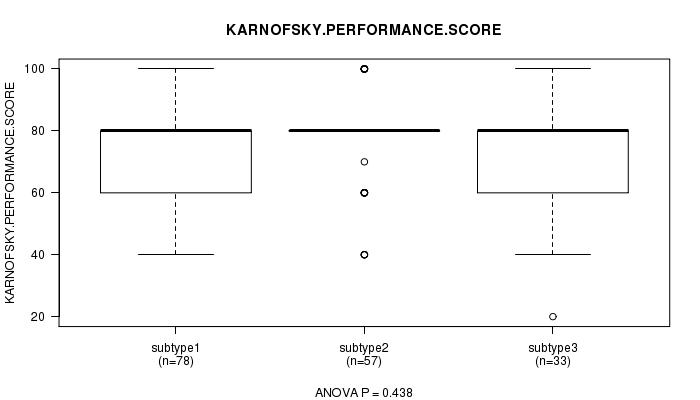
P value = 0.438 (ANOVA)
Table S47. Clustering Approach #8: 'RPPA cHierClus subtypes' versus Clinical Feature #4: 'KARNOFSKY.PERFORMANCE.SCORE'
| nPatients | Mean (Std.Dev) | |
|---|---|---|
| ALL | 168 | 75.6 (15.3) |
| subtype1 | 78 | 74.5 (14.9) |
| subtype2 | 57 | 77.7 (15.0) |
| subtype3 | 33 | 74.5 (16.8) |
Figure S39. Get High-res Image Clustering Approach #8: 'RPPA cHierClus subtypes' versus Clinical Feature #4: 'KARNOFSKY.PERFORMANCE.SCORE'
P value = 0.303 (Fisher's exact test)
Table S48. Clustering Approach #8: 'RPPA cHierClus subtypes' versus Clinical Feature #5: 'RADIATIONS.RADIATION.REGIMENINDICATION'
| nPatients | NO | YES |
|---|---|---|
| ALL | 150 | 60 |
| subtype1 | 65 | 32 |
| subtype2 | 56 | 16 |
| subtype3 | 29 | 12 |
Figure S40. Get High-res Image Clustering Approach #8: 'RPPA cHierClus subtypes' versus Clinical Feature #5: 'RADIATIONS.RADIATION.REGIMENINDICATION'
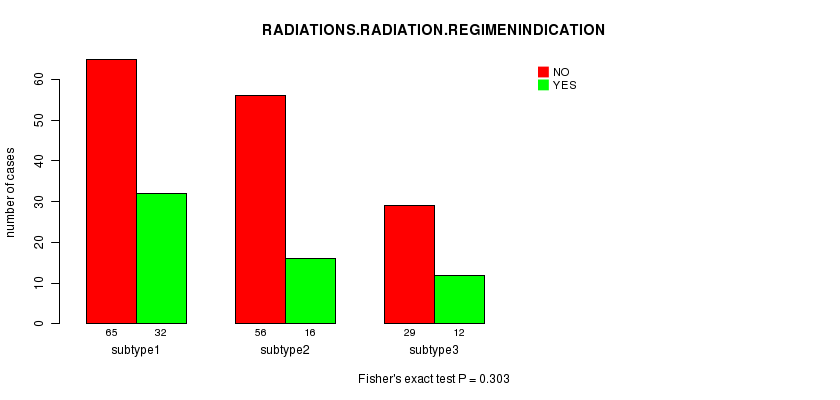
Table S49. Get Full Table Description of clustering approach #9: 'RNAseq CNMF subtypes'
| Cluster Labels | 1 | 2 | 3 | 4 | 5 | 6 |
|---|---|---|---|---|---|---|
| Number of samples | 37 | 32 | 28 | 24 | 6 | 25 |
P value = 0.371 (logrank test)
Table S50. Clustering Approach #9: 'RNAseq CNMF subtypes' versus Clinical Feature #1: 'Time to Death'
| nPatients | nDeath | Duration Range (Median), Month | |
|---|---|---|---|
| ALL | 152 | 99 | 0.2 - 54.0 (8.7) |
| subtype1 | 37 | 23 | 0.2 - 54.0 (8.8) |
| subtype2 | 32 | 22 | 0.4 - 29.0 (7.2) |
| subtype3 | 28 | 19 | 2.5 - 47.9 (11.3) |
| subtype4 | 24 | 15 | 0.2 - 31.3 (5.3) |
| subtype5 | 6 | 3 | 1.1 - 40.4 (5.8) |
| subtype6 | 25 | 17 | 1.2 - 33.1 (9.9) |
Figure S41. Get High-res Image Clustering Approach #9: 'RNAseq CNMF subtypes' versus Clinical Feature #1: 'Time to Death'
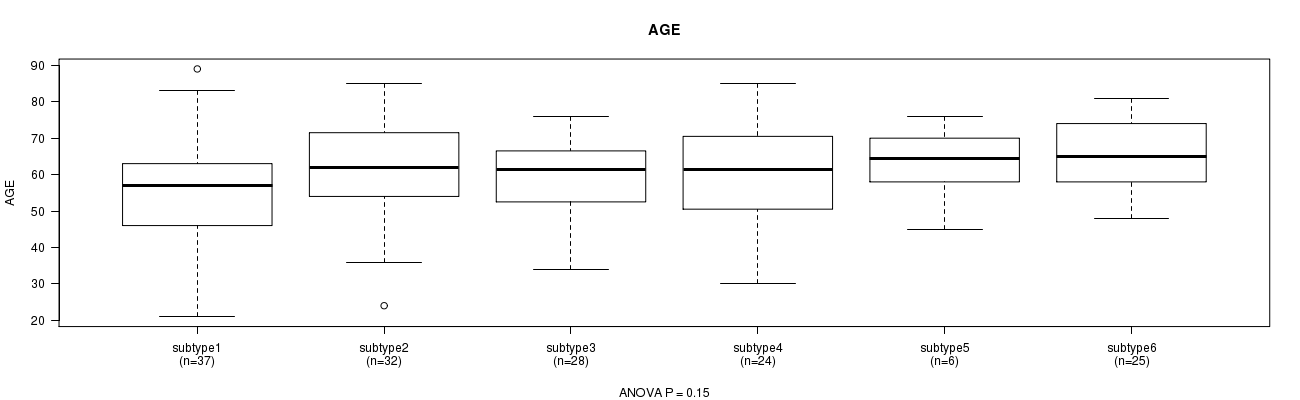
P value = 0.15 (ANOVA)
Table S51. Clustering Approach #9: 'RNAseq CNMF subtypes' versus Clinical Feature #2: 'AGE'
| nPatients | Mean (Std.Dev) | |
|---|---|---|
| ALL | 152 | 60.1 (13.2) |
| subtype1 | 37 | 56.0 (16.1) |
| subtype2 | 32 | 60.5 (13.0) |
| subtype3 | 28 | 59.2 (10.4) |
| subtype4 | 24 | 60.8 (13.3) |
| subtype5 | 6 | 63.0 (10.7) |
| subtype6 | 25 | 65.4 (10.8) |
Figure S42. Get High-res Image Clustering Approach #9: 'RNAseq CNMF subtypes' versus Clinical Feature #2: 'AGE'
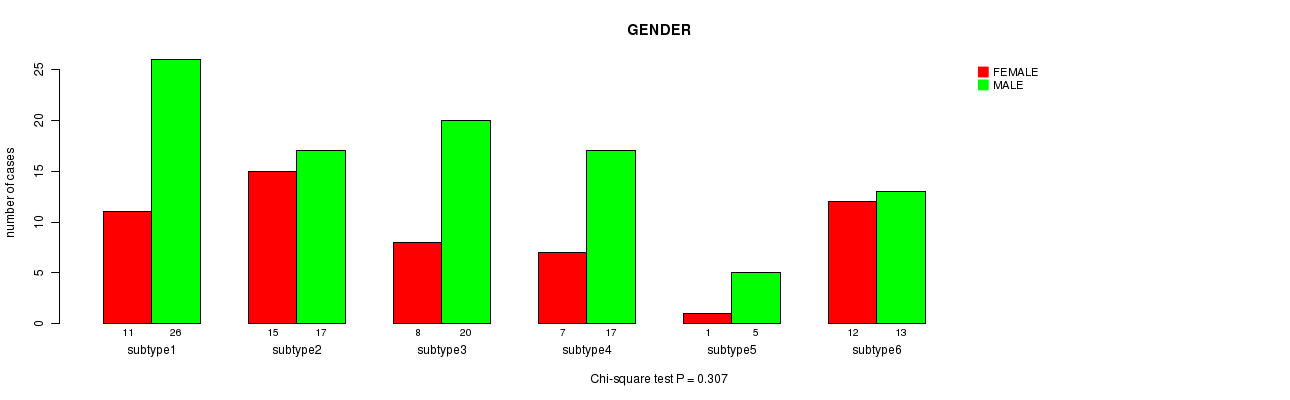
P value = 0.307 (Chi-square test)
Table S52. Clustering Approach #9: 'RNAseq CNMF subtypes' versus Clinical Feature #3: 'GENDER'
| nPatients | FEMALE | MALE |
|---|---|---|
| ALL | 54 | 98 |
| subtype1 | 11 | 26 |
| subtype2 | 15 | 17 |
| subtype3 | 8 | 20 |
| subtype4 | 7 | 17 |
| subtype5 | 1 | 5 |
| subtype6 | 12 | 13 |
Figure S43. Get High-res Image Clustering Approach #9: 'RNAseq CNMF subtypes' versus Clinical Feature #3: 'GENDER'
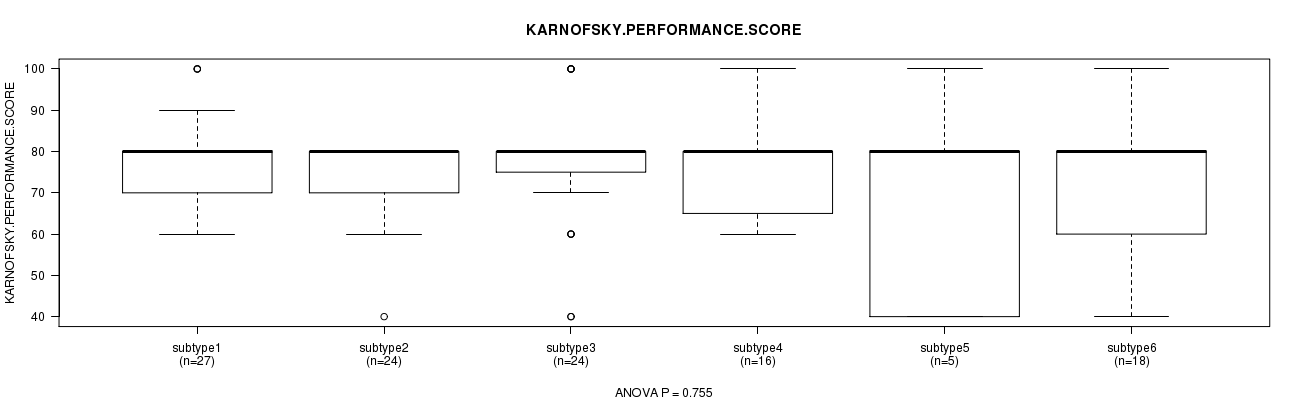
P value = 0.755 (ANOVA)
Table S53. Clustering Approach #9: 'RNAseq CNMF subtypes' versus Clinical Feature #4: 'KARNOFSKY.PERFORMANCE.SCORE'
| nPatients | Mean (Std.Dev) | |
|---|---|---|
| ALL | 114 | 75.6 (14.4) |
| subtype1 | 27 | 77.4 (12.3) |
| subtype2 | 24 | 74.2 (11.0) |
| subtype3 | 24 | 77.1 (16.0) |
| subtype4 | 16 | 76.9 (12.5) |
| subtype5 | 5 | 68.0 (26.8) |
| subtype6 | 18 | 73.9 (17.2) |
Figure S44. Get High-res Image Clustering Approach #9: 'RNAseq CNMF subtypes' versus Clinical Feature #4: 'KARNOFSKY.PERFORMANCE.SCORE'
P value = 0.19 (Chi-square test)
Table S54. Clustering Approach #9: 'RNAseq CNMF subtypes' versus Clinical Feature #5: 'RADIATIONS.RADIATION.REGIMENINDICATION'
| nPatients | NO | YES |
|---|---|---|
| ALL | 97 | 55 |
| subtype1 | 26 | 11 |
| subtype2 | 19 | 13 |
| subtype3 | 22 | 6 |
| subtype4 | 11 | 13 |
| subtype5 | 3 | 3 |
| subtype6 | 16 | 9 |
Figure S45. Get High-res Image Clustering Approach #9: 'RNAseq CNMF subtypes' versus Clinical Feature #5: 'RADIATIONS.RADIATION.REGIMENINDICATION'
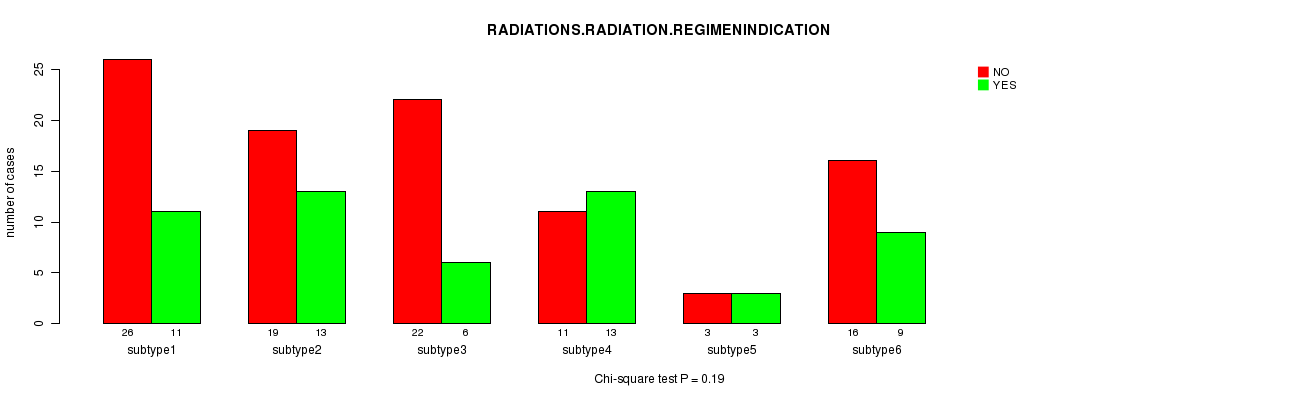
Table S55. Get Full Table Description of clustering approach #10: 'RNAseq cHierClus subtypes'
| Cluster Labels | 1 | 2 | 3 | 4 | 5 | 6 |
|---|---|---|---|---|---|---|
| Number of samples | 31 | 3 | 32 | 23 | 19 | 44 |
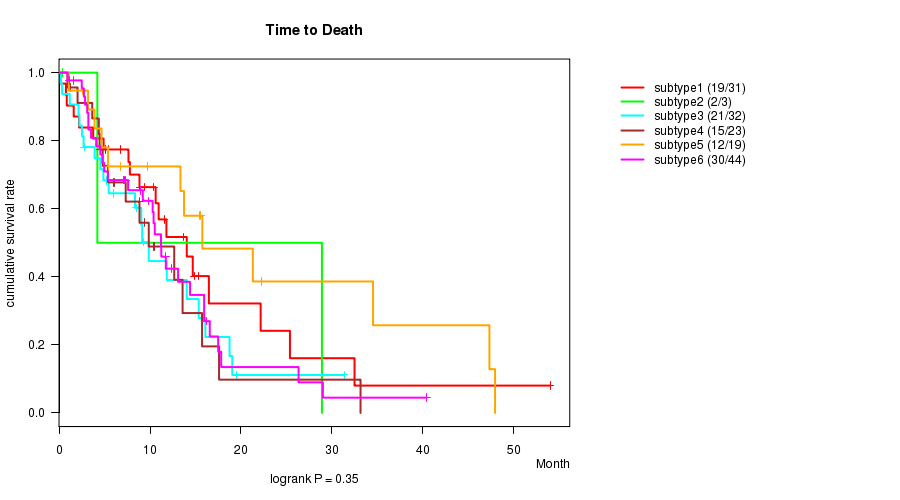
P value = 0.35 (logrank test)
Table S56. Clustering Approach #10: 'RNAseq cHierClus subtypes' versus Clinical Feature #1: 'Time to Death'
| nPatients | nDeath | Duration Range (Median), Month | |
|---|---|---|---|
| ALL | 152 | 99 | 0.2 - 54.0 (8.7) |
| subtype1 | 31 | 19 | 0.2 - 54.0 (9.4) |
| subtype2 | 3 | 2 | 0.4 - 28.9 (4.2) |
| subtype3 | 32 | 21 | 0.2 - 31.3 (6.7) |
| subtype4 | 23 | 15 | 0.9 - 33.1 (7.3) |
| subtype5 | 19 | 12 | 1.1 - 47.9 (13.3) |
| subtype6 | 44 | 30 | 0.9 - 40.4 (8.3) |
Figure S46. Get High-res Image Clustering Approach #10: 'RNAseq cHierClus subtypes' versus Clinical Feature #1: 'Time to Death'
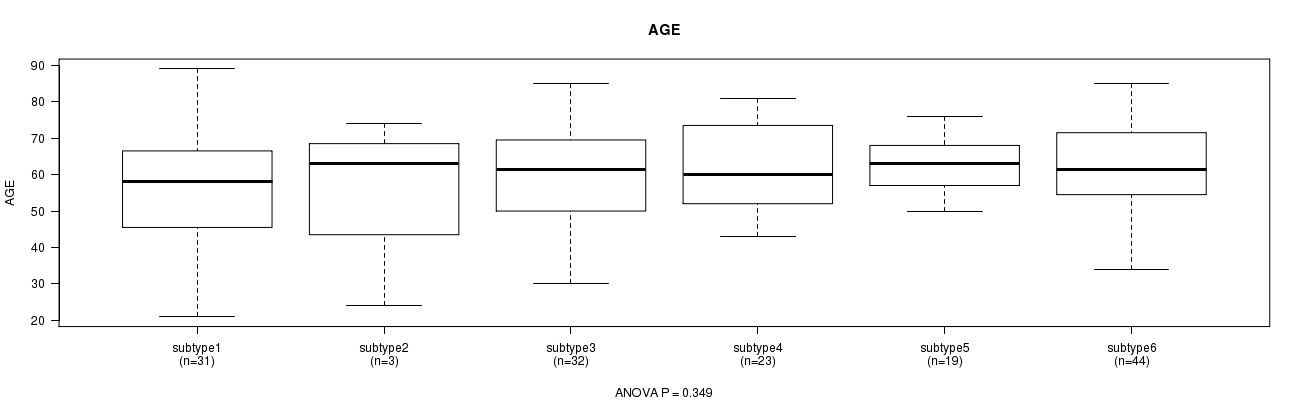
P value = 0.349 (ANOVA)
Table S57. Clustering Approach #10: 'RNAseq cHierClus subtypes' versus Clinical Feature #2: 'AGE'
| nPatients | Mean (Std.Dev) | |
|---|---|---|
| ALL | 152 | 60.1 (13.2) |
| subtype1 | 31 | 56.0 (17.2) |
| subtype2 | 3 | 53.7 (26.3) |
| subtype3 | 32 | 59.6 (12.8) |
| subtype4 | 23 | 62.0 (12.0) |
| subtype5 | 19 | 62.9 (7.8) |
| subtype6 | 44 | 61.6 (11.6) |
Figure S47. Get High-res Image Clustering Approach #10: 'RNAseq cHierClus subtypes' versus Clinical Feature #2: 'AGE'
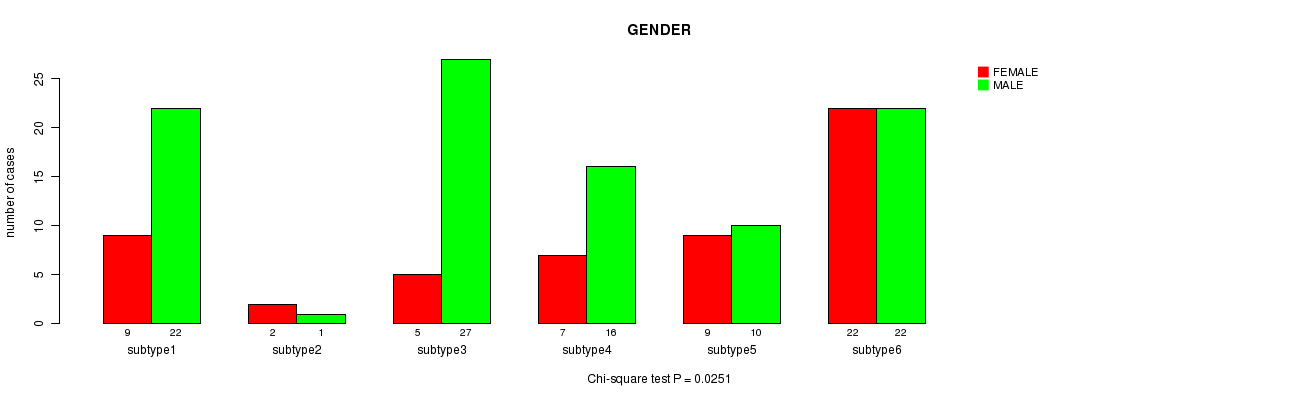
P value = 0.0251 (Chi-square test)
Table S58. Clustering Approach #10: 'RNAseq cHierClus subtypes' versus Clinical Feature #3: 'GENDER'
| nPatients | FEMALE | MALE |
|---|---|---|
| ALL | 54 | 98 |
| subtype1 | 9 | 22 |
| subtype2 | 2 | 1 |
| subtype3 | 5 | 27 |
| subtype4 | 7 | 16 |
| subtype5 | 9 | 10 |
| subtype6 | 22 | 22 |
Figure S48. Get High-res Image Clustering Approach #10: 'RNAseq cHierClus subtypes' versus Clinical Feature #3: 'GENDER'
P value = 0.469 (ANOVA)
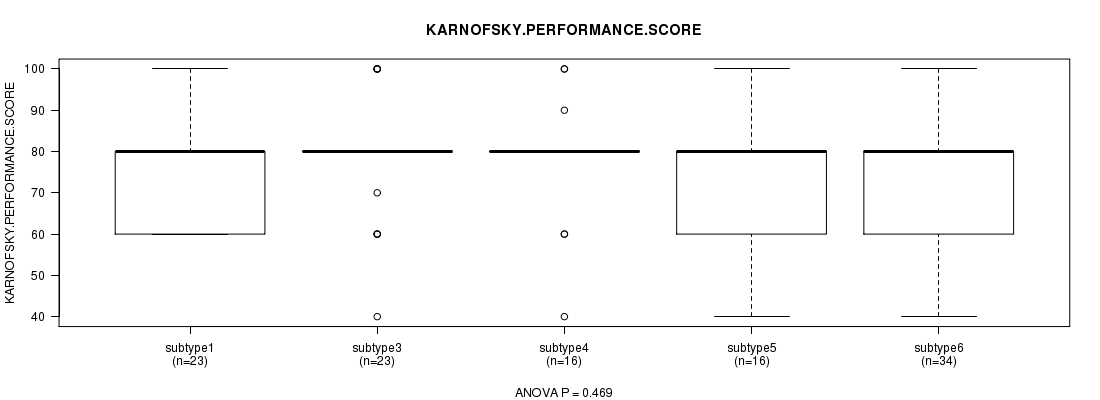
Table S59. Clustering Approach #10: 'RNAseq cHierClus subtypes' versus Clinical Feature #4: 'KARNOFSKY.PERFORMANCE.SCORE'
| nPatients | Mean (Std.Dev) | |
|---|---|---|
| ALL | 114 | 75.6 (14.4) |
| subtype1 | 23 | 76.1 (12.3) |
| subtype2 | 2 | 70.0 (14.1) |
| subtype3 | 23 | 78.7 (14.2) |
| subtype4 | 16 | 78.1 (14.7) |
| subtype5 | 16 | 70.6 (19.1) |
| subtype6 | 34 | 74.7 (13.3) |
Figure S49. Get High-res Image Clustering Approach #10: 'RNAseq cHierClus subtypes' versus Clinical Feature #4: 'KARNOFSKY.PERFORMANCE.SCORE'
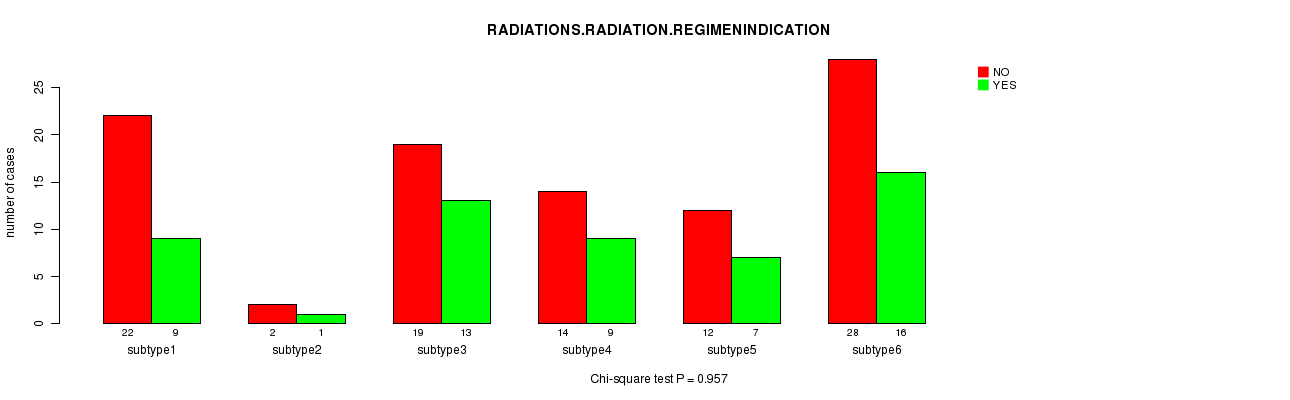
P value = 0.957 (Chi-square test)
Table S60. Clustering Approach #10: 'RNAseq cHierClus subtypes' versus Clinical Feature #5: 'RADIATIONS.RADIATION.REGIMENINDICATION'
| nPatients | NO | YES |
|---|---|---|
| ALL | 97 | 55 |
| subtype1 | 22 | 9 |
| subtype2 | 2 | 1 |
| subtype3 | 19 | 13 |
| subtype4 | 14 | 9 |
| subtype5 | 12 | 7 |
| subtype6 | 28 | 16 |
Figure S50. Get High-res Image Clustering Approach #10: 'RNAseq cHierClus subtypes' versus Clinical Feature #5: 'RADIATIONS.RADIATION.REGIMENINDICATION'
-
Cluster data file = GBM-TP.mergedcluster.txt
-
Clinical data file = GBM-TP.clin.merged.picked.txt
-
Number of patients = 564
-
Number of clustering approaches = 10
-
Number of selected clinical features = 5
-
Exclude small clusters that include fewer than K patients, K = 3
consensus non-negative matrix factorization clustering approach (Brunet et al. 2004)
Resampling-based clustering method (Monti et al. 2003)
For survival clinical features, the Kaplan-Meier survival curves of tumors with and without gene mutations were plotted and the statistical significance P values were estimated by logrank test (Bland and Altman 2004) using the 'survdiff' function in R
For continuous numerical clinical features, one-way analysis of variance (Howell 2002) was applied to compare the clinical values between tumor subtypes using 'anova' function in R
For binary clinical features, two-tailed Fisher's exact tests (Fisher 1922) were used to estimate the P values using the 'fisher.test' function in R
For multi-class clinical features (nominal or ordinal), Chi-square tests (Greenwood and Nikulin 1996) were used to estimate the P values using the 'chisq.test' function in R
This is an experimental feature. The full results of the analysis summarized in this report can be downloaded from the TCGA Data Coordination Center.