This pipeline uses various statistical tests to identify mRNAs whose expression levels correlated to selected clinical features.
Testing the association between 18300 genes and 8 clinical features across 469 samples, statistically thresholded by Q value < 0.05, 7 clinical features related to at least one genes.
-
2173 genes correlated to 'Time to Death'.
-
B3GNTL1|146712 , COL7A1|1294 , DONSON|29980 , ANKRD56|345079 , ADAMTS14|140766 , ...
-
15 genes correlated to 'AGE'.
-
RANBP17|64901 , WFDC1|58189 , RFPL1S|10740 , PALLD|23022 , NEFH|4744 , ...
-
215 genes correlated to 'GENDER'.
-
XIST|7503 , PRKY|5616 , NLGN4Y|22829 , RPS4Y1|6192 , TSIX|9383 , ...
-
2360 genes correlated to 'PATHOLOGY.T'.
-
NR3C2|4306 , FAM122A|116224 , FKBP11|51303 , TMEM150C|441027 , PLEKHA9|51054 , ...
-
5 genes correlated to 'PATHOLOGY.N'.
-
C11ORF34|349633 , PITX2|5308 , ATP6V1D|51382 , HEMGN|55363 , TMEM104|54868
-
281 genes correlated to 'PATHOLOGICSPREAD(M)'.
-
GARNL3|84253 , IL20RB|53833 , PLEKHA9|51054 , C22ORF9|23313 , BIRC5|332 , ...
-
2828 genes correlated to 'TUMOR.STAGE'.
-
PLEKHA9|51054 , NR3C2|4306 , FKBP11|51303 , FAM122A|116224 , TSPAN7|7102 , ...
-
No genes correlated to 'KARNOFSKY.PERFORMANCE.SCORE'
Complete statistical result table is provided in Supplement Table 1
Table 1. Get Full Table This table shows the clinical features, statistical methods used, and the number of genes that are significantly associated with each clinical feature at Q value < 0.05.
| Clinical feature | Statistical test | Significant genes | Associated with | Associated with | ||
|---|---|---|---|---|---|---|
| Time to Death | Cox regression test | N=2173 | shorter survival | N=1406 | longer survival | N=767 |
| AGE | Spearman correlation test | N=15 | older | N=0 | younger | N=15 |
| GENDER | t test | N=215 | male | N=136 | female | N=79 |
| KARNOFSKY PERFORMANCE SCORE | Spearman correlation test | N=0 | ||||
| PATHOLOGY T | Spearman correlation test | N=2360 | higher pT | N=1276 | lower pT | N=1084 |
| PATHOLOGY N | t test | N=5 | n1 | N=2 | n0 | N=3 |
| PATHOLOGICSPREAD(M) | t test | N=281 | m1 | N=236 | m0 | N=45 |
| TUMOR STAGE | Spearman correlation test | N=2828 | higher stage | N=1549 | lower stage | N=1279 |
Table S1. Basic characteristics of clinical feature: 'Time to Death'
| Time to Death | Duration (Months) | 0.1-111 (median=34.3) |
| censored | N = 312 | |
| death | N = 154 | |
| Significant markers | N = 2173 | |
| associated with shorter survival | 1406 | |
| associated with longer survival | 767 |
Table S2. Get Full Table List of top 10 genes significantly associated with 'Time to Death' by Cox regression test
| HazardRatio | Wald_P | Q | C_index | |
|---|---|---|---|---|
| B3GNTL1|146712 | 2.4 | 0 | 0 | 0.68 |
| COL7A1|1294 | 1.31 | 0 | 0 | 0.672 |
| DONSON|29980 | 2.6 | 0 | 0 | 0.682 |
| ANKRD56|345079 | 0.71 | 1.11e-16 | 2e-12 | 0.322 |
| ADAMTS14|140766 | 1.43 | 4.441e-16 | 8.1e-12 | 0.68 |
| NUMBL|9253 | 1.84 | 4.441e-16 | 8.1e-12 | 0.685 |
| RGS17|26575 | 1.43 | 4.441e-16 | 8.1e-12 | 0.665 |
| CDCA3|83461 | 1.68 | 6.661e-16 | 1.2e-11 | 0.669 |
| SLC16A12|387700 | 0.79 | 6.661e-16 | 1.2e-11 | 0.317 |
| FBXL5|26234 | 0.42 | 8.882e-16 | 1.6e-11 | 0.324 |
Figure S1. Get High-res Image As an example, this figure shows the association of B3GNTL1|146712 to 'Time to Death'. four curves present the cumulative survival rates of 4 quartile subsets of patients. P value = 0 with univariate Cox regression analysis using continuous log-2 expression values.
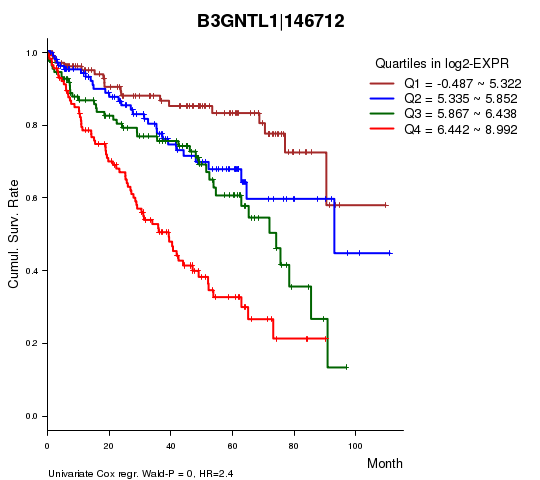
Table S3. Basic characteristics of clinical feature: 'AGE'
| AGE | Mean (SD) | 60.59 (12) |
| Significant markers | N = 15 | |
| pos. correlated | 0 | |
| neg. correlated | 15 |
Table S4. Get Full Table List of top 10 genes significantly correlated to 'AGE' by Spearman correlation test
| SpearmanCorr | corrP | Q | |
|---|---|---|---|
| RANBP17|64901 | -0.2635 | 7.124e-09 | 0.00013 |
| WFDC1|58189 | -0.2521 | 3.214e-08 | 0.000588 |
| RFPL1S|10740 | -0.2493 | 5.839e-08 | 0.00107 |
| PALLD|23022 | -0.2388 | 1.722e-07 | 0.00315 |
| NEFH|4744 | -0.2312 | 4.278e-07 | 0.00783 |
| UTY|7404 | -0.2641 | 4.804e-07 | 0.00879 |
| DIO2|1734 | -0.23 | 5.024e-07 | 0.00919 |
| FNDC1|84624 | -0.2269 | 7.008e-07 | 0.0128 |
| ZNF610|162963 | -0.2206 | 1.439e-06 | 0.0263 |
| USP9Y|8287 | -0.2472 | 1.632e-06 | 0.0298 |
Figure S2. Get High-res Image As an example, this figure shows the association of RANBP17|64901 to 'AGE'. P value = 7.12e-09 with Spearman correlation analysis. The straight line presents the best linear regression.
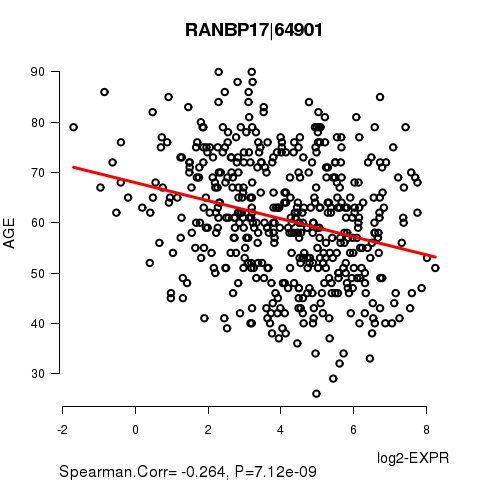
Table S5. Basic characteristics of clinical feature: 'GENDER'
| GENDER | Labels | N |
| FEMALE | 162 | |
| MALE | 307 | |
| Significant markers | N = 215 | |
| Higher in MALE | 136 | |
| Higher in FEMALE | 79 |
Table S6. Get Full Table List of top 10 genes differentially expressed by 'GENDER'
| T(pos if higher in 'MALE') | ttestP | Q | AUC | |
|---|---|---|---|---|
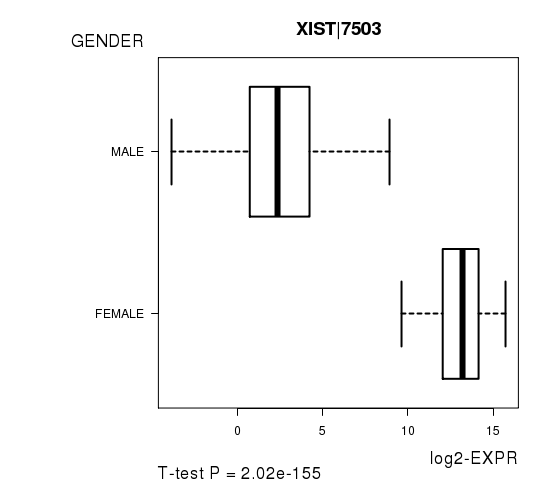
| XIST|7503 | -42.39 | 2.021e-155 | 3.7e-151 | 0.9817 |
| PRKY|5616 | 37.3 | 1.011e-100 | 1.85e-96 | 0.9791 |
| NLGN4Y|22829 | 33.57 | 5.666e-72 | 1.04e-67 | 0.9742 |
| RPS4Y1|6192 | 34.21 | 5.279e-69 | 9.66e-65 | 0.9855 |
| TSIX|9383 | -23.5 | 1.788e-67 | 3.27e-63 | 0.9663 |
| ZFY|7544 | 33.4 | 1.055e-61 | 1.93e-57 | 0.9774 |
| DDX3Y|8653 | 29.35 | 4.141e-54 | 7.58e-50 | 0.9732 |
| KDM5C|8242 | -16.63 | 1.397e-47 | 2.56e-43 | 0.8949 |
| NCRNA00183|554203 | -16.16 | 7.263e-44 | 1.33e-39 | 0.8655 |
| KDM5D|8284 | 23.9 | 3.025e-37 | 5.53e-33 | 0.97 |
Figure S3. Get High-res Image As an example, this figure shows the association of XIST|7503 to 'GENDER'. P value = 2.02e-155 with T-test analysis.
No gene related to 'KARNOFSKY.PERFORMANCE.SCORE'.
Table S7. Basic characteristics of clinical feature: 'KARNOFSKY.PERFORMANCE.SCORE'
| KARNOFSKY.PERFORMANCE.SCORE | Mean (SD) | 90.97 (19) |
| Score | N | |
| 0 | 1 | |
| 70 | 1 | |
| 80 | 3 | |
| 90 | 9 | |
| 100 | 17 | |
| Significant markers | N = 0 |
Table S8. Basic characteristics of clinical feature: 'PATHOLOGY.T'
| PATHOLOGY.T | Mean (SD) | 1.93 (0.97) |
| N | ||
| T1 | 228 | |
| T2 | 59 | |
| T3 | 171 | |
| T4 | 11 | |
| Significant markers | N = 2360 | |
| pos. correlated | 1276 | |
| neg. correlated | 1084 |
Table S9. Get Full Table List of top 10 genes significantly correlated to 'PATHOLOGY.T' by Spearman correlation test
| SpearmanCorr | corrP | Q | |
|---|---|---|---|
| NR3C2|4306 | -0.4028 | 1.007e-19 | 1.84e-15 |
| FAM122A|116224 | -0.3813 | 1.11e-17 | 2.03e-13 |
| FKBP11|51303 | 0.3802 | 1.403e-17 | 2.57e-13 |
| TMEM150C|441027 | -0.376 | 3.376e-17 | 6.18e-13 |
| PLEKHA9|51054 | 0.3745 | 4.597e-17 | 8.41e-13 |
| ZNF132|7691 | -0.3731 | 6.16e-17 | 1.13e-12 |
| FAM160A1|729830 | -0.37 | 1.16e-16 | 2.12e-12 |
| ACADSB|36 | -0.3678 | 1.791e-16 | 3.28e-12 |
| CCDC121|79635 | -0.3671 | 2.06e-16 | 3.77e-12 |
| ANKRD56|345079 | -0.3625 | 5.53e-16 | 1.01e-11 |
Figure S4. Get High-res Image As an example, this figure shows the association of NR3C2|4306 to 'PATHOLOGY.T'. P value = 1.01e-19 with Spearman correlation analysis.
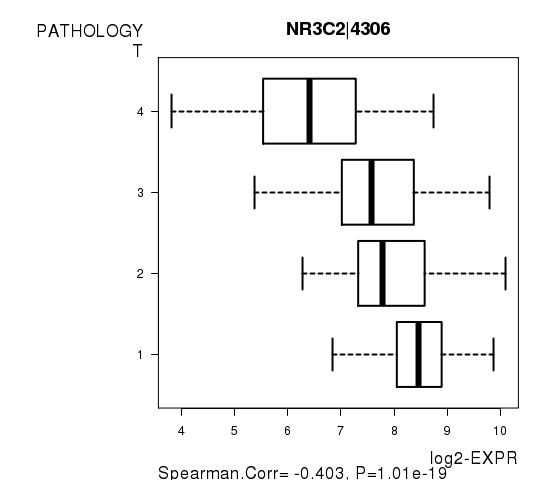
Table S10. Basic characteristics of clinical feature: 'PATHOLOGY.N'
| PATHOLOGY.N | Labels | N |
| N0 | 224 | |
| N1 | 17 | |
| Significant markers | N = 5 | |
| Higher in N1 | 2 | |
| Higher in N0 | 3 |
Table S11. Get Full Table List of 5 genes differentially expressed by 'PATHOLOGY.N'
| T(pos if higher in 'N1') | ttestP | Q | AUC | |
|---|---|---|---|---|
| C11ORF34|349633 | -7.86 | 3.591e-09 | 6.57e-05 | 0.7246 |
| PITX2|5308 | 6.94 | 1.791e-07 | 0.00328 | 0.7869 |
| ATP6V1D|51382 | -6.12 | 3.87e-07 | 0.00708 | 0.7503 |
| HEMGN|55363 | -5.84 | 1.013e-06 | 0.0185 | 0.7421 |
| TMEM104|54868 | 5.93 | 2.441e-06 | 0.0446 | 0.8025 |
Figure S5. Get High-res Image As an example, this figure shows the association of C11ORF34|349633 to 'PATHOLOGY.N'. P value = 3.59e-09 with T-test analysis.
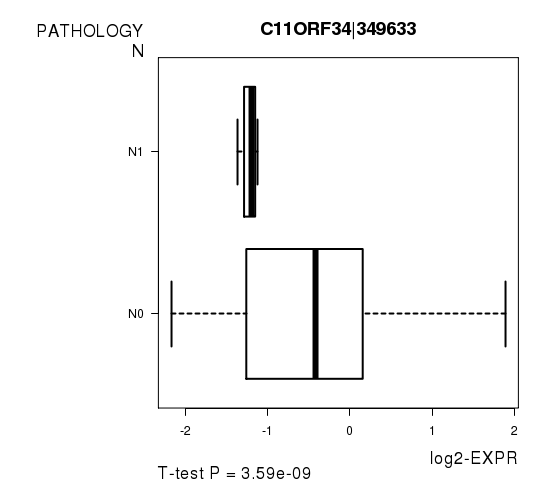
Table S12. Basic characteristics of clinical feature: 'PATHOLOGICSPREAD(M)'
| PATHOLOGICSPREAD(M) | Labels | N |
| M0 | 392 | |
| M1 | 77 | |
| Significant markers | N = 281 | |
| Higher in M1 | 236 | |
| Higher in M0 | 45 |
Table S13. Get Full Table List of top 10 genes differentially expressed by 'PATHOLOGICSPREAD(M)'
| T(pos if higher in 'M1') | ttestP | Q | AUC | |
|---|---|---|---|---|
| GARNL3|84253 | -7.02 | 1.643e-10 | 3.01e-06 | 0.7468 |
| IL20RB|53833 | 6.67 | 1.26e-09 | 2.31e-05 | 0.7307 |
| PLEKHA9|51054 | 6.59 | 1.665e-09 | 3.05e-05 | 0.7361 |
| C22ORF9|23313 | 6.56 | 1.728e-09 | 3.16e-05 | 0.7333 |
| BIRC5|332 | 6.55 | 2.215e-09 | 4.05e-05 | 0.727 |
| INHBE|83729 | 6.47 | 3.65e-09 | 6.68e-05 | 0.7247 |
| TYMP|1890 | 6.33 | 3.802e-09 | 6.96e-05 | 0.7083 |
| NFE2L3|9603 | 6.36 | 4.534e-09 | 8.29e-05 | 0.7207 |
| OIP5|11339 | 6.31 | 5.952e-09 | 0.000109 | 0.7241 |
| CENPA|1058 | 6.31 | 7.458e-09 | 0.000136 | 0.722 |
Figure S6. Get High-res Image As an example, this figure shows the association of GARNL3|84253 to 'PATHOLOGICSPREAD(M)'. P value = 1.64e-10 with T-test analysis.
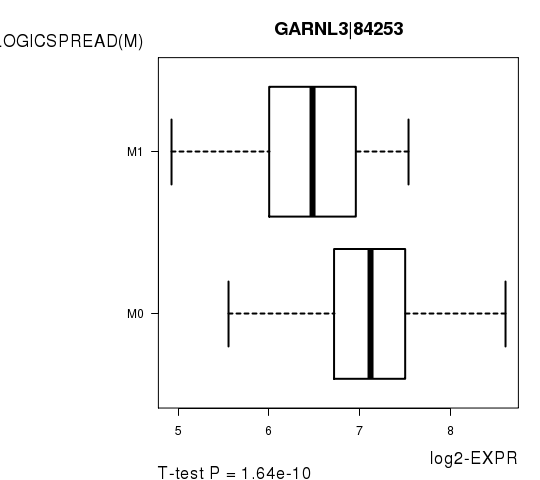
Table S14. Basic characteristics of clinical feature: 'TUMOR.STAGE'
| TUMOR.STAGE | Mean (SD) | 2.12 (1.2) |
| N | ||
| Stage 1 | 224 | |
| Stage 2 | 47 | |
| Stage 3 | 117 | |
| Stage 4 | 81 | |
| Significant markers | N = 2828 | |
| pos. correlated | 1549 | |
| neg. correlated | 1279 |
Table S15. Get Full Table List of top 10 genes significantly correlated to 'TUMOR.STAGE' by Spearman correlation test
| SpearmanCorr | corrP | Q | |
|---|---|---|---|
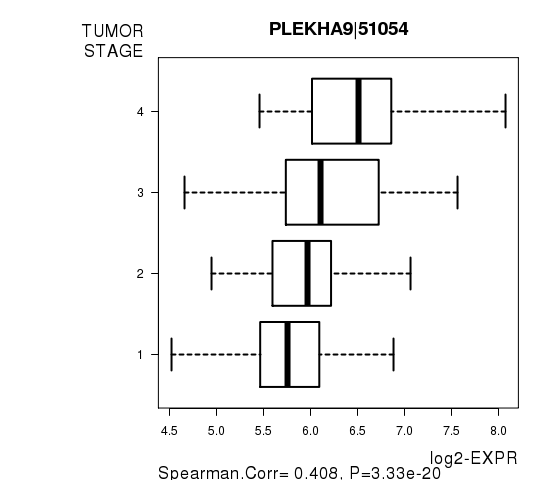
| PLEKHA9|51054 | 0.4077 | 3.33e-20 | 6.09e-16 |
| NR3C2|4306 | -0.4075 | 3.484e-20 | 6.37e-16 |
| FKBP11|51303 | 0.3986 | 2.591e-19 | 4.74e-15 |
| FAM122A|116224 | -0.3977 | 3.189e-19 | 5.83e-15 |
| TSPAN7|7102 | -0.3805 | 1.332e-17 | 2.44e-13 |
| NOP2|4839 | 0.3778 | 2.311e-17 | 4.23e-13 |
| ACADSB|36 | -0.3776 | 2.436e-17 | 4.46e-13 |
| FAM160A1|729830 | -0.3775 | 2.464e-17 | 4.51e-13 |
| ALDH6A1|4329 | -0.3762 | 3.227e-17 | 5.9e-13 |
| TRAF6|7189 | -0.3759 | 3.451e-17 | 6.31e-13 |
Figure S7. Get High-res Image As an example, this figure shows the association of PLEKHA9|51054 to 'TUMOR.STAGE'. P value = 3.33e-20 with Spearman correlation analysis.
-
Expresson data file = KIRC-TP.uncv2.mRNAseq_RSEM_normalized_log2.txt
-
Clinical data file = KIRC-TP.clin.merged.picked.txt
-
Number of patients = 469
-
Number of genes = 18300
-
Number of clinical features = 8
For survival clinical features, Wald's test in univariate Cox regression analysis with proportional hazards model (Andersen and Gill 1982) was used to estimate the P values using the 'coxph' function in R. Kaplan-Meier survival curves were plot using the four quartile subgroups of patients based on expression levels
For continuous numerical clinical features, Spearman's rank correlation coefficients (Spearman 1904) and two-tailed P values were estimated using 'cor.test' function in R
For two-class clinical features, two-tailed Student's t test with unequal variance (Lehmann and Romano 2005) was applied to compare the log2-expression levels between the two clinical classes using 't.test' function in R
For multiple hypothesis correction, Q value is the False Discovery Rate (FDR) analogue of the P value (Benjamini and Hochberg 1995), defined as the minimum FDR at which the test may be called significant. We used the 'Benjamini and Hochberg' method of 'p.adjust' function in R to convert P values into Q values.
This is an experimental feature. The full results of the analysis summarized in this report can be downloaded from the TCGA Data Coordination Center.