This pipeline uses various statistical tests to identify genes whose promoter methylation levels correlated to selected clinical features.
Testing the association between 17341 genes and 8 clinical features across 263 samples, statistically thresholded by Q value < 0.05, 7 clinical features related to at least one genes.
-
442 genes correlated to 'Time to Death'.
-
FLJ42289 , TLL2 , PPP3CB , ARHGEF12 , RPRD2 , ...
-
16 genes correlated to 'AGE'.
-
ELOVL2 , MRPS33 , UNC80 , DOK6 , RANBP17 , ...
-
77 genes correlated to 'GENDER'.
-
UTP14C , KIF4B , CCDC146 , CAV2 , C5ORF27 , ...
-
647 genes correlated to 'PATHOLOGY.T'.
-
KDR , DBX2 , OPRK1 , ACTA1 , NEUROD2 , ...
-
6 genes correlated to 'PATHOLOGY.N'.
-
CARD16 , CASP1 , SFXN5 , VGF , ZFP64 , ...
-
53 genes correlated to 'PATHOLOGICSPREAD(M)'.
-
C20ORF112 , OPRK1 , HTR6 , PLCD1 , SESN1 , ...
-
720 genes correlated to 'TUMOR.STAGE'.
-
KDR , NEUROD2 , OPRK1 , ACTA1 , DBX2 , ...
-
No genes correlated to 'KARNOFSKY.PERFORMANCE.SCORE'
Complete statistical result table is provided in Supplement Table 1
Table 1. Get Full Table This table shows the clinical features, statistical methods used, and the number of genes that are significantly associated with each clinical feature at Q value < 0.05.
| Clinical feature | Statistical test | Significant genes | Associated with | Associated with | ||
|---|---|---|---|---|---|---|
| Time to Death | Cox regression test | N=442 | shorter survival | N=273 | longer survival | N=169 |
| AGE | Spearman correlation test | N=16 | older | N=13 | younger | N=3 |
| GENDER | t test | N=77 | male | N=7 | female | N=70 |
| KARNOFSKY PERFORMANCE SCORE | Spearman correlation test | N=0 | ||||
| PATHOLOGY T | Spearman correlation test | N=647 | higher pT | N=321 | lower pT | N=326 |
| PATHOLOGY N | t test | N=6 | n1 | N=0 | n0 | N=6 |
| PATHOLOGICSPREAD(M) | t test | N=53 | m1 | N=50 | m0 | N=3 |
| TUMOR STAGE | Spearman correlation test | N=720 | higher stage | N=479 | lower stage | N=241 |
Table S1. Basic characteristics of clinical feature: 'Time to Death'
| Time to Death | Duration (Months) | 0.1-109.6 (median=28) |
| censored | N = 168 | |
| death | N = 92 | |
| Significant markers | N = 442 | |
| associated with shorter survival | 273 | |
| associated with longer survival | 169 |
Table S2. Get Full Table List of top 10 genes significantly associated with 'Time to Death' by Cox regression test
| HazardRatio | Wald_P | Q | C_index | |
|---|---|---|---|---|
| FLJ42289 | 0.03 | 4.452e-12 | 7.7e-08 | 0.305 |
| TLL2 | 0.02 | 1.049e-11 | 1.8e-07 | 0.317 |
| PPP3CB | 0 | 1.299e-11 | 2.3e-07 | 0.328 |
| ARHGEF12 | 42 | 4.166e-11 | 7.2e-07 | 0.641 |
| RPRD2 | 51 | 4.305e-11 | 7.5e-07 | 0.679 |
| RIOK3 | 6001 | 7.395e-11 | 1.3e-06 | 0.663 |
| GRIN2D | 0 | 7.721e-11 | 1.3e-06 | 0.323 |
| IFFO1 | 0 | 8.133e-11 | 1.4e-06 | 0.347 |
| PCCA | 52 | 9.75e-11 | 1.7e-06 | 0.662 |
| MBNL2 | 28 | 1.28e-10 | 2.2e-06 | 0.671 |
Figure S1. Get High-res Image As an example, this figure shows the association of FLJ42289 to 'Time to Death'. four curves present the cumulative survival rates of 4 quartile subsets of patients. P value = 4.45e-12 with univariate Cox regression analysis using continuous log-2 expression values.
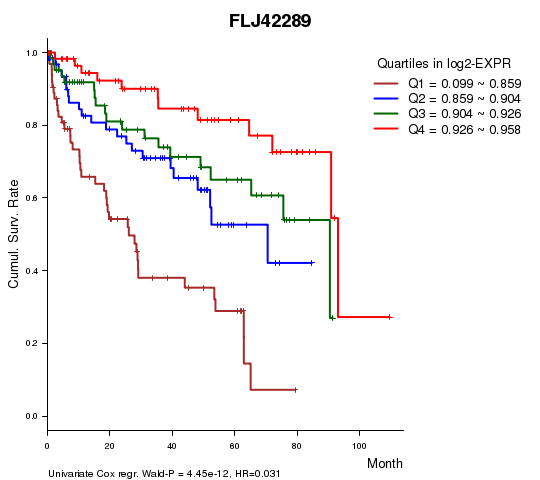
Table S3. Basic characteristics of clinical feature: 'AGE'
| AGE | Mean (SD) | 61.4 (12) |
| Significant markers | N = 16 | |
| pos. correlated | 13 | |
| neg. correlated | 3 |
Table S4. Get Full Table List of top 10 genes significantly correlated to 'AGE' by Spearman correlation test
| SpearmanCorr | corrP | Q | |
|---|---|---|---|
| ELOVL2 | 0.4688 | 9.003e-16 | 1.56e-11 |
| MRPS33 | 0.3349 | 2.597e-08 | 0.00045 |
| UNC80 | 0.3255 | 6.63e-08 | 0.00115 |
| DOK6 | 0.3192 | 1.219e-07 | 0.00211 |
| RANBP17 | 0.3137 | 2.057e-07 | 0.00357 |
| ADAMTS17 | 0.3082 | 3.411e-07 | 0.00591 |
| ME3 | -0.3082 | 3.419e-07 | 0.00593 |
| TSPYL5 | 0.307 | 3.82e-07 | 0.00662 |
| C7ORF13 | 0.3021 | 5.967e-07 | 0.0103 |
| RNF32 | 0.3021 | 5.967e-07 | 0.0103 |
Figure S2. Get High-res Image As an example, this figure shows the association of ELOVL2 to 'AGE'. P value = 9e-16 with Spearman correlation analysis. The straight line presents the best linear regression.
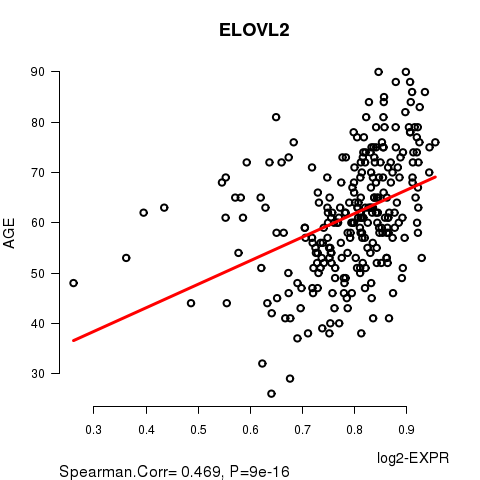
Table S5. Basic characteristics of clinical feature: 'GENDER'
| GENDER | Labels | N |
| FEMALE | 89 | |
| MALE | 174 | |
| Significant markers | N = 77 | |
| Higher in MALE | 7 | |
| Higher in FEMALE | 70 |
Table S6. Get Full Table List of top 10 genes differentially expressed by 'GENDER'
| T(pos if higher in 'MALE') | ttestP | Q | AUC | |
|---|---|---|---|---|
| UTP14C | 17.15 | 3.338e-32 | 5.79e-28 | 0.9706 |
| KIF4B | -11.32 | 3.515e-23 | 6.1e-19 | 0.875 |
| CCDC146 | -10.41 | 2.327e-21 | 4.03e-17 | 0.802 |
| CAV2 | -9.92 | 2.081e-19 | 3.61e-15 | 0.8065 |
| C5ORF27 | -9.78 | 9.021e-19 | 1.56e-14 | 0.8085 |
| UQCRH | 9.75 | 1.145e-18 | 1.98e-14 | 0.7601 |
| DNAJB13 | -9.4 | 3.922e-18 | 6.8e-14 | 0.7811 |
| TLE1 | -9.16 | 2.634e-16 | 4.57e-12 | 0.8047 |
| ADAMTS10 | -8.02 | 3.575e-14 | 6.2e-10 | 0.7323 |
| CHTF8 | 8.23 | 4.86e-14 | 8.42e-10 | 0.811 |
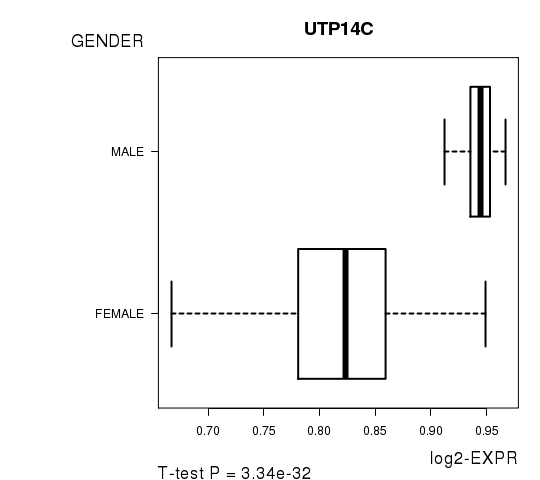
Figure S3. Get High-res Image As an example, this figure shows the association of UTP14C to 'GENDER'. P value = 3.34e-32 with T-test analysis.
No gene related to 'KARNOFSKY.PERFORMANCE.SCORE'.
Table S7. Basic characteristics of clinical feature: 'KARNOFSKY.PERFORMANCE.SCORE'
| KARNOFSKY.PERFORMANCE.SCORE | Mean (SD) | 92.92 (8.6) |
| Score | N | |
| 70 | 1 | |
| 80 | 3 | |
| 90 | 8 | |
| 100 | 12 | |
| Significant markers | N = 0 |
Table S8. Basic characteristics of clinical feature: 'PATHOLOGY.T'
| PATHOLOGY.T | Mean (SD) | 1.99 (0.98) |
| N | ||
| T1 | 120 | |
| T2 | 33 | |
| T3 | 102 | |
| T4 | 8 | |
| Significant markers | N = 647 | |
| pos. correlated | 321 | |
| neg. correlated | 326 |
Table S9. Get Full Table List of top 10 genes significantly correlated to 'PATHOLOGY.T' by Spearman correlation test
| SpearmanCorr | corrP | Q | |
|---|---|---|---|
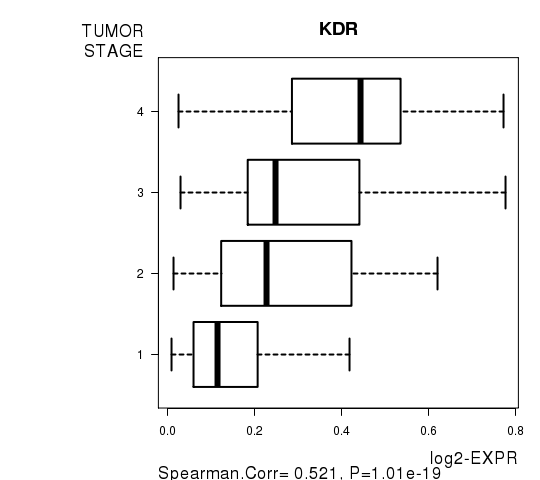
| KDR | 0.4954 | 1.081e-17 | 1.88e-13 |
| DBX2 | 0.4619 | 2.639e-15 | 4.58e-11 |
| OPRK1 | 0.4583 | 4.608e-15 | 7.99e-11 |
| ACTA1 | 0.4526 | 1.093e-14 | 1.89e-10 |
| NEUROD2 | 0.4459 | 2.966e-14 | 5.14e-10 |
| AVPR1A | 0.4324 | 2.082e-13 | 3.61e-09 |
| SLC35F1 | 0.4308 | 2.616e-13 | 4.54e-09 |
| RRM2 | -0.4302 | 2.841e-13 | 4.92e-09 |
| DSC3 | 0.4188 | 1.364e-12 | 2.36e-08 |
| FAM38B | 0.4185 | 1.426e-12 | 2.47e-08 |
Figure S4. Get High-res Image As an example, this figure shows the association of KDR to 'PATHOLOGY.T'. P value = 1.08e-17 with Spearman correlation analysis.
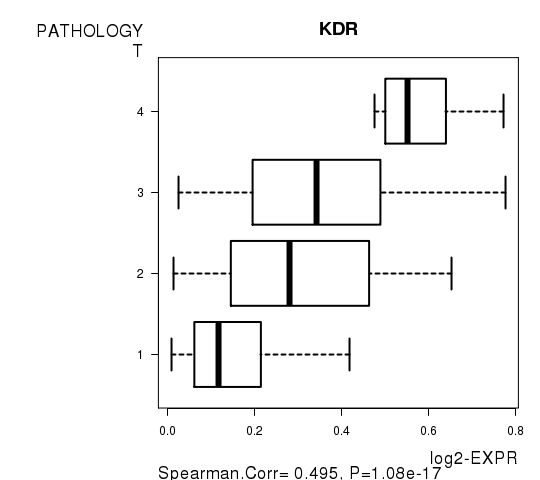
Table S10. Basic characteristics of clinical feature: 'PATHOLOGY.N'
| PATHOLOGY.N | Labels | N |
| N0 | 118 | |
| N1 | 9 | |
| Significant markers | N = 6 | |
| Higher in N1 | 0 | |
| Higher in N0 | 6 |
Table S11. Get Full Table List of 6 genes differentially expressed by 'PATHOLOGY.N'
| T(pos if higher in 'N1') | ttestP | Q | AUC | |
|---|---|---|---|---|
| CARD16 | -6.22 | 1.661e-08 | 0.000288 | 0.6582 |
| CASP1 | -6.22 | 1.661e-08 | 0.000288 | 0.6582 |
| SFXN5 | -6.17 | 3.723e-07 | 0.00645 | 0.7109 |
| VGF | -5.22 | 7.276e-07 | 0.0126 | 0.6629 |
| ZFP64 | -5.19 | 9.117e-07 | 0.0158 | 0.6252 |
| PLAG1 | -4.93 | 2.598e-06 | 0.045 | 0.7702 |
Figure S5. Get High-res Image As an example, this figure shows the association of CARD16 to 'PATHOLOGY.N'. P value = 1.66e-08 with T-test analysis.
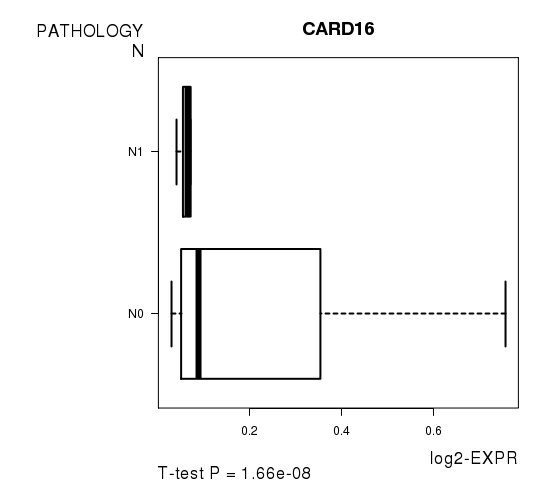
Table S12. Basic characteristics of clinical feature: 'PATHOLOGICSPREAD(M)'
| PATHOLOGICSPREAD(M) | Labels | N |
| M0 | 212 | |
| M1 | 51 | |
| Significant markers | N = 53 | |
| Higher in M1 | 50 | |
| Higher in M0 | 3 |
Table S13. Get Full Table List of top 10 genes differentially expressed by 'PATHOLOGICSPREAD(M)'
| T(pos if higher in 'M1') | ttestP | Q | AUC | |
|---|---|---|---|---|
| C20ORF112 | 7.35 | 1.047e-11 | 1.82e-07 | 0.7646 |
| OPRK1 | 7.41 | 5.015e-11 | 8.7e-07 | 0.7662 |
| HTR6 | 7.14 | 2.833e-10 | 4.91e-06 | 0.7689 |
| PLCD1 | 6.46 | 8.995e-10 | 1.56e-05 | 0.7108 |
| SESN1 | 6.17 | 6.789e-09 | 0.000118 | 0.7053 |
| MUSK | 6.07 | 1.192e-08 | 0.000207 | 0.7091 |
| NBLA00301 | 6.22 | 1.197e-08 | 0.000208 | 0.7195 |
| STK24 | 6.23 | 1.202e-08 | 0.000208 | 0.7508 |
| ASB4 | 6.15 | 1.279e-08 | 0.000222 | 0.7278 |
| CSDC2 | 6.12 | 2.727e-08 | 0.000473 | 0.7388 |
Figure S6. Get High-res Image As an example, this figure shows the association of C20ORF112 to 'PATHOLOGICSPREAD(M)'. P value = 1.05e-11 with T-test analysis.
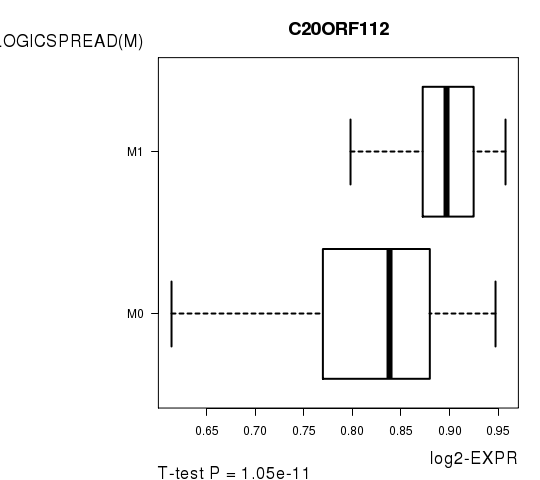
Table S14. Basic characteristics of clinical feature: 'TUMOR.STAGE'
| TUMOR.STAGE | Mean (SD) | 2.24 (1.2) |
| N | ||
| Stage 1 | 118 | |
| Stage 2 | 21 | |
| Stage 3 | 68 | |
| Stage 4 | 56 | |
| Significant markers | N = 720 | |
| pos. correlated | 479 | |
| neg. correlated | 241 |
Table S15. Get Full Table List of top 10 genes significantly correlated to 'TUMOR.STAGE' by Spearman correlation test
| SpearmanCorr | corrP | Q | |
|---|---|---|---|
| KDR | 0.5212 | 1.013e-19 | 1.76e-15 |
| NEUROD2 | 0.4884 | 3.579e-17 | 6.21e-13 |
| OPRK1 | 0.4852 | 6.192e-17 | 1.07e-12 |
| ACTA1 | 0.4832 | 8.596e-17 | 1.49e-12 |
| DBX2 | 0.4731 | 4.521e-16 | 7.84e-12 |
| FAM38B | 0.4622 | 2.525e-15 | 4.38e-11 |
| AVPR1A | 0.4598 | 3.651e-15 | 6.33e-11 |
| DLL3 | 0.455 | 7.634e-15 | 1.32e-10 |
| C20ORF112 | 0.4422 | 5.124e-14 | 8.88e-10 |
| RRM2 | -0.4398 | 7.247e-14 | 1.26e-09 |
Figure S7. Get High-res Image As an example, this figure shows the association of KDR to 'TUMOR.STAGE'. P value = 1.01e-19 with Spearman correlation analysis.
-
Expresson data file = KIRC-TP.meth.for_correlation.filtered_data.txt
-
Clinical data file = KIRC-TP.clin.merged.picked.txt
-
Number of patients = 263
-
Number of genes = 17341
-
Number of clinical features = 8
For survival clinical features, Wald's test in univariate Cox regression analysis with proportional hazards model (Andersen and Gill 1982) was used to estimate the P values using the 'coxph' function in R. Kaplan-Meier survival curves were plot using the four quartile subgroups of patients based on expression levels
For continuous numerical clinical features, Spearman's rank correlation coefficients (Spearman 1904) and two-tailed P values were estimated using 'cor.test' function in R
For two-class clinical features, two-tailed Student's t test with unequal variance (Lehmann and Romano 2005) was applied to compare the log2-expression levels between the two clinical classes using 't.test' function in R
For multiple hypothesis correction, Q value is the False Discovery Rate (FDR) analogue of the P value (Benjamini and Hochberg 1995), defined as the minimum FDR at which the test may be called significant. We used the 'Benjamini and Hochberg' method of 'p.adjust' function in R to convert P values into Q values.
This is an experimental feature. The full results of the analysis summarized in this report can be downloaded from the TCGA Data Coordination Center.