This report serves to describe the mutational landscape and properties of a given individual set, as well as rank genes and genesets according to mutational significance. MutSig v2.0 was used to generate the results found in this report.
-
Working with individual set: KIRC-TP
-
Number of patients in set: 293
The input for this pipeline is a set of individuals with the following files associated for each:
-
An annotated .maf file describing the mutations called for the respective individual, and their properties.
-
A .wig file that contains information about the coverage of the sample.
-
MAF used for this analysis:KIRC-TP.final_analysis_set.maf
-
Significantly mutated genes (q ≤ 0.1): 28
-
Mutations seen in COSMIC: 212
-
Significantly mutated genes in COSMIC territory: 5
-
Genes with clustered mutations (≤ 3 aa apart): 174
-
Significantly mutated genesets: 6
-
Significantly mutated genesets: (excluding sig. mutated genes):0
-
Read 293 MAFs of type "Broad"
-
Total number of mutations in input MAFs: 95839
-
After removing 232 mutations outside chr1-24: 95607
-
After removing 6379 blacklisted mutations: 89228
-
After removing 64591 noncoding mutations: 24637
-
After collapsing adjacent/redundant mutations: 24179
-
Number of mutations before filtering: 24179
-
After removing 654 mutations outside gene set: 23525
-
After removing 14 mutations outside category set: 23511
-
After removing 1 "impossible" mutations in
-
gene-patient-category bins of zero coverage: 23510
Table 1. Get Full Table Table representing breakdown of mutations by type.
| type | count |
|---|---|
| Frame_Shift_Del | 471 |
| Frame_Shift_Ins | 107 |
| In_Frame_Del | 48 |
| In_Frame_Ins | 8 |
| Missense_Mutation | 15492 |
| Nonsense_Mutation | 1046 |
| Nonstop_Mutation | 21 |
| Silent | 5790 |
| Splice_Site | 491 |
| Translation_Start_Site | 37 |
| Total | 23511 |
Table 2. Get Full Table A breakdown of mutation rates per category discovered for this individual set.
| category | n | N | rate | rate_per_mb | relative_rate | exp_ns_s_ratio |
|---|---|---|---|---|---|---|
| *CpG->T | 1719 | 484078369 | 3.6e-06 | 3.6 | 1.8 | 2.1 |
| *ApG->G | 1167 | 1342141277 | 8.7e-07 | 0.87 | 0.43 | 2.1 |
| *Np(A/C/T)->transit | 5081 | 6921093572 | 7.3e-07 | 0.73 | 0.36 | 2 |
| transver | 7528 | 8747313218 | 8.6e-07 | 0.86 | 0.42 | 5 |
| indel+null | 2220 | 8747313218 | 2.5e-07 | 0.25 | 0.13 | NaN |
| double_null | 6 | 8747313218 | 6.9e-10 | 0.00069 | 0.00034 | NaN |
| Total | 17721 | 8747313218 | 2e-06 | 2 | 1 | 3.5 |
The x axis represents the samples. The y axis represents the exons, one row per exon, and they are sorted by average coverage across samples. For exons with exactly the same average coverage, they are sorted next by the %GC of the exon. (The secondary sort is especially useful for the zero-coverage exons at the bottom).
Figure 1.
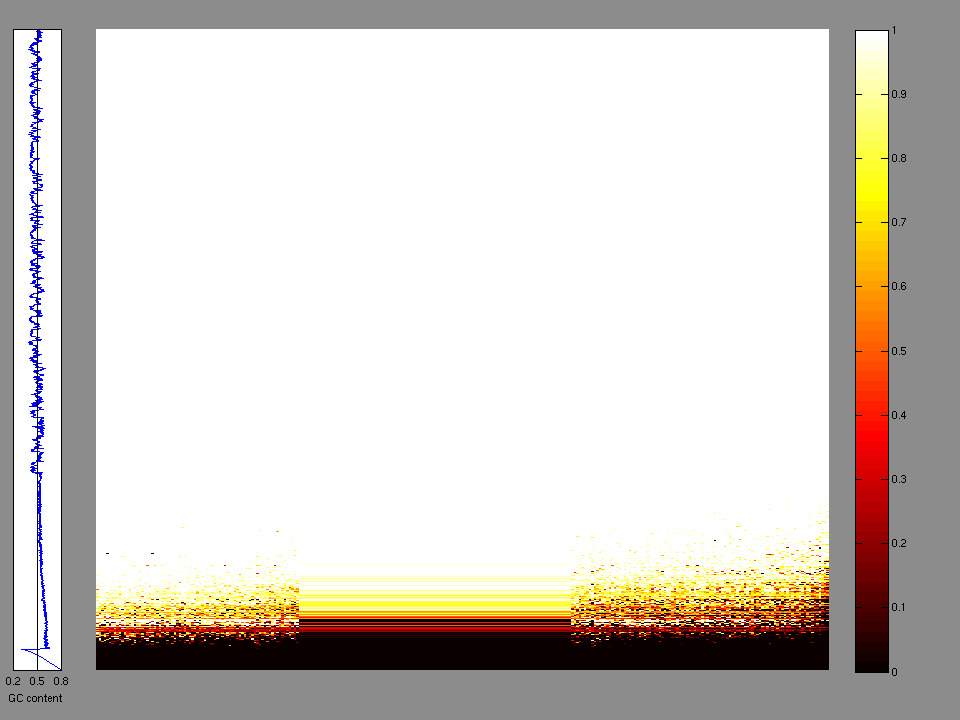
Figure 2. Patients counts and rates file used to generate this plot: KIRC-TP.patients.counts_and_rates.txt
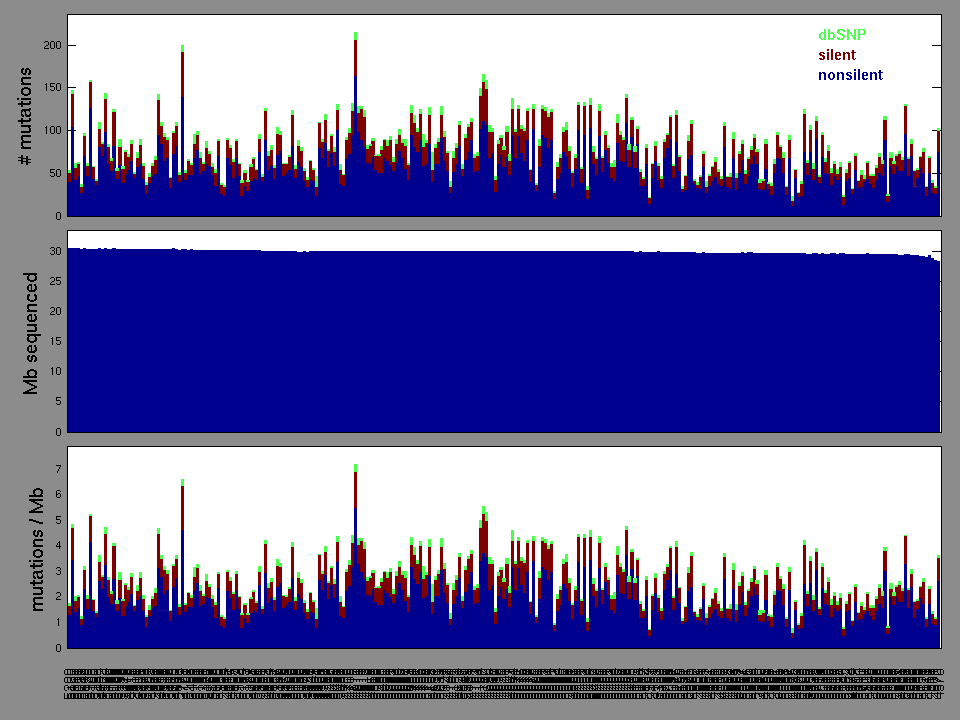
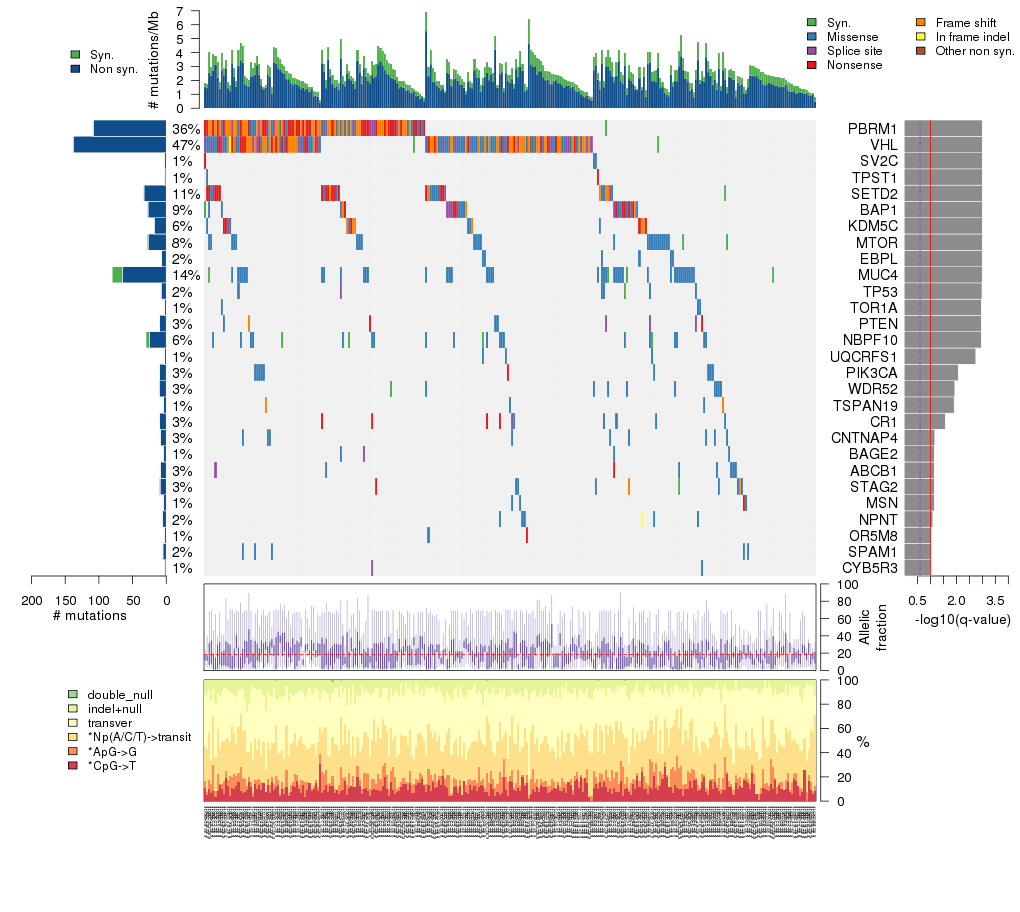
Figure 3. Get High-res Image The matrix in the center of the figure represents individual mutations in patient samples, color-coded by type of mutation, for the significantly mutated genes. The rate of synonymous and non-synonymous mutations is displayed at the top of the matrix. The barplot on the left of the matrix shows the number of mutations in each gene. The percentages represent the fraction of tumors with at least one mutation in the specified gene. The barplot to the right of the matrix displays the q-values for the most significantly mutated genes. The purple boxplots below the matrix (only displayed if required columns are present in the provided MAF) represent the distributions of allelic fractions observed in each sample. The plot at the bottom represents the base substitution distribution of individual samples, using the same categories that were used to calculate significance.
Column Descriptions:
-
N = number of sequenced bases in this gene across the individual set
-
n = number of (nonsilent) mutations in this gene across the individual set
-
npat = number of patients (individuals) with at least one nonsilent mutation
-
nsite = number of unique sites having a non-silent mutation
-
nsil = number of silent mutations in this gene across the individual set
-
n1 = number of nonsilent mutations of type: *CpG->T
-
n2 = number of nonsilent mutations of type: *ApG->G
-
n3 = number of nonsilent mutations of type: *Np(A/C/T)->transit
-
n4 = number of nonsilent mutations of type: transver
-
n5 = number of nonsilent mutations of type: indel+null
-
n6 = number of nonsilent mutations of type: double_null
-
p_classic = p-value for the observed amount of nonsilent mutations being elevated in this gene
-
p_ns_s = p-value for the observed nonsilent/silent ratio being elevated in this gene
-
p_ks = p-value for clustering of mutations (Kolmogorov-Smirnoff test)
-
p_cons = p-value for enrichment of mutations at evolutionarily most-conserved sites in gene
-
p_joint = p-value for clustering + conservation
-
p = p-value (overall)
-
q = q-value, False Discovery Rate (Benjamini-Hochberg procedure)
Table 3. Get Full Table A Ranked List of Significantly Mutated Genes. Number of significant genes found: 28. Number of genes displayed: 35. Click on a gene name to display its stick figure depicting the distribution of mutations and mutation types across the chosen gene (this feature may not be available for all significant genes).
| rank | gene | description | N | n | npat | nsite | nsil | n1 | n2 | n3 | n4 | n5 | n6 | p_classic | p_ns_s | p_ks | p_cons | p_joint | p | q |
|---|---|---|---|---|---|---|---|---|---|---|---|---|---|---|---|---|---|---|---|---|
| 1 | PBRM1 | polybromo 1 | 1470408 | 108 | 106 | 105 | 1 | 0 | 1 | 6 | 15 | 86 | 0 | <1.00e-15 | 1.8e-06 | 0.058 | 0.041 | 0.017 | <6.66e-16 | <4.42e-12 |
| 2 | VHL | von Hippel-Lindau tumor suppressor | 123072 | 138 | 138 | 92 | 1 | 1 | 13 | 9 | 31 | 84 | 0 | <1.00e-15 | 1.3e-10 | 2e-07 | 2e-07 | 0 | <1.00e-15 | <4.42e-12 |
| 3 | SV2C | synaptic vesicle glycoprotein 2C | 653960 | 3 | 3 | 3 | 0 | 0 | 1 | 1 | 0 | 1 | 0 | 0.0647 | 0.3 | 0.14 | 0.0017 | 0 | <1.00e-15 | <4.42e-12 |
| 4 | TPST1 | tyrosylprotein sulfotransferase 1 | 330797 | 2 | 2 | 2 | 0 | 0 | 0 | 0 | 1 | 1 | 0 | 0.0498 | 0.74 | 0.08 | 0.00088 | 0 | <1.00e-15 | <4.42e-12 |
| 5 | SETD2 | SET domain containing 2 | 1866089 | 33 | 33 | 33 | 1 | 2 | 2 | 2 | 6 | 20 | 1 | 7.22e-15 | 0.0052 | 0.013 | 0.028 | 0.0042 | 1.22e-15 | 4.42e-12 |
| 6 | BAP1 | BRCA1 associated protein-1 (ubiquitin carboxy-terminal hydrolase) | 589189 | 27 | 27 | 24 | 1 | 0 | 2 | 6 | 4 | 14 | 1 | 3.00e-15 | 0.0042 | 0.05 | 0.55 | 0.092 | 1.01e-14 | 3.05e-11 |
| 7 | KDM5C | lysine (K)-specific demethylase 5C | 1253863 | 18 | 18 | 18 | 0 | 0 | 0 | 1 | 5 | 12 | 0 | 5.44e-12 | 0.044 | 0.0057 | 0.3 | 0.012 | 2.12e-12 | 5.49e-09 |
| 8 | MTOR | mechanistic target of rapamycin (serine/threonine kinase) | 2294678 | 26 | 24 | 22 | 2 | 1 | 2 | 4 | 19 | 0 | 0 | 1.37e-08 | 0.043 | 0.005 | 0.51 | 0.0088 | 2.89e-09 | 6.55e-06 |
| 9 | EBPL | emopamil binding protein-like | 139558 | 7 | 6 | 3 | 0 | 1 | 0 | 0 | 6 | 0 | 0 | 1.89e-07 | 0.2 | 0.00032 | 1 | 0.00097 | 4.29e-09 | 8.64e-06 |
| 10 | MUC4 | mucin 4, cell surface associated | 958196 | 65 | 41 | 50 | 15 | 4 | 0 | 22 | 35 | 4 | 0 | 5.12e-09 | 0.16 | NaN | NaN | NaN | 5.12e-09 | 9.28e-06 |
| 11 | TP53 | tumor protein p53 | 372038 | 7 | 6 | 7 | 1 | 2 | 0 | 3 | 1 | 1 | 0 | 4.99e-05 | 0.3 | 0.00012 | 0.00092 | 0.000019 | 2.04e-08 | 3.37e-05 |
| 12 | TOR1A | torsin family 1, member A (torsin A) | 280456 | 3 | 3 | 1 | 0 | 0 | 0 | 3 | 0 | 0 | 0 | 0.0149 | 0.27 | 6.6e-06 | 0.001 | 2e-07 | 6.13e-08 | 8.23e-05 |
| 13 | PTEN | phosphatase and tensin homolog (mutated in multiple advanced cancers 1) | 365609 | 10 | 9 | 10 | 0 | 0 | 0 | 2 | 2 | 6 | 0 | 1.23e-08 | 0.059 | 0.17 | 0.51 | 0.25 | 6.34e-08 | 8.23e-05 |
| 14 | NBPF10 | neuroblastoma breakpoint family, member 10 | 1006919 | 25 | 19 | 17 | 5 | 2 | 2 | 5 | 16 | 0 | 0 | 1.55e-05 | 0.36 | 4e-05 | 1 | 0.0002 | 6.36e-08 | 8.23e-05 |
| 15 | UQCRFS1 | ubiquinol-cytochrome c reductase, Rieske iron-sulfur polypeptide 1 | 180195 | 3 | 3 | 1 | 0 | 0 | 0 | 3 | 0 | 0 | 0 | 0.00329 | 0.31 | 6e-06 | 1 | 0.000011 | 6.67e-07 | 0.000806 |
| 16 | PIK3CA | phosphoinositide-3-kinase, catalytic, alpha polypeptide | 963086 | 10 | 10 | 9 | 0 | 0 | 0 | 5 | 4 | 1 | 0 | 2.57e-05 | 0.068 | 0.01 | 0.46 | 0.016 | 6.55e-06 | 0.00742 |
| 17 | WDR52 | WD repeat domain 52 | 887493 | 10 | 9 | 6 | 1 | 1 | 1 | 0 | 8 | 0 | 0 | 2.69e-05 | 0.35 | 0.066 | 0.045 | 0.024 | 1.00e-05 | 0.0107 |
| 18 | TSPAN19 | tetraspanin 19 | 144817 | 4 | 4 | 4 | 0 | 0 | 0 | 1 | 1 | 2 | 0 | 5.06e-05 | 0.6 | 0.007 | 0.26 | 0.014 | 1.10e-05 | 0.0111 |
| 19 | CR1 | complement component (3b/4b) receptor 1 (Knops blood group) | 1444581 | 10 | 10 | 7 | 0 | 1 | 0 | 0 | 4 | 5 | 0 | 0.000116 | 0.14 | 0.046 | 0.026 | 0.016 | 2.70e-05 | 0.0257 |
| 20 | CNTNAP4 | contactin associated protein-like 4 | 1140427 | 9 | 9 | 8 | 0 | 2 | 2 | 2 | 3 | 0 | 0 | 0.000123 | 0.048 | 0.024 | 0.94 | 0.047 | 7.53e-05 | 0.0682 |
| 21 | BAGE2 | B melanoma antigen family, member 2 | 101378 | 4 | 4 | 4 | 0 | 1 | 0 | 1 | 1 | 1 | 0 | 2.17e-05 | 0.29 | 0.1 | 0.82 | 0.31 | 8.63e-05 | 0.0690 |
| 22 | ABCB1 | ATP-binding cassette, sub-family B (MDR/TAP), member 1 | 1157641 | 9 | 8 | 9 | 0 | 0 | 0 | 4 | 3 | 2 | 0 | 0.00144 | 0.084 | 0.004 | 0.16 | 0.0047 | 8.71e-05 | 0.0690 |
| 23 | STAG2 | stromal antigen 2 | 1153594 | 9 | 9 | 9 | 1 | 2 | 0 | 1 | 3 | 3 | 0 | 9.98e-05 | 0.55 | 0.041 | 0.8 | 0.071 | 9.11e-05 | 0.0690 |
| 24 | MSN | moesin | 458269 | 4 | 4 | 4 | 0 | 1 | 0 | 0 | 2 | 1 | 0 | 0.00439 | 0.39 | 0.0034 | 0.03 | 0.0016 | 9.13e-05 | 0.0690 |
| 25 | NPNT | nephronectin | 489577 | 6 | 6 | 6 | 0 | 2 | 0 | 0 | 3 | 1 | 0 | 0.000166 | 0.3 | 0.13 | 0.042 | 0.052 | 0.000110 | 0.0801 |
| 26 | OR5M8 | olfactory receptor, family 5, subfamily M, member 8 | 275420 | 3 | 2 | 3 | 0 | 0 | 0 | 0 | 2 | 1 | 0 | 0.0296 | 0.45 | 0.00032 | 0.22 | 0.00039 | 0.000142 | 0.0956 |
| 27 | SPAM1 | sperm adhesion molecule 1 (PH-20 hyaluronidase, zona pellucida binding) | 451804 | 5 | 5 | 5 | 0 | 2 | 0 | 1 | 2 | 0 | 0 | 0.000321 | 0.26 | 0.19 | 0.018 | 0.036 | 0.000144 | 0.0956 |
| 28 | CYB5R3 | cytochrome b5 reductase 3 | 220734 | 2 | 2 | 2 | 0 | 0 | 0 | 0 | 1 | 1 | 0 | 0.0510 | 0.68 | 0.00021 | 0.38 | 0.00024 | 0.000148 | 0.0956 |
| 29 | CLIC6 | chloride intracellular channel 6 | 224207 | 3 | 3 | 3 | 0 | 1 | 0 | 0 | 2 | 0 | 0 | 0.00595 | 0.4 | 0.015 | 0.0024 | 0.0023 | 0.000166 | 0.104 |
| 30 | OR12D3 | olfactory receptor, family 12, subfamily D, member 3 | 279814 | 2 | 2 | 2 | 0 | 1 | 0 | 1 | 0 | 0 | 0 | 0.0241 | 0.45 | 0.00091 | 0.31 | 0.00064 | 0.000186 | 0.112 |
| 31 | NFE2L2 | nuclear factor (erythroid-derived 2)-like 2 | 524177 | 5 | 5 | 5 | 0 | 0 | 0 | 2 | 3 | 0 | 0 | 0.00360 | 0.29 | 0.065 | 0.0051 | 0.005 | 0.000216 | 0.126 |
| 32 | SLC2A14 | solute carrier family 2 (facilitated glucose transporter), member 14 | 442987 | 3 | 3 | 3 | 0 | 1 | 0 | 1 | 1 | 0 | 0 | 0.0215 | 0.34 | 0.00073 | 0.81 | 0.0011 | 0.000280 | 0.158 |
| 33 | TPTE2 | transmembrane phosphoinositide 3-phosphatase and tensin homolog 2 | 483148 | 8 | 7 | 8 | 1 | 1 | 0 | 0 | 6 | 1 | 0 | 3.70e-05 | 0.5 | 0.42 | 0.56 | 0.67 | 0.000288 | 0.158 |
| 34 | ZNF800 | zinc finger protein 800 | 590395 | 6 | 6 | 6 | 0 | 0 | 1 | 1 | 2 | 2 | 0 | 0.000308 | 0.25 | 0.49 | 0.028 | 0.09 | 0.000318 | 0.168 |
| 35 | CCNB2 | cyclin B2 | 353170 | 5 | 5 | 5 | 0 | 0 | 0 | 2 | 1 | 2 | 0 | 0.000166 | 0.22 | 0.22 | 0.14 | 0.17 | 0.000325 | 0.168 |
Figure S1. This figure depicts the distribution of mutations and mutation types across the PBRM1 significant gene.
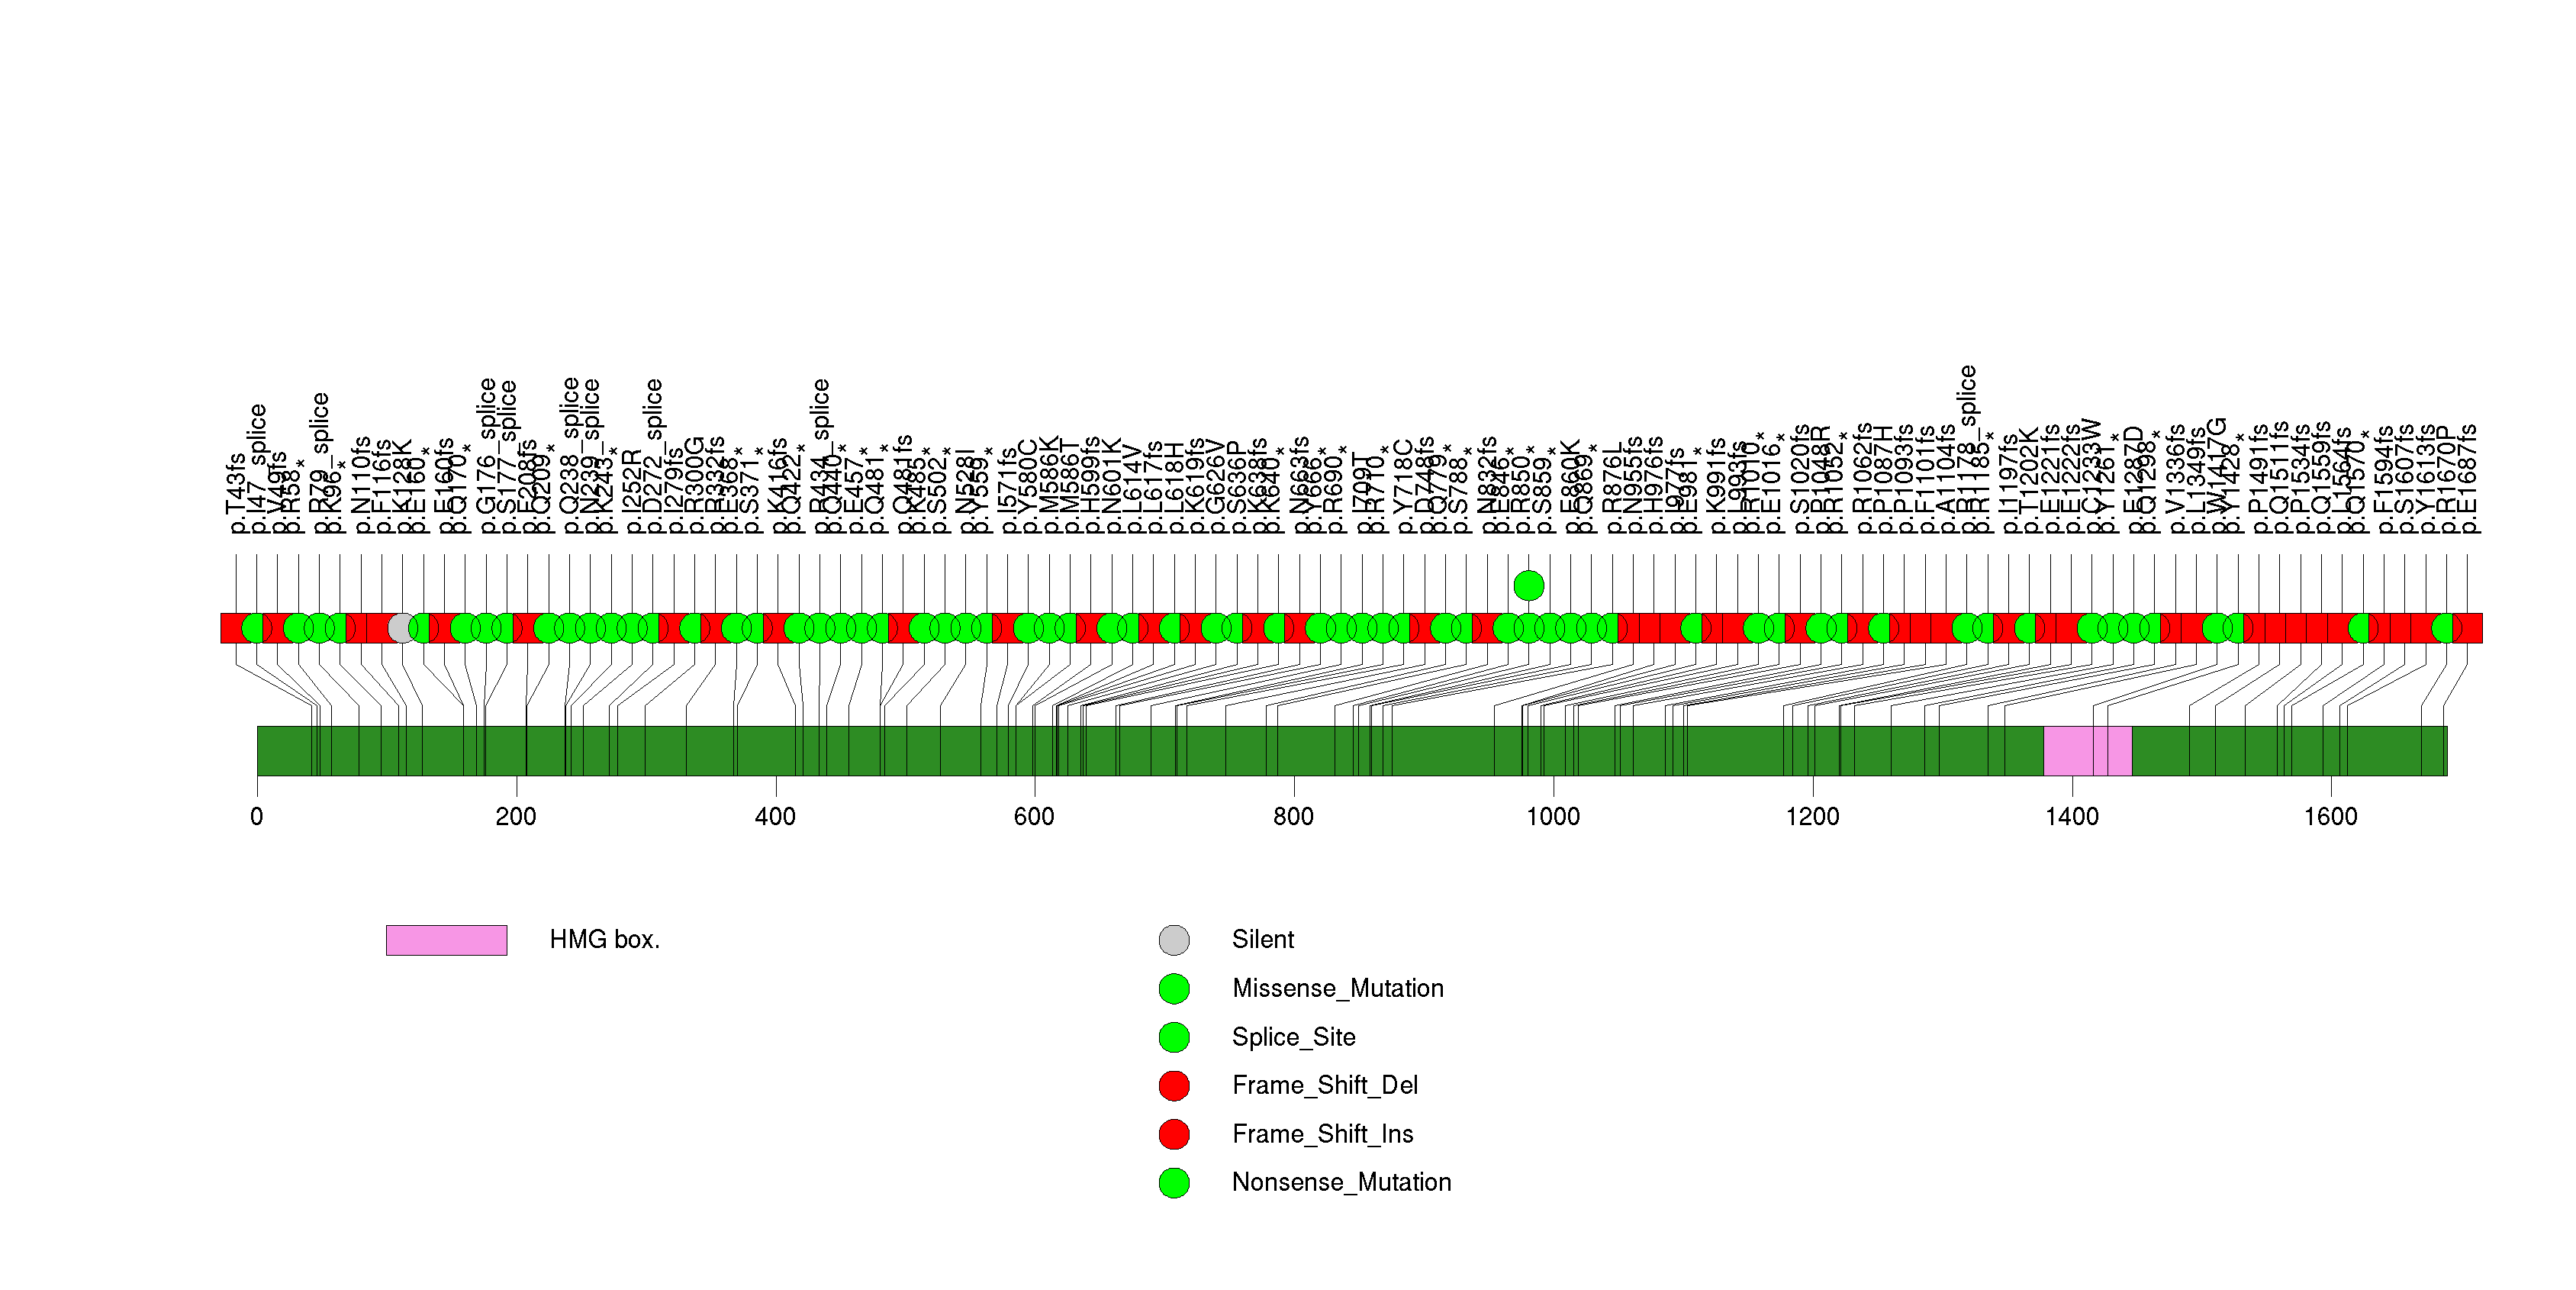
Figure S2. This figure depicts the distribution of mutations and mutation types across the VHL significant gene.
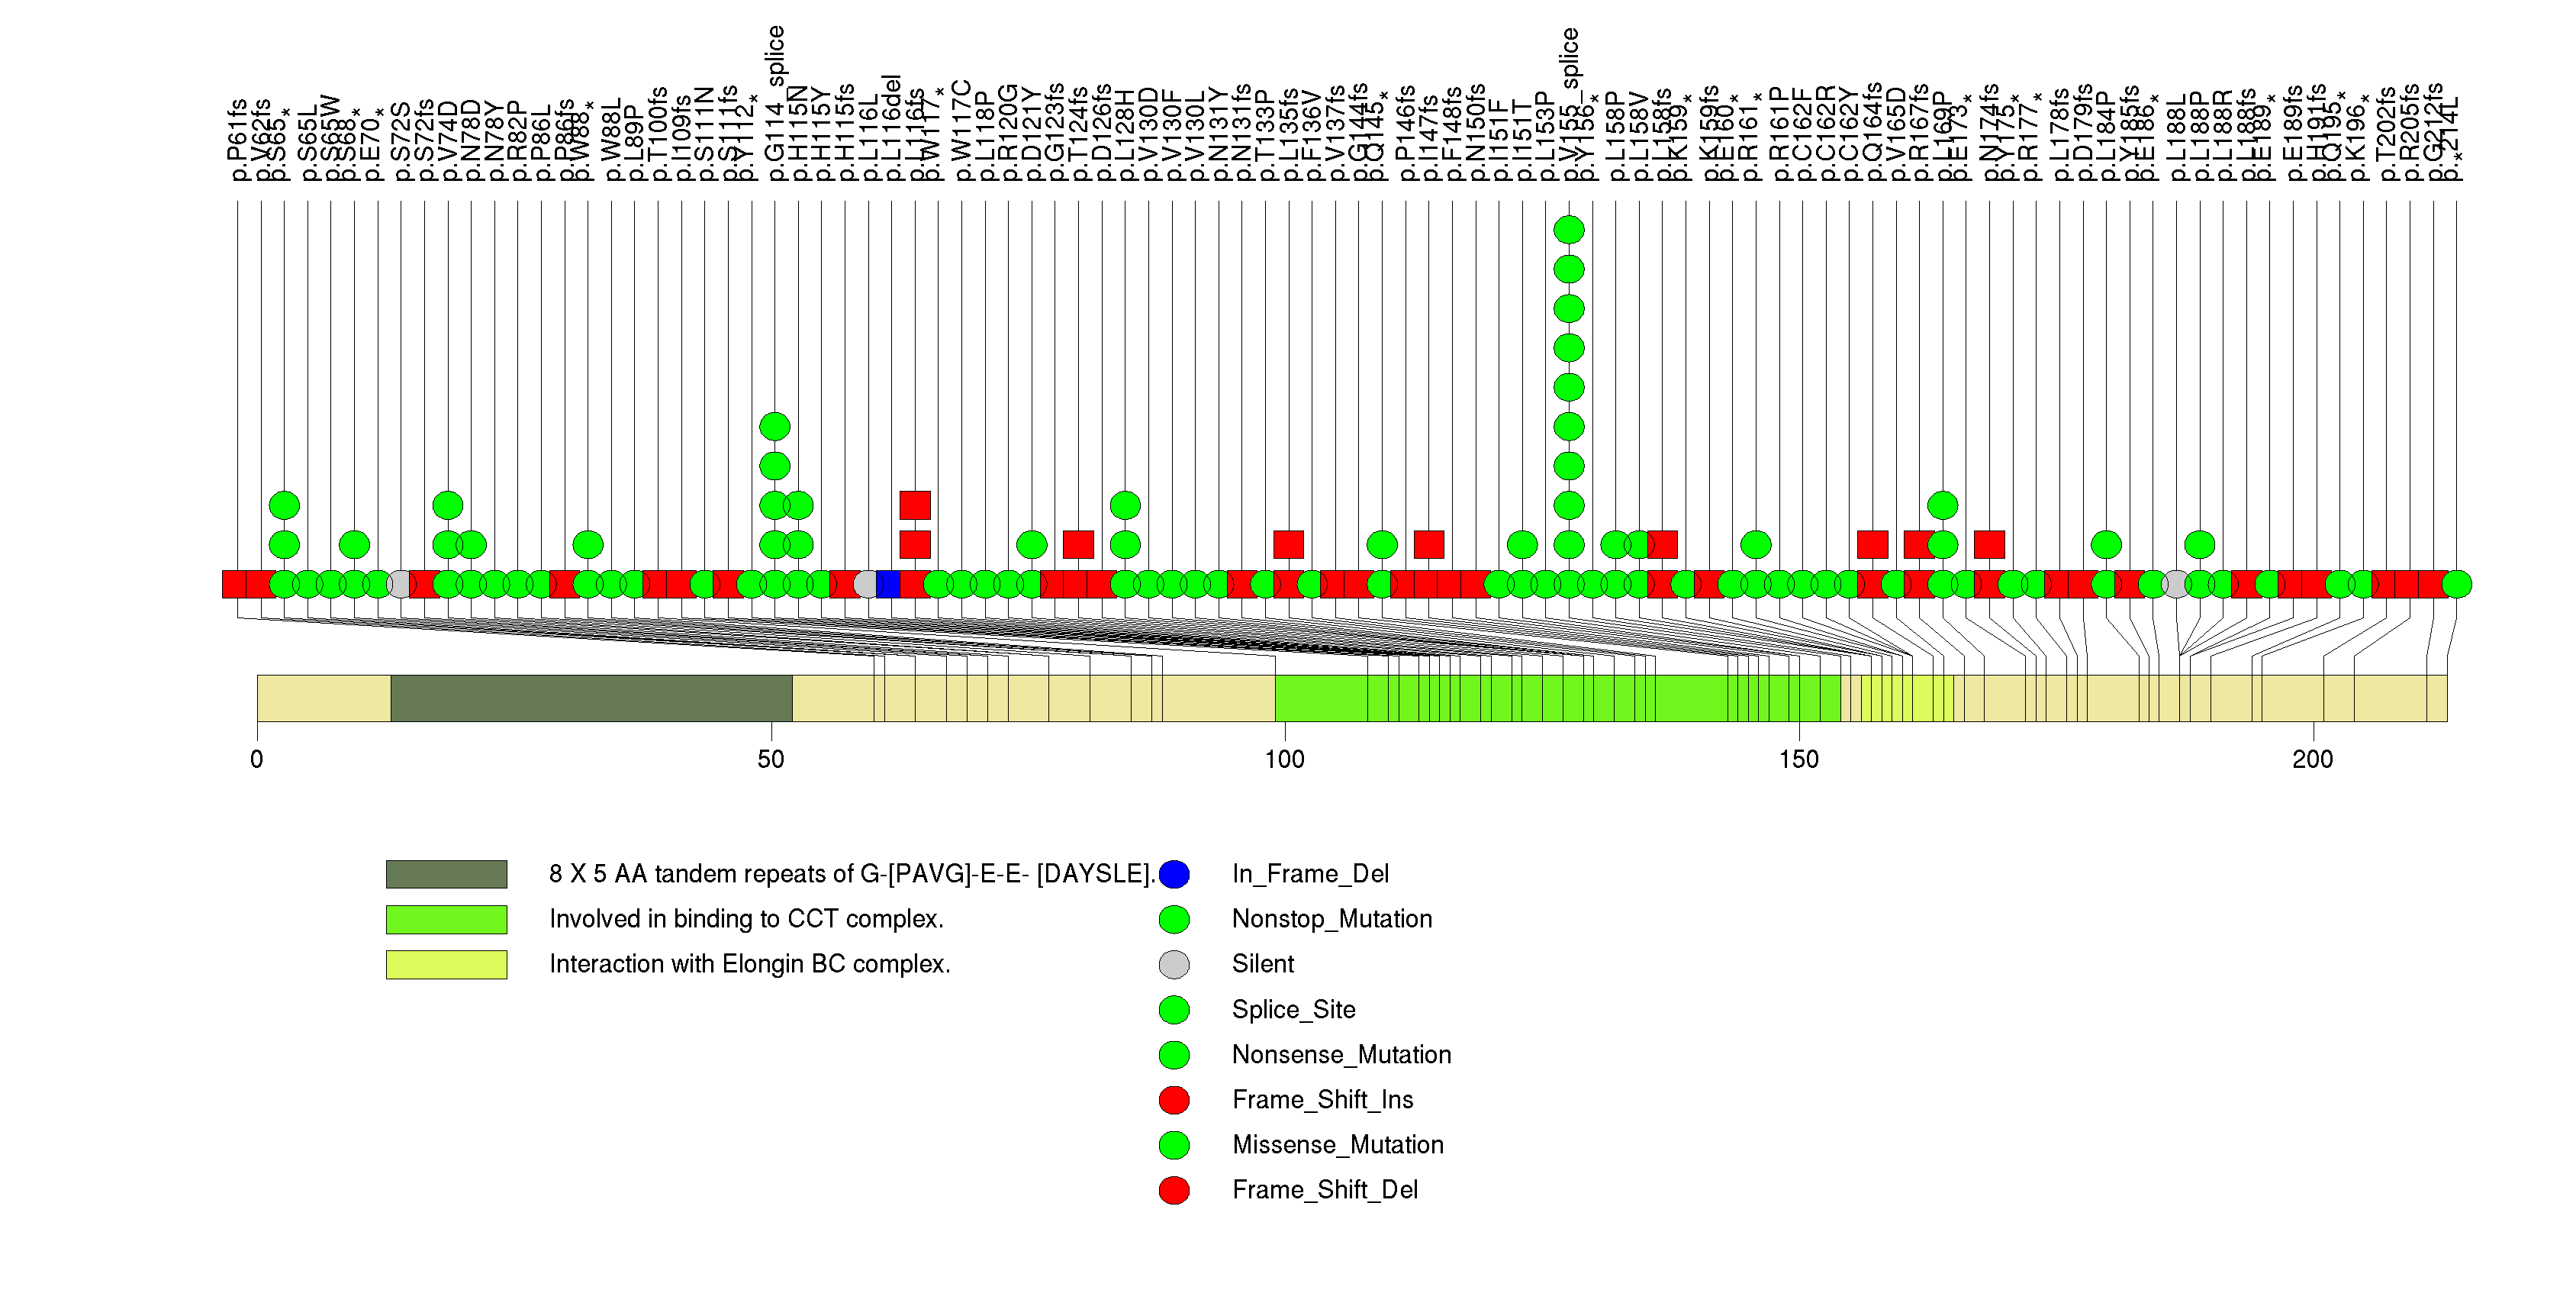
Figure S3. This figure depicts the distribution of mutations and mutation types across the SV2C significant gene.
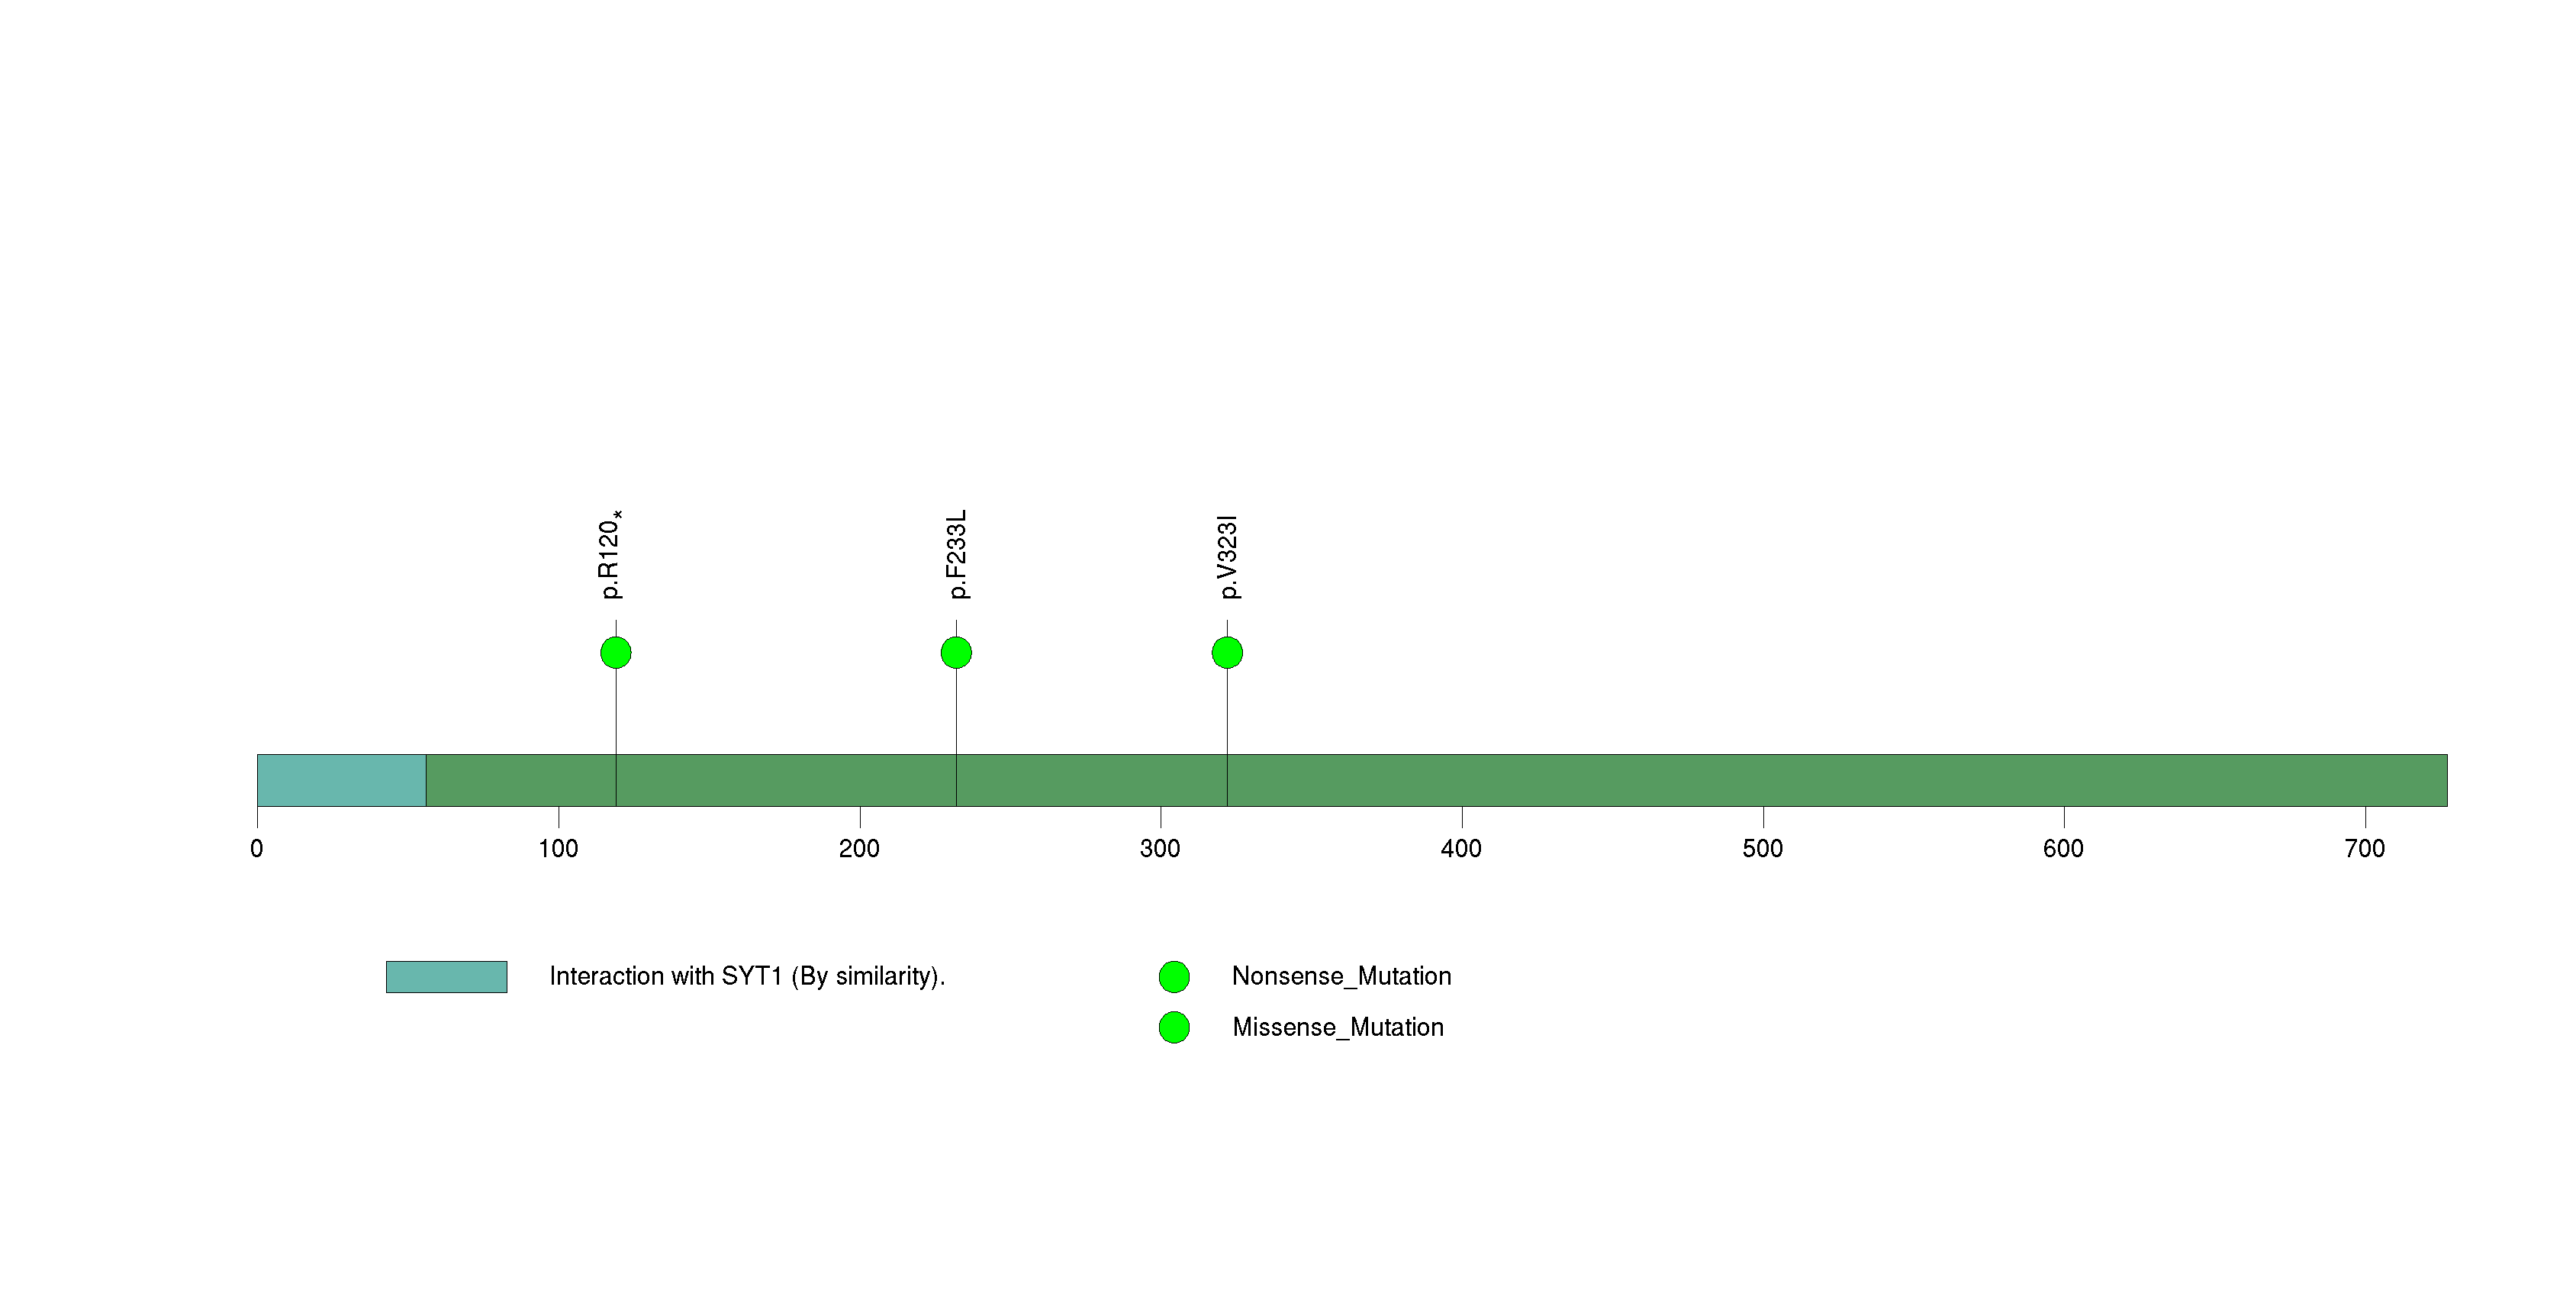
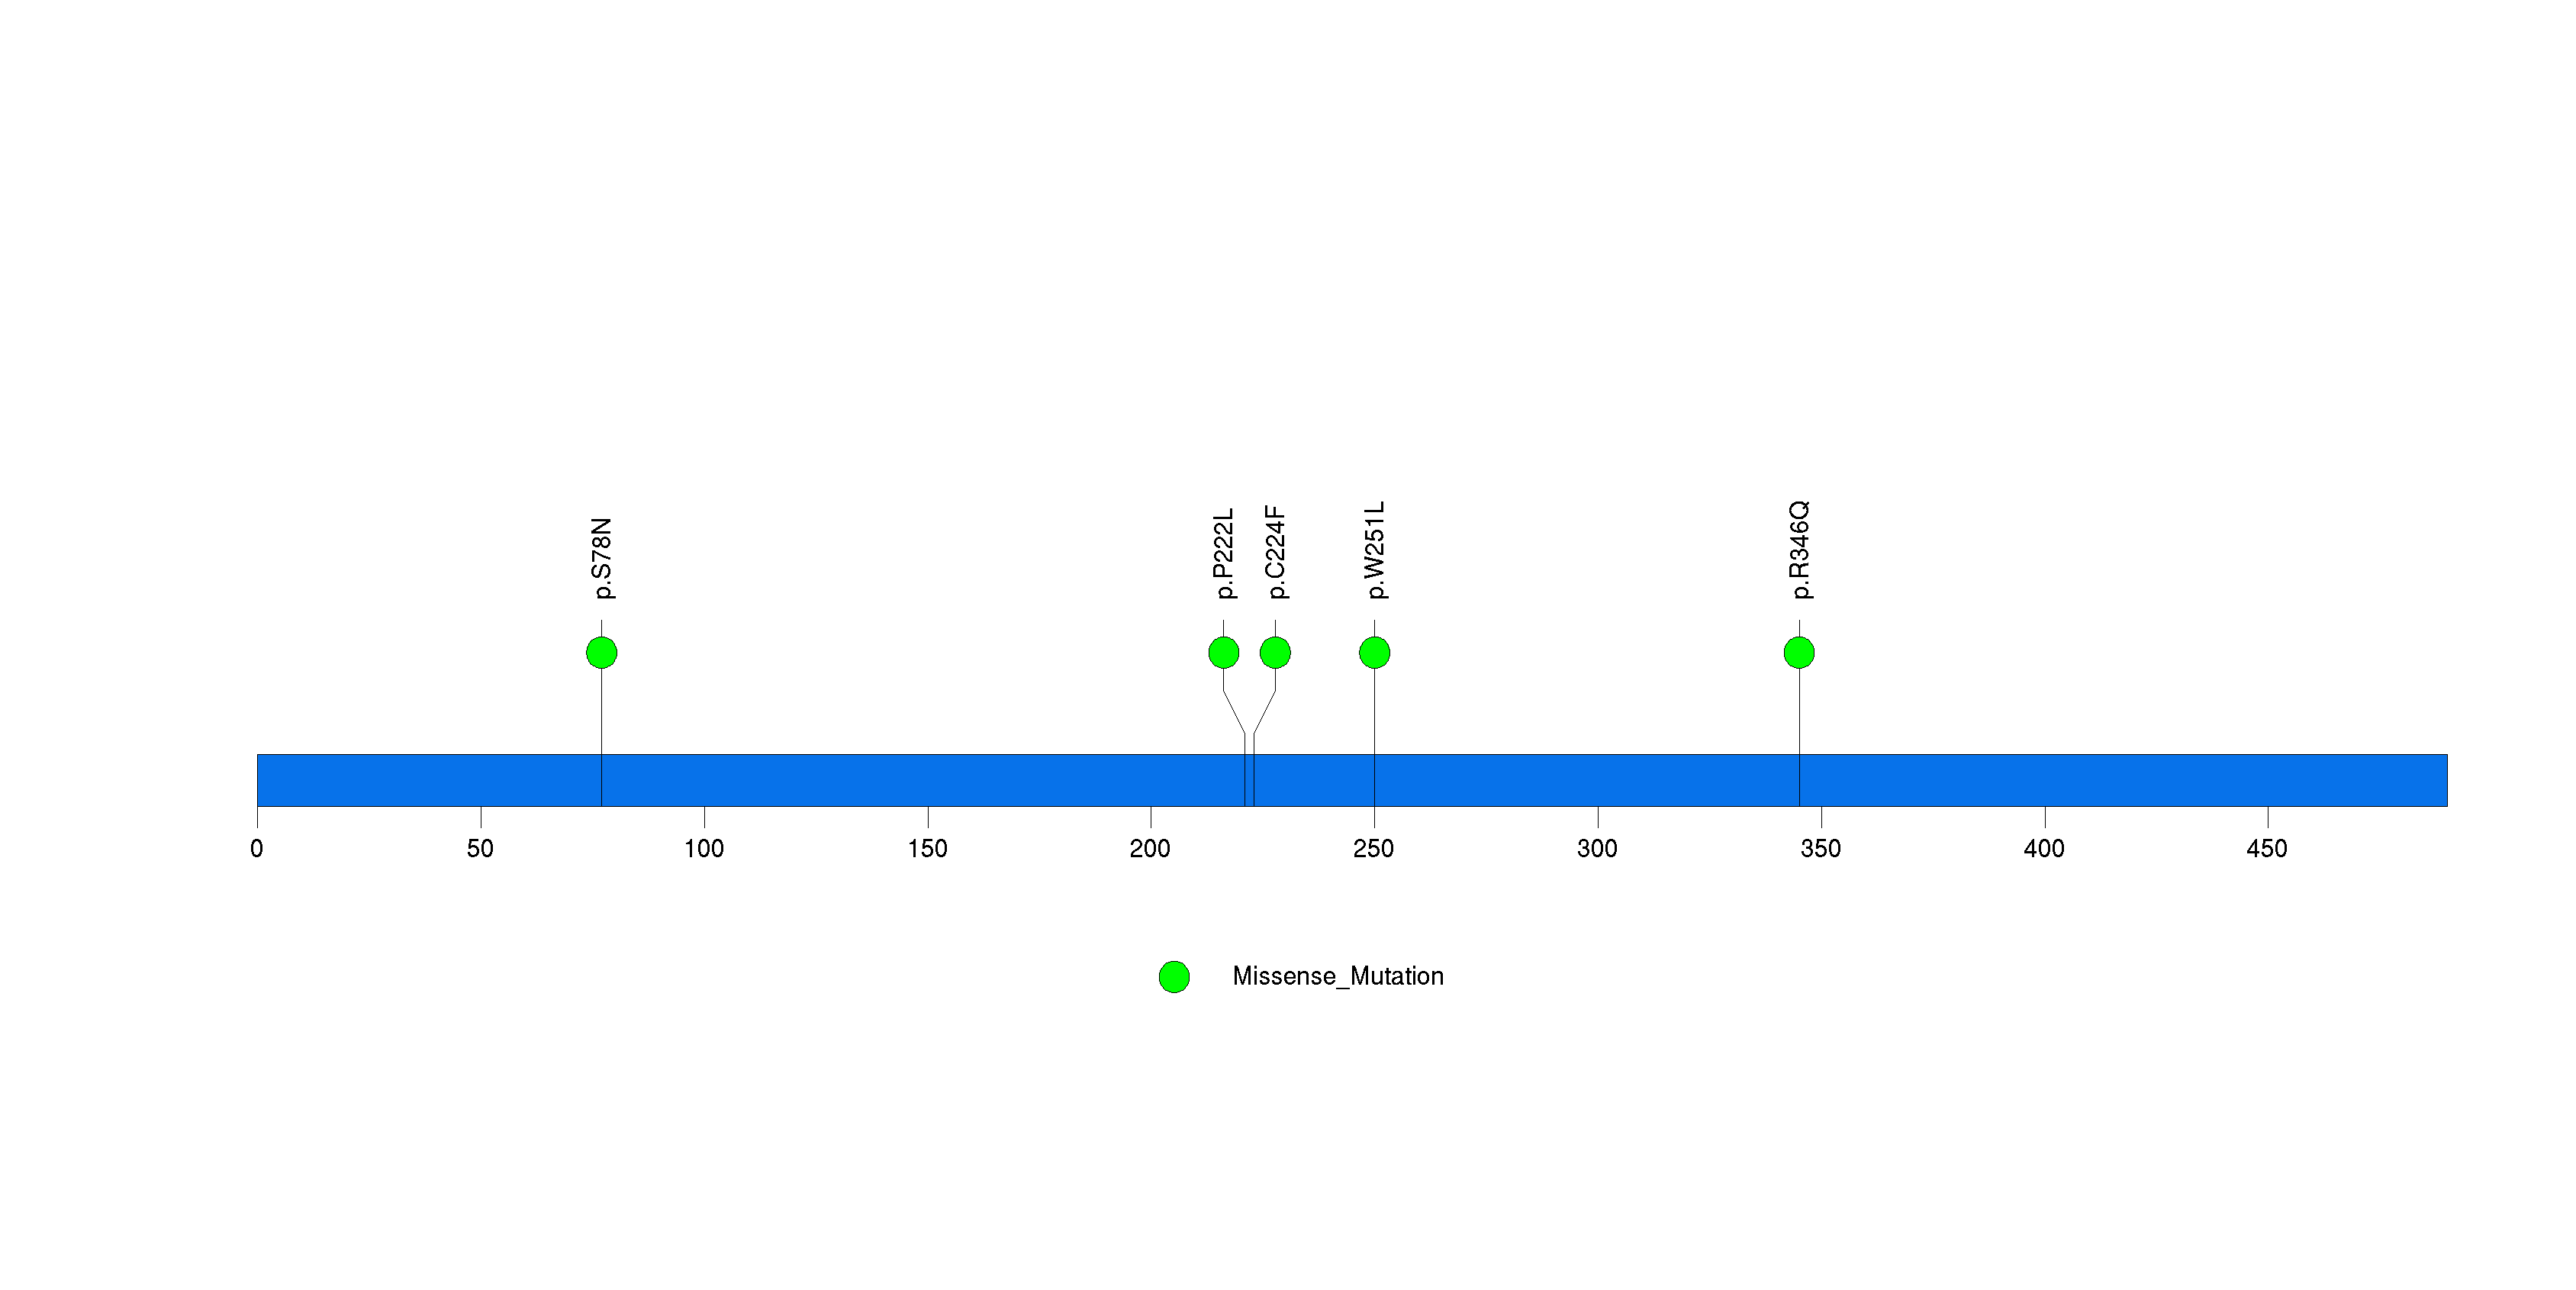
Figure S4. This figure depicts the distribution of mutations and mutation types across the TPST1 significant gene.
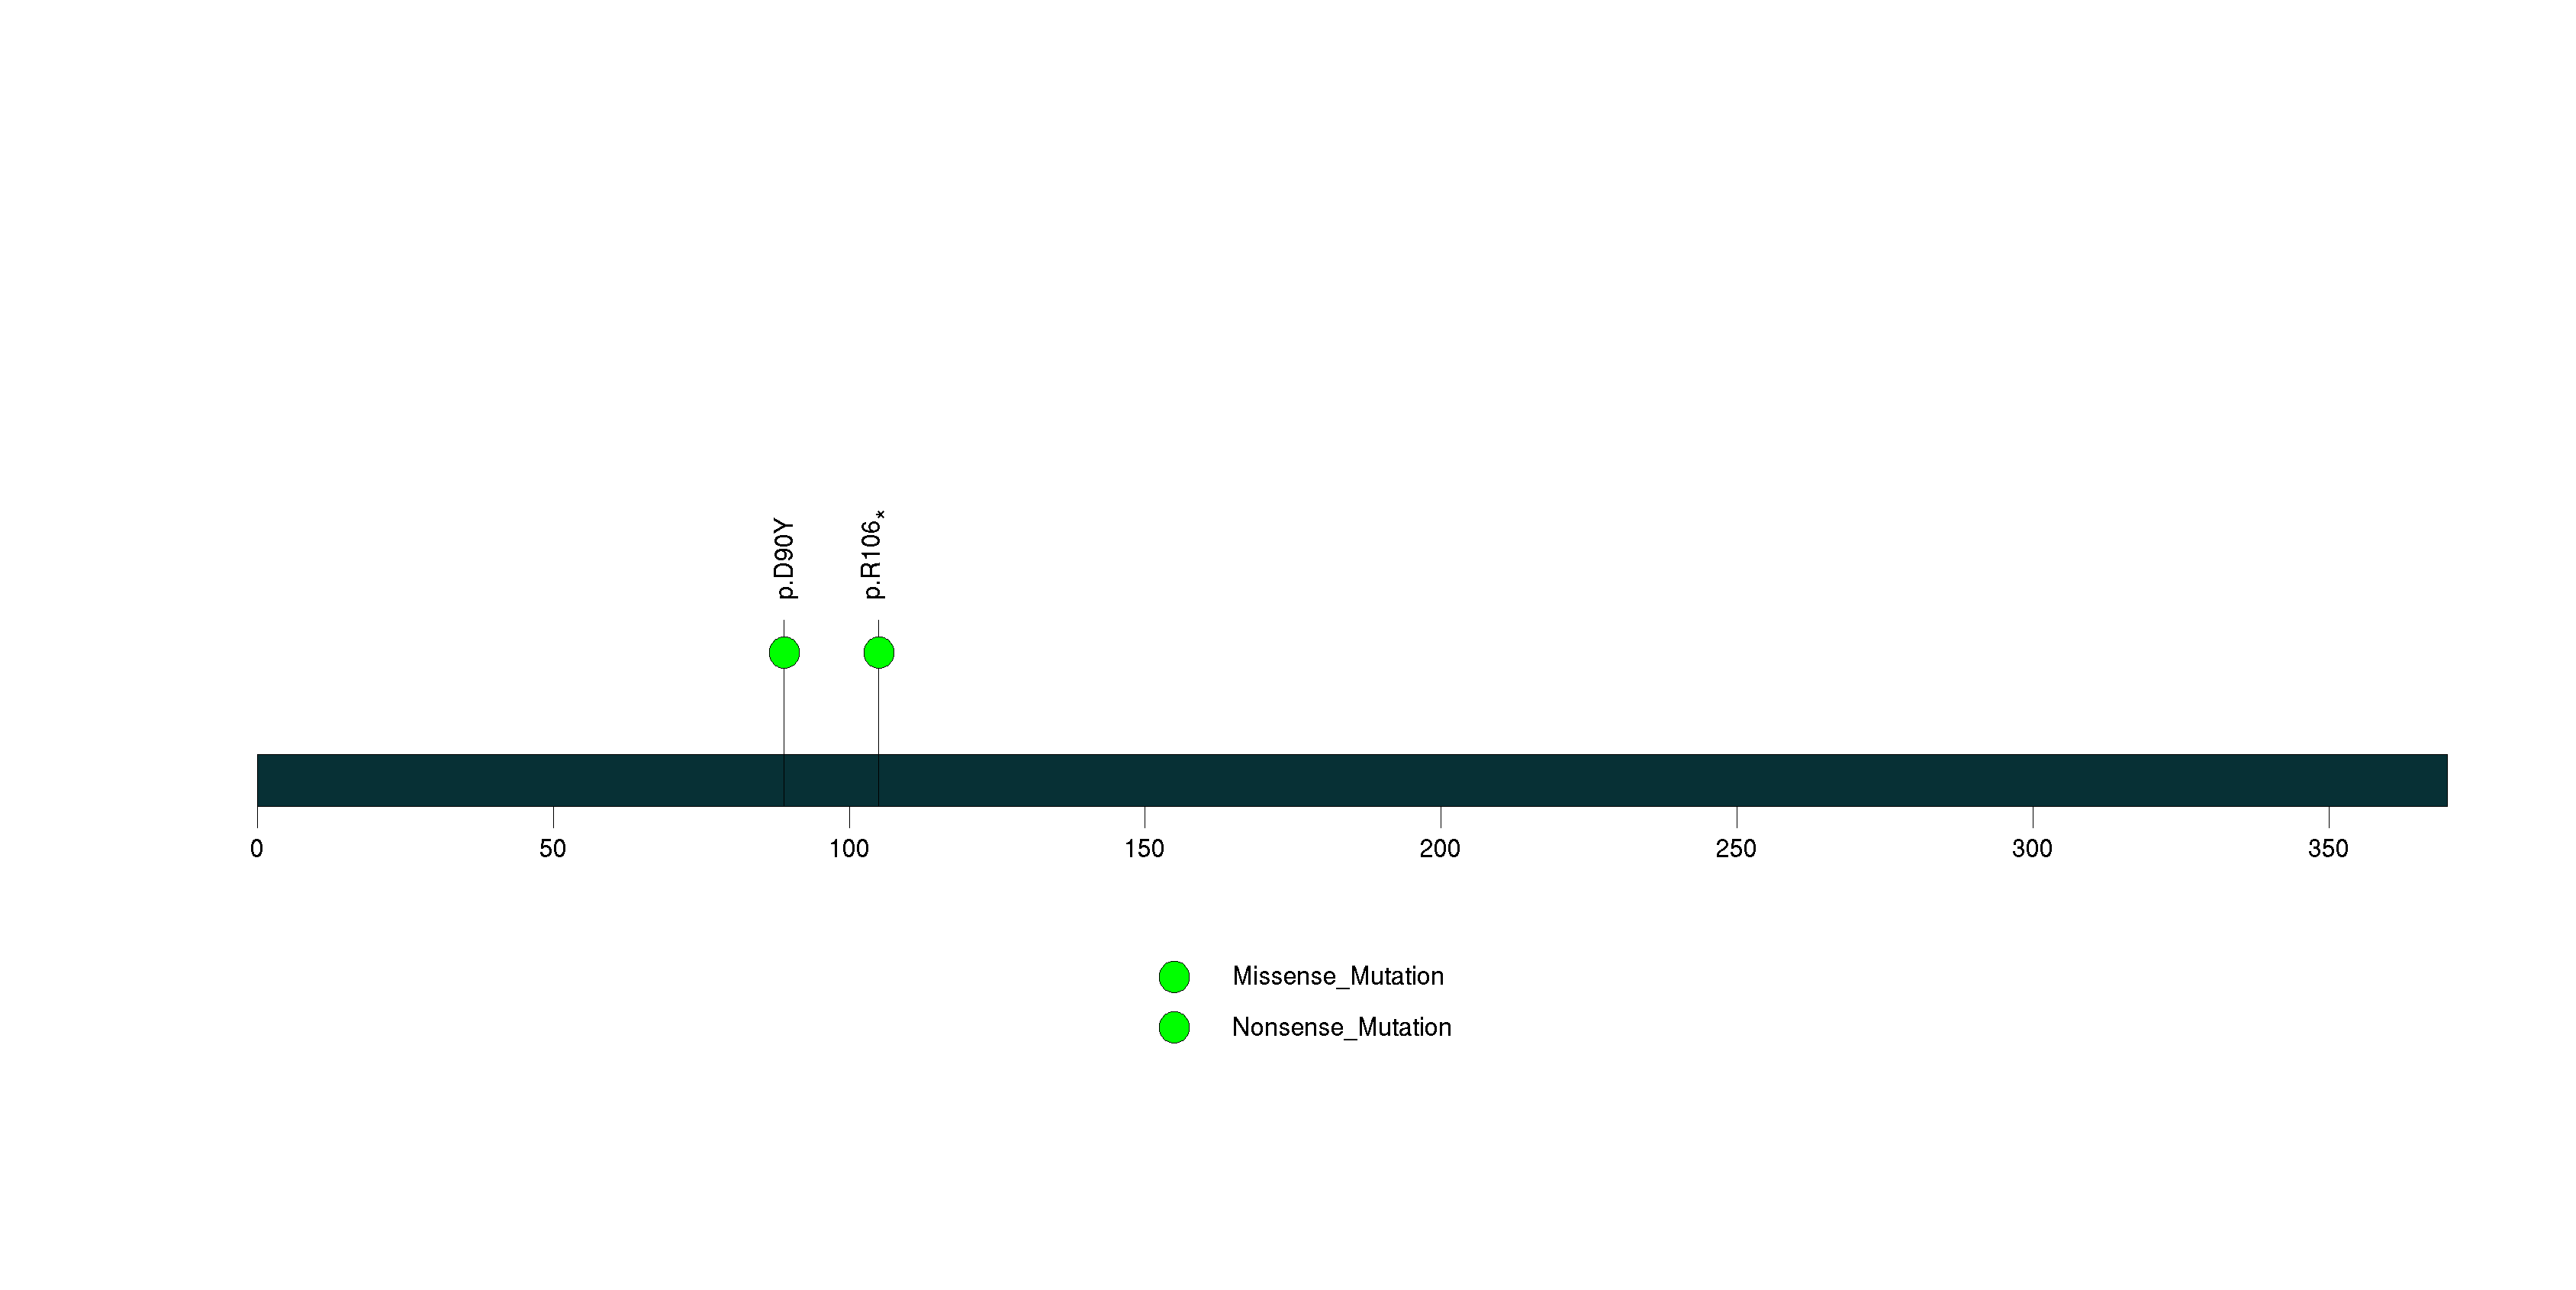
Figure S5. This figure depicts the distribution of mutations and mutation types across the SETD2 significant gene.
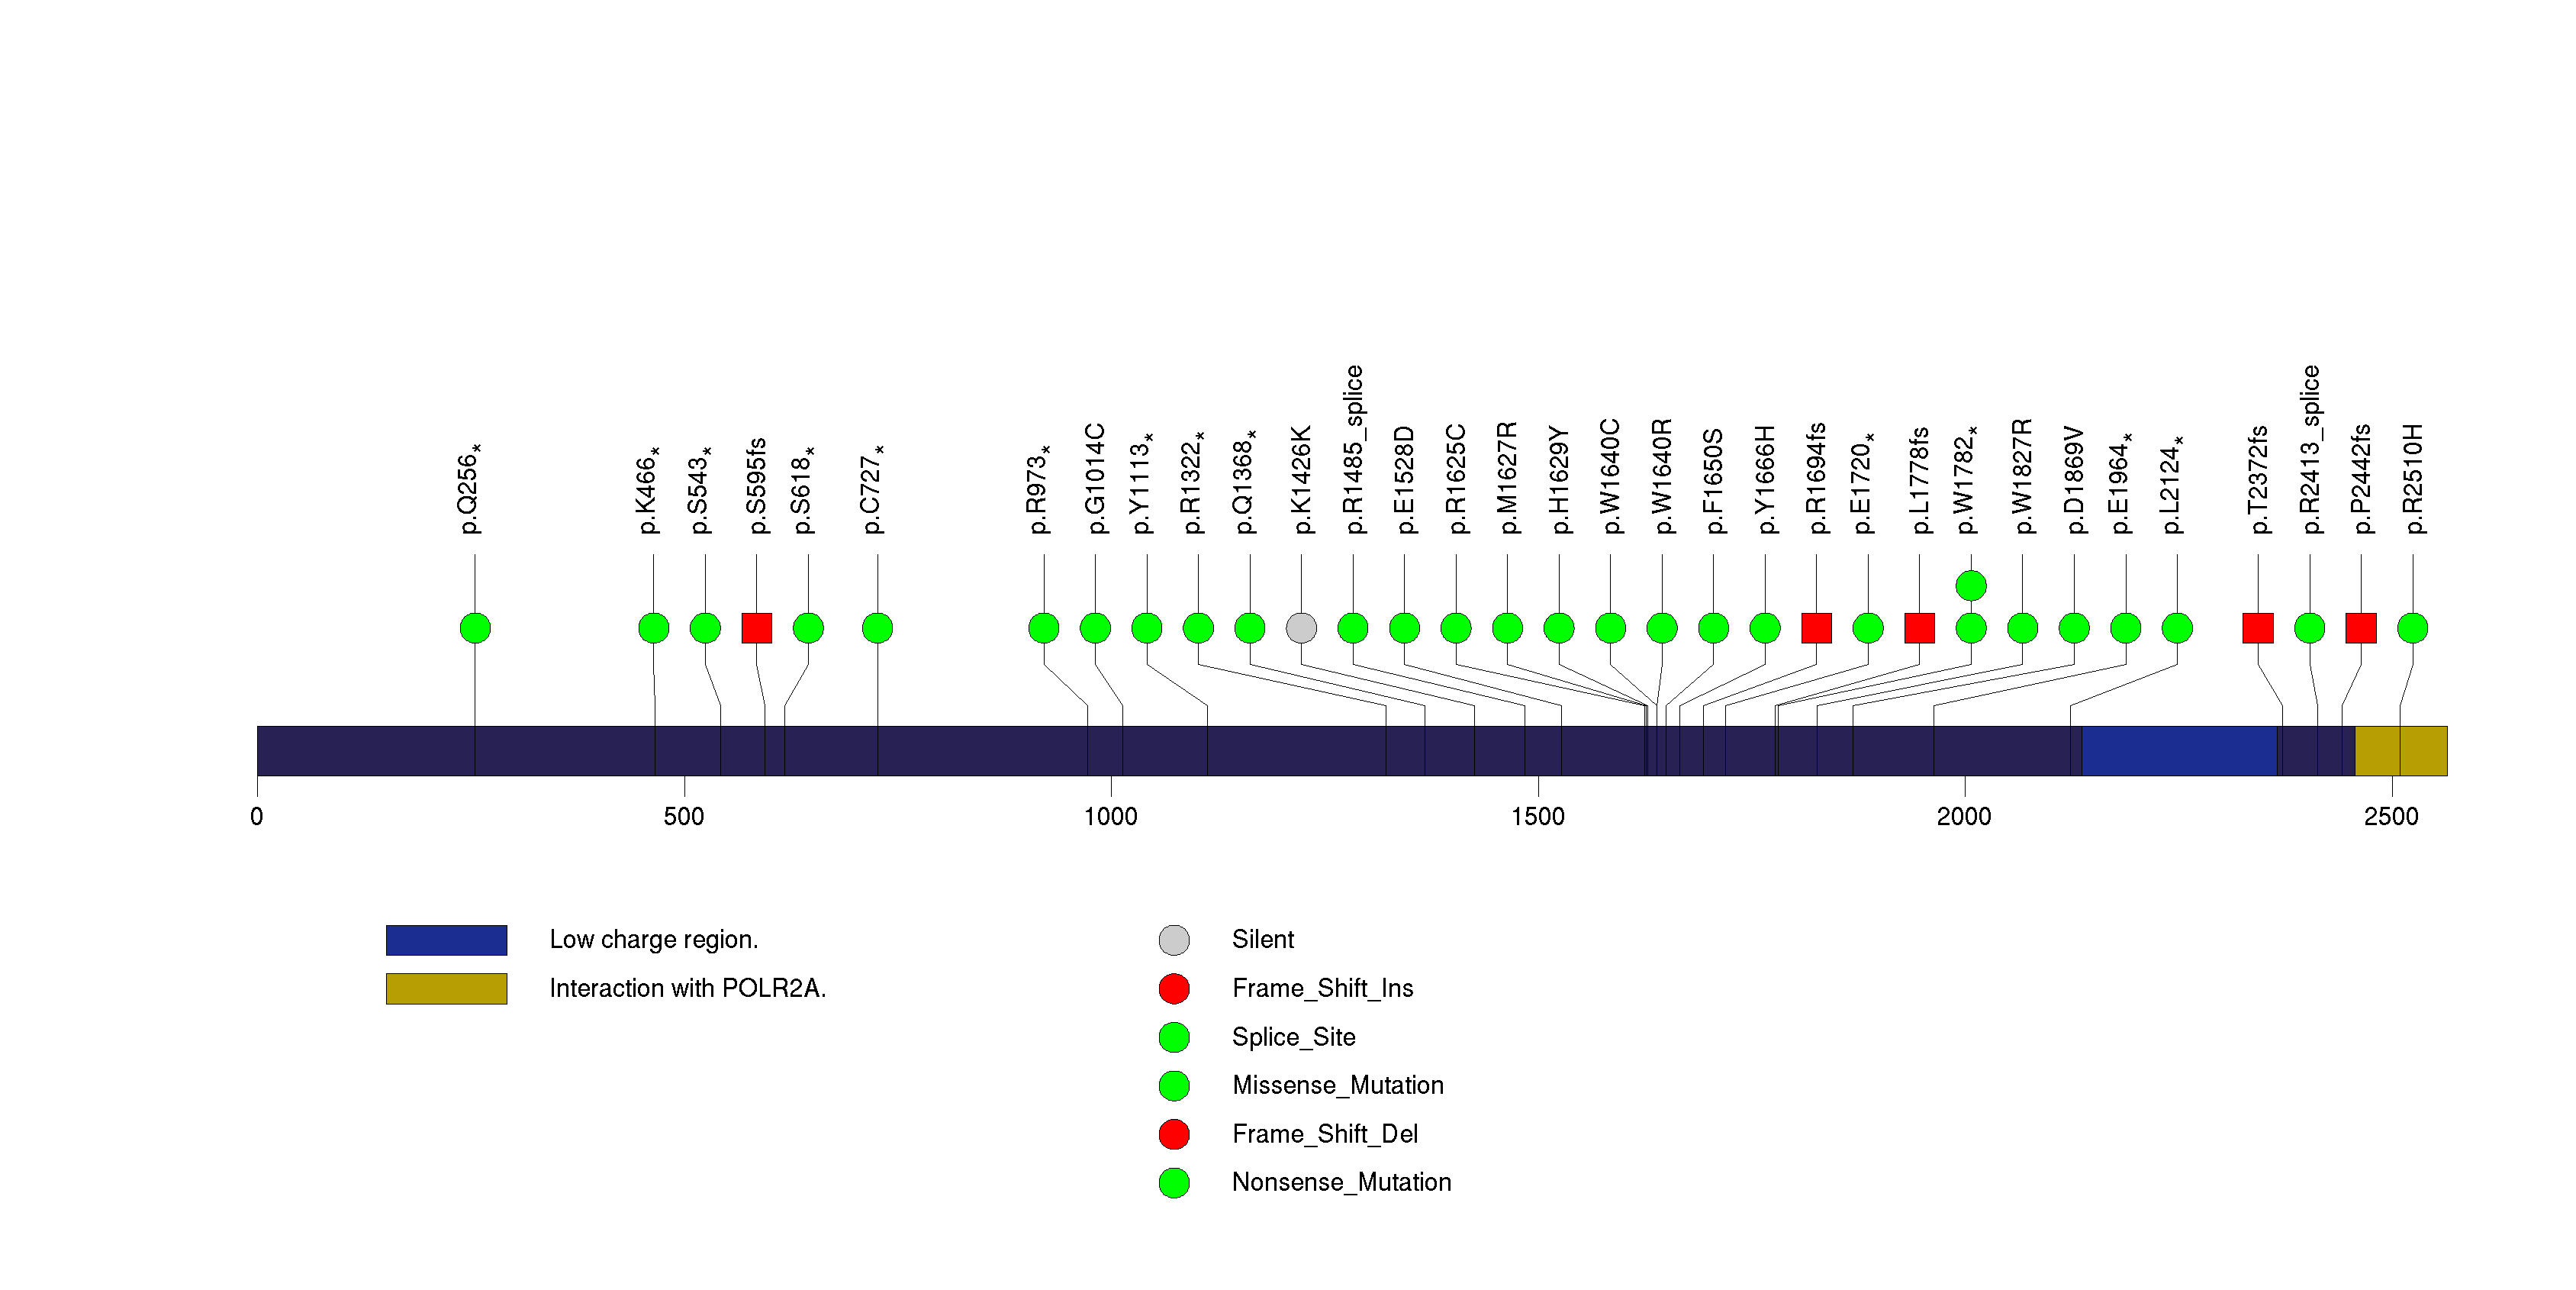
Figure S6. This figure depicts the distribution of mutations and mutation types across the BAP1 significant gene.
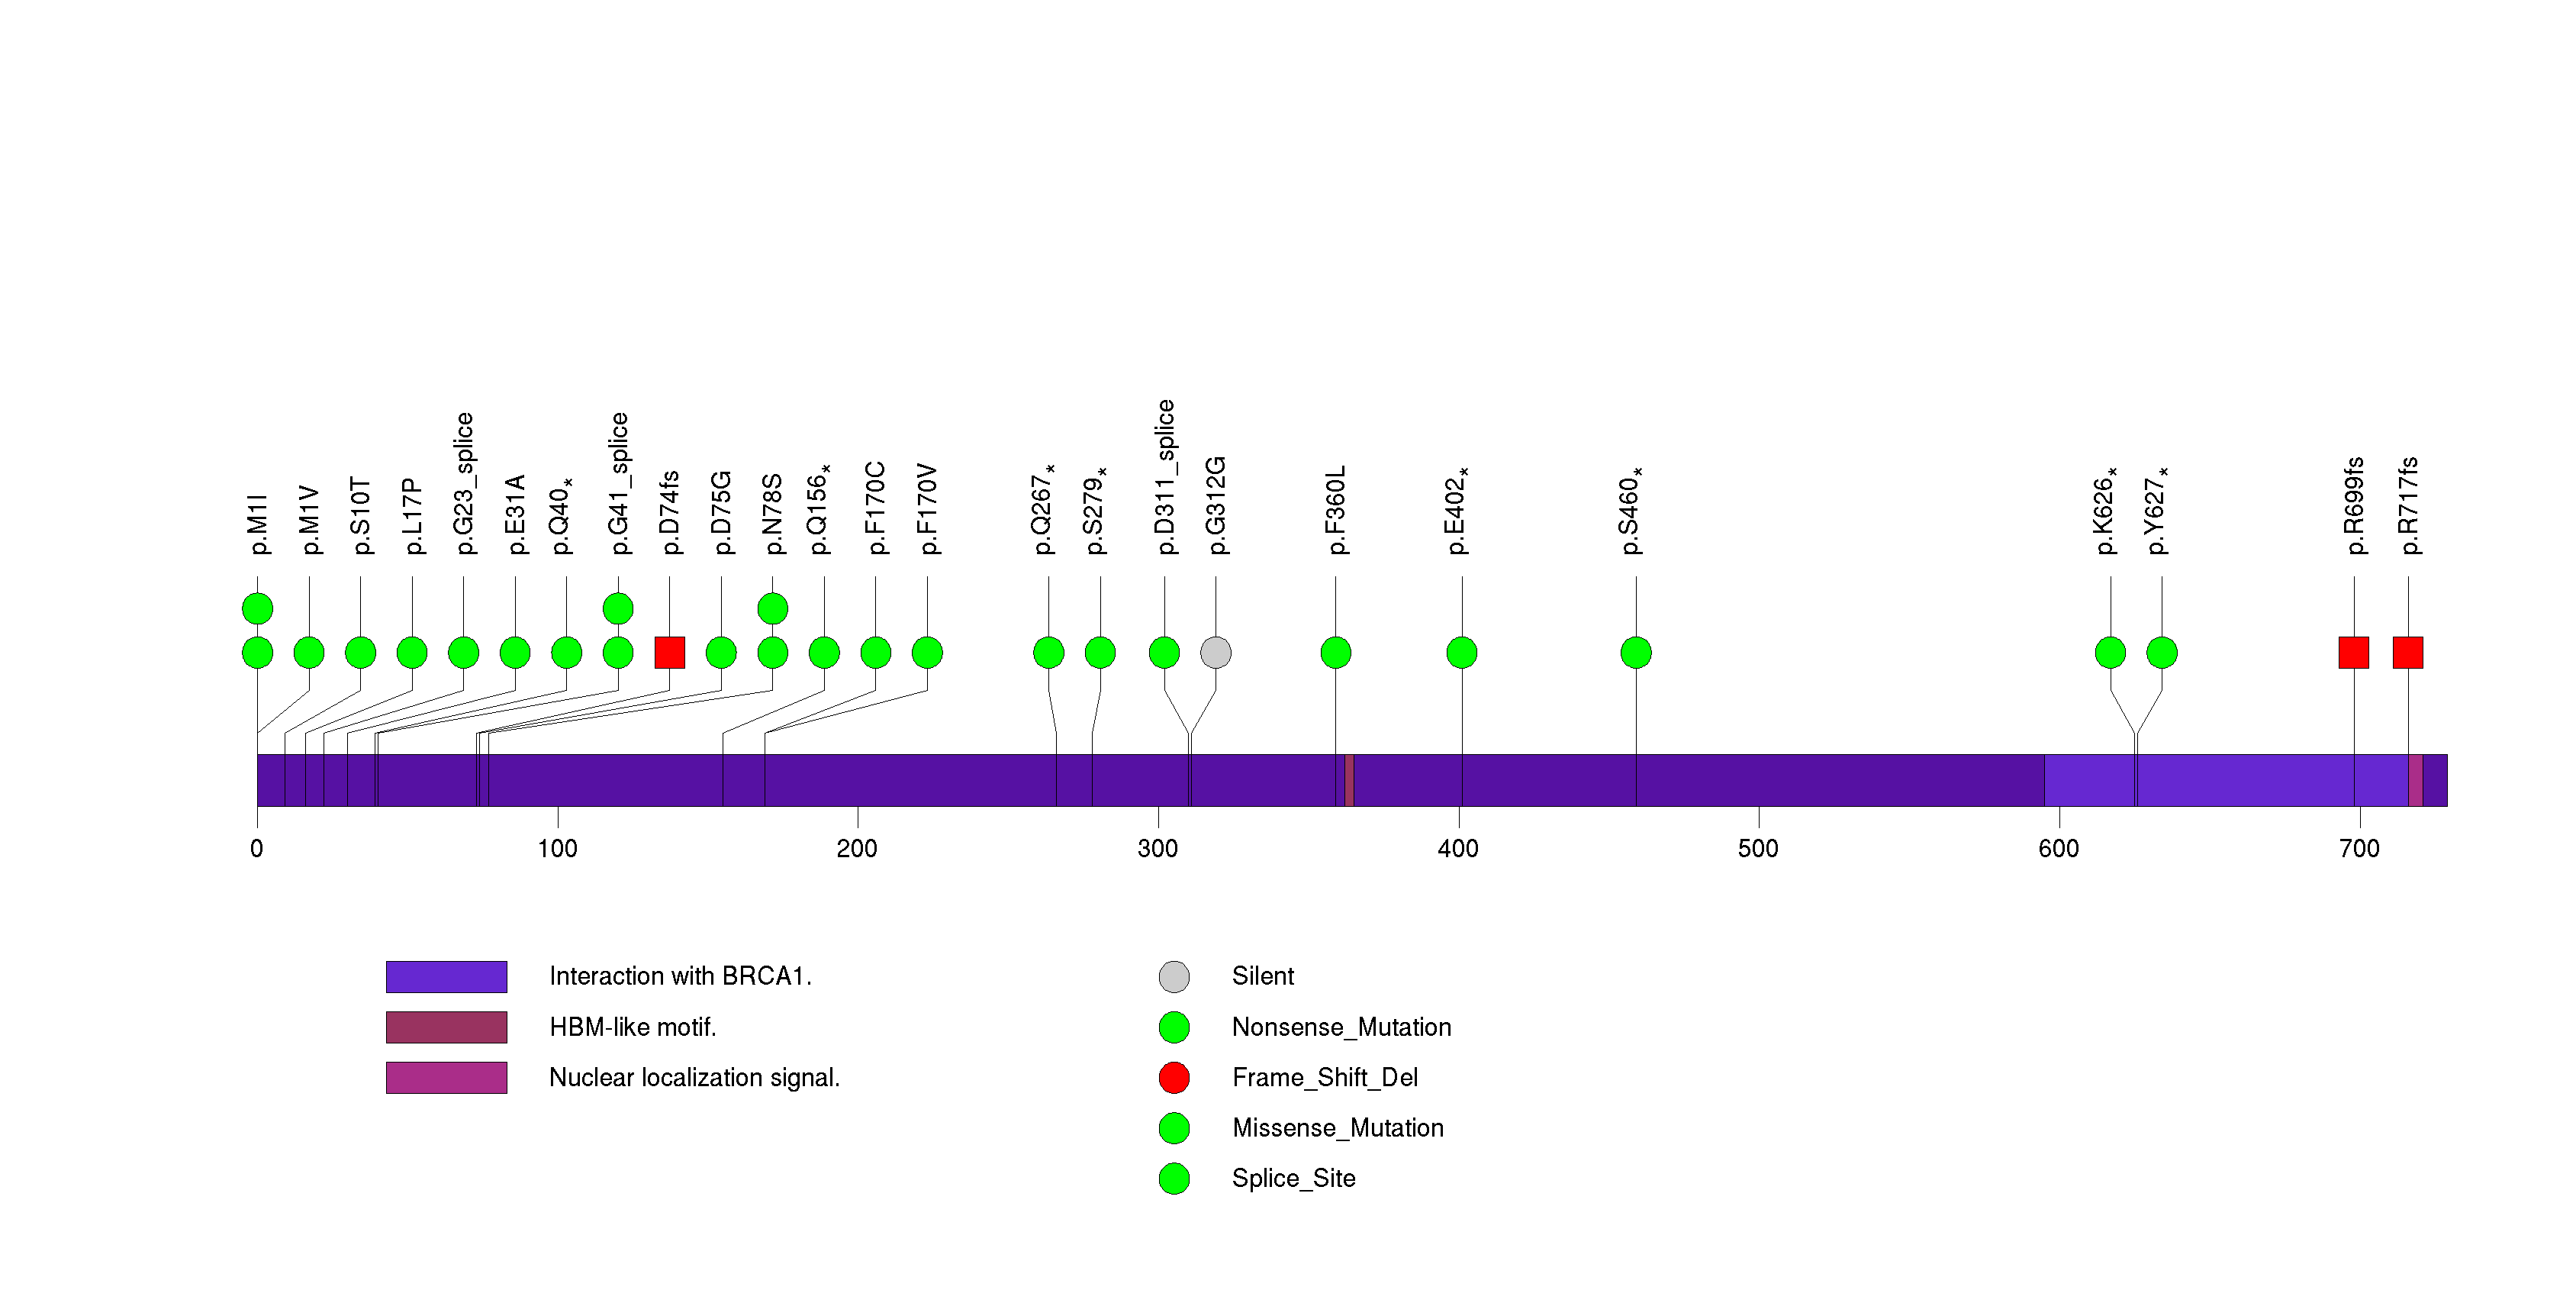
Figure S7. This figure depicts the distribution of mutations and mutation types across the KDM5C significant gene.
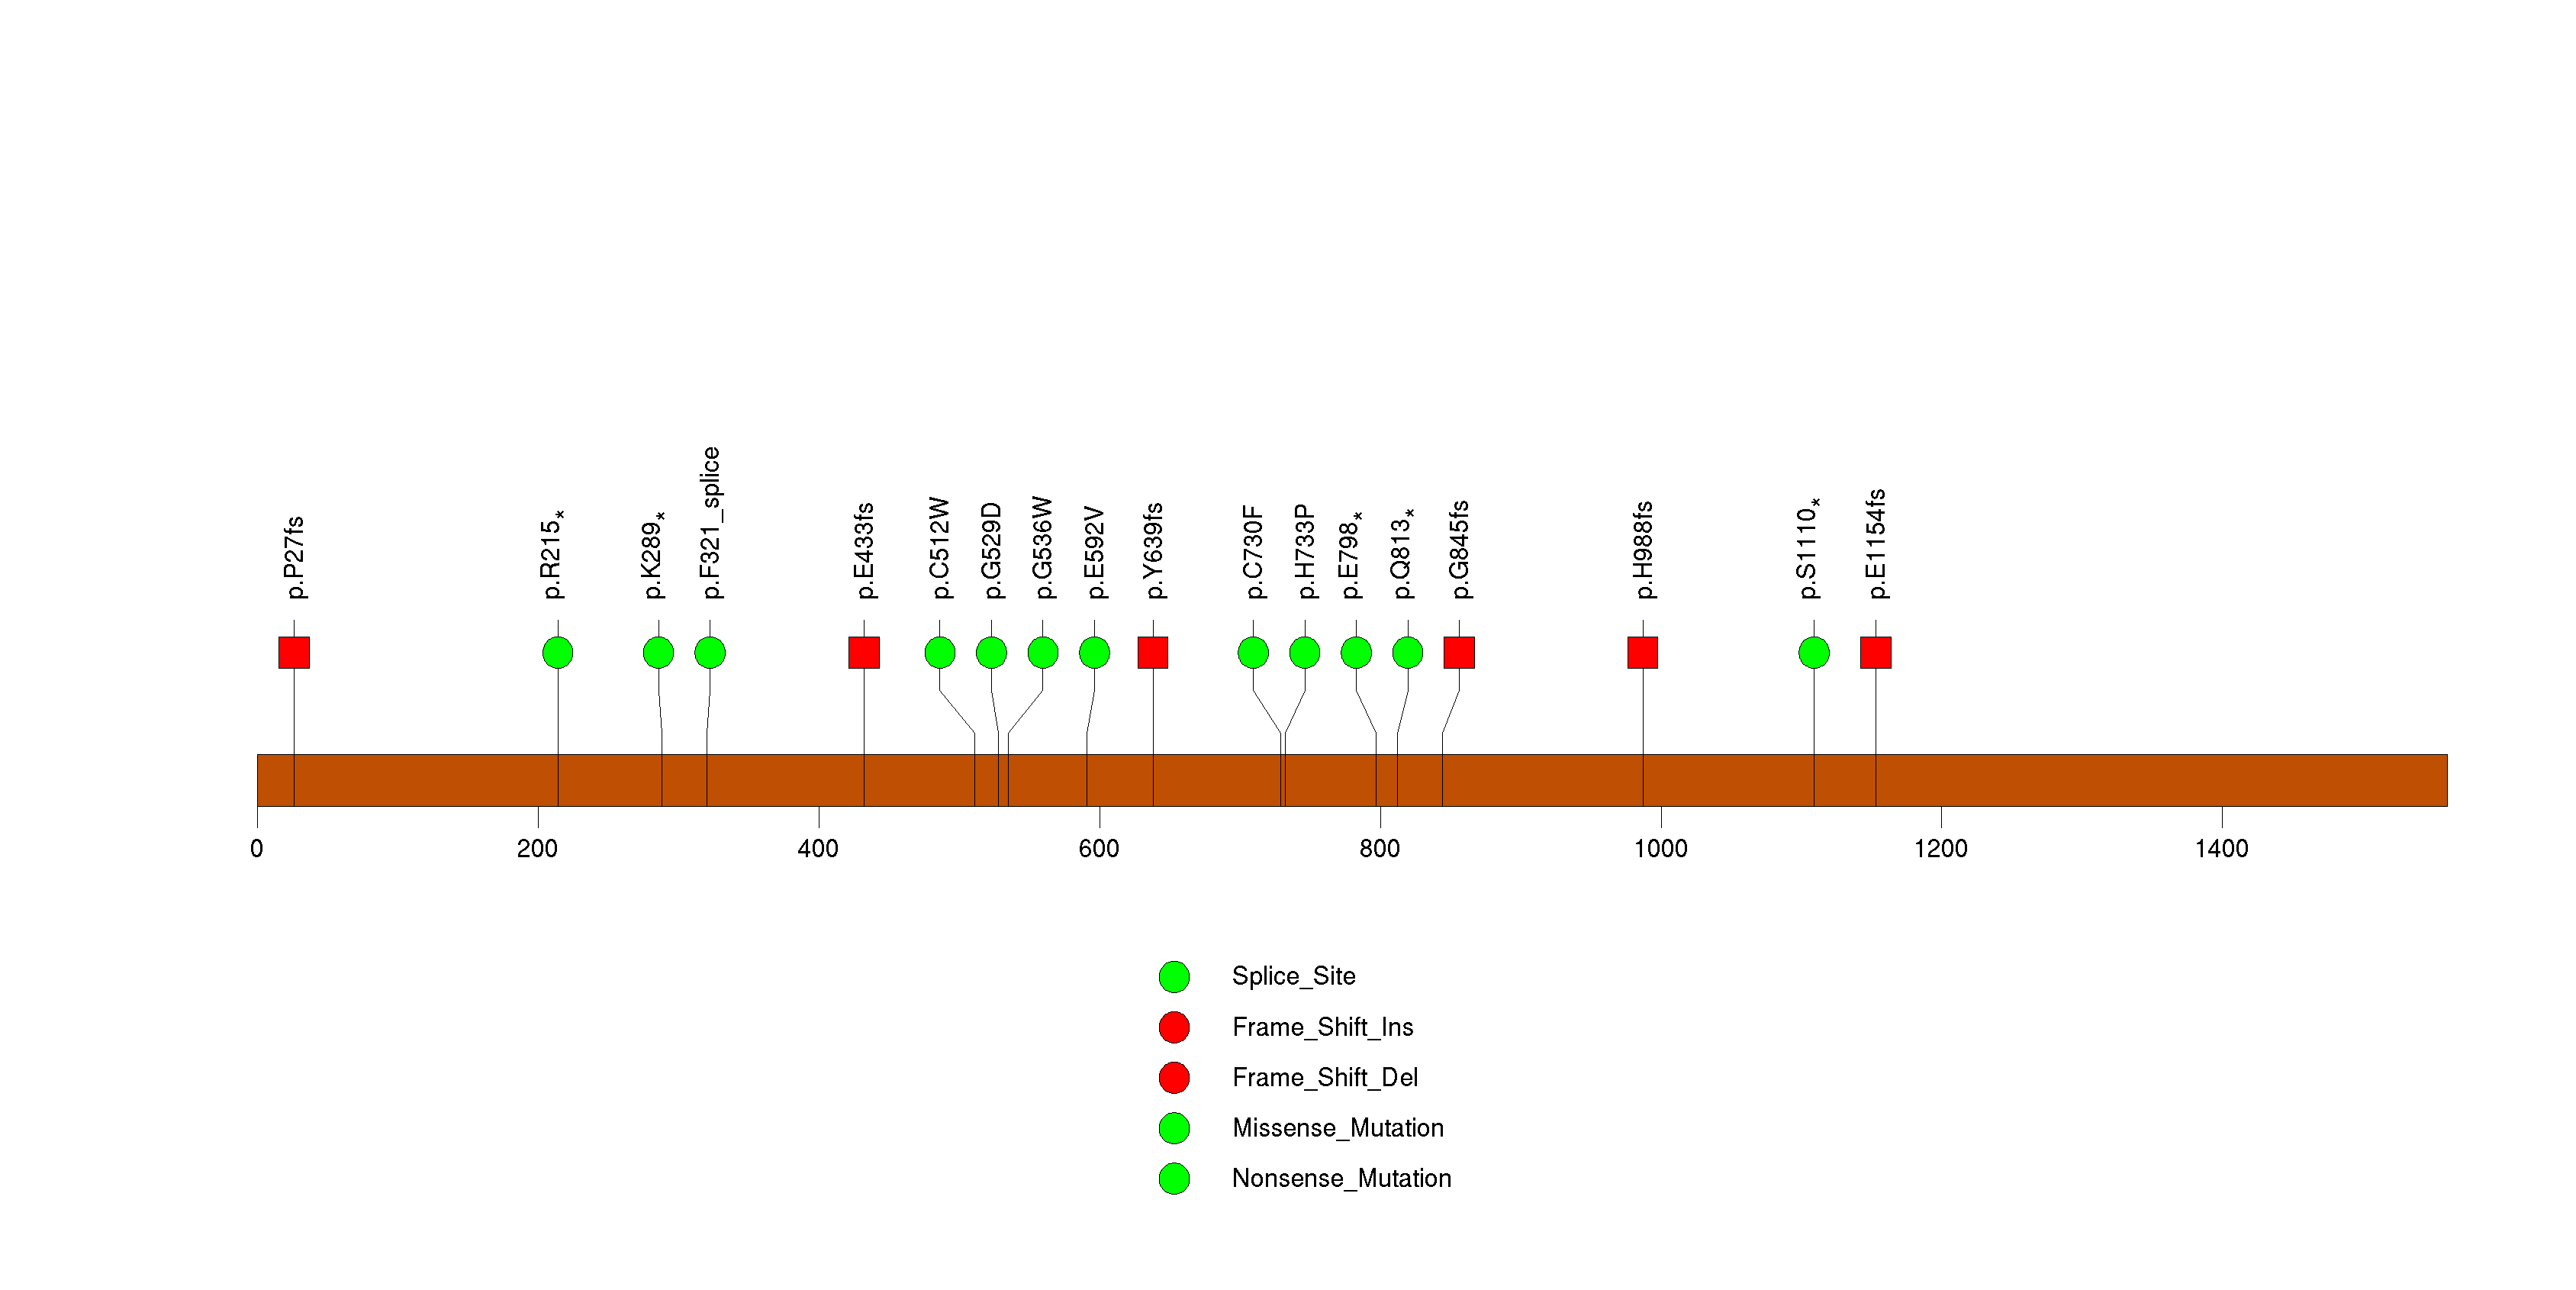
Figure S8. This figure depicts the distribution of mutations and mutation types across the MTOR significant gene.
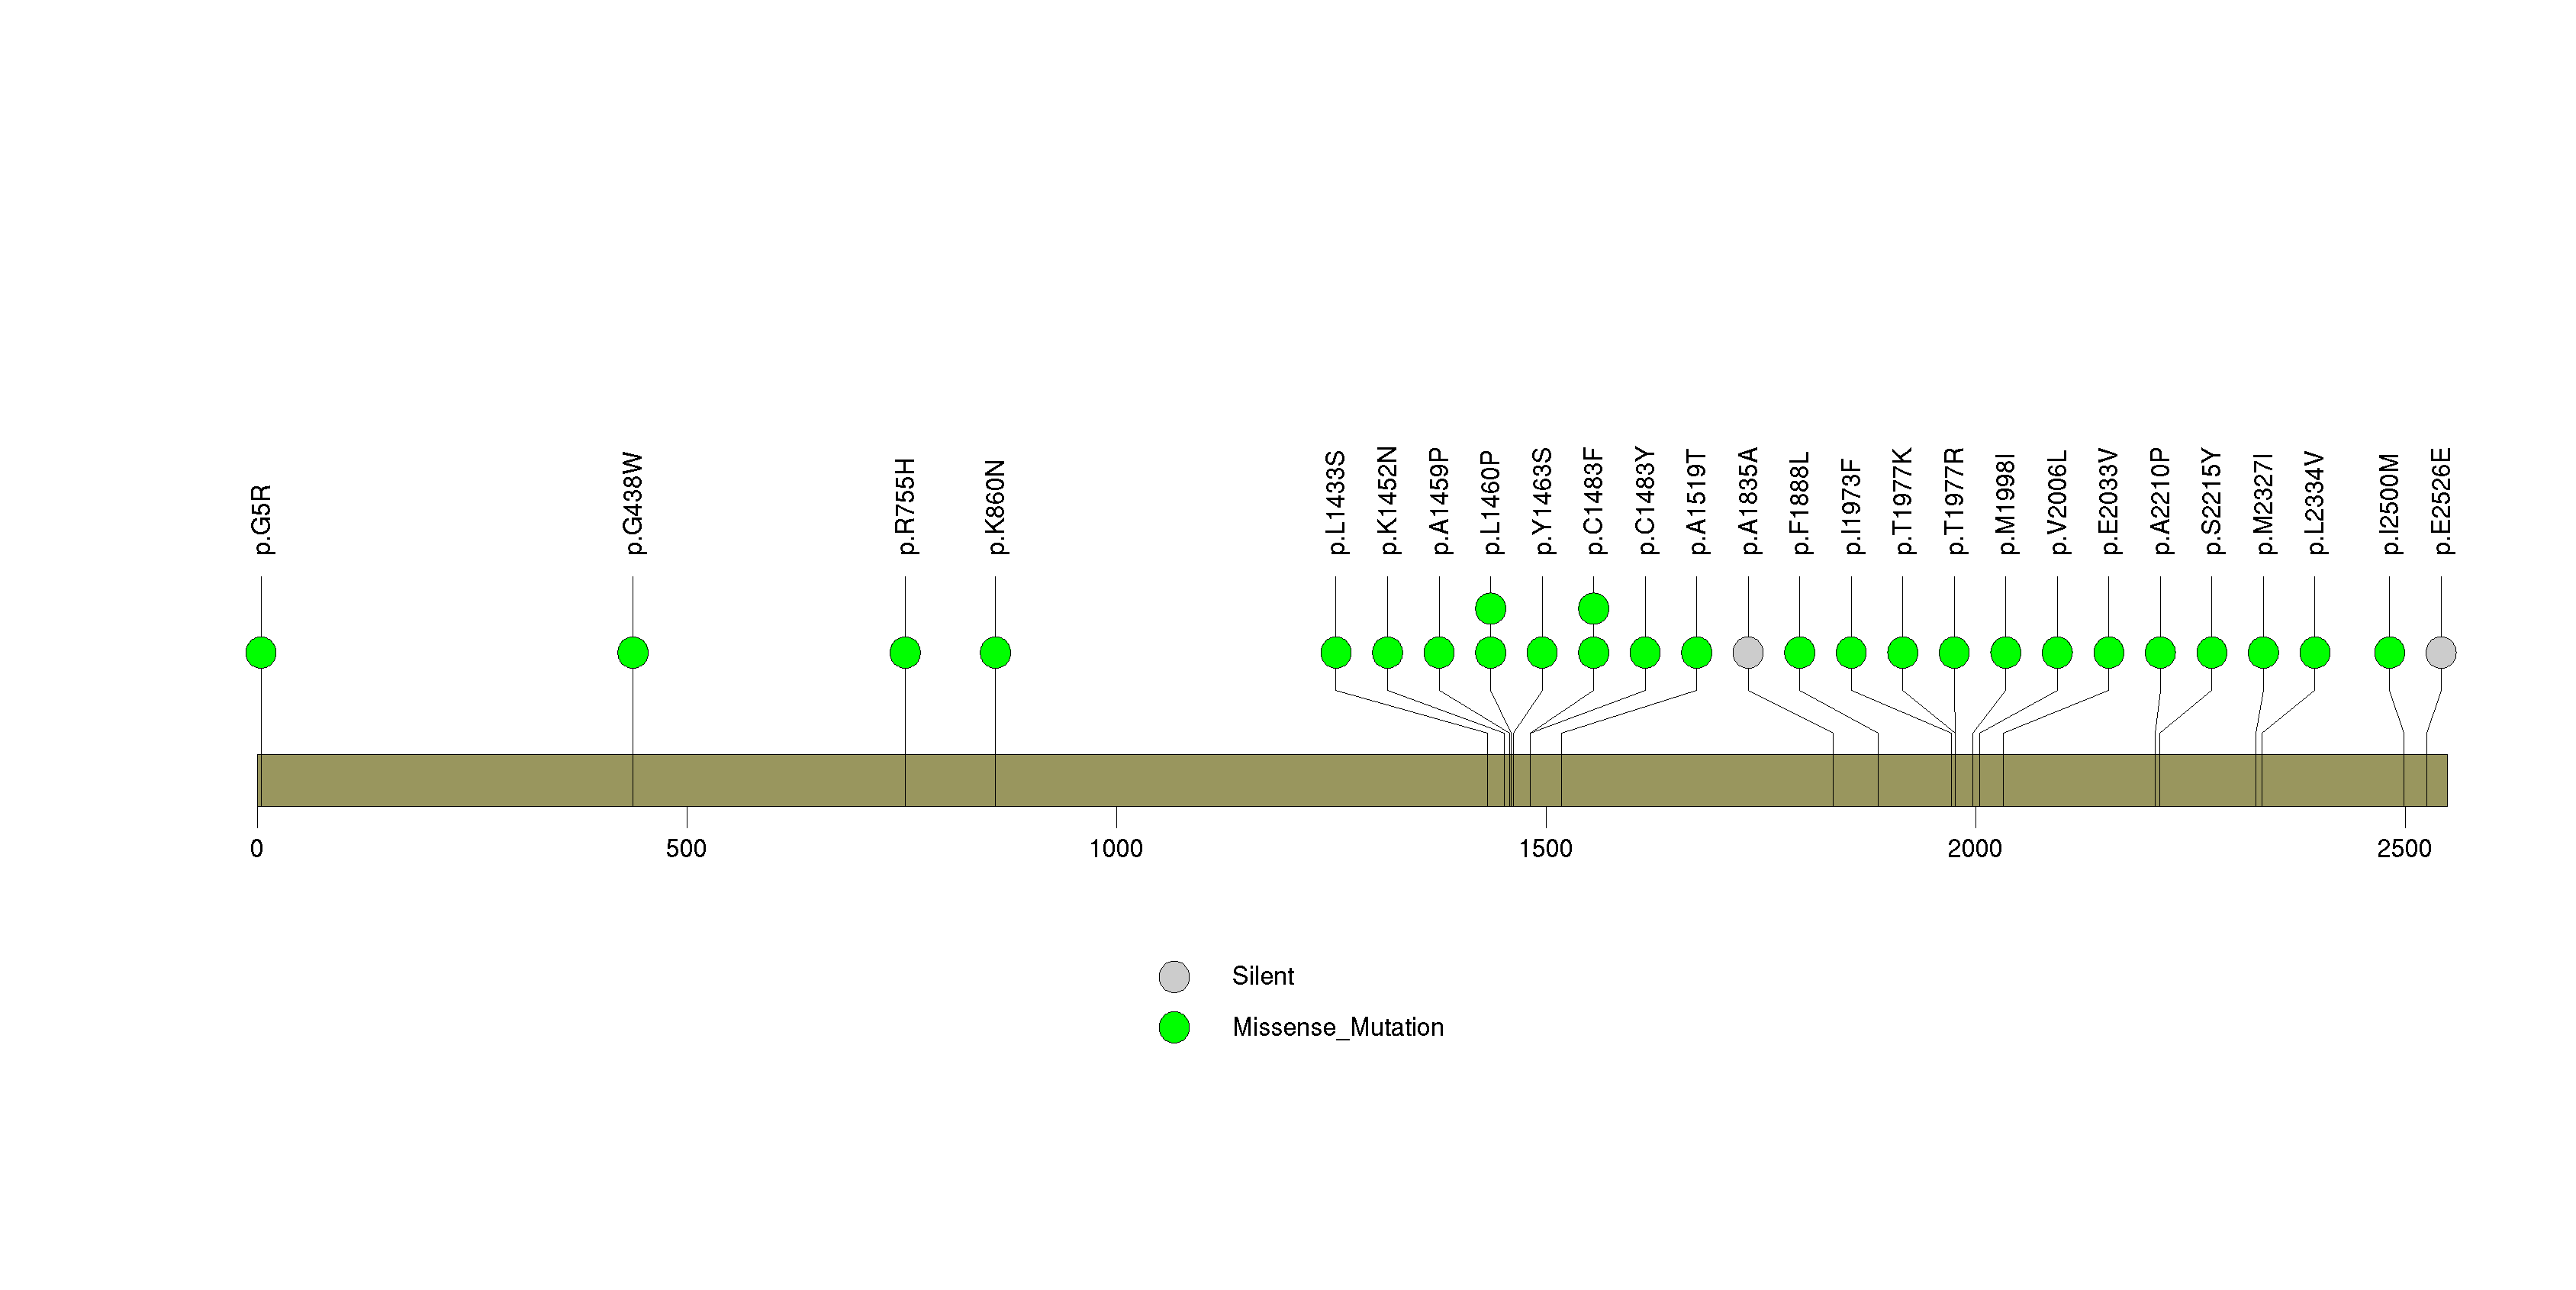
Figure S9. This figure depicts the distribution of mutations and mutation types across the EBPL significant gene.
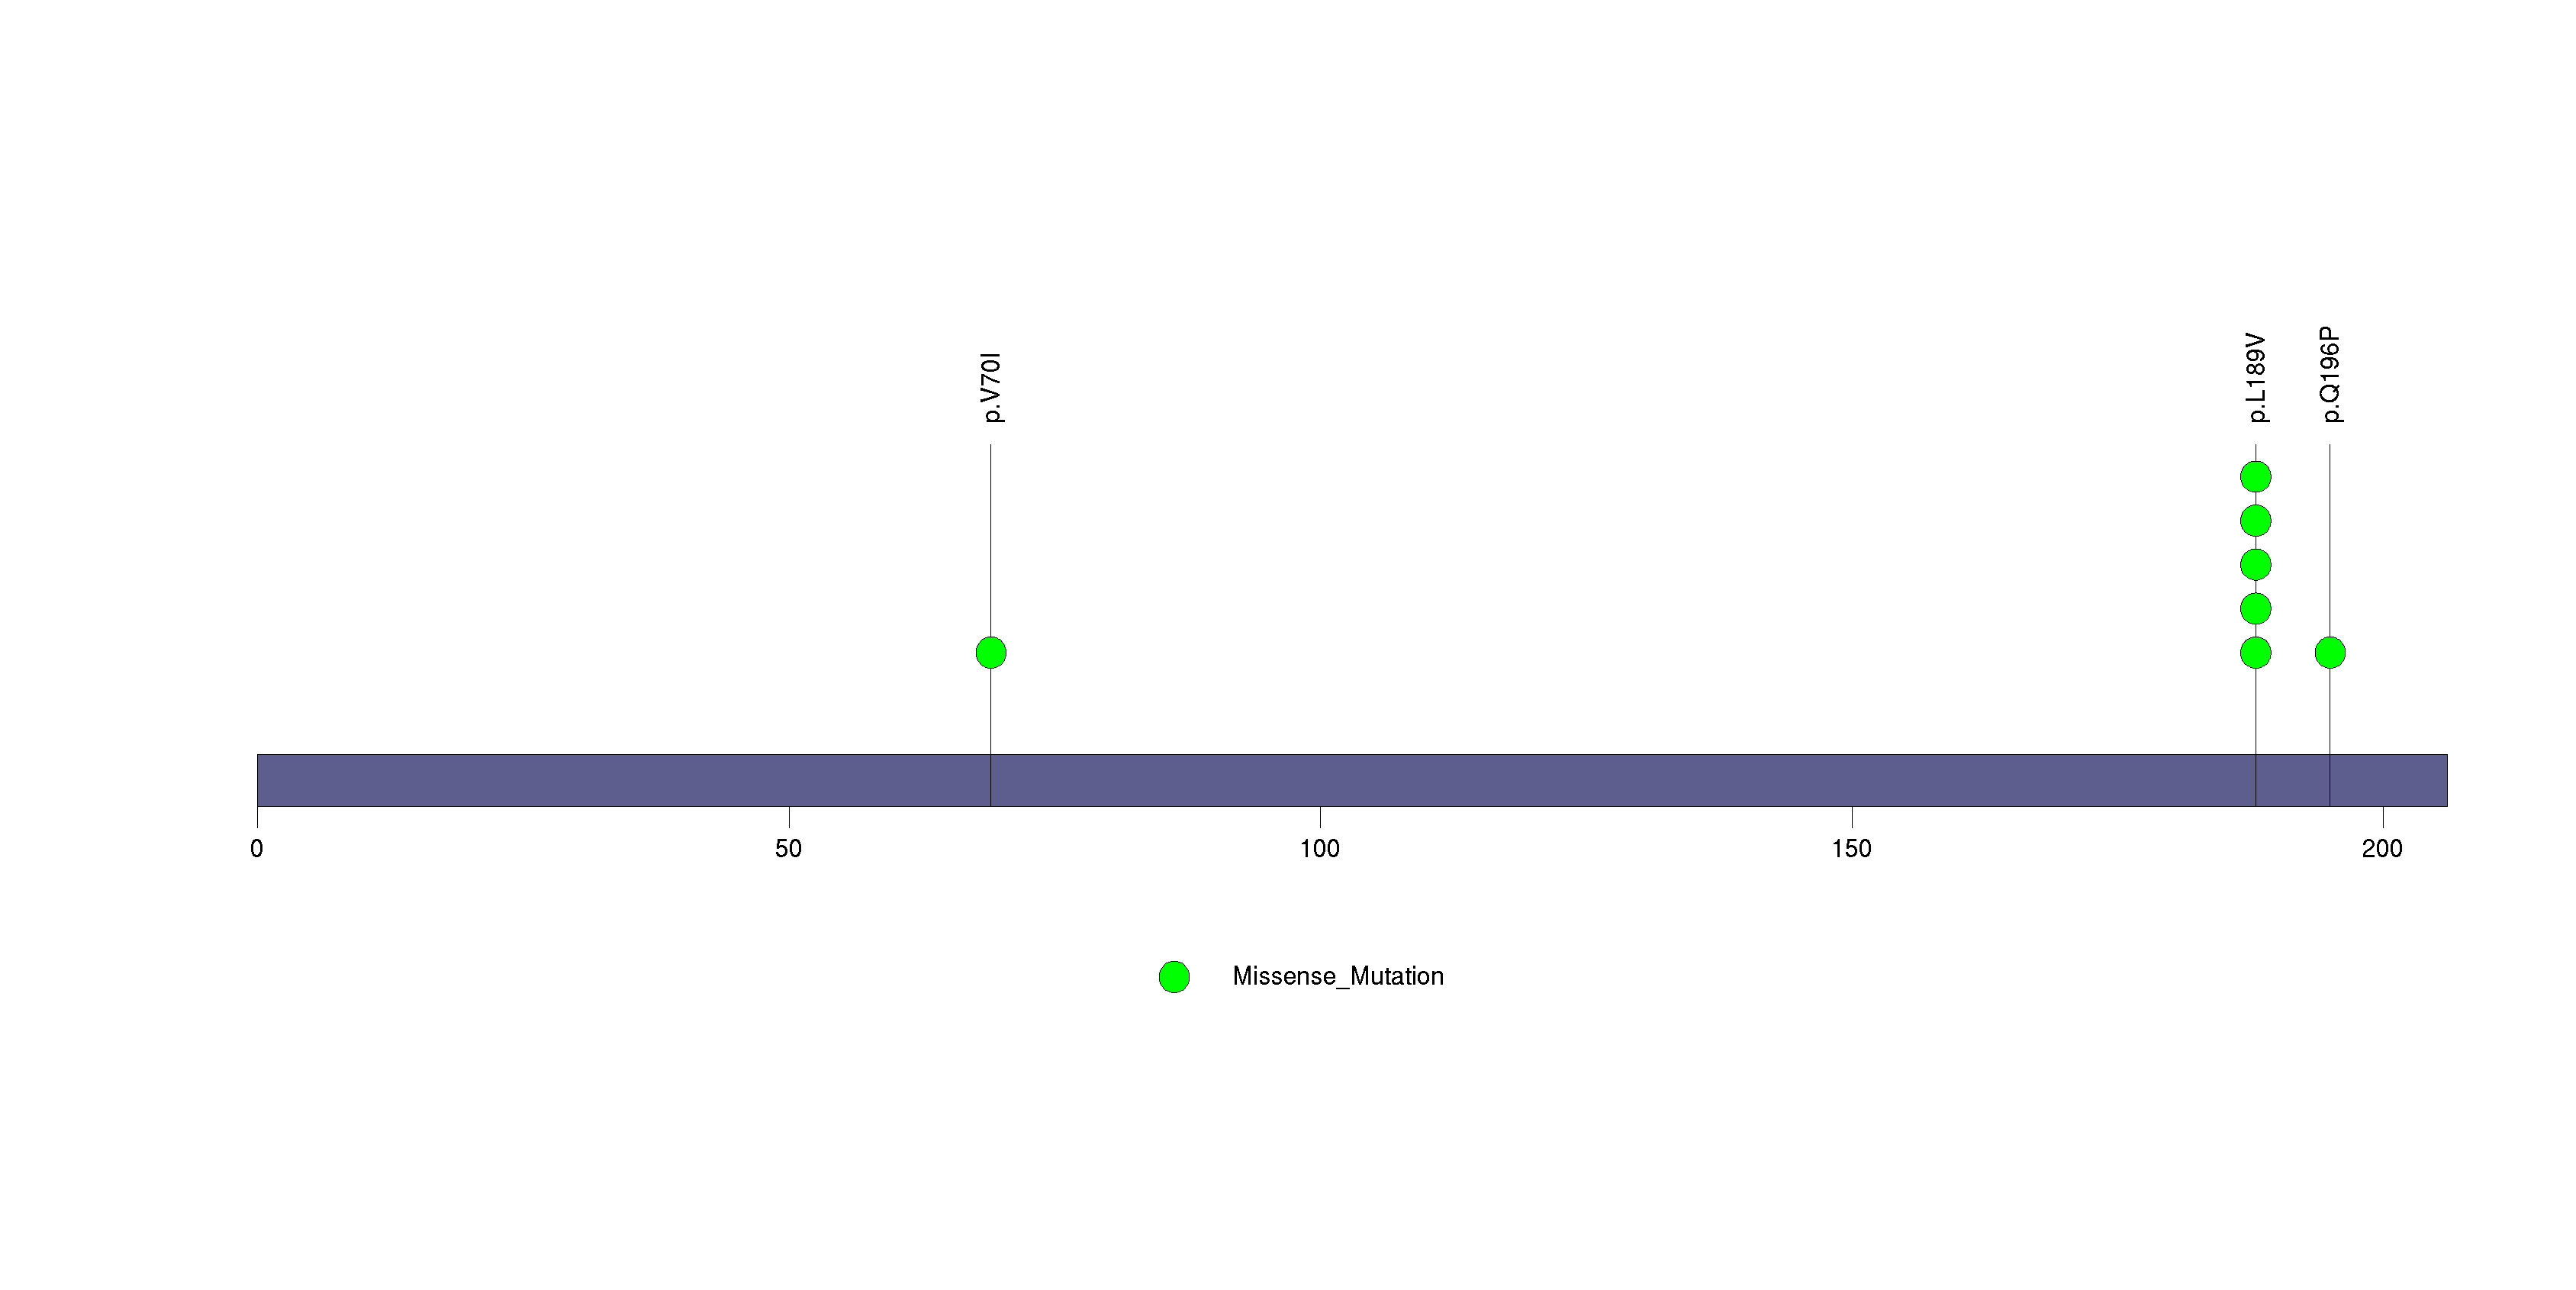
Figure S10. This figure depicts the distribution of mutations and mutation types across the MUC4 significant gene.
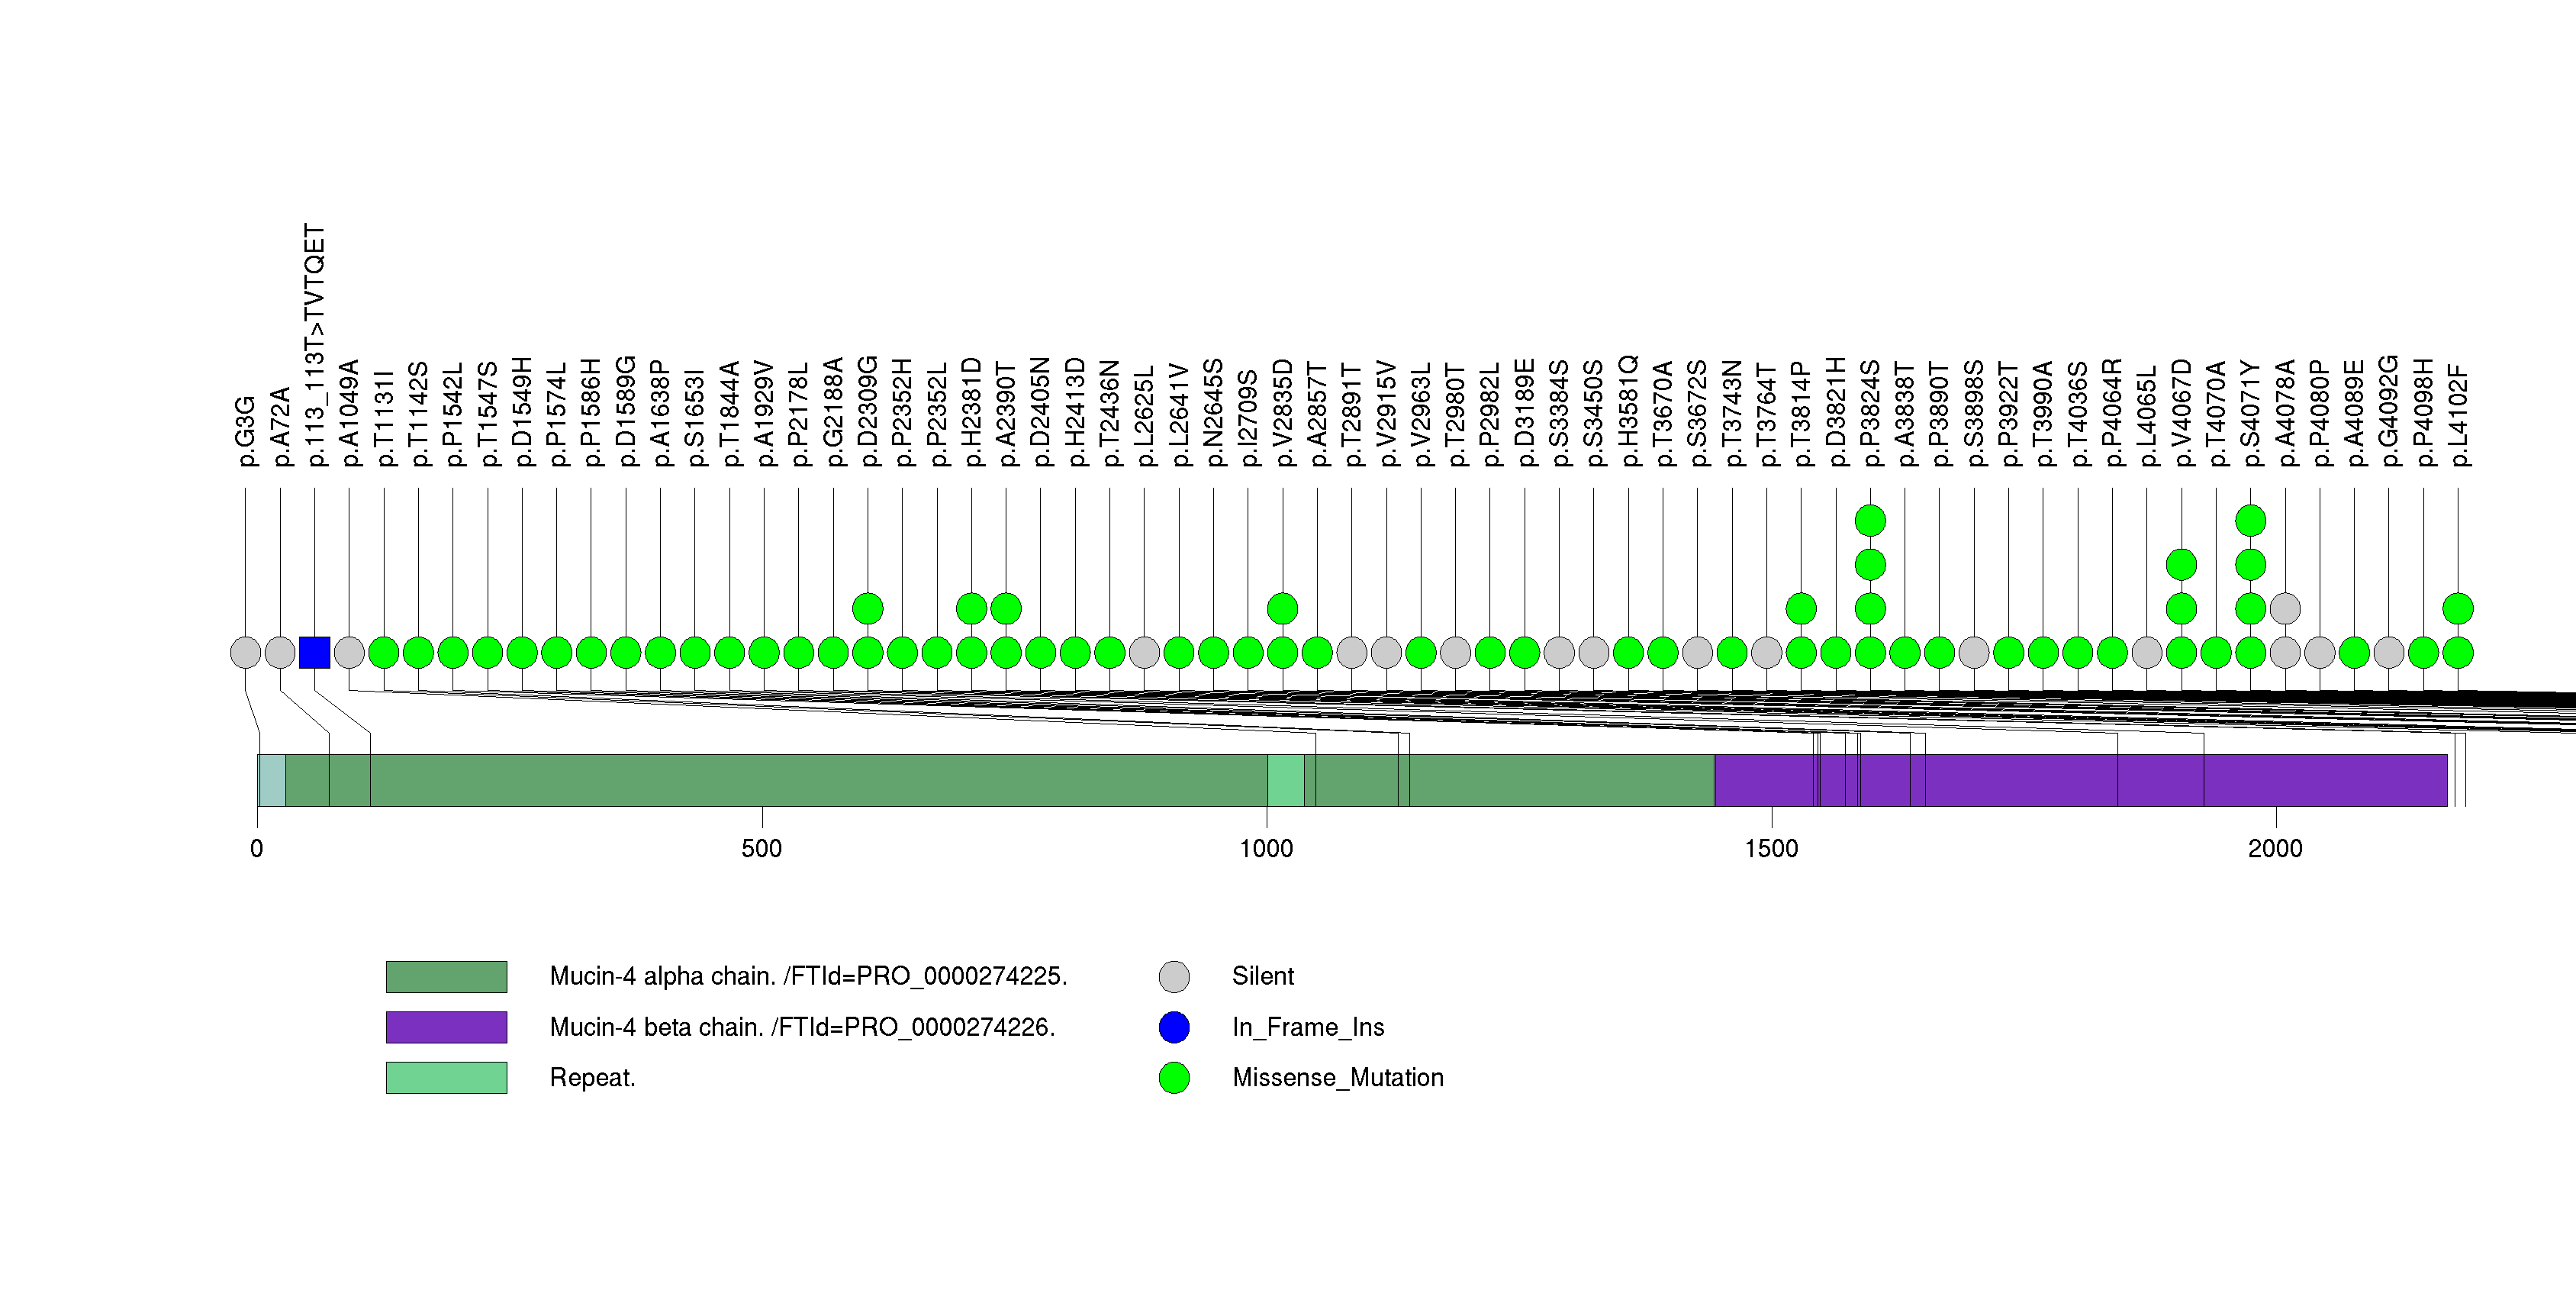
Figure S11. This figure depicts the distribution of mutations and mutation types across the TP53 significant gene.
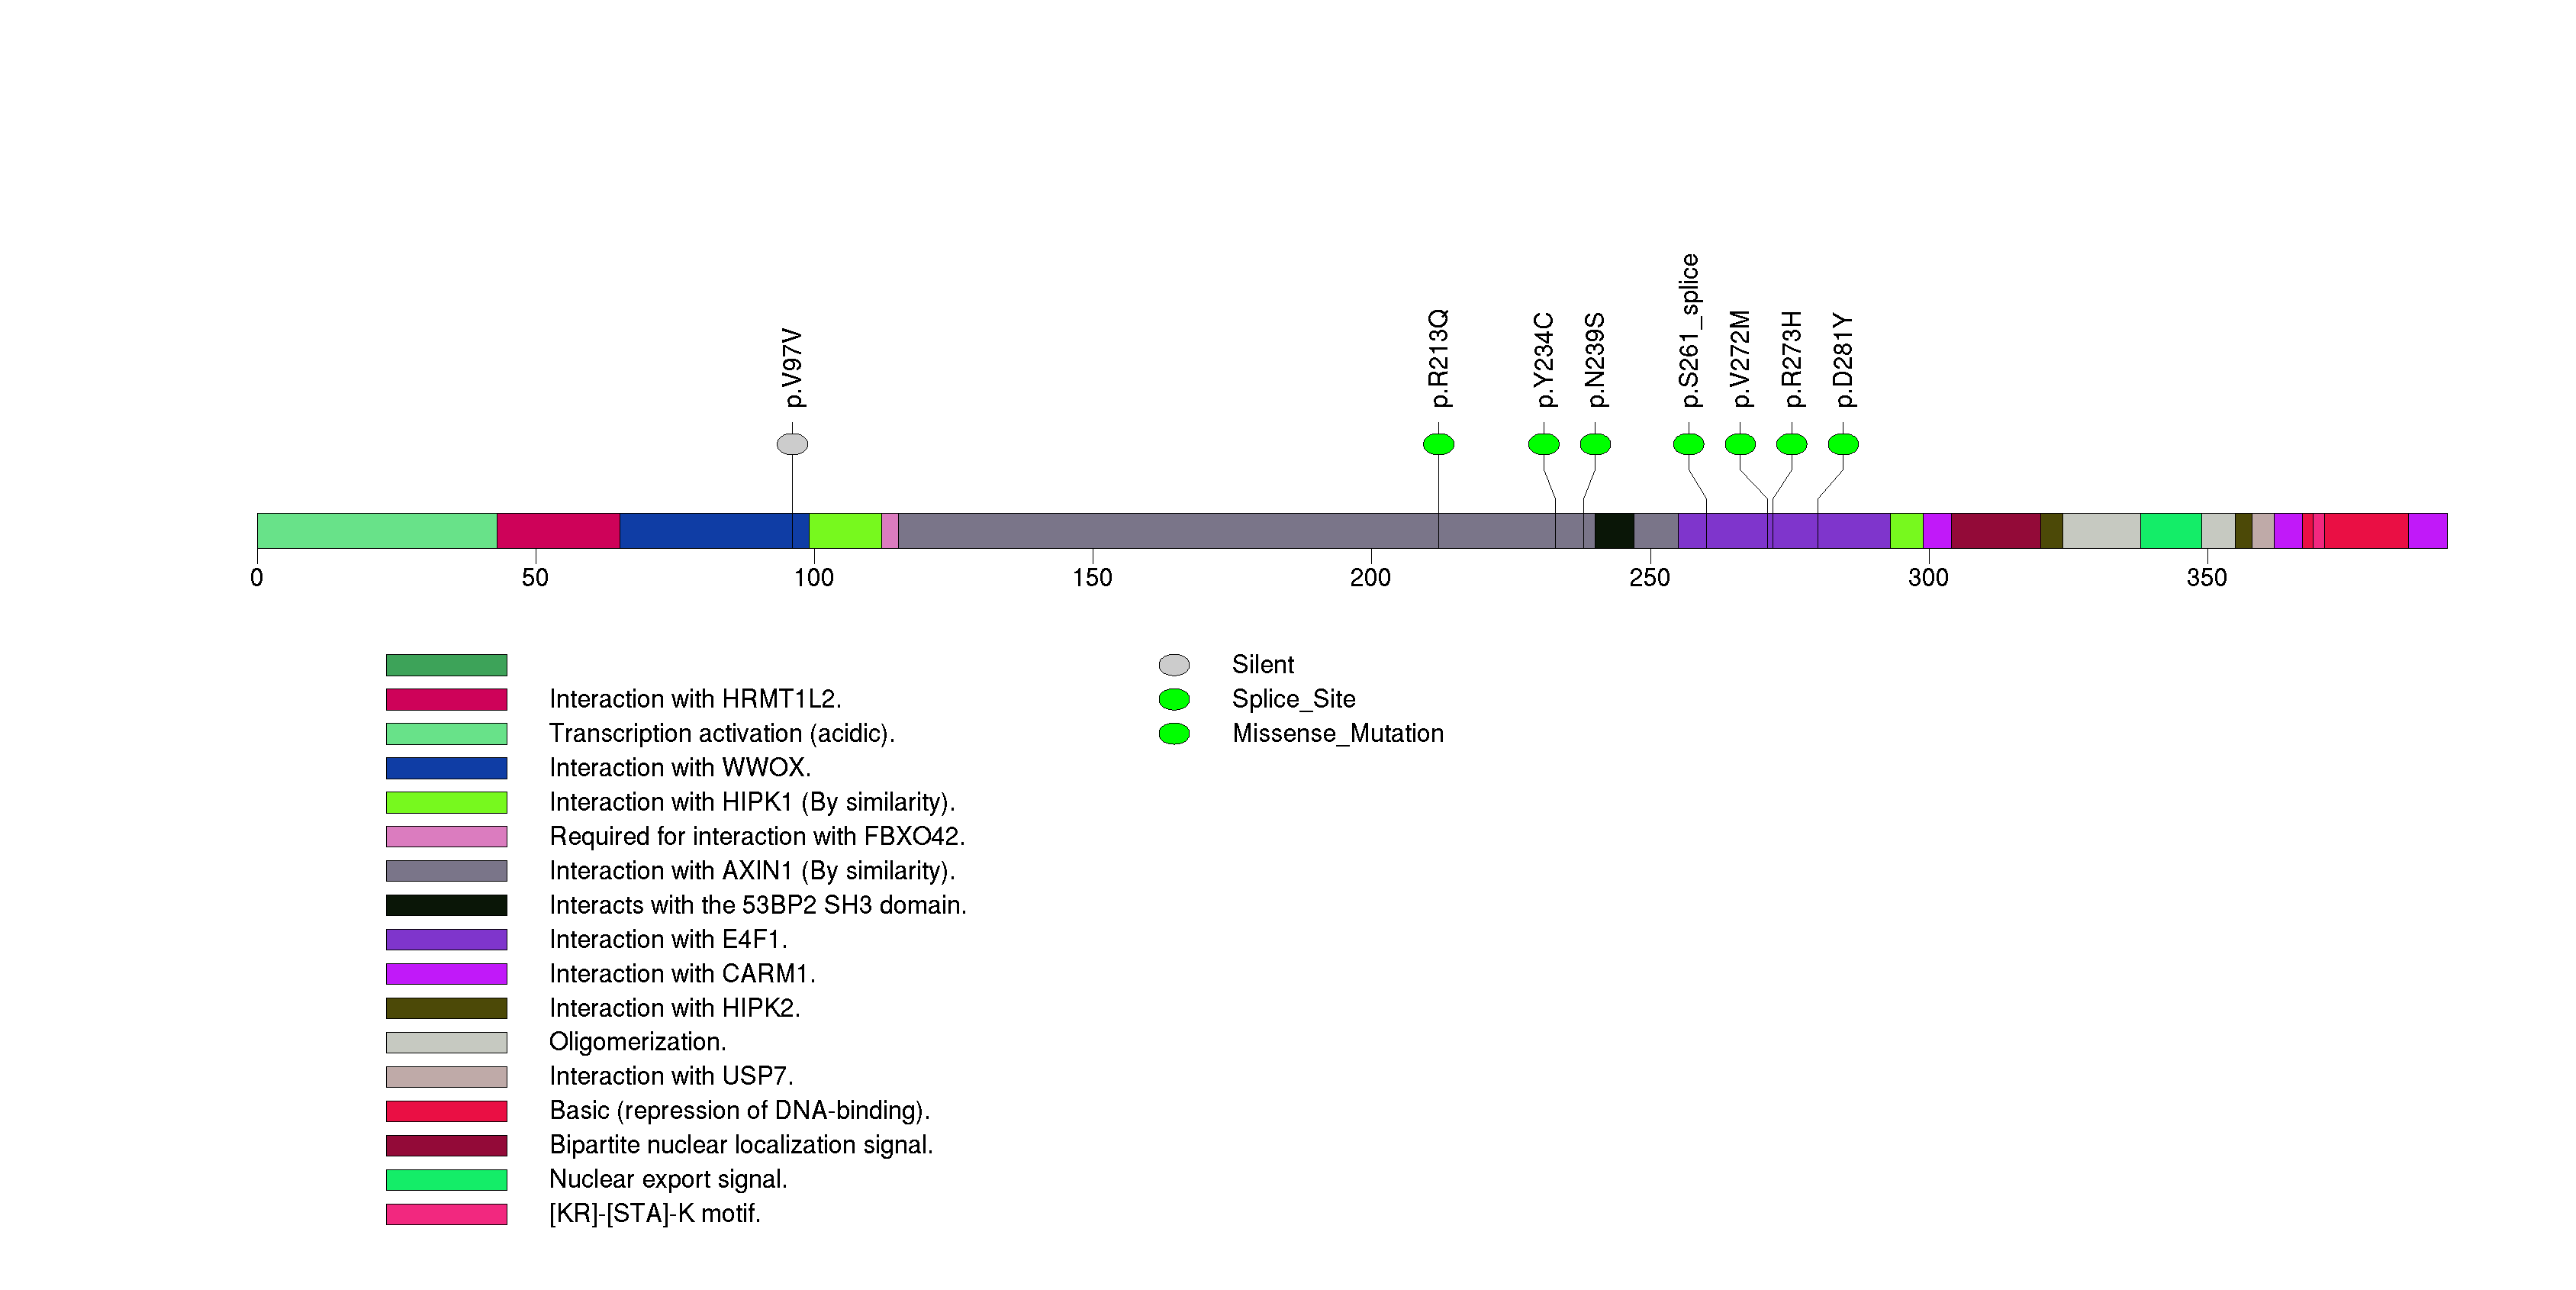
Figure S12. This figure depicts the distribution of mutations and mutation types across the TOR1A significant gene.
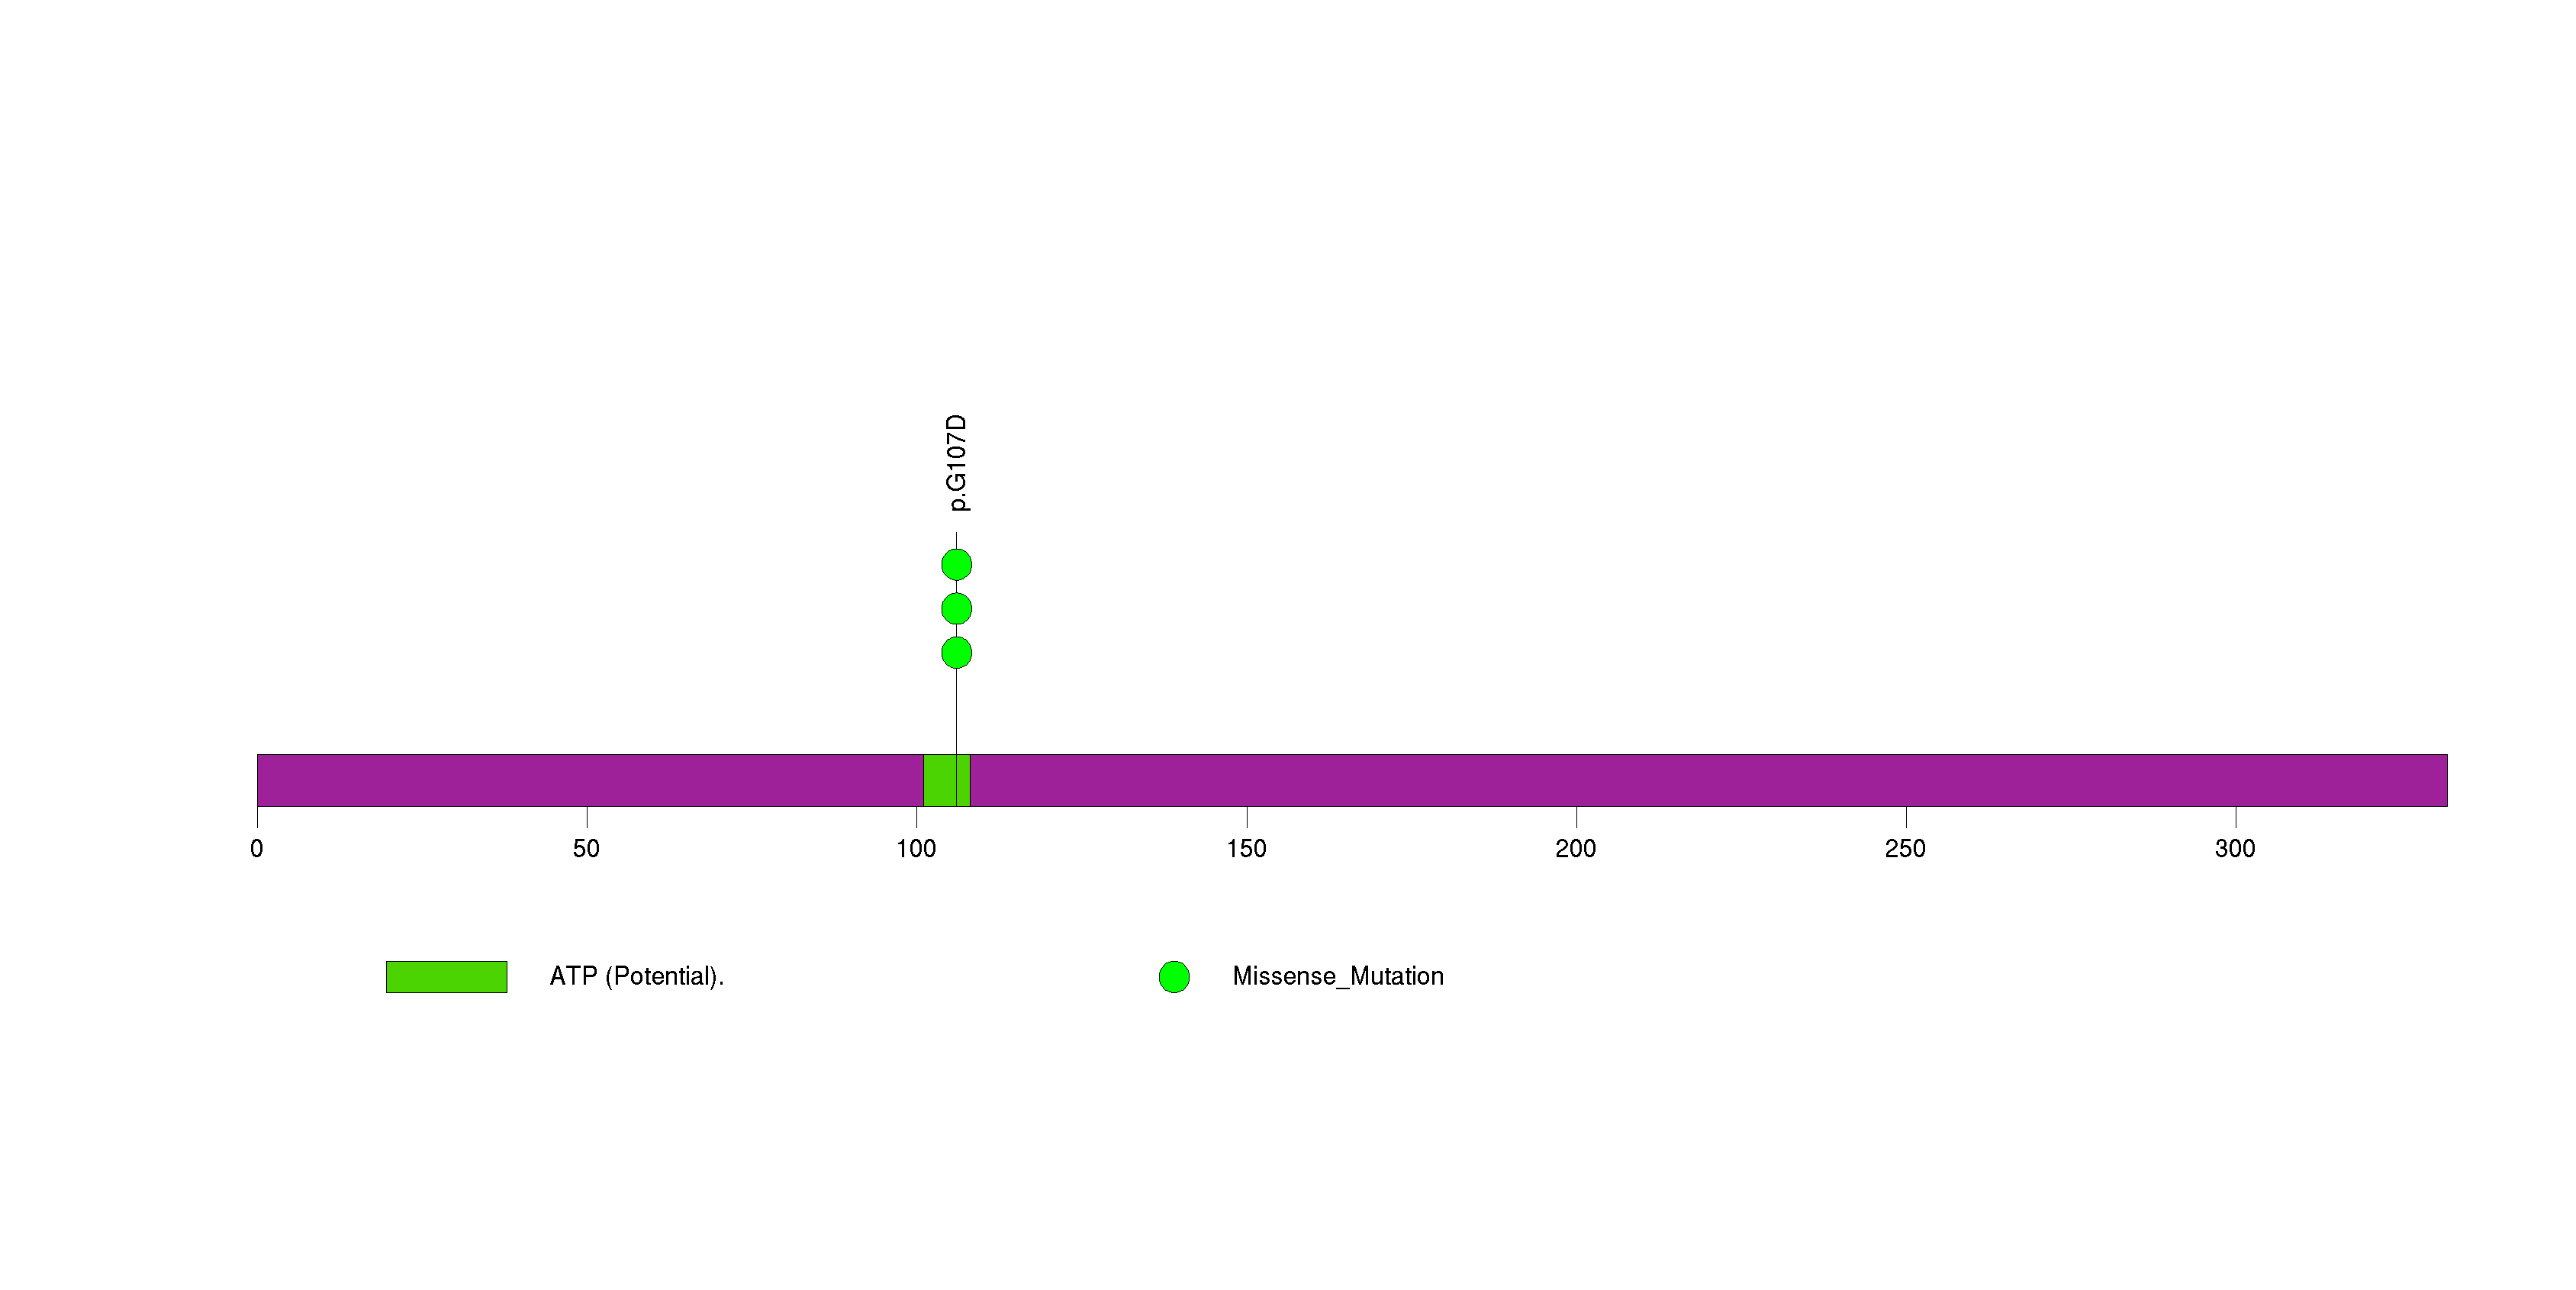
Figure S13. This figure depicts the distribution of mutations and mutation types across the PTEN significant gene.
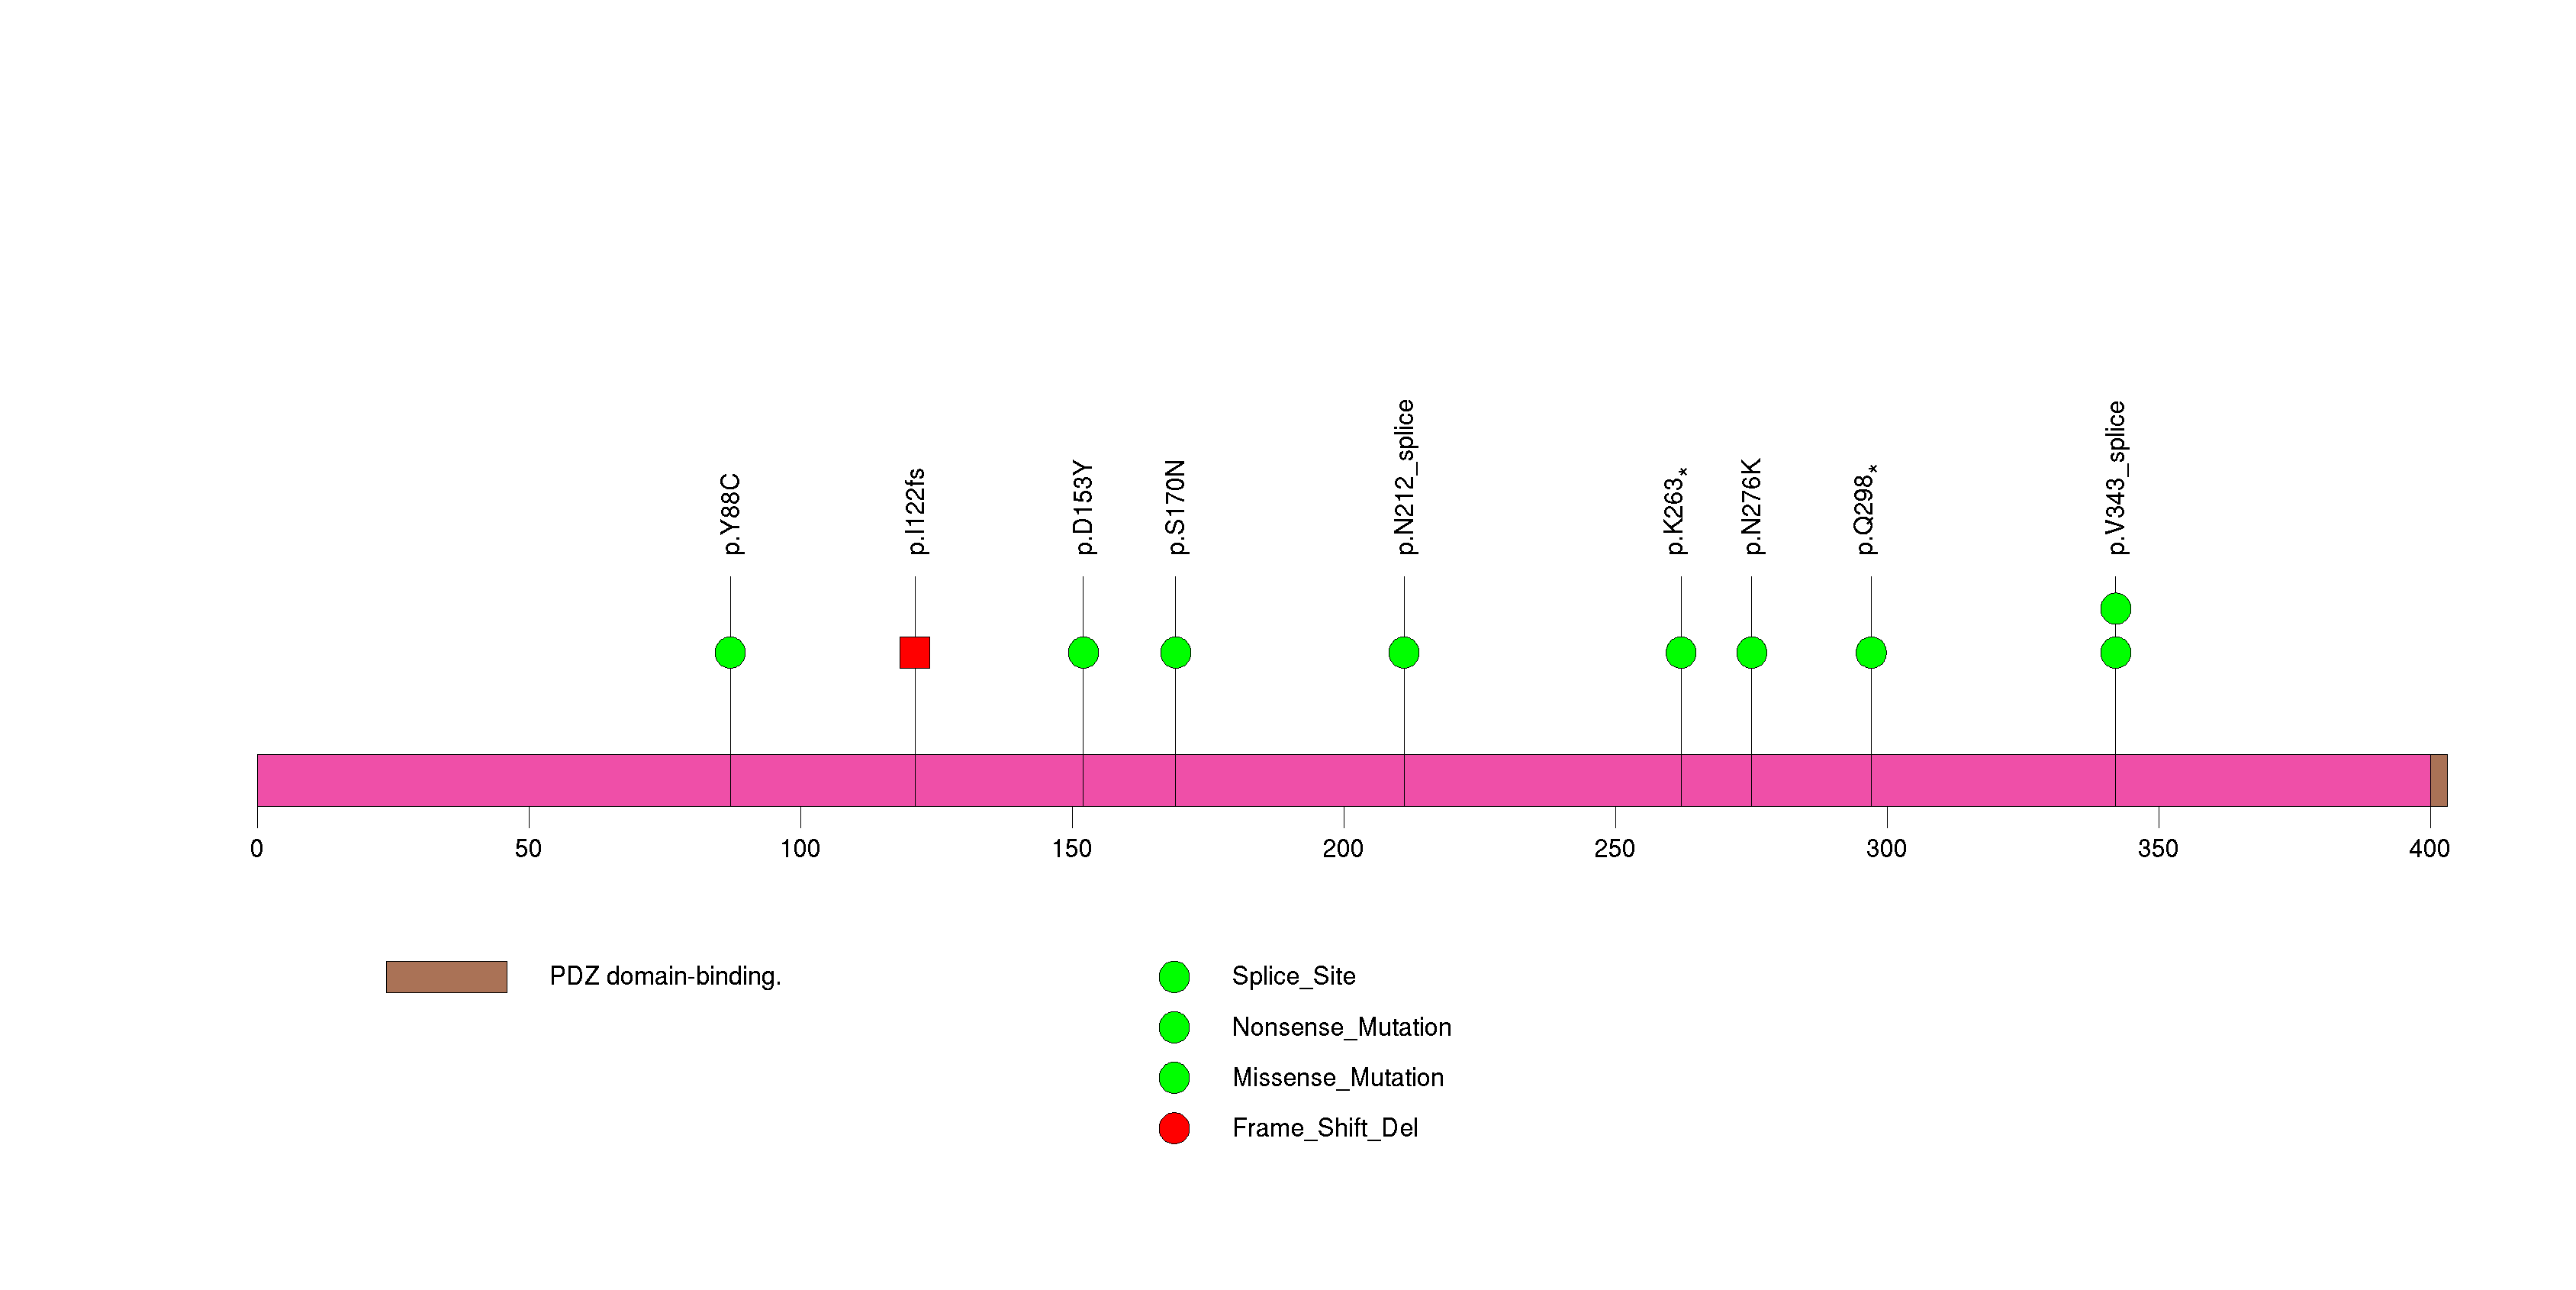
Figure S14. This figure depicts the distribution of mutations and mutation types across the PIK3CA significant gene.
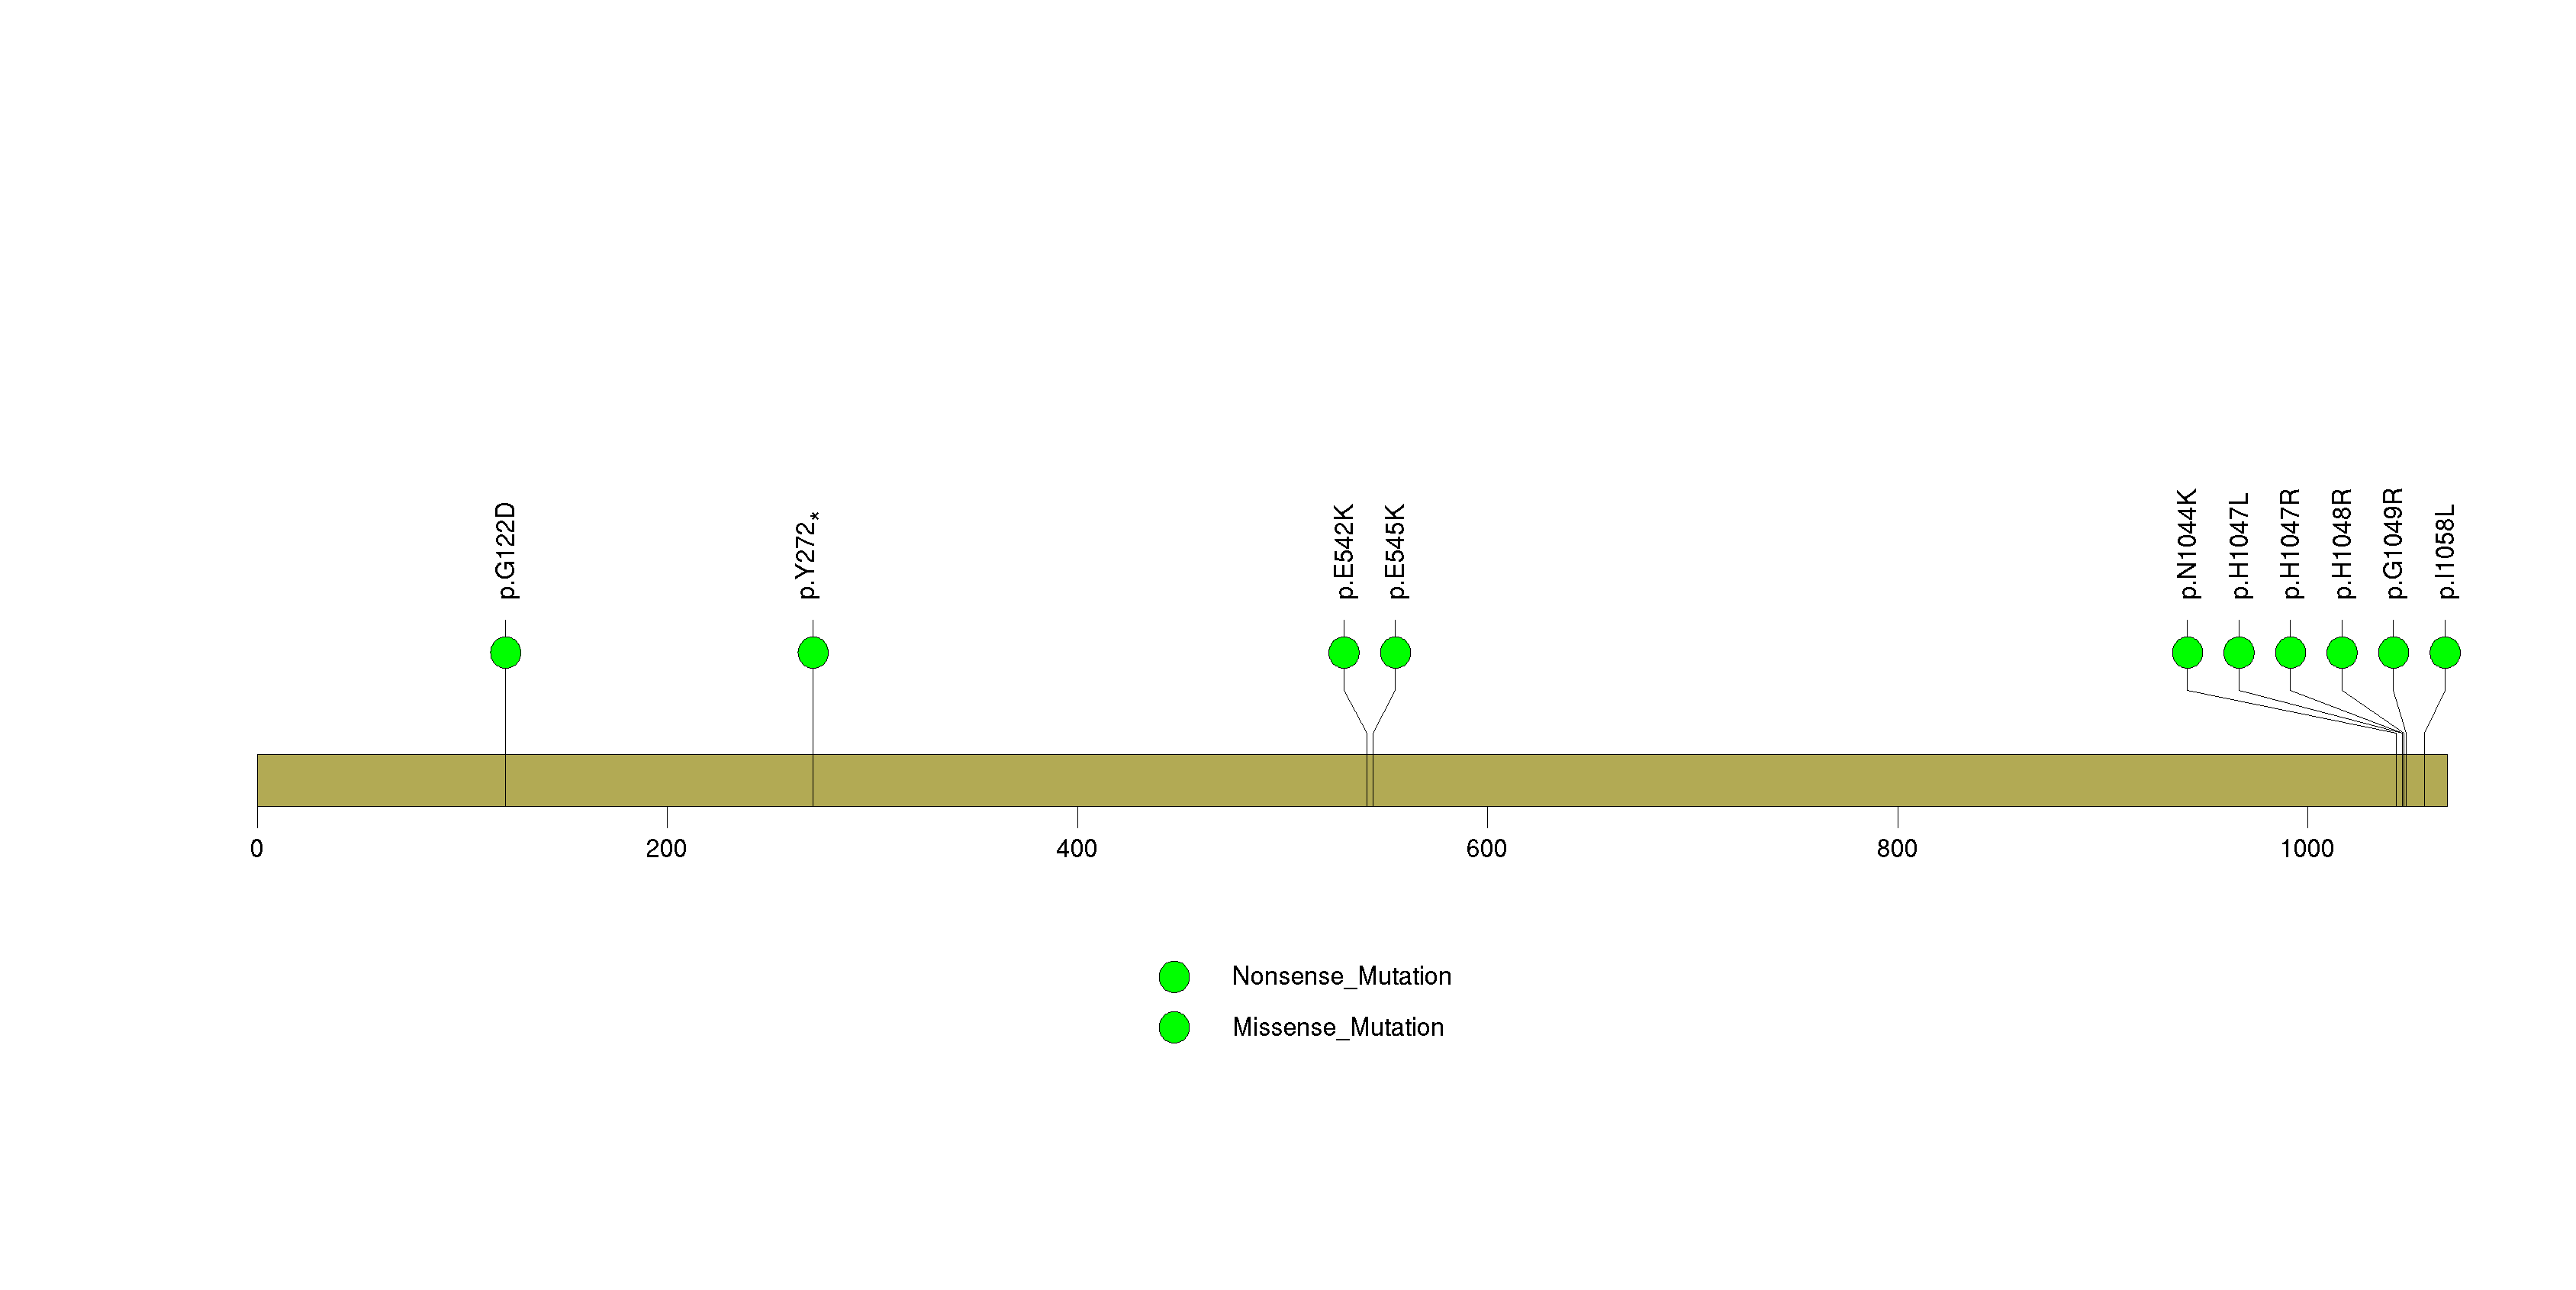
Figure S15. This figure depicts the distribution of mutations and mutation types across the WDR52 significant gene.
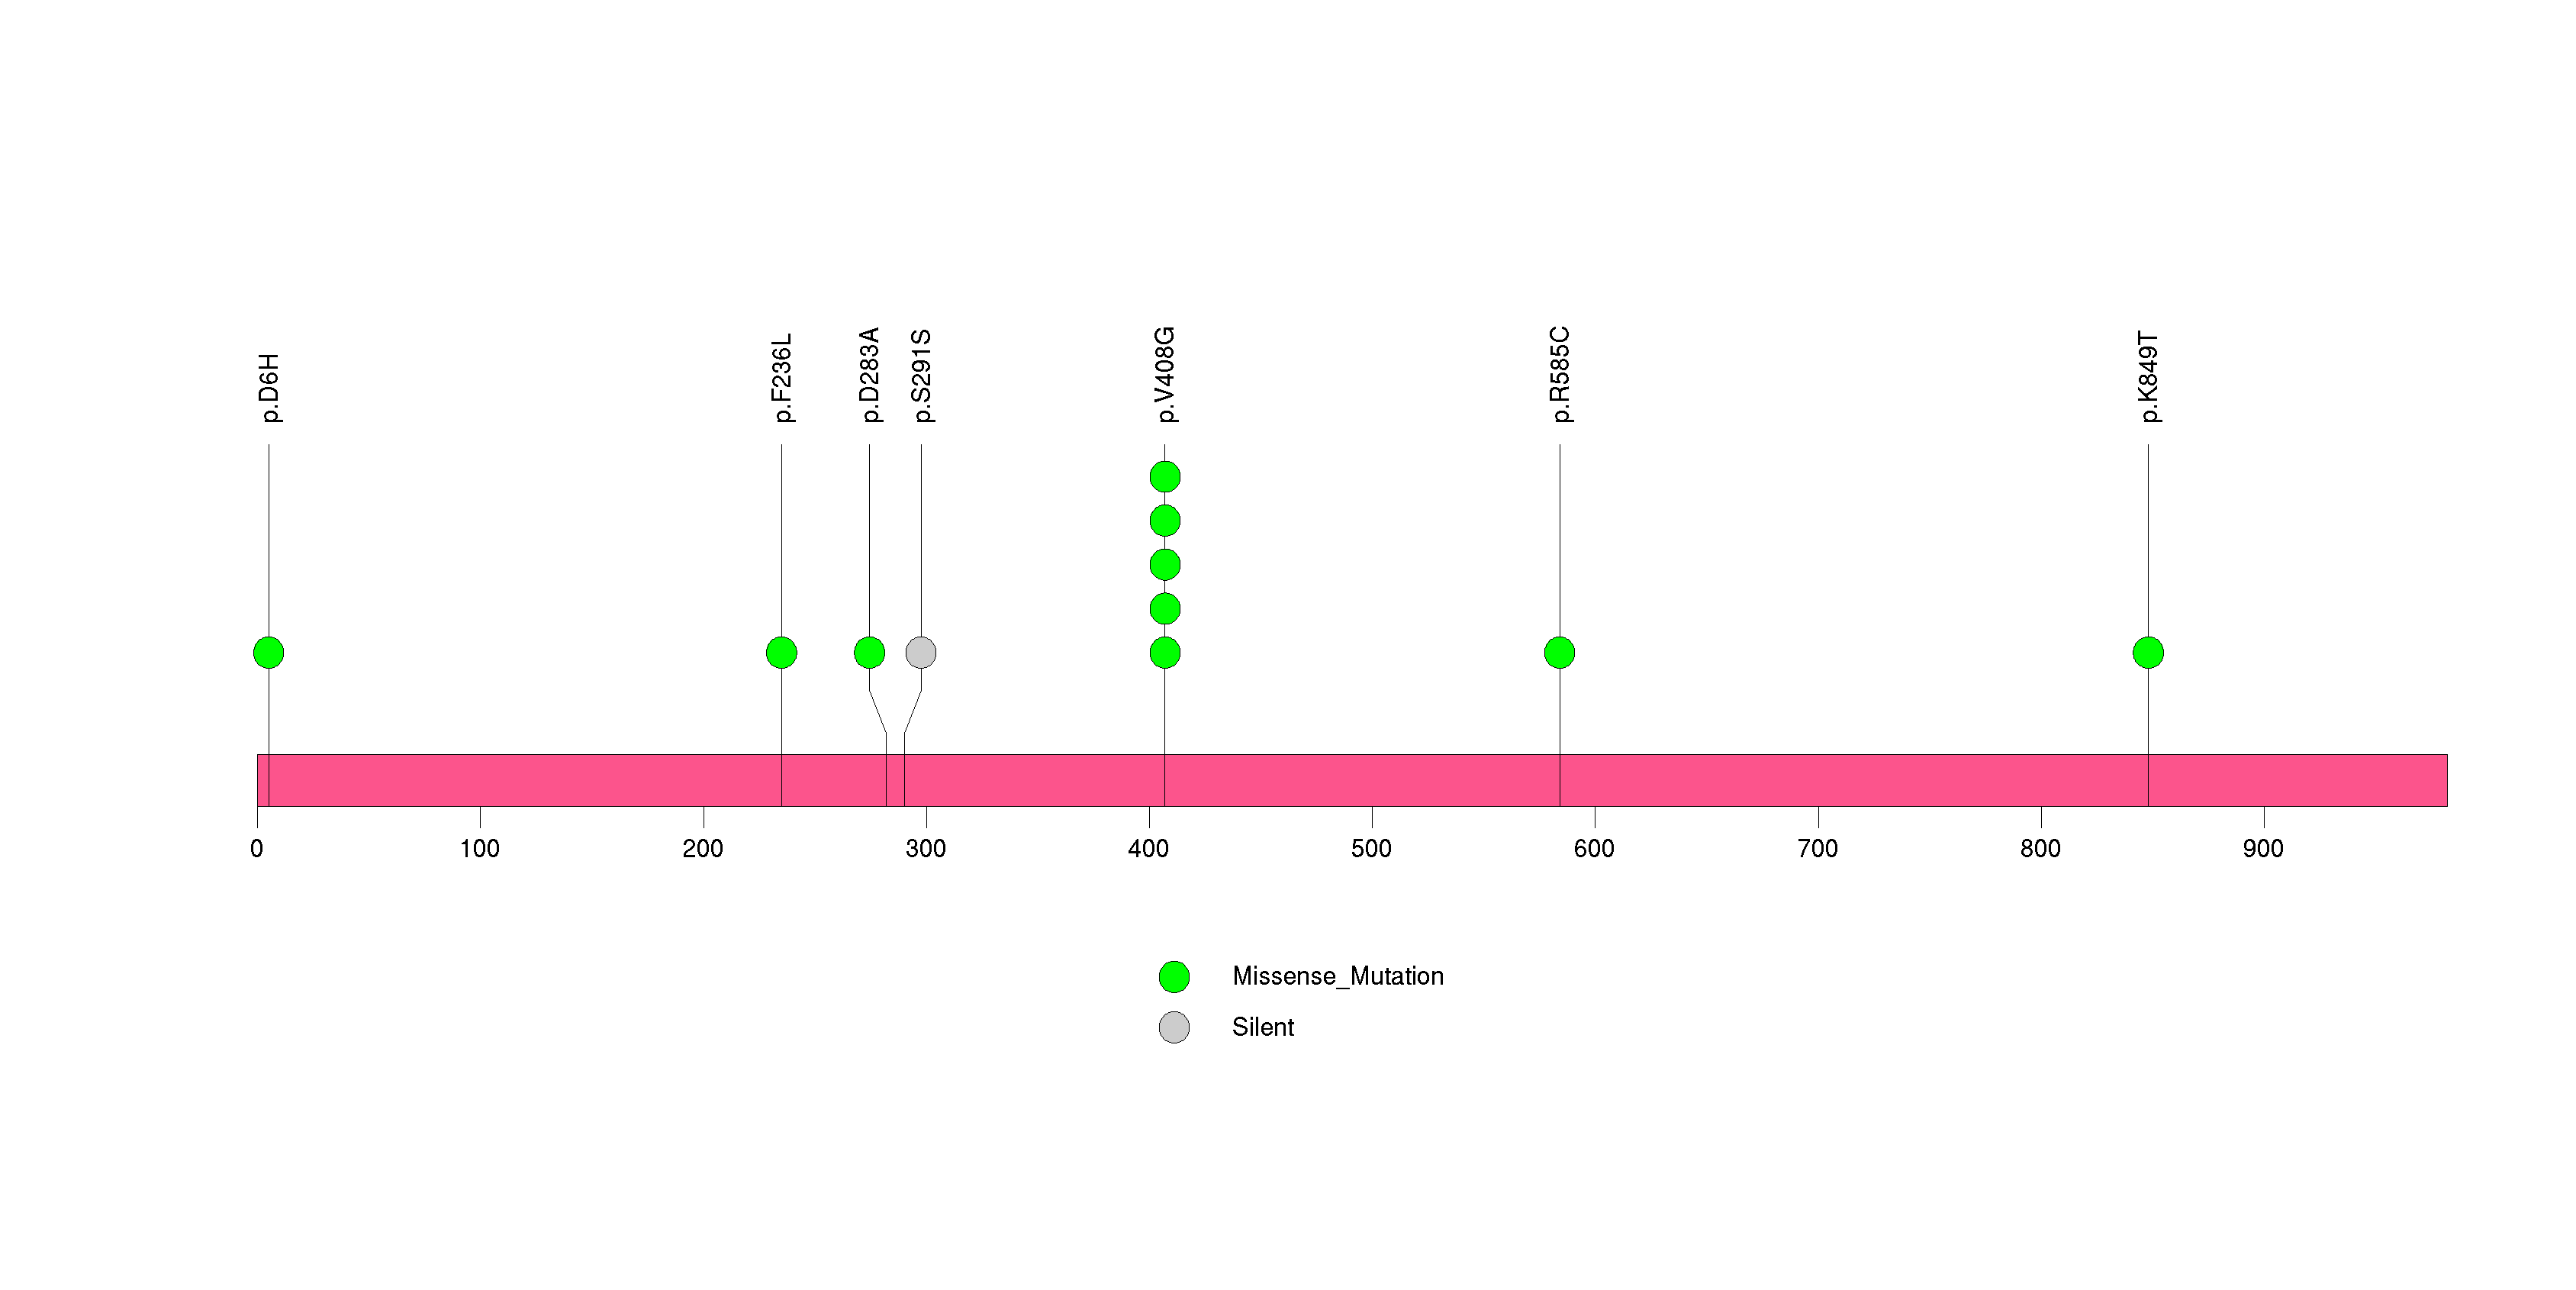
Figure S16. This figure depicts the distribution of mutations and mutation types across the TSPAN19 significant gene.
Figure S17. This figure depicts the distribution of mutations and mutation types across the CR1 significant gene.
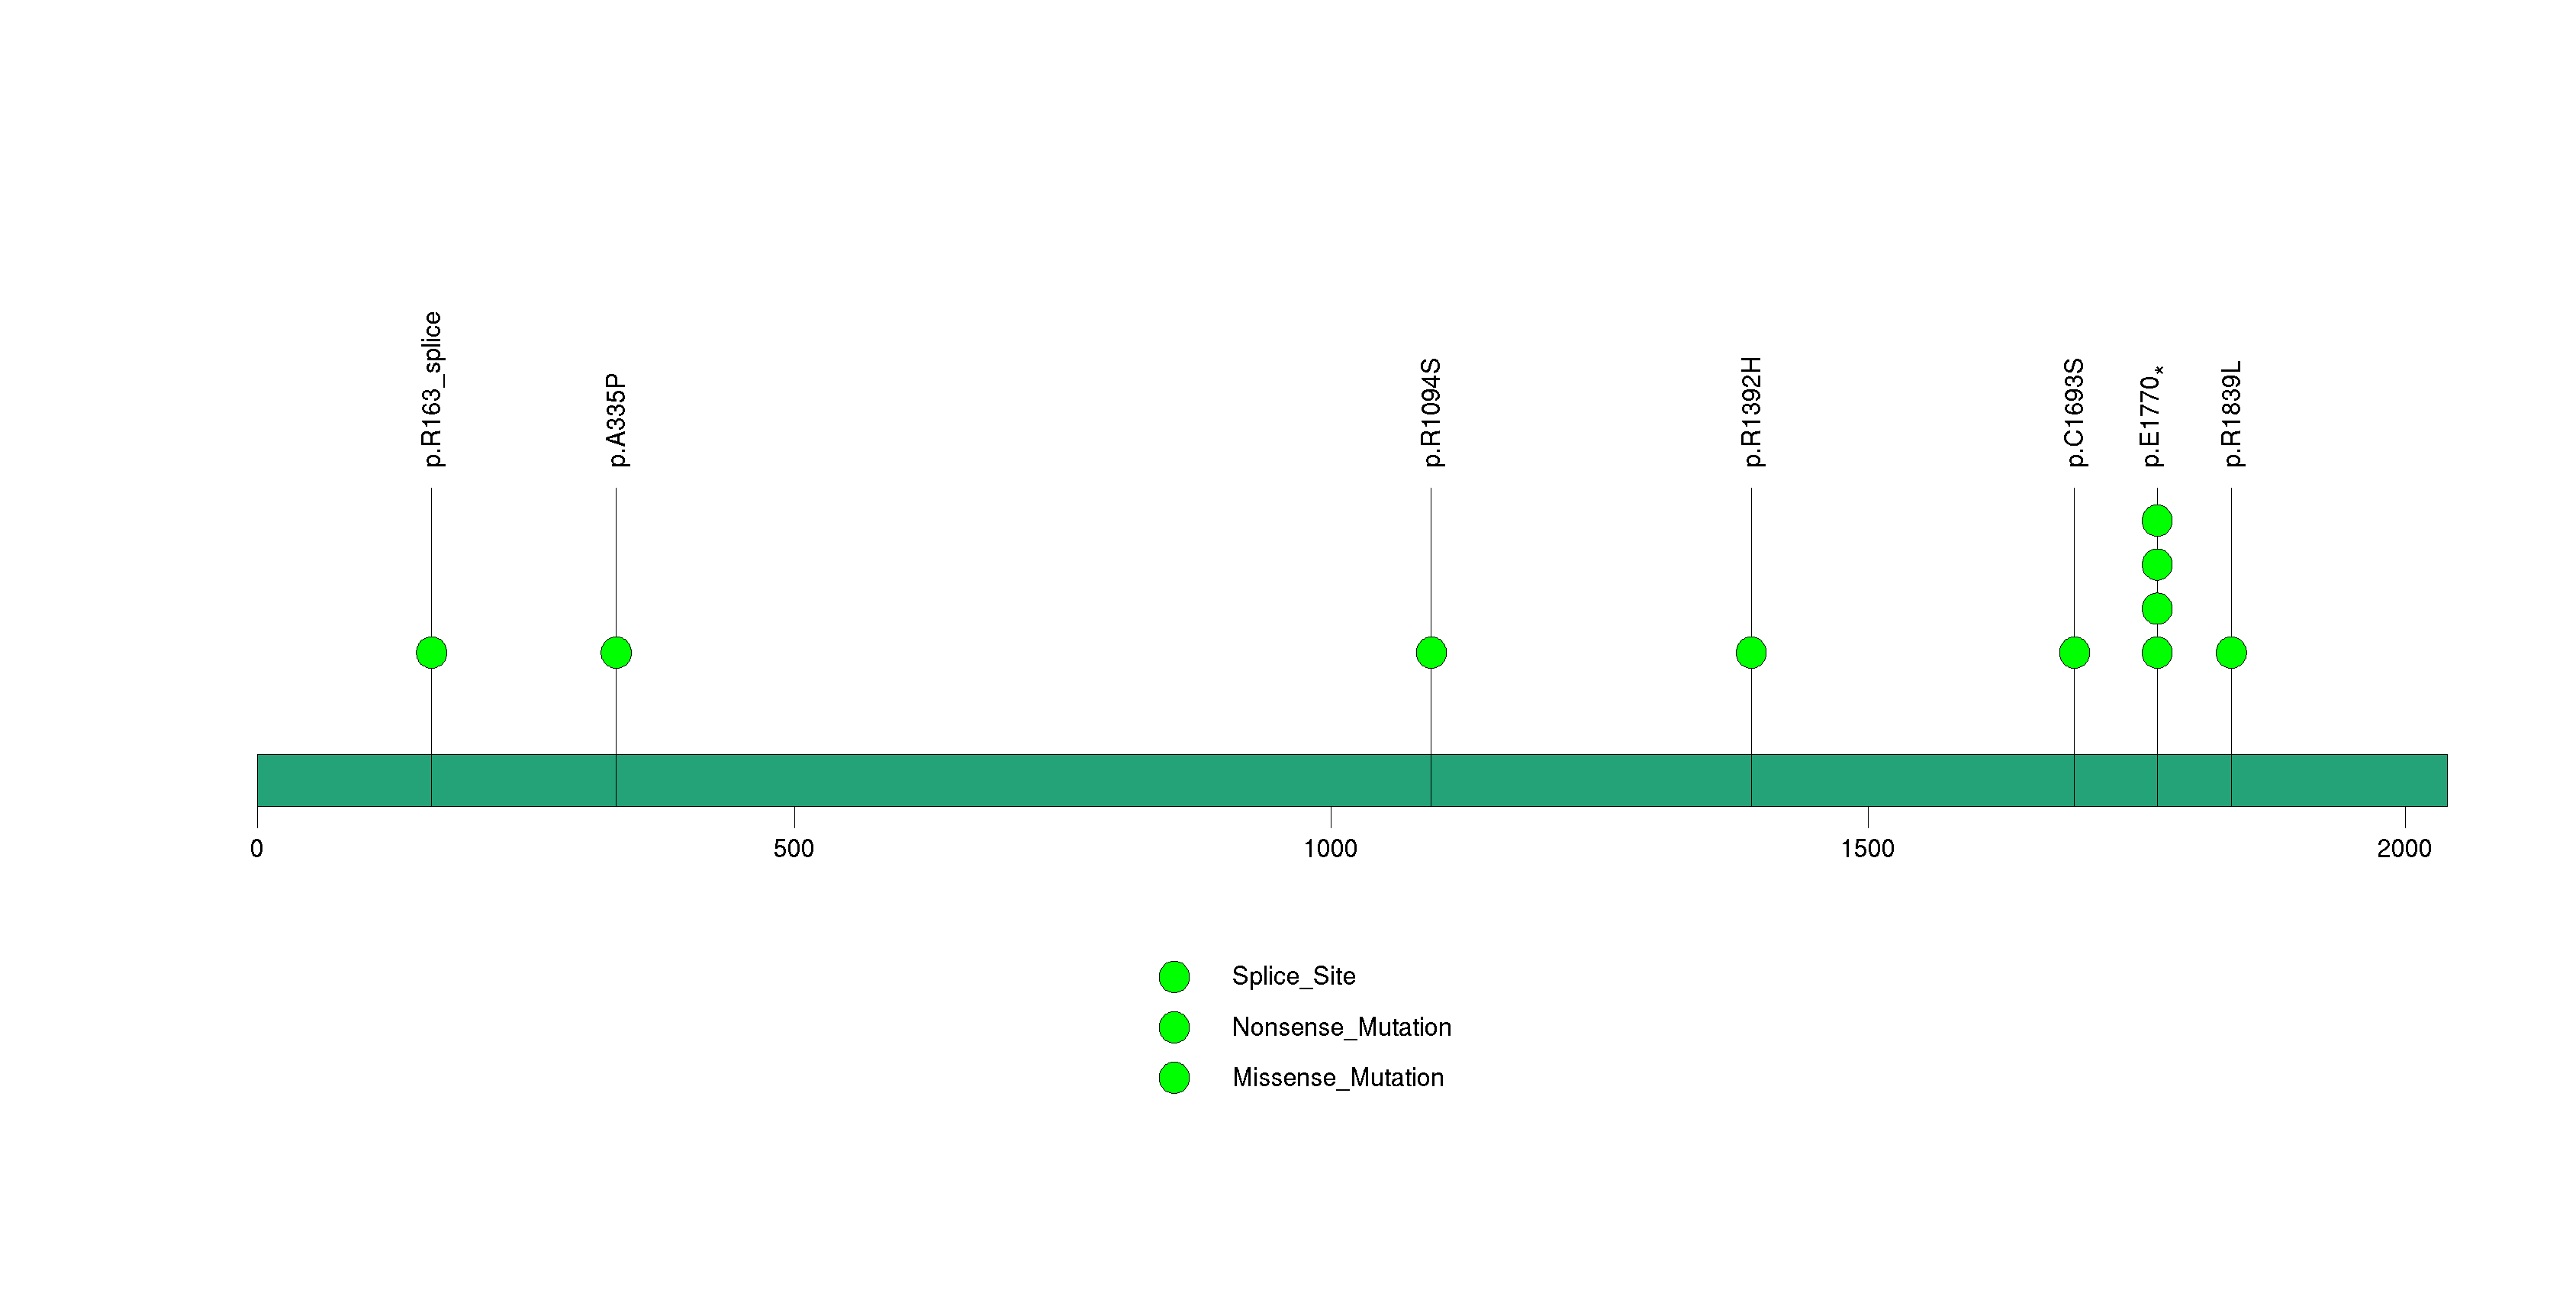
Figure S18. This figure depicts the distribution of mutations and mutation types across the CNTNAP4 significant gene.
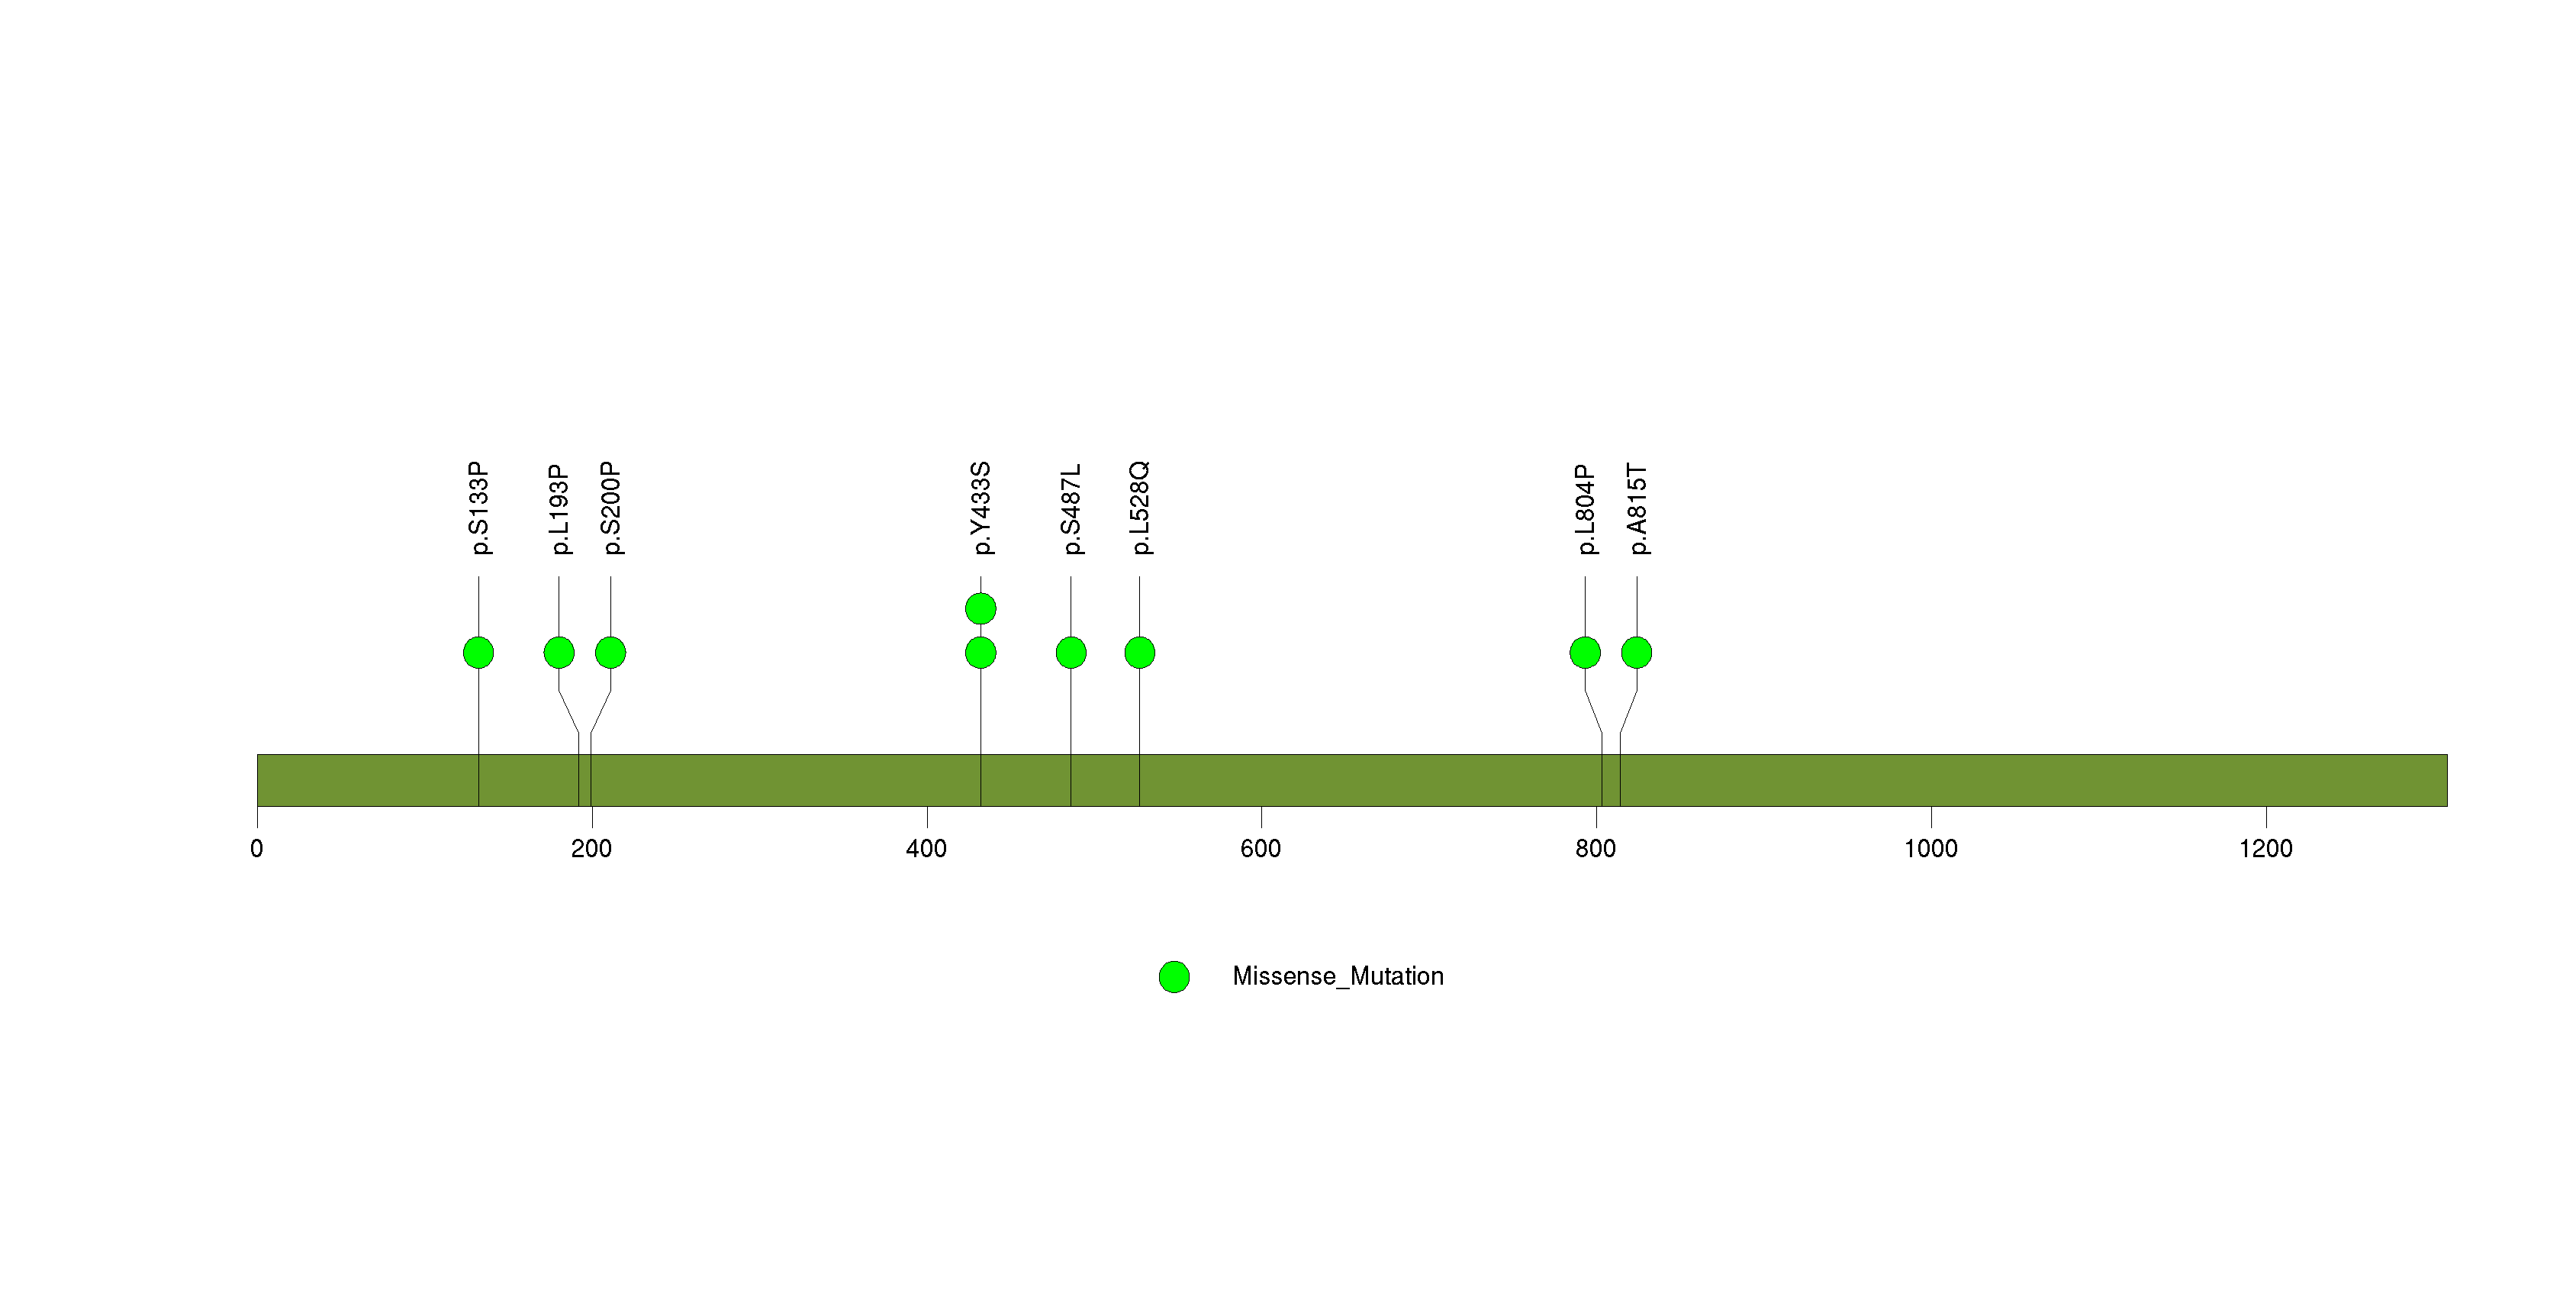
Figure S19. This figure depicts the distribution of mutations and mutation types across the ABCB1 significant gene.
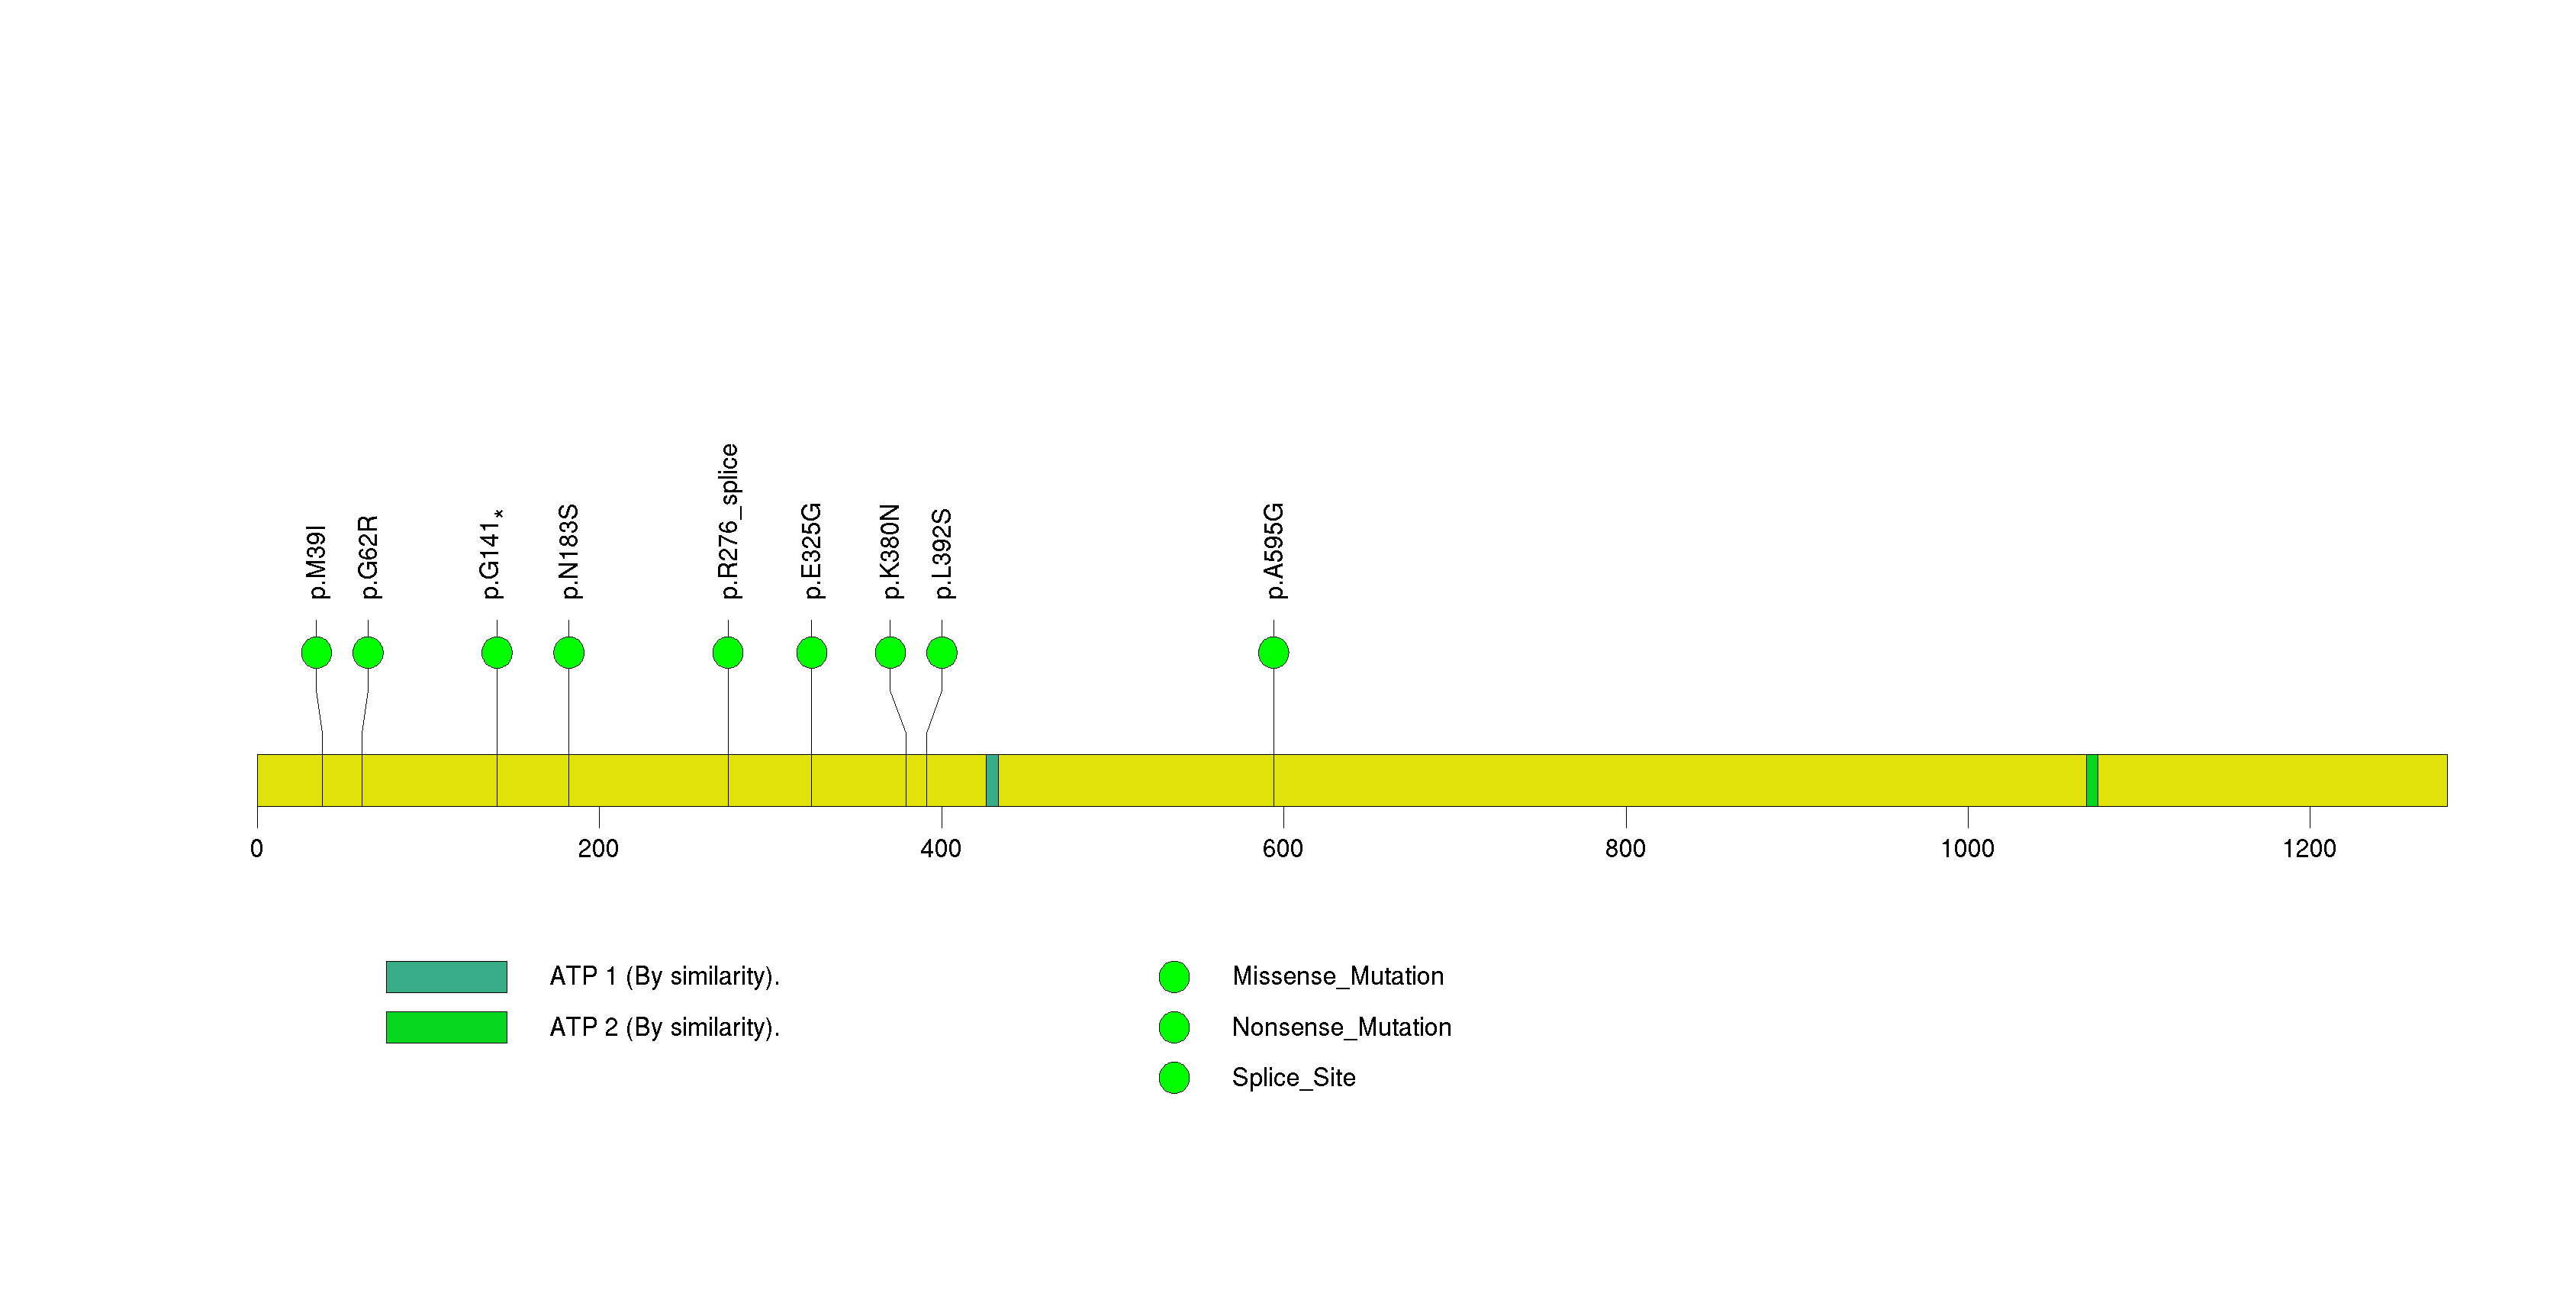
Figure S20. This figure depicts the distribution of mutations and mutation types across the STAG2 significant gene.
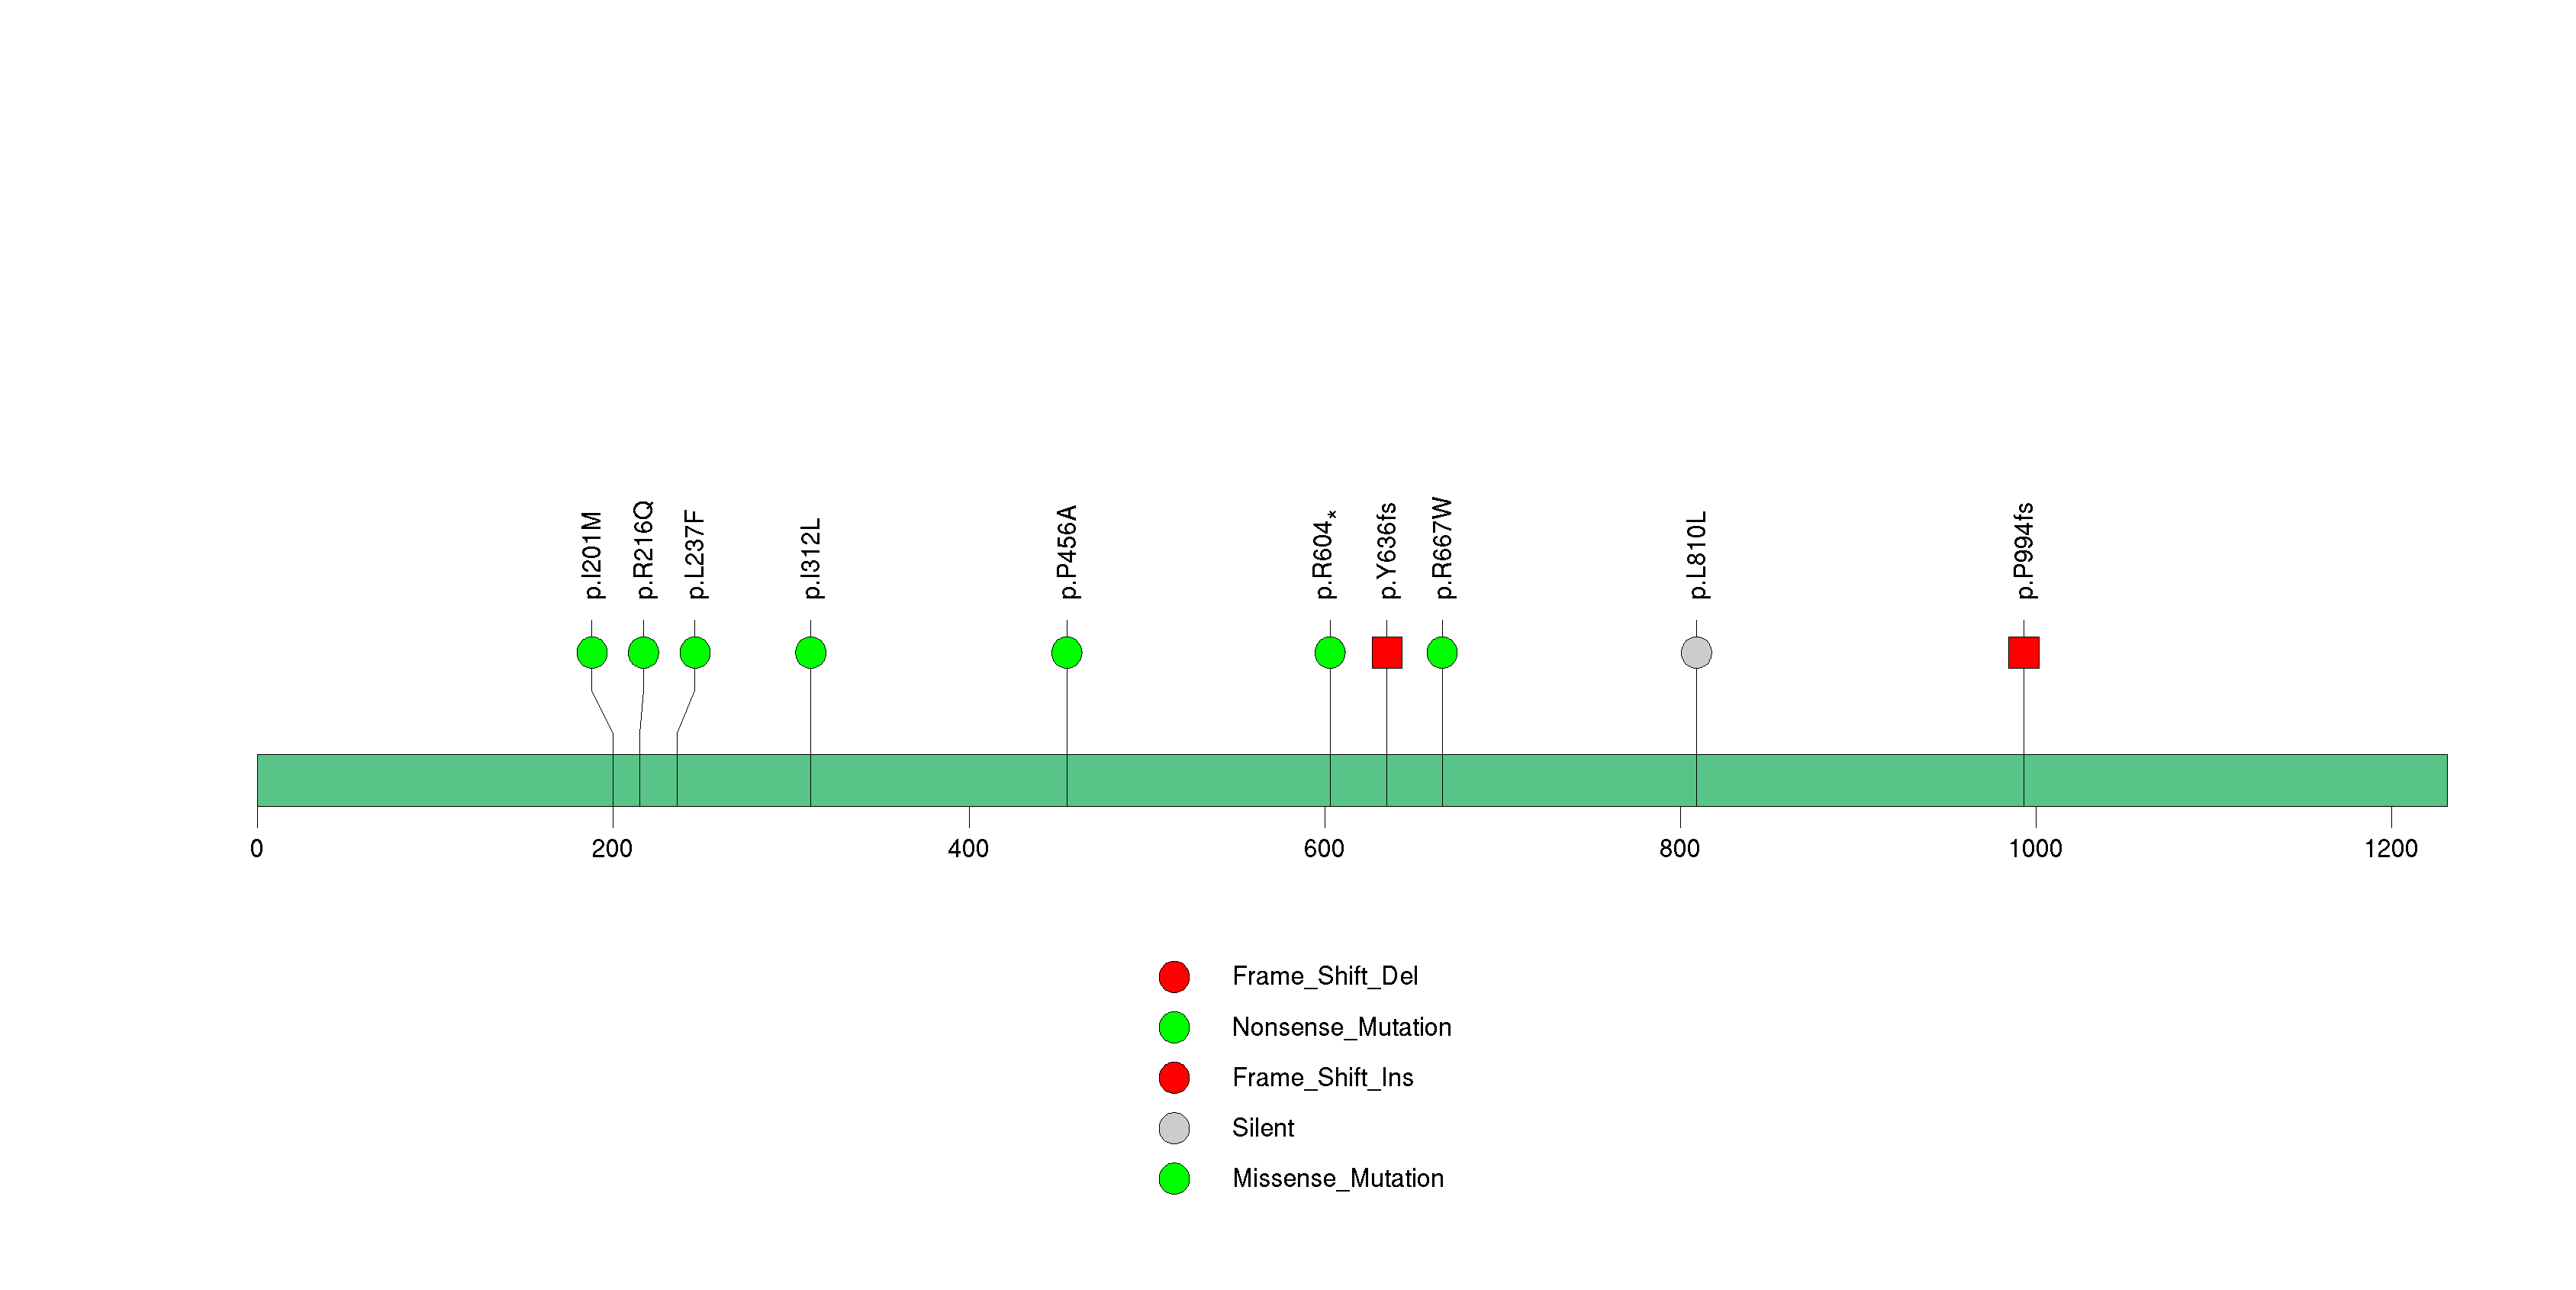
Figure S21. This figure depicts the distribution of mutations and mutation types across the MSN significant gene.
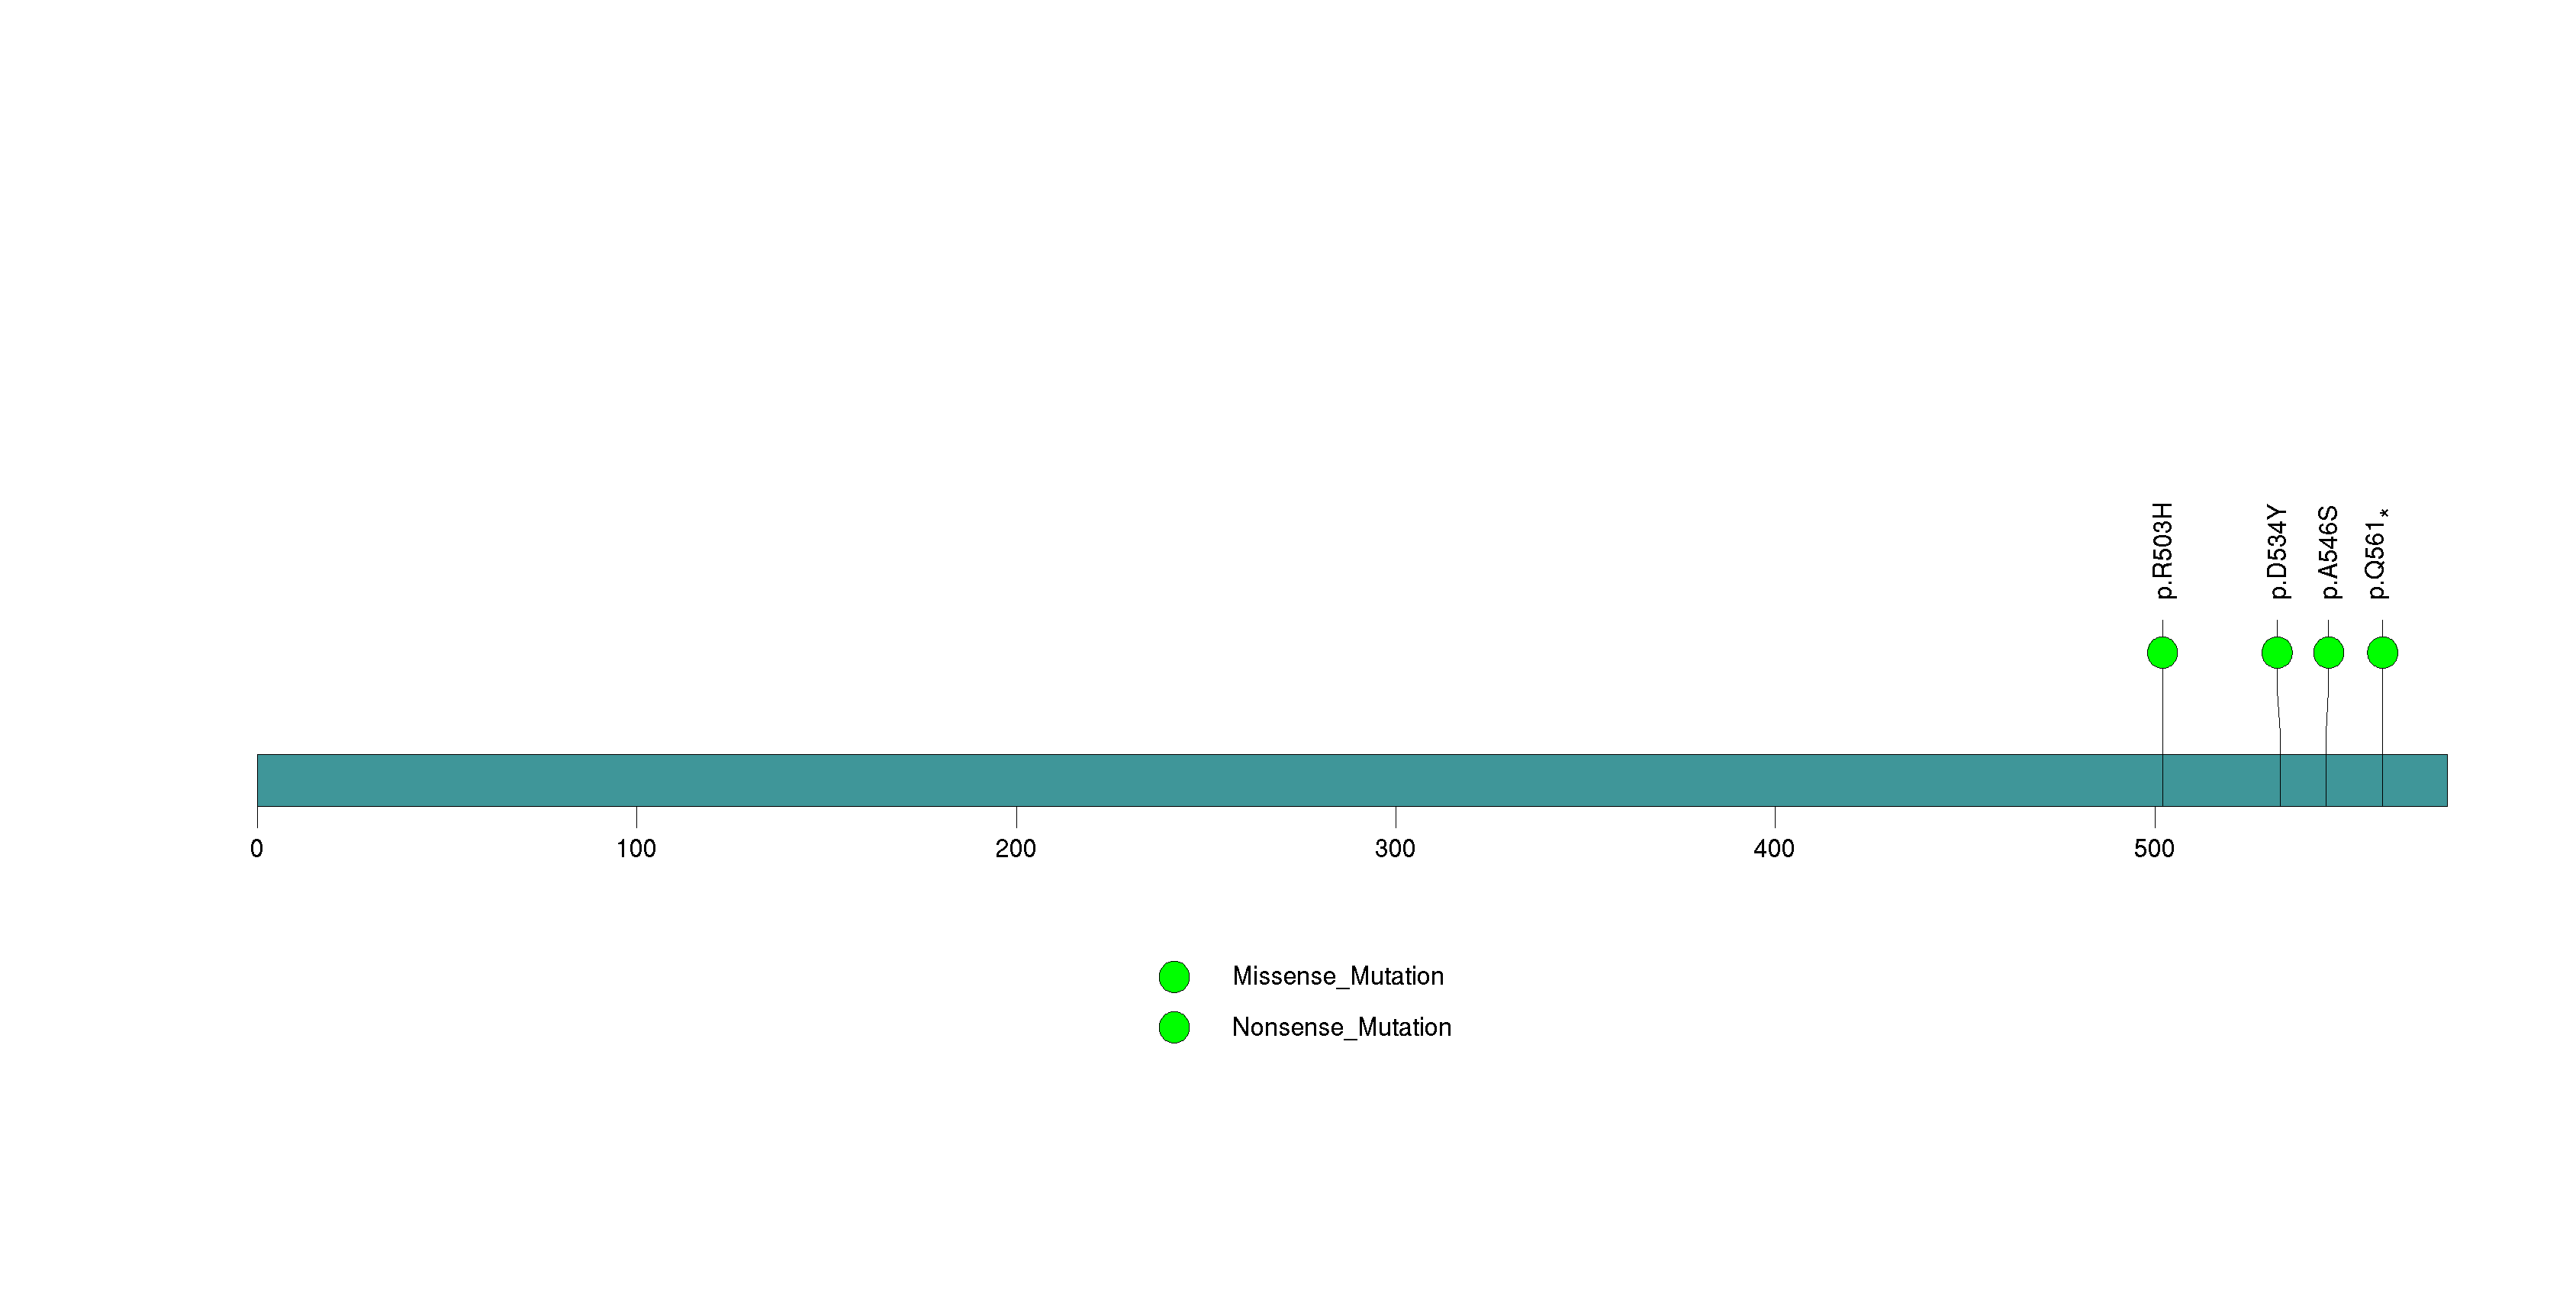
Figure S22. This figure depicts the distribution of mutations and mutation types across the NPNT significant gene.
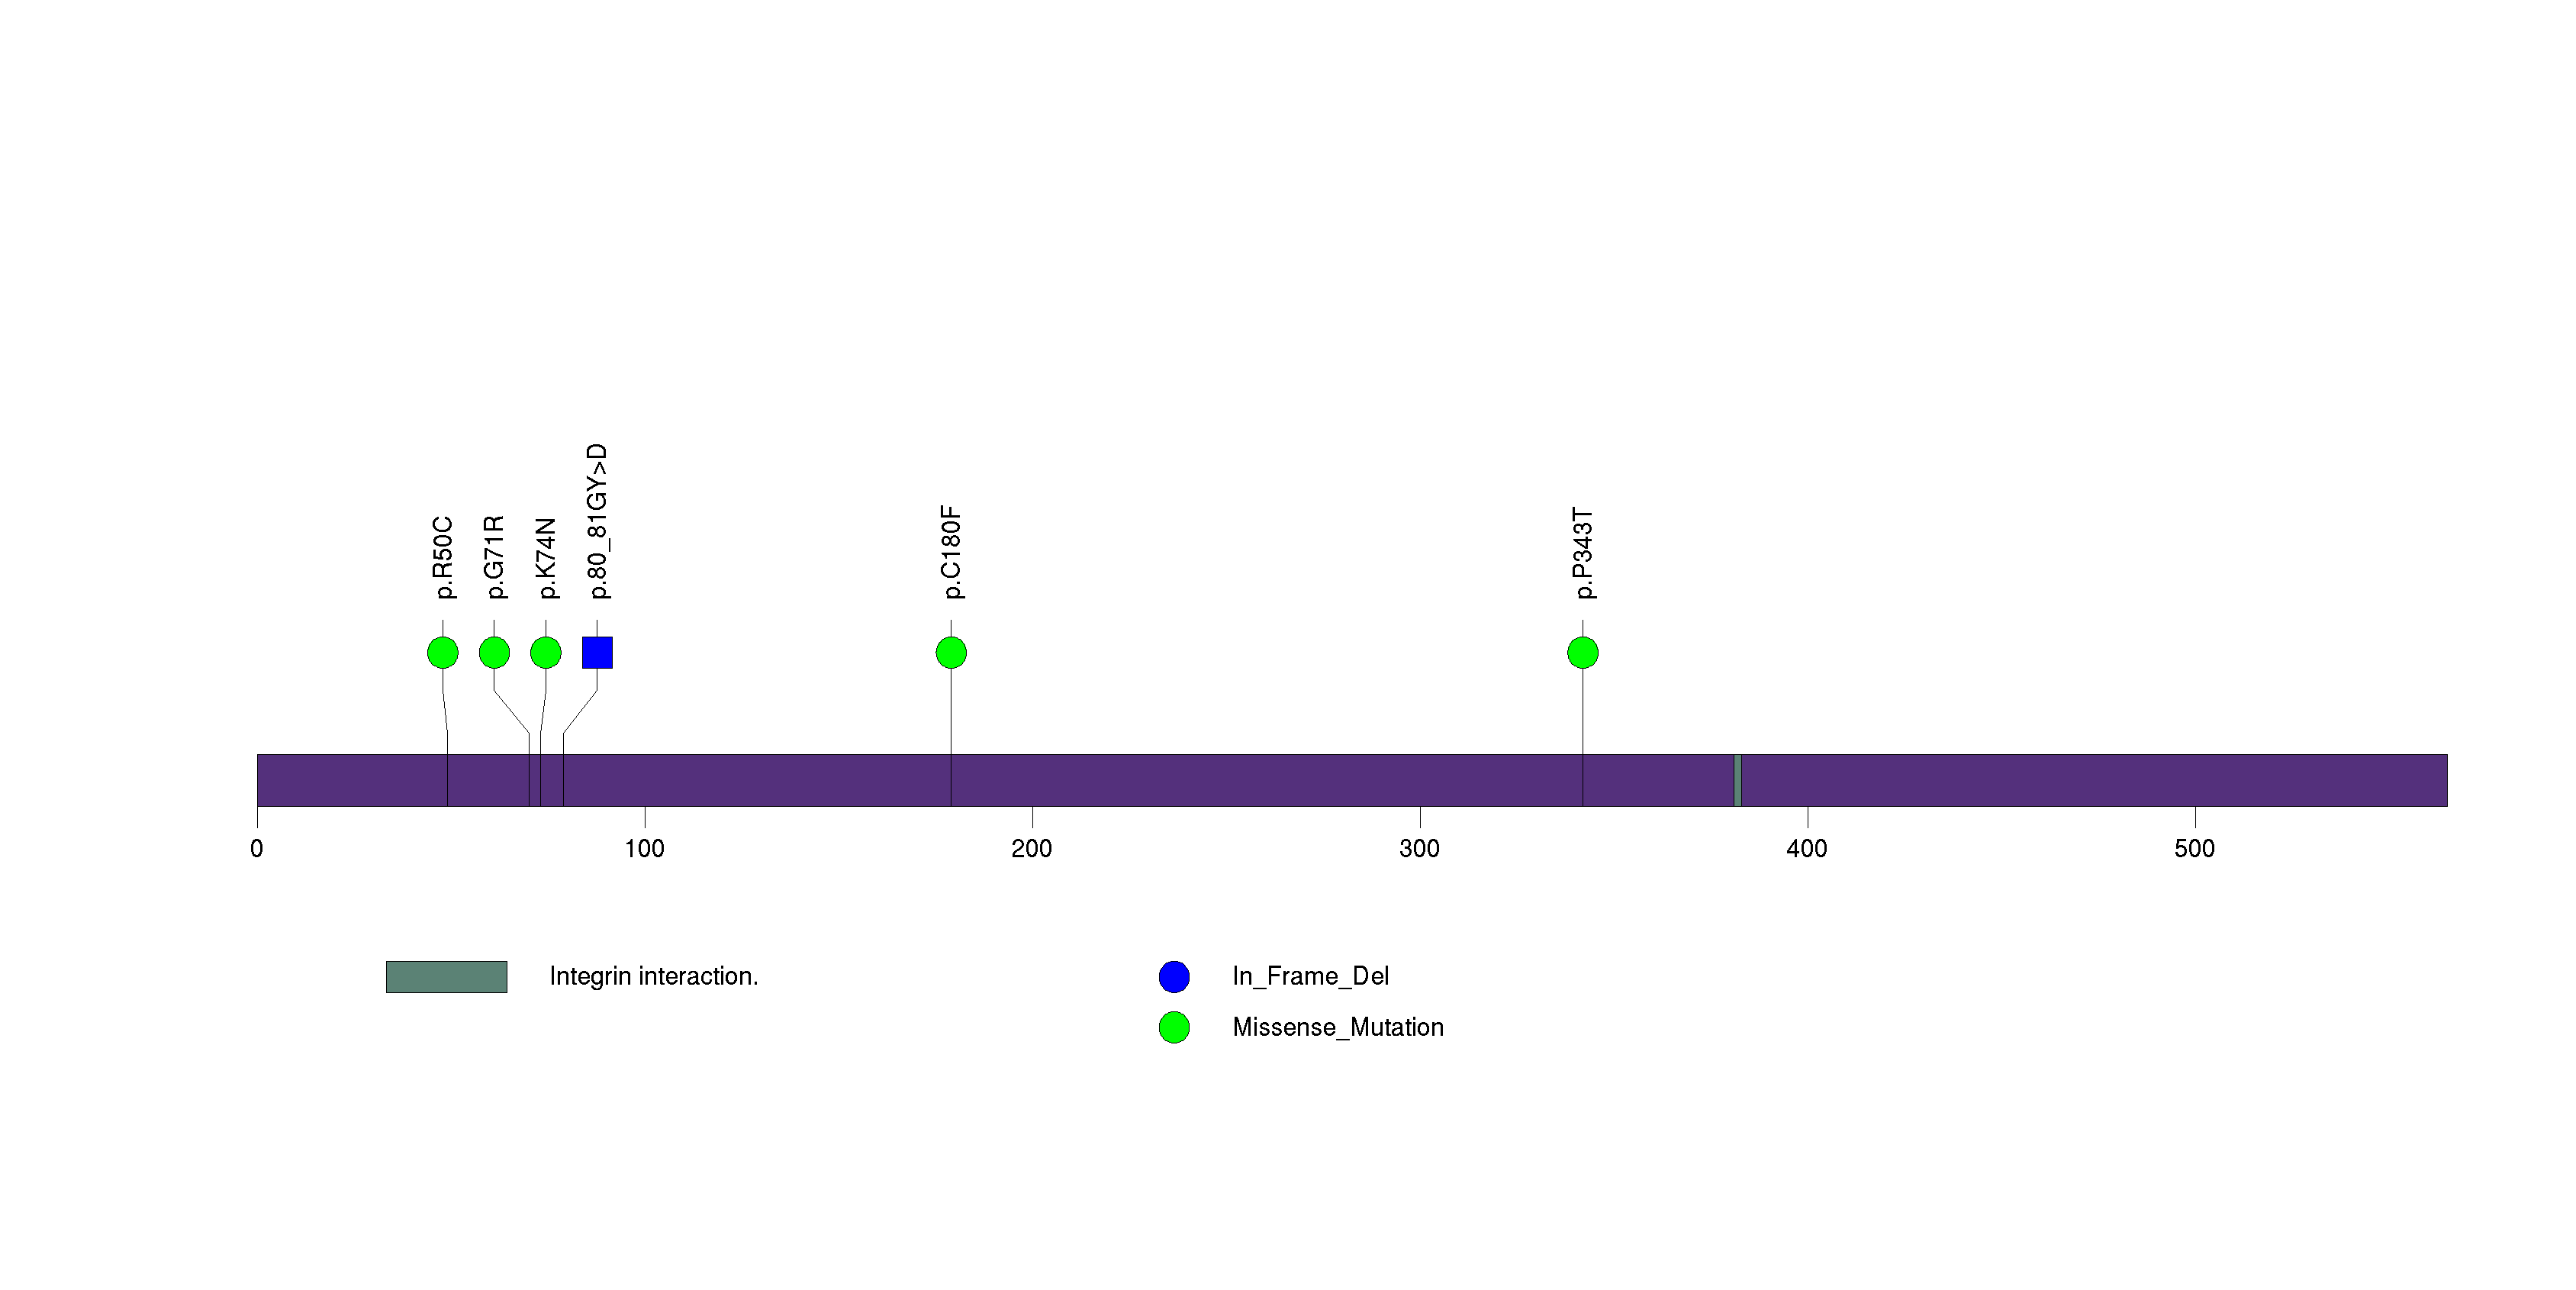
Figure S23. This figure depicts the distribution of mutations and mutation types across the OR5M8 significant gene.
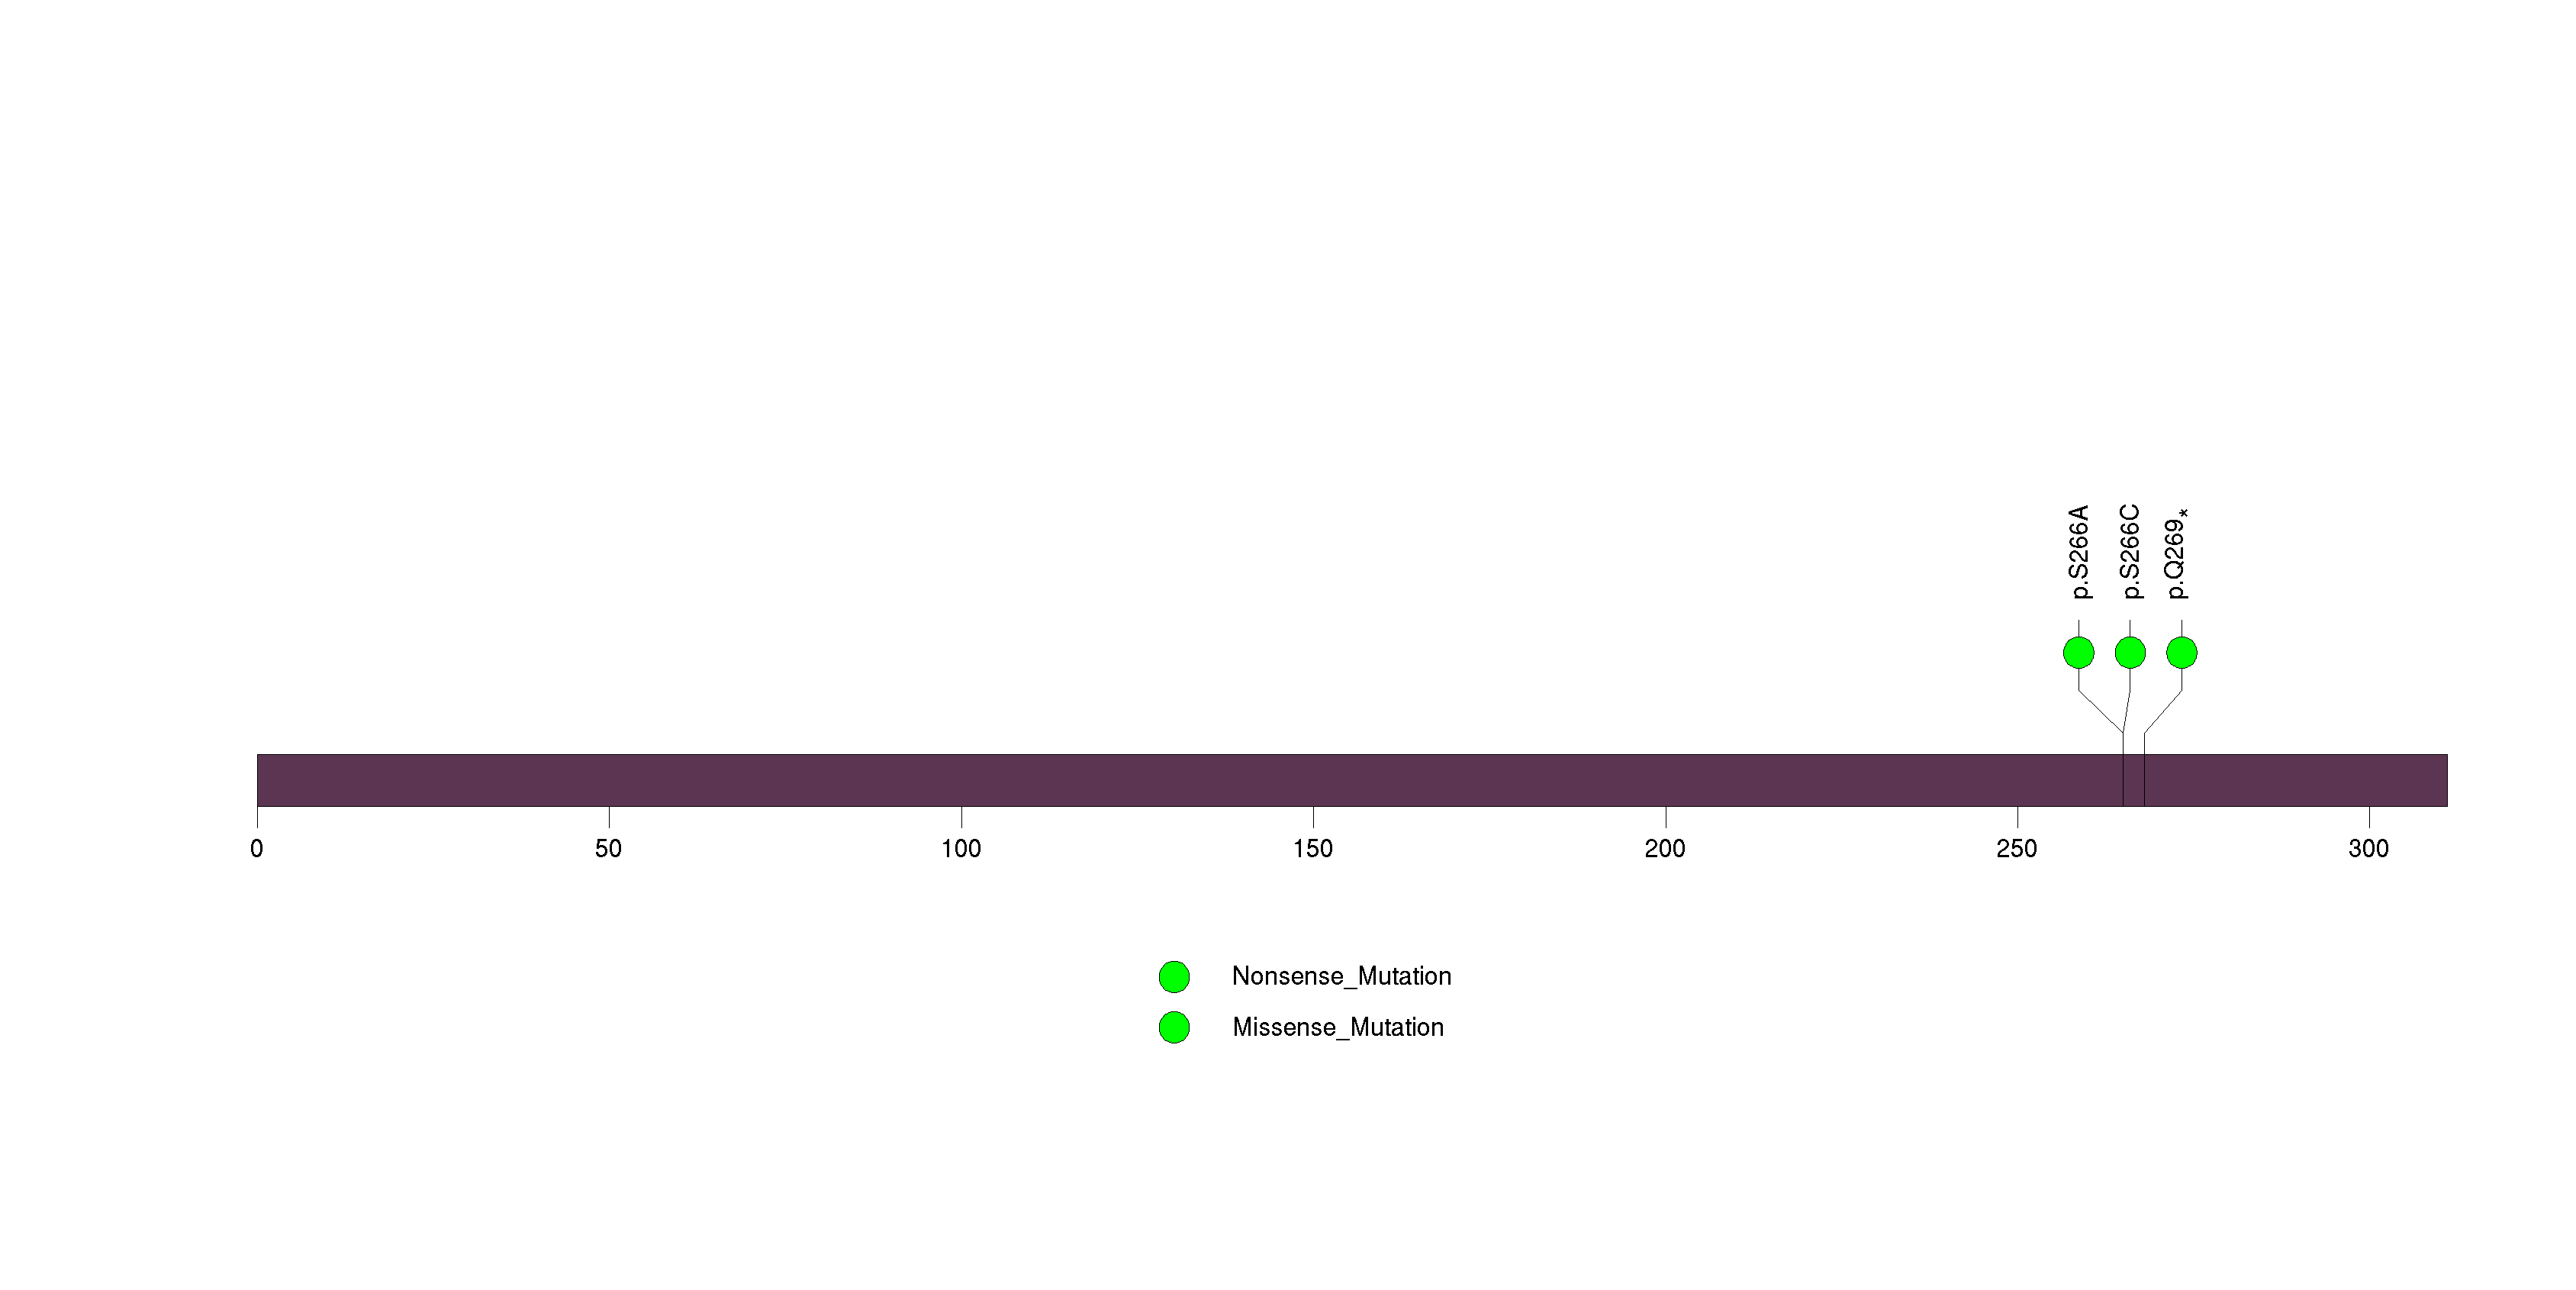
Figure S24. This figure depicts the distribution of mutations and mutation types across the SPAM1 significant gene.
In this analysis, COSMIC is used as a filter to increase power by restricting the territory of each gene. Cosmic version: v48.
Table 4. Get Full Table Significantly mutated genes (COSMIC territory only). To access the database please go to: COSMIC. Number of significant genes found: 5. Number of genes displayed: 10
| rank | gene | description | n | cos | n_cos | N_cos | cos_ev | p | q |
|---|---|---|---|---|---|---|---|---|---|
| 1 | VHL | von Hippel-Lindau tumor suppressor | 138 | 537 | 138 | 157341 | 3461 | 0 | 0 |
| 2 | PIK3CA | phosphoinositide-3-kinase, catalytic, alpha polypeptide | 10 | 184 | 9 | 53912 | 3007 | 0 | 0 |
| 3 | PTEN | phosphatase and tensin homolog (mutated in multiple advanced cancers 1) | 10 | 728 | 10 | 213304 | 76 | 4.2e-11 | 6.3e-08 |
| 4 | TP53 | tumor protein p53 | 7 | 308 | 7 | 90244 | 1411 | 1.2e-09 | 1.3e-06 |
| 5 | KRAS | v-Ki-ras2 Kirsten rat sarcoma viral oncogene homolog | 3 | 51 | 3 | 14943 | 14812 | 4.5e-06 | 0.0041 |
| 6 | SMARCA4 | SWI/SNF related, matrix associated, actin dependent regulator of chromatin, subfamily a, member 4 | 7 | 29 | 2 | 8497 | 2 | 0.00015 | 0.11 |
| 7 | NF2 | neurofibromin 2 (merlin) | 4 | 543 | 4 | 159099 | 32 | 0.00035 | 0.22 |
| 8 | ONECUT2 | one cut homeobox 2 | 1 | 1 | 1 | 293 | 1 | 0.00059 | 0.24 |
| 9 | PDLIM4 | PDZ and LIM domain 4 | 2 | 1 | 1 | 293 | 1 | 0.00059 | 0.24 |
| 10 | PRDX5 | peroxiredoxin 5 | 1 | 1 | 1 | 293 | 1 | 0.00059 | 0.24 |
Note:
n - number of (nonsilent) mutations in this gene across the individual set.
cos = number of unique mutated sites in this gene in COSMIC
n_cos = overlap between n and cos.
N_cos = number of individuals times cos.
cos_ev = total evidence: number of reports in COSMIC for mutations seen in this gene.
p = p-value for seeing the observed amount of overlap in this gene)
q = q-value, False Discovery Rate (Benjamini-Hochberg procedure)
Table 5. Get Full Table Genes with Clustered Mutations
| num | gene | desc | n | mindist | nmuts0 | nmuts3 | nmuts12 | npairs0 | npairs3 | npairs12 |
|---|---|---|---|---|---|---|---|---|---|---|
| 8583 | VHL | von Hippel-Lindau tumor suppressor | 133 | 0 | 105 | 319 | 772 | 105 | 319 | 772 |
| 4916 | MUC4 | mucin 4, cell surface associated | 61 | 0 | 22 | 37 | 78 | 22 | 37 | 78 |
| 2407 | EBPL | emopamil binding protein-like | 6 | 0 | 10 | 10 | 15 | 10 | 10 | 15 |
| 8657 | WDR52 | WD repeat domain 52 | 10 | 0 | 10 | 10 | 10 | 10 | 10 | 10 |
| 5049 | NBPF10 | neuroblastoma breakpoint family, member 10 | 25 | 0 | 7 | 11 | 11 | 7 | 11 | 11 |
| 733 | BAP1 | BRCA1 associated protein-1 (ubiquitin carboxy-terminal hydrolase) | 27 | 0 | 6 | 11 | 21 | 6 | 11 | 21 |
| 1884 | CR1 | complement component (3b/4b) receptor 1 (Knops blood group) | 10 | 0 | 6 | 6 | 6 | 6 | 6 | 6 |
| 4901 | MTOR | mechanistic target of rapamycin (serine/threonine kinase) | 26 | 0 | 5 | 9 | 19 | 5 | 9 | 19 |
| 5050 | NBPF9 | neuroblastoma breakpoint family, member 9 | 13 | 0 | 3 | 7 | 9 | 3 | 7 | 9 |
| 8734 | XPOT | exportin, tRNA (nuclear export receptor for tRNAs) | 7 | 0 | 3 | 3 | 6 | 3 | 3 | 6 |
Note:
n - number of mutations in this gene in the individual set.
mindist - distance (in aa) between closest pair of mutations in this gene
npairs3 - how many pairs of mutations are within 3 aa of each other.
npairs12 - how many pairs of mutations are within 12 aa of each other.
Table 6. Get Full Table A Ranked List of Significantly Mutated Genesets. (Source: MSigDB GSEA Cannonical Pathway Set).Number of significant genesets found: 6. Number of genesets displayed: 10
| rank | geneset | description | genes | N_genes | mut_tally | N | n | npat | nsite | nsil | n1 | n2 | n3 | n4 | n5 | n6 | p_ns_s | p | q |
|---|---|---|---|---|---|---|---|---|---|---|---|---|---|---|---|---|---|---|---|
| 1 | VEGFPATHWAY | Vascular endothelial growth factor (VEGF) is upregulated by hypoxic conditions and promotes normal blood vessel formation and angiogenesis related to tumor growth or cardiac disease. | ARNT, EIF1, EIF1A, EIF2B1, EIF2B2, EIF2B3, EIF2B4, EIF2B5, EIF2S1, EIF2S2, EIF2S3, ELAVL1, FLT1, FLT4, HIF1A, HRAS, KDR, NOS3, PIK3CA, PIK3R1, PLCG1, PRKCA, PRKCB1, PTK2, PXN, SHC1, VEGF, VHL | 25 | EIF1(1), EIF2B1(2), EIF2B2(1), EIF2B5(2), EIF2S1(1), EIF2S2(1), ELAVL1(1), FLT1(3), FLT4(4), HIF1A(3), KDR(5), NOS3(1), PIK3CA(10), PIK3R1(1), PTK2(1), PXN(2), SHC1(2), VHL(138) | 14983008 | 179 | 157 | 132 | 10 | 6 | 15 | 19 | 50 | 89 | 0 | 1.7e-07 | 1.1e-15 | 3.4e-13 |
| 2 | HIFPATHWAY | Under normal conditions, hypoxia inducible factor HIF-1 is degraded; under hypoxic conditions, it activates transcription of genes controlled by hpoxic response elements (HREs). | ARNT, ASPH, COPS5, CREB1, EDN1, EP300, EPO, HIF1A, HSPCA, JUN, LDHA, NOS3, P4HB, VEGF, VHL | 13 | EP300(6), HIF1A(3), JUN(1), NOS3(1), VHL(138) | 7504580 | 149 | 143 | 103 | 7 | 1 | 14 | 11 | 37 | 86 | 0 | 1e-06 | 1.1e-15 | 3.4e-13 |
| 3 | HSA04120_UBIQUITIN_MEDIATED_PROTEOLYSIS | Genes involved in ubiquitin mediated proteolysis | ANAPC1, ANAPC10, ANAPC11, ANAPC2, ANAPC4, ANAPC5, ANAPC7, BTRC, CDC16, CDC20, CDC23, CDC26, CDC27, CUL1, CUL2, CUL3, FBXW11, FBXW7, FZR1, ITCH, LOC728919, RBX1, SKP1, SKP2, SMURF1, SMURF2, TCEB1, TCEB2, UBA1, UBE2C, UBE2D1, UBE2D2, UBE2D3, UBE2D4, UBE2E1, UBE2E2, UBE2E3, VHL, WWP1, WWP2 | 39 | ANAPC1(4), ANAPC2(1), ANAPC4(2), ANAPC5(2), ANAPC7(1), CDC16(2), CDC20(1), CDC23(2), CDC27(5), CUL1(3), CUL2(1), CUL3(2), FBXW11(1), FBXW7(2), FZR1(1), SKP2(1), SMURF1(1), SMURF2(2), TCEB1(2), UBA1(1), UBE2D1(2), UBE2D2(1), UBE2D3(1), UBE2E2(1), VHL(138), WWP2(1) | 17820449 | 181 | 157 | 135 | 13 | 2 | 18 | 23 | 45 | 93 | 0 | 1.3e-06 | 7.7e-15 | 1.6e-12 |
| 4 | SA_PTEN_PATHWAY | PTEN is a tumor suppressor that dephosphorylates the lipid messenger phosphatidylinositol triphosphate. | AKT1, AKT2, AKT3, BPNT1, GRB2, ILK, MAPK1, MAPK3, PDK1, PIK3CA, PIK3CD, PIP3-E, PTEN, PTK2B, RBL2, SHC1, SOS1 | 16 | AKT1(1), AKT2(2), AKT3(2), MAPK1(1), MAPK3(1), PDK1(1), PIK3CA(10), PIK3CD(1), PTEN(10), PTK2B(2), RBL2(3), SHC1(2), SOS1(4) | 8973555 | 40 | 38 | 39 | 2 | 3 | 2 | 15 | 12 | 8 | 0 | 0.00042 | 7.9e-06 | 0.0012 |
| 5 | CDC42RACPATHWAY | PI3 kinase stimulates cell migration by activating cdc42, which activates ARP2/3, which in turn promotes formation of new actin fibers. | ACTR2, ACTR3, ARHA, ARPC1A, ARPC1B, ARPC2, ARPC3, ARPC4, CDC42, PAK1, PDGFRA, PIK3CA, PIK3R1, RAC1, WASL | 14 | ACTR2(2), ACTR3(1), ARPC2(1), CDC42(2), PAK1(1), PDGFRA(5), PIK3CA(10), PIK3R1(1), WASL(5) | 5877261 | 28 | 28 | 27 | 2 | 0 | 1 | 11 | 15 | 1 | 0 | 0.018 | 0.00036 | 0.045 |
| 6 | SA_TRKA_RECEPTOR | The TrkA receptor binds nerve growth factor to activate MAP kinase pathways and promote cell growth. | AKT1, AKT2, AKT3, ARHA, CDKN1A, ELK1, GRB2, HRAS, MAP2K1, MAP2K2, NGFB, NGFR, NTRK1, PIK3CA, PIK3CD, SHC1, SOS1 | 15 | AKT1(1), AKT2(2), AKT3(2), CDKN1A(1), ELK1(1), MAP2K1(1), NGFR(1), NTRK1(2), PIK3CA(10), PIK3CD(1), SHC1(2), SOS1(4) | 7184719 | 28 | 28 | 27 | 1 | 2 | 1 | 12 | 12 | 1 | 0 | 0.002 | 0.00079 | 0.082 |
| 7 | P53HYPOXIAPATHWAY | Hypoxia induces p53 accumulation and consequent apoptosis with p53-mediated cell cycle arrest, which is present under conditions of DNA damage. | ABCB1, AKT1, ATM, BAX, CDKN1A, CPB2, CSNK1A1, CSNK1D, FHL2, GADD45A, HIC1, HIF1A, HSPA1A, HSPCA, IGFBP3, MAPK8, MDM2, NFKBIB, NQO1, TP53 | 19 | ABCB1(9), AKT1(1), ATM(13), CDKN1A(1), CSNK1A1(1), FHL2(1), HIC1(1), HIF1A(3), MAPK8(1), TP53(7) | 9166900 | 38 | 33 | 38 | 2 | 2 | 0 | 14 | 10 | 12 | 0 | 0.0018 | 0.0016 | 0.14 |
| 8 | HSA00950_ALKALOID_BIOSYNTHESIS_I | Genes involved in alkaloid biosynthesis I | DDC, GOT1, GOT2, TAT, TYR | 5 | DDC(3), GOT1(2), GOT2(3), TAT(1), TYR(1) | 2063429 | 10 | 10 | 10 | 1 | 1 | 0 | 5 | 1 | 3 | 0 | 0.2 | 0.0044 | 0.34 |
| 9 | HSA00401_NOVOBIOCIN_BIOSYNTHESIS | Genes involved in novobiocin biosynthesis | GOT1, GOT2, TAT | 3 | GOT1(2), GOT2(3), TAT(1) | 1153972 | 6 | 6 | 6 | 1 | 1 | 0 | 3 | 0 | 2 | 0 | 0.42 | 0.013 | 0.92 |
| 10 | CYSTEINE_METABOLISM | CARS, CTH, GOT1, GOT2, LDHA, LDHB, LDHC, MPST | 8 | CARS(2), CTH(1), GOT1(2), GOT2(3), LDHB(1), LDHC(2), MPST(2) | 3003190 | 13 | 13 | 13 | 2 | 2 | 0 | 4 | 3 | 4 | 0 | 0.33 | 0.017 | 1 |
Table 7. Get Full Table A Ranked List of Significantly Mutated Genesets (Excluding Significantly Mutated Genes). Number of significant genesets found: 0. Number of genesets displayed: 10
| rank | geneset | description | genes | N_genes | mut_tally | N | n | npat | nsite | nsil | n1 | n2 | n3 | n4 | n5 | n6 | p_ns_s | p | q |
|---|---|---|---|---|---|---|---|---|---|---|---|---|---|---|---|---|---|---|---|
| 1 | HSA00950_ALKALOID_BIOSYNTHESIS_I | Genes involved in alkaloid biosynthesis I | DDC, GOT1, GOT2, TAT, TYR | 5 | DDC(3), GOT1(2), GOT2(3), TAT(1), TYR(1) | 2063429 | 10 | 10 | 10 | 1 | 1 | 0 | 5 | 1 | 3 | 0 | 0.2 | 0.0044 | 1 |
| 2 | HSA00401_NOVOBIOCIN_BIOSYNTHESIS | Genes involved in novobiocin biosynthesis | GOT1, GOT2, TAT | 3 | GOT1(2), GOT2(3), TAT(1) | 1153972 | 6 | 6 | 6 | 1 | 1 | 0 | 3 | 0 | 2 | 0 | 0.42 | 0.013 | 1 |
| 3 | CYSTEINE_METABOLISM | CARS, CTH, GOT1, GOT2, LDHA, LDHB, LDHC, MPST | 8 | CARS(2), CTH(1), GOT1(2), GOT2(3), LDHB(1), LDHC(2), MPST(2) | 3003190 | 13 | 13 | 13 | 2 | 2 | 0 | 4 | 3 | 4 | 0 | 0.33 | 0.017 | 1 | |
| 4 | HSA00272_CYSTEINE_METABOLISM | Genes involved in cysteine metabolism | CARS, CARS2, CDO1, CTH, GOT1, GOT2, LDHA, LDHAL6A, LDHAL6B, LDHB, LDHC, MPST, SDS, SULT1B1, SULT1C2, SULT1C4, SULT4A1 | 17 | CARS(2), CARS2(3), CTH(1), GOT1(2), GOT2(3), LDHAL6B(1), LDHB(1), LDHC(2), MPST(2), SULT1C2(1), SULT4A1(1) | 5521164 | 19 | 19 | 19 | 2 | 2 | 1 | 5 | 5 | 6 | 0 | 0.14 | 0.02 | 1 |
| 5 | HSA00130_UBIQUINONE_BIOSYNTHESIS | Genes involved in ubiquinone biosynthesis | COQ2, COQ3, COQ5, COQ6, COQ7, ND1, ND2, ND3, ND4, ND4L, ND5, ND6, NDUFA12, NDUFA13, NDUFB11 | 8 | COQ5(2), COQ6(1), NDUFA13(3), NDUFB11(1) | 1778759 | 7 | 7 | 7 | 0 | 2 | 0 | 1 | 3 | 1 | 0 | 0.15 | 0.037 | 1 |
| 6 | CYANOAMINO_ACID_METABOLISM | ATP6V0C, SHMT1, GBA3, GGT1, SHMT1, SHMT2 | 5 | GBA3(2), GGT1(1), SHMT1(2), SHMT2(2) | 1851827 | 7 | 7 | 7 | 1 | 0 | 0 | 3 | 1 | 3 | 0 | 0.38 | 0.046 | 1 | |
| 7 | EEA1PATHWAY | The FYVE-finger proteins EEA1 and HRS are localized to endosome membranes and regulate sorting and ubiquitination in the vesicle transport system. | EEA1, EGF, EGFR, HGS, RAB5A, TF, TFRC | 7 | EEA1(5), EGF(3), EGFR(2), HGS(3), TF(1), TFRC(2) | 5644686 | 16 | 16 | 16 | 1 | 2 | 2 | 4 | 5 | 3 | 0 | 0.061 | 0.05 | 1 |
| 8 | CDC42RACPATHWAY | PI3 kinase stimulates cell migration by activating cdc42, which activates ARP2/3, which in turn promotes formation of new actin fibers. | ACTR2, ACTR3, ARHA, ARPC1A, ARPC1B, ARPC2, ARPC3, ARPC4, CDC42, PAK1, PDGFRA, PIK3CA, PIK3R1, RAC1, WASL | 13 | ACTR2(2), ACTR3(1), ARPC2(1), CDC42(2), PAK1(1), PDGFRA(5), PIK3R1(1), WASL(5) | 4914175 | 18 | 18 | 18 | 2 | 0 | 1 | 6 | 11 | 0 | 0 | 0.13 | 0.051 | 1 |
| 9 | UREACYCLEPATHWAY | Ammonia released from amino acid deamination is used to produce carbamoyl phosphate, which is used to convert ornithine to citrulline, from which urea is eventually formed. | ARG1, ASL, ASS, CPS1, GLS, GLUD1, GOT1 | 6 | ARG1(1), CPS1(5), GLS(1), GLUD1(2), GOT1(2) | 3418789 | 11 | 11 | 11 | 1 | 0 | 0 | 6 | 2 | 3 | 0 | 0.16 | 0.052 | 1 |
| 10 | ACETAMINOPHENPATHWAY | Acetaminophen selectively inhibits Cox-3, which is localized to the brain, and yields the toxic metabolite NAPQI when processed by CAR in the liver. | CYP1A2, CYP2E1, CYP3A, NR1I3, PTGS1, PTGS2 | 5 | CYP1A2(2), CYP2E1(2), NR1I3(1), PTGS2(3) | 2332448 | 8 | 8 | 8 | 1 | 1 | 0 | 1 | 5 | 1 | 0 | 0.4 | 0.059 | 1 |
In brief, we tabulate the number of mutations and the number of covered bases for each gene. The counts are broken down by mutation context category: four context categories that are discovered by MutSig, and one for indel and 'null' mutations, which include indels, nonsense mutations, splice-site mutations, and non-stop (read-through) mutations. For each gene, we calculate the probability of seeing the observed constellation of mutations, i.e. the product P1 x P2 x ... x Pm, or a more extreme one, given the background mutation rates calculated across the dataset. [1]
This is an experimental feature. The full results of the analysis summarized in this report can be downloaded from the TCGA Data Coordination Center.