This pipeline uses various statistical tests to identify mRNAs whose expression levels correlated to selected clinical features.
Testing the association between 17814 genes and 4 clinical features across 16 samples, statistically thresholded by Q value < 0.05, 2 clinical features related to at least one genes.
-
2 genes correlated to 'GENDER'.
-
RPS4Y1 , NAP1L3
-
1 gene correlated to 'PATHOLOGY.T'.
-
SHKBP1
-
No genes correlated to 'AGE', and 'TUMOR.STAGE'.
Complete statistical result table is provided in Supplement Table 1
Table 1. Get Full Table This table shows the clinical features, statistical methods used, and the number of genes that are significantly associated with each clinical feature at Q value < 0.05.
| Clinical feature | Statistical test | Significant genes | Associated with | Associated with | ||
|---|---|---|---|---|---|---|
| AGE | Spearman correlation test | N=0 | ||||
| GENDER | t test | N=2 | male | N=1 | female | N=1 |
| PATHOLOGY T | Spearman correlation test | N=1 | higher pT | N=0 | lower pT | N=1 |
| TUMOR STAGE | Spearman correlation test | N=0 |
Table S1. Basic characteristics of clinical feature: 'AGE'
| AGE | Mean (SD) | 57.94 (11) |
| Significant markers | N = 0 |
Table S2. Basic characteristics of clinical feature: 'GENDER'
| GENDER | Labels | N |
| FEMALE | 4 | |
| MALE | 12 | |
| Significant markers | N = 2 | |
| Higher in MALE | 1 | |
| Higher in FEMALE | 1 |
Table S3. Get Full Table List of 2 genes differentially expressed by 'GENDER'
| T(pos if higher in 'MALE') | ttestP | Q | AUC | |
|---|---|---|---|---|
| RPS4Y1 | 8.47 | 7.923e-07 | 0.0141 | 1 |
| NAP1L3 | -8.33 | 1.936e-06 | 0.0345 | 1 |
Figure S1. Get High-res Image As an example, this figure shows the association of RPS4Y1 to 'GENDER'. P value = 7.92e-07 with T-test analysis.
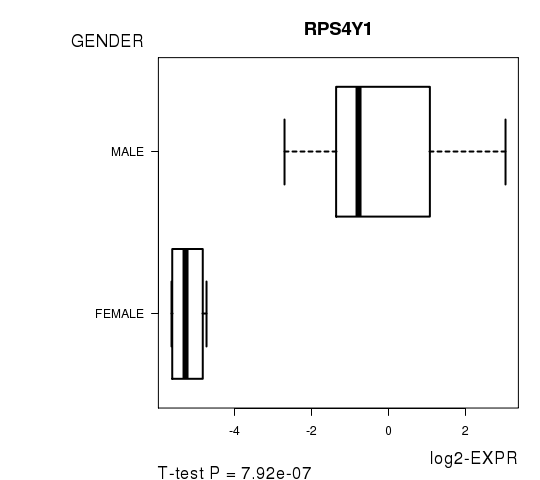
Table S4. Basic characteristics of clinical feature: 'PATHOLOGY.T'
| PATHOLOGY.T | Mean (SD) | 1.69 (0.7) |
| N | ||
| T1 | 7 | |
| T2 | 7 | |
| T3 | 2 | |
| Significant markers | N = 1 | |
| pos. correlated | 0 | |
| neg. correlated | 1 |
Table S5. Get Full Table List of one gene significantly correlated to 'PATHOLOGY.T' by Spearman correlation test
| SpearmanCorr | corrP | Q | |
|---|---|---|---|
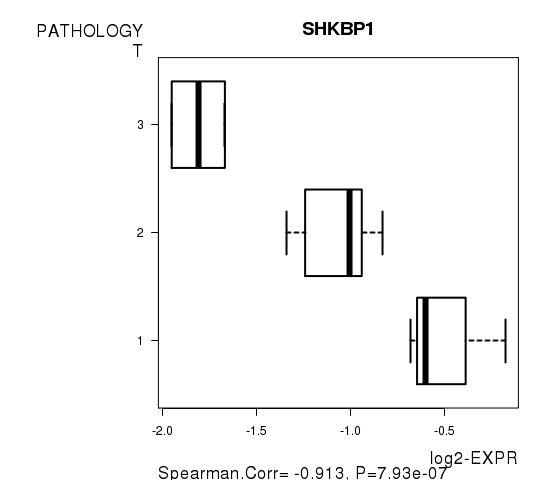
| SHKBP1 | -0.9131 | 7.931e-07 | 0.0141 |
Figure S2. Get High-res Image As an example, this figure shows the association of SHKBP1 to 'PATHOLOGY.T'. P value = 7.93e-07 with Spearman correlation analysis.
-
Expresson data file = KIRP-TP.medianexp.txt
-
Clinical data file = KIRP-TP.clin.merged.picked.txt
-
Number of patients = 16
-
Number of genes = 17814
-
Number of clinical features = 4
For continuous numerical clinical features, Spearman's rank correlation coefficients (Spearman 1904) and two-tailed P values were estimated using 'cor.test' function in R
For two-class clinical features, two-tailed Student's t test with unequal variance (Lehmann and Romano 2005) was applied to compare the log2-expression levels between the two clinical classes using 't.test' function in R
For multiple hypothesis correction, Q value is the False Discovery Rate (FDR) analogue of the P value (Benjamini and Hochberg 1995), defined as the minimum FDR at which the test may be called significant. We used the 'Benjamini and Hochberg' method of 'p.adjust' function in R to convert P values into Q values.
This is an experimental feature. The full results of the analysis summarized in this report can be downloaded from the TCGA Data Coordination Center.