This pipeline computes the correlation between significantly recurrent gene mutations and selected clinical features.
Testing the association between mutation status of 14 genes and 8 clinical features across 98 patients, 2 significant findings detected with Q value < 0.25.
-
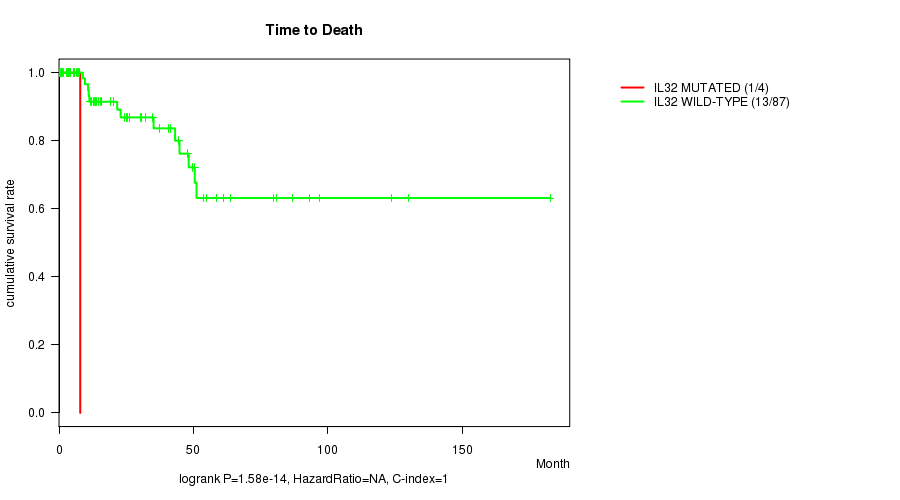
IL32 mutation correlated to 'Time to Death'.
-
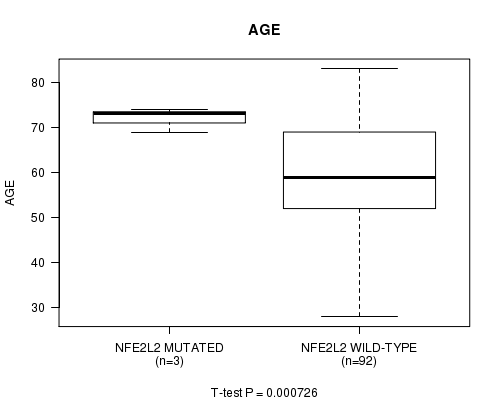
NFE2L2 mutation correlated to 'AGE'.
Table 1. Get Full Table Overview of the association between mutation status of 14 genes and 8 clinical features. Shown in the table are P values (Q values). Thresholded by Q value < 0.25, 2 significant findings detected.
|
Clinical Features |
Time to Death |
AGE | GENDER |
KARNOFSKY PERFORMANCE SCORE |
PATHOLOGY T |
PATHOLOGY N |
PATHOLOGICSPREAD(M) |
TUMOR STAGE |
||
| nMutated (%) | nWild-Type | logrank test | t-test | Fisher's exact test | t-test | Fisher's exact test | Fisher's exact test | Fisher's exact test | Fisher's exact test | |
| IL32 | 4 (4%) | 94 |
1.58e-14 (1.34e-12) |
0.362 (1.00) |
0.304 (1.00) |
0.78 (1.00) |
0.223 (1.00) |
0.676 (1.00) |
||
| NFE2L2 | 3 (3%) | 95 |
0.274 (1.00) |
0.000726 (0.061) |
0.549 (1.00) |
0.36 (1.00) |
0.407 (1.00) |
0.192 (1.00) |
||
| CDC27 | 4 (4%) | 94 |
0.603 (1.00) |
0.778 (1.00) |
0.589 (1.00) |
0.78 (1.00) |
0.128 (1.00) |
0.354 (1.00) |
||
| MET | 7 (7%) | 91 |
0.69 (1.00) |
0.887 (1.00) |
1 (1.00) |
1 (1.00) |
0.806 (1.00) |
0.894 (1.00) |
||
| PCF11 | 7 (7%) | 91 |
0.828 (1.00) |
0.403 (1.00) |
0.426 (1.00) |
0.864 (1.00) |
0.204 (1.00) |
0.584 (1.00) |
1 (1.00) |
|
| SFRS2IP | 5 (5%) | 93 |
0.233 (1.00) |
0.12 (1.00) |
0.65 (1.00) |
0.105 (1.00) |
1 (1.00) |
0.0847 (1.00) |
0.324 (1.00) |
|
| LGI4 | 4 (4%) | 94 |
0.189 (1.00) |
0.905 (1.00) |
0.304 (1.00) |
0.78 (1.00) |
0.703 (1.00) |
0.676 (1.00) |
||
| NF2 | 5 (5%) | 93 |
0.603 (1.00) |
0.299 (1.00) |
1 (1.00) |
0.404 (1.00) |
0.0317 (1.00) |
0.0911 (1.00) |
||
| PARD6B | 4 (4%) | 94 |
0.419 (1.00) |
0.74 (1.00) |
0.304 (1.00) |
0.173 (1.00) |
1 (1.00) |
0.571 (1.00) |
||
| BAT2L2 | 4 (4%) | 94 |
0.313 (1.00) |
0.927 (1.00) |
1 (1.00) |
0.78 (1.00) |
0.624 (1.00) |
0.354 (1.00) |
||
| CD86 | 3 (3%) | 95 |
0.743 (1.00) |
0.545 (1.00) |
0.234 (1.00) |
1 (1.00) |
1 (1.00) |
|||
| POTEH | 3 (3%) | 95 |
0.489 (1.00) |
0.818 (1.00) |
0.549 (1.00) |
0.523 (1.00) |
0.624 (1.00) |
0.745 (1.00) |
||
| SAV1 | 3 (3%) | 95 |
0.69 (1.00) |
0.717 (1.00) |
0.234 (1.00) |
0.699 (1.00) |
1 (1.00) |
0.354 (1.00) |
||
| FLJ46321 | 6 (6%) | 92 |
0.505 (1.00) |
0.318 (1.00) |
1 (1.00) |
0.0977 (1.00) |
0.338 (1.00) |
0.162 (1.00) |
P value = 1.58e-14 (logrank test), Q value = 1.3e-12
Table S1. Gene #2: 'IL32 MUTATION STATUS' versus Clinical Feature #1: 'Time to Death'
| nPatients | nDeath | Duration Range (Median), Month | |
|---|---|---|---|
| ALL | 91 | 14 | 0.0 - 182.7 (14.1) |
| IL32 MUTATED | 4 | 1 | 3.6 - 7.9 (4.8) |
| IL32 WILD-TYPE | 87 | 13 | 0.0 - 182.7 (15.5) |
Figure S1. Get High-res Image Gene #2: 'IL32 MUTATION STATUS' versus Clinical Feature #1: 'Time to Death'
P value = 0.000726 (t-test), Q value = 0.061
Table S2. Gene #9: 'NFE2L2 MUTATION STATUS' versus Clinical Feature #2: 'AGE'
| nPatients | Mean (Std.Dev) | |
|---|---|---|
| ALL | 95 | 59.6 (12.5) |
| NFE2L2 MUTATED | 3 | 72.0 (2.6) |
| NFE2L2 WILD-TYPE | 92 | 59.2 (12.5) |
Figure S2. Get High-res Image Gene #9: 'NFE2L2 MUTATION STATUS' versus Clinical Feature #2: 'AGE'
-
Mutation data file = KIRP-TP.mutsig.cluster.txt
-
Clinical data file = KIRP-TP.clin.merged.picked.txt
-
Number of patients = 98
-
Number of significantly mutated genes = 14
-
Number of selected clinical features = 8
-
Exclude genes that fewer than K tumors have mutations, K = 3
For survival clinical features, the Kaplan-Meier survival curves of tumors with and without gene mutations were plotted and the statistical significance P values were estimated by logrank test (Bland and Altman 2004) using the 'survdiff' function in R
For continuous numerical clinical features, two-tailed Student's t test with unequal variance (Lehmann and Romano 2005) was applied to compare the clinical values between tumors with and without gene mutations using 't.test' function in R
For binary or multi-class clinical features (nominal or ordinal), two-tailed Fisher's exact tests (Fisher 1922) were used to estimate the P values using the 'fisher.test' function in R
For multiple hypothesis correction, Q value is the False Discovery Rate (FDR) analogue of the P value (Benjamini and Hochberg 1995), defined as the minimum FDR at which the test may be called significant. We used the 'Benjamini and Hochberg' method of 'p.adjust' function in R to convert P values into Q values.
This is an experimental feature. The full results of the analysis summarized in this report can be downloaded from the TCGA Data Coordination Center.