This report serves to describe the mutational landscape and properties of a given individual set, as well as rank genes and genesets according to mutational significance. MutSig v2.0 was used to generate the results found in this report.
-
Working with individual set: KIRP-TP
-
Number of patients in set: 100
The input for this pipeline is a set of individuals with the following files associated for each:
-
An annotated .maf file describing the mutations called for the respective individual, and their properties.
-
A .wig file that contains information about the coverage of the sample.
-
MAF used for this analysis:KIRP-TP.final_analysis_set.maf
-
Significantly mutated genes (q ≤ 0.1): 11
-
Mutations seen in COSMIC: 39
-
Significantly mutated genes in COSMIC territory: 3
-
Genes with clustered mutations (≤ 3 aa apart): 27
-
Significantly mutated genesets: 0
-
Significantly mutated genesets: (excluding sig. mutated genes):0
-
Read 100 MAFs of type "Broad"
-
Total number of mutations in input MAFs: 9057
-
After removing 42 mutations outside chr1-24: 9015
-
After removing 318 blacklisted mutations: 8697
-
After removing 225 noncoding mutations: 8472
-
After collapsing adjacent/redundant mutations: 7279
-
Number of mutations before filtering: 7279
-
After removing 111 mutations outside gene set: 7168
-
After removing 51 mutations outside category set: 7117
Table 1. Get Full Table Table representing breakdown of mutations by type.
| type | count |
|---|---|
| Frame_Shift_Del | 434 |
| Frame_Shift_Ins | 164 |
| In_Frame_Del | 104 |
| In_Frame_Ins | 25 |
| Missense_Mutation | 4410 |
| Nonsense_Mutation | 246 |
| Nonstop_Mutation | 4 |
| Silent | 1556 |
| Splice_Site | 163 |
| Translation_Start_Site | 11 |
| Total | 7117 |
Table 2. Get Full Table A breakdown of mutation rates per category discovered for this individual set.
| category | n | N | rate | rate_per_mb | relative_rate | exp_ns_s_ratio |
|---|---|---|---|---|---|---|
| *CpG->T | 473 | 166314389 | 2.8e-06 | 2.8 | 1.5 | 2.1 |
| *Cp(A/C/T)->T | 836 | 1347410459 | 6.2e-07 | 0.62 | 0.33 | 1.7 |
| A->G | 784 | 1448486319 | 5.4e-07 | 0.54 | 0.29 | 2.3 |
| transver | 2316 | 2962211167 | 7.8e-07 | 0.78 | 0.42 | 5 |
| indel+null | 1148 | 2962211167 | 3.9e-07 | 0.39 | 0.21 | NaN |
| double_null | 4 | 2962211167 | 1.4e-09 | 0.0014 | 0.00072 | NaN |
| Total | 5561 | 2962211167 | 1.9e-06 | 1.9 | 1 | 3.5 |
The x axis represents the samples. The y axis represents the exons, one row per exon, and they are sorted by average coverage across samples. For exons with exactly the same average coverage, they are sorted next by the %GC of the exon. (The secondary sort is especially useful for the zero-coverage exons at the bottom).
Figure 1.
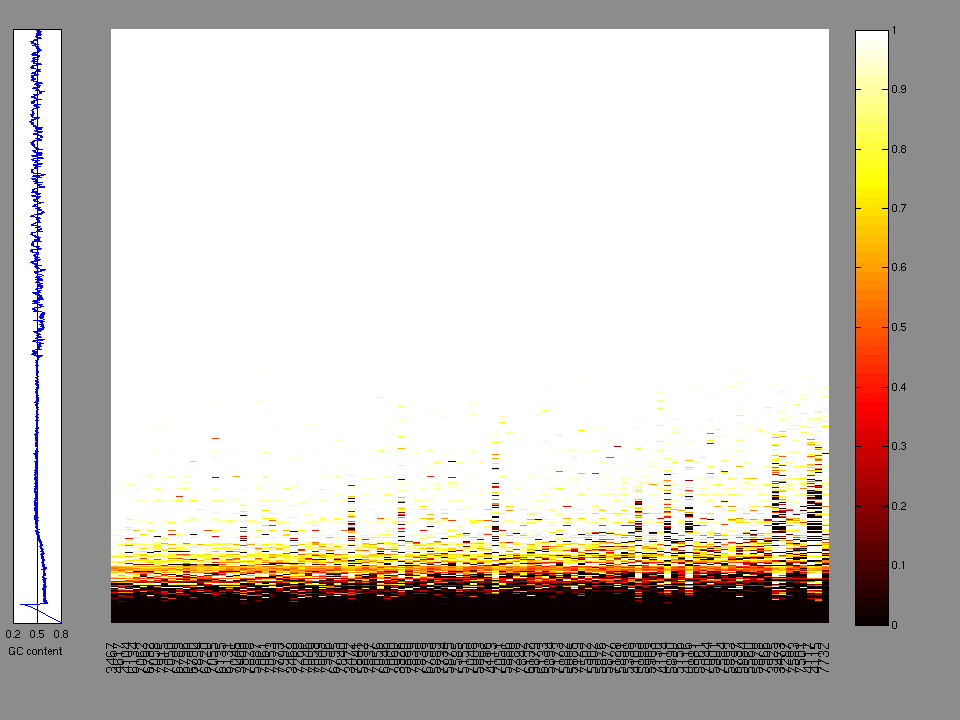
Figure 2. Patients counts and rates file used to generate this plot: KIRP-TP.patients.counts_and_rates.txt
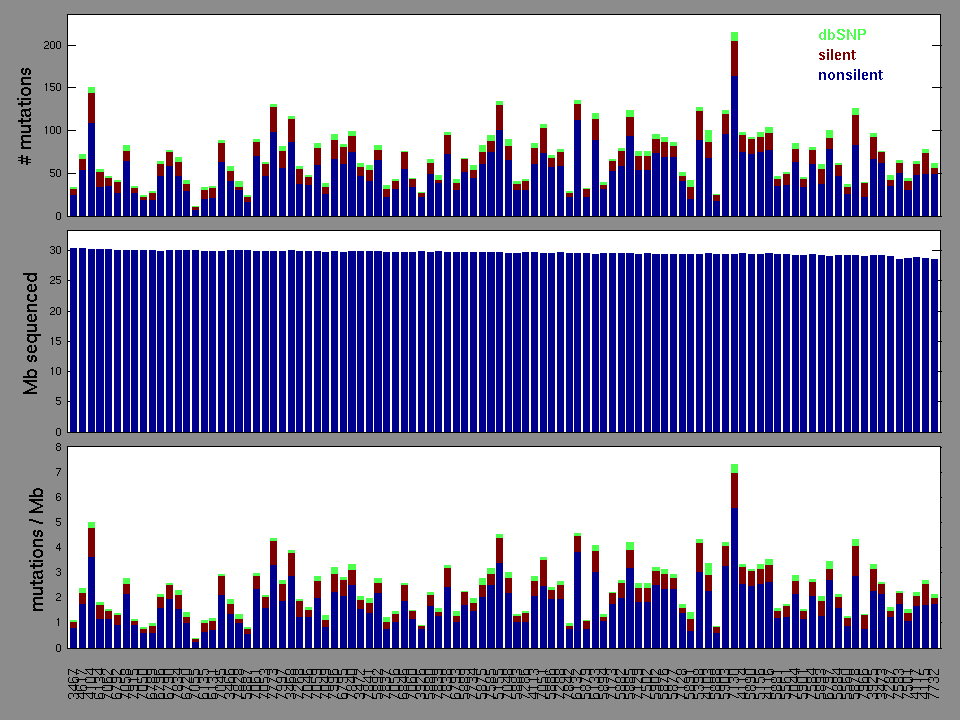
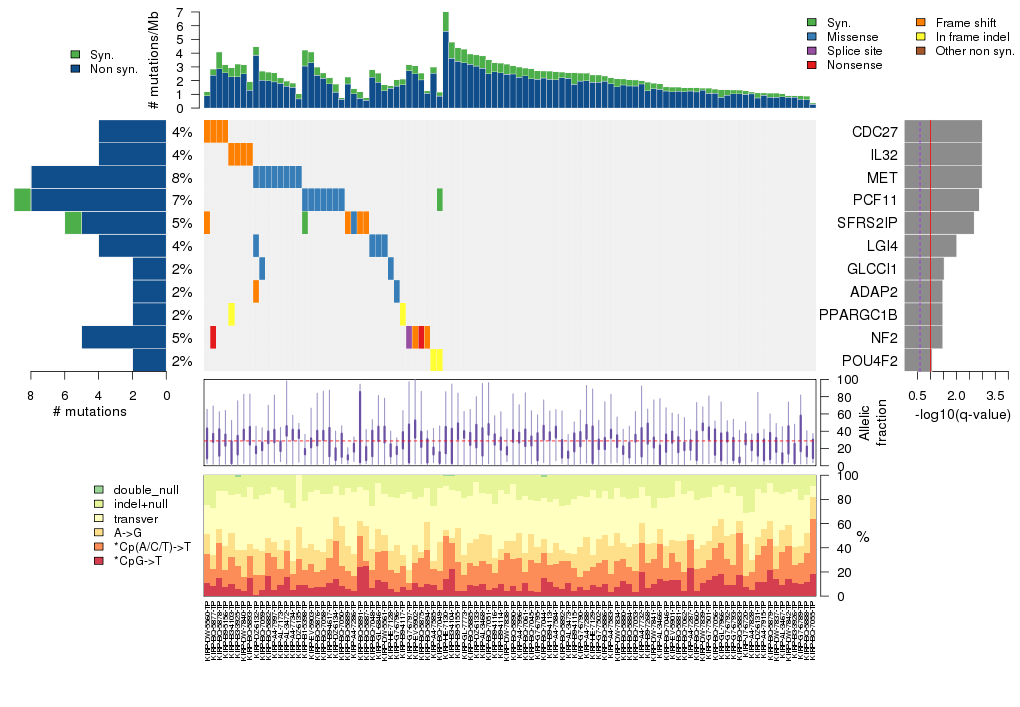
Figure 3. Get High-res Image The matrix in the center of the figure represents individual mutations in patient samples, color-coded by type of mutation, for the significantly mutated genes. The rate of synonymous and non-synonymous mutations is displayed at the top of the matrix. The barplot on the left of the matrix shows the number of mutations in each gene. The percentages represent the fraction of tumors with at least one mutation in the specified gene. The barplot to the right of the matrix displays the q-values for the most significantly mutated genes. The purple boxplots below the matrix (only displayed if required columns are present in the provided MAF) represent the distributions of allelic fractions observed in each sample. The plot at the bottom represents the base substitution distribution of individual samples, using the same categories that were used to calculate significance.
Column Descriptions:
-
N = number of sequenced bases in this gene across the individual set
-
n = number of (nonsilent) mutations in this gene across the individual set
-
npat = number of patients (individuals) with at least one nonsilent mutation
-
nsite = number of unique sites having a non-silent mutation
-
nsil = number of silent mutations in this gene across the individual set
-
n1 = number of nonsilent mutations of type: *CpG->T
-
n2 = number of nonsilent mutations of type: *Cp(A/C/T)->T
-
n3 = number of nonsilent mutations of type: A->G
-
n4 = number of nonsilent mutations of type: transver
-
n5 = number of nonsilent mutations of type: indel+null
-
n6 = number of nonsilent mutations of type: double_null
-
p_classic = p-value for the observed amount of nonsilent mutations being elevated in this gene
-
p_ns_s = p-value for the observed nonsilent/silent ratio being elevated in this gene
-
p_ks = p-value for clustering of mutations (Kolmogorov-Smirnoff test)
-
p_cons = p-value for enrichment of mutations at evolutionarily most-conserved sites in gene
-
p_joint = p-value for clustering + conservation
-
p = p-value (overall)
-
q = q-value, False Discovery Rate (Benjamini-Hochberg procedure)
Table 3. Get Full Table A Ranked List of Significantly Mutated Genes. Number of significant genes found: 11. Number of genes displayed: 35. Click on a gene name to display its stick figure depicting the distribution of mutations and mutation types across the chosen gene (this feature may not be available for all significant genes).
| rank | gene | description | N | n | npat | nsite | nsil | n1 | n2 | n3 | n4 | n5 | n6 | p_classic | p_ns_s | p_ks | p_cons | p_joint | p | q |
|---|---|---|---|---|---|---|---|---|---|---|---|---|---|---|---|---|---|---|---|---|
| 1 | CDC27 | cell division cycle 27 homolog (S. cerevisiae) | 250946 | 4 | 4 | 1 | 0 | 0 | 0 | 0 | 0 | 4 | 0 | 0.00054 | 1 | 2e-07 | 0.067 | 0 | <1.00e-15 | <1.81e-11 |
| 2 | IL32 | interleukin 32 | 55560 | 4 | 4 | 2 | 0 | 0 | 0 | 0 | 0 | 4 | 0 | 1.5e-06 | 1 | 5.8e-06 | 0.9 | 0.000041 | 1.46e-09 | 1.32e-05 |
| 3 | MET | met proto-oncogene (hepatocyte growth factor receptor) | 427226 | 8 | 8 | 7 | 0 | 0 | 3 | 2 | 3 | 0 | 0 | 3.3e-07 | 0.078 | 0.0017 | 0.0021 | 0.00034 | 2.63e-09 | 1.59e-05 |
| 4 | PCF11 | PCF11, cleavage and polyadenylation factor subunit, homolog (S. cerevisiae) | 425608 | 8 | 7 | 7 | 1 | 0 | 1 | 4 | 3 | 0 | 0 | 6.7e-06 | 0.16 | 0.00015 | 0.82 | 0.00047 | 6.56e-08 | 0.000297 |
| 5 | SFRS2IP | splicing factor, arginine/serine-rich 2, interacting protein | 442110 | 5 | 5 | 2 | 1 | 0 | 0 | 0 | 1 | 4 | 0 | 0.00014 | 0.98 | 0.00067 | 0.0006 | 0.00011 | 2.91e-07 | 0.00105 |
| 6 | LGI4 | leucine-rich repeat LGI family, member 4 | 70745 | 4 | 4 | 4 | 0 | 0 | 1 | 1 | 2 | 0 | 0 | 7.1e-06 | 0.28 | 0.27 | 0.013 | 0.025 | 2.92e-06 | 0.00883 |
| 7 | GLCCI1 | glucocorticoid induced transcript 1 | 124058 | 2 | 2 | 1 | 0 | 0 | 0 | 0 | 2 | 0 | 0 | 0.02 | 0.68 | 0.00079 | 0.002 | 0.000037 | 1.10e-05 | 0.0286 |
| 8 | ADAP2 | ArfGAP with dual PH domains 2 | 109161 | 2 | 2 | 2 | 0 | 1 | 0 | 0 | 0 | 1 | 0 | 0.0026 | 0.78 | 0.00083 | 0.15 | 0.00041 | 1.58e-05 | 0.0327 |
| 9 | PPARGC1B | peroxisome proliferator-activated receptor gamma, coactivator 1 beta | 286546 | 2 | 2 | 1 | 0 | 0 | 0 | 0 | 0 | 2 | 0 | 0.05 | 1 | 0.00032 | 0.0021 | 0.000022 | 1.66e-05 | 0.0327 |
| 10 | NF2 | neurofibromin 2 (merlin) | 162737 | 5 | 5 | 5 | 0 | 0 | 0 | 0 | 0 | 5 | 0 | 4e-06 | 0.43 | 0.21 | 0.74 | 0.31 | 1.81e-05 | 0.0327 |
| 11 | POU4F2 | POU class 4 homeobox 2 | 108054 | 2 | 2 | 1 | 0 | 0 | 0 | 0 | 0 | 2 | 0 | 0.0046 | 1 | 0.00083 | 0.98 | 0.00083 | 5.18e-05 | 0.0853 |
| 12 | OSTalpha | solute carrier family 51, alpha subunit | 101324 | 2 | 2 | 1 | 0 | 0 | 0 | 0 | 0 | 2 | 0 | 0.0017 | 1 | 0.00094 | 0.67 | 0.0037 | 8.23e-05 | 0.124 |
| 13 | ZIC2 | Zic family member 2 (odd-paired homolog, Drosophila) | 90876 | 2 | 2 | 1 | 0 | 0 | 0 | 0 | 0 | 2 | 0 | 0.011 | 1 | 0.00062 | 0.94 | 0.00062 | 9.05e-05 | 0.126 |
| 14 | PARD6B | par-6 partitioning defective 6 homolog beta (C. elegans) | 106100 | 4 | 4 | 4 | 0 | 0 | 0 | 2 | 0 | 2 | 0 | 0.000011 | 0.26 | 0.6 | 0.65 | 0.79 | 0.000107 | 0.138 |
| 15 | ZNF185 | zinc finger protein 185 (LIM domain) | 132034 | 2 | 2 | 1 | 0 | 0 | 0 | 0 | 0 | 2 | 0 | 0.014 | 1 | 0.00043 | 0.7 | 0.00072 | 0.000123 | 0.149 |
| 16 | NFE2L2 | nuclear factor (erythroid-derived 2)-like 2 | 178107 | 3 | 3 | 3 | 0 | 0 | 0 | 1 | 2 | 0 | 0 | 0.0028 | 0.46 | 0.02 | 0.0079 | 0.0041 | 0.000141 | 0.154 |
| 17 | LRRIQ3 | leucine-rich repeats and IQ motif containing 3 | 179753 | 2 | 2 | 1 | 0 | 0 | 0 | 0 | 0 | 2 | 0 | 0.019 | 1 | 0.00052 | 0.65 | 0.0006 | 0.000144 | 0.154 |
| 18 | TMEM131 | transmembrane protein 131 | 498564 | 2 | 2 | 1 | 0 | 0 | 0 | 0 | 0 | 2 | 0 | 0.076 | 1 | 0.00018 | 0.96 | 0.00018 | 0.000168 | 0.169 |
| 19 | BAT2L2 | 640972 | 4 | 4 | 4 | 0 | 0 | 2 | 1 | 0 | 1 | 0 | 0.011 | 0.27 | 0.022 | 0.0085 | 0.0014 | 0.000185 | 0.174 | |
| 20 | CD86 | CD86 molecule | 101158 | 3 | 3 | 3 | 0 | 1 | 0 | 0 | 1 | 1 | 0 | 0.00012 | 0.6 | 0.31 | 0.09 | 0.14 | 0.000203 | 0.174 |
| 21 | TCF7L2 | transcription factor 7-like 2 (T-cell specific, HMG-box) | 198388 | 2 | 2 | 1 | 0 | 0 | 0 | 0 | 0 | 2 | 0 | 0.04 | 1 | 0.00046 | 0.95 | 0.00046 | 0.000219 | 0.174 |
| 22 | SAV1 | salvador homolog 1 (Drosophila) | 115810 | 3 | 3 | 3 | 0 | 0 | 1 | 0 | 0 | 2 | 0 | 0.0001 | 0.74 | 0.094 | 0.98 | 0.18 | 0.000223 | 0.174 |
| 23 | CD3EAP | CD3e molecule, epsilon associated protein | 151103 | 2 | 2 | 1 | 0 | 0 | 0 | 0 | 0 | 2 | 0 | 0.0092 | 1 | 0.00066 | 0.84 | 0.002 | 0.000223 | 0.174 |
| 24 | COL6A6 | collagen, type VI, alpha 6 | 638129 | 2 | 2 | 2 | 1 | 1 | 1 | 0 | 0 | 0 | 0 | 0.2 | 0.76 | 0.0001 | 0.52 | 0.0001 | 0.000237 | 0.174 |
| 25 | POTEH | POTE ankyrin domain family, member H | 90750 | 3 | 3 | 2 | 0 | 0 | 0 | 0 | 2 | 1 | 0 | 0.00037 | 0.66 | 0.0091 | 0.99 | 0.055 | 0.000242 | 0.174 |
| 26 | CLIP1 | CAP-GLY domain containing linker protein 1 | 434594 | 2 | 2 | 2 | 0 | 0 | 0 | 0 | 0 | 2 | 0 | 0.093 | 1 | 0.00023 | 0.85 | 0.00023 | 0.000250 | 0.174 |
| 27 | PEBP1 | phosphatidylethanolamine binding protein 1 | 43928 | 2 | 2 | 2 | 0 | 0 | 1 | 0 | 1 | 0 | 0 | 0.0026 | 0.49 | 0.0023 | 0.15 | 0.0086 | 0.000261 | 0.175 |
| 28 | IFNA16 | interferon, alpha 16 | 57162 | 2 | 2 | 1 | 0 | 0 | 1 | 0 | 1 | 0 | 0 | 0.0035 | 0.48 | 0.0021 | 0.14 | 0.0073 | 0.000297 | 0.188 |
| 29 | FLJ46321 | family with sequence similarity 75, member D1 | 462549 | 6 | 6 | 6 | 1 | 0 | 0 | 1 | 3 | 2 | 0 | 0.0002 | 0.54 | 0.069 | 0.64 | 0.13 | 0.000307 | 0.188 |
| 30 | GRM1 | glutamate receptor, metabotropic 1 | 365823 | 2 | 2 | 1 | 0 | 0 | 0 | 0 | 0 | 2 | 0 | 0.1 | 1 | 0.00027 | 0.75 | 0.00027 | 0.000312 | 0.188 |
| 31 | KDM6A | lysine (K)-specific demethylase 6A | 393801 | 5 | 5 | 5 | 0 | 0 | 0 | 0 | 0 | 4 | 1 | 0.000074 | 0.52 | 0.33 | 0.46 | 0.41 | 0.000345 | 0.202 |
| 32 | MAOB | monoamine oxidase B | 150112 | 2 | 2 | 2 | 0 | 1 | 0 | 0 | 0 | 1 | 0 | 0.012 | 0.61 | 0.5 | 0.0026 | 0.0029 | 0.000379 | 0.210 |
| 33 | EBF2 | early B-cell factor 2 | 173115 | 3 | 3 | 3 | 1 | 0 | 0 | 0 | 3 | 0 | 0 | 0.0044 | 0.8 | 0.005 | 0.2 | 0.0079 | 0.000394 | 0.210 |
| 34 | BRAF | v-raf murine sarcoma viral oncogene homolog B1 | 222693 | 4 | 4 | 4 | 0 | 0 | 0 | 1 | 3 | 0 | 0 | 0.00065 | 0.36 | 0.04 | 0.36 | 0.054 | 0.000395 | 0.210 |
| 35 | CD300A | CD300a molecule | 90689 | 2 | 2 | 1 | 0 | 0 | 0 | 0 | 0 | 2 | 0 | 0.0071 | 1 | 0.0011 | 1 | 0.0053 | 0.000423 | 0.215 |
Figure S1. This figure depicts the distribution of mutations and mutation types across the CDC27 significant gene.
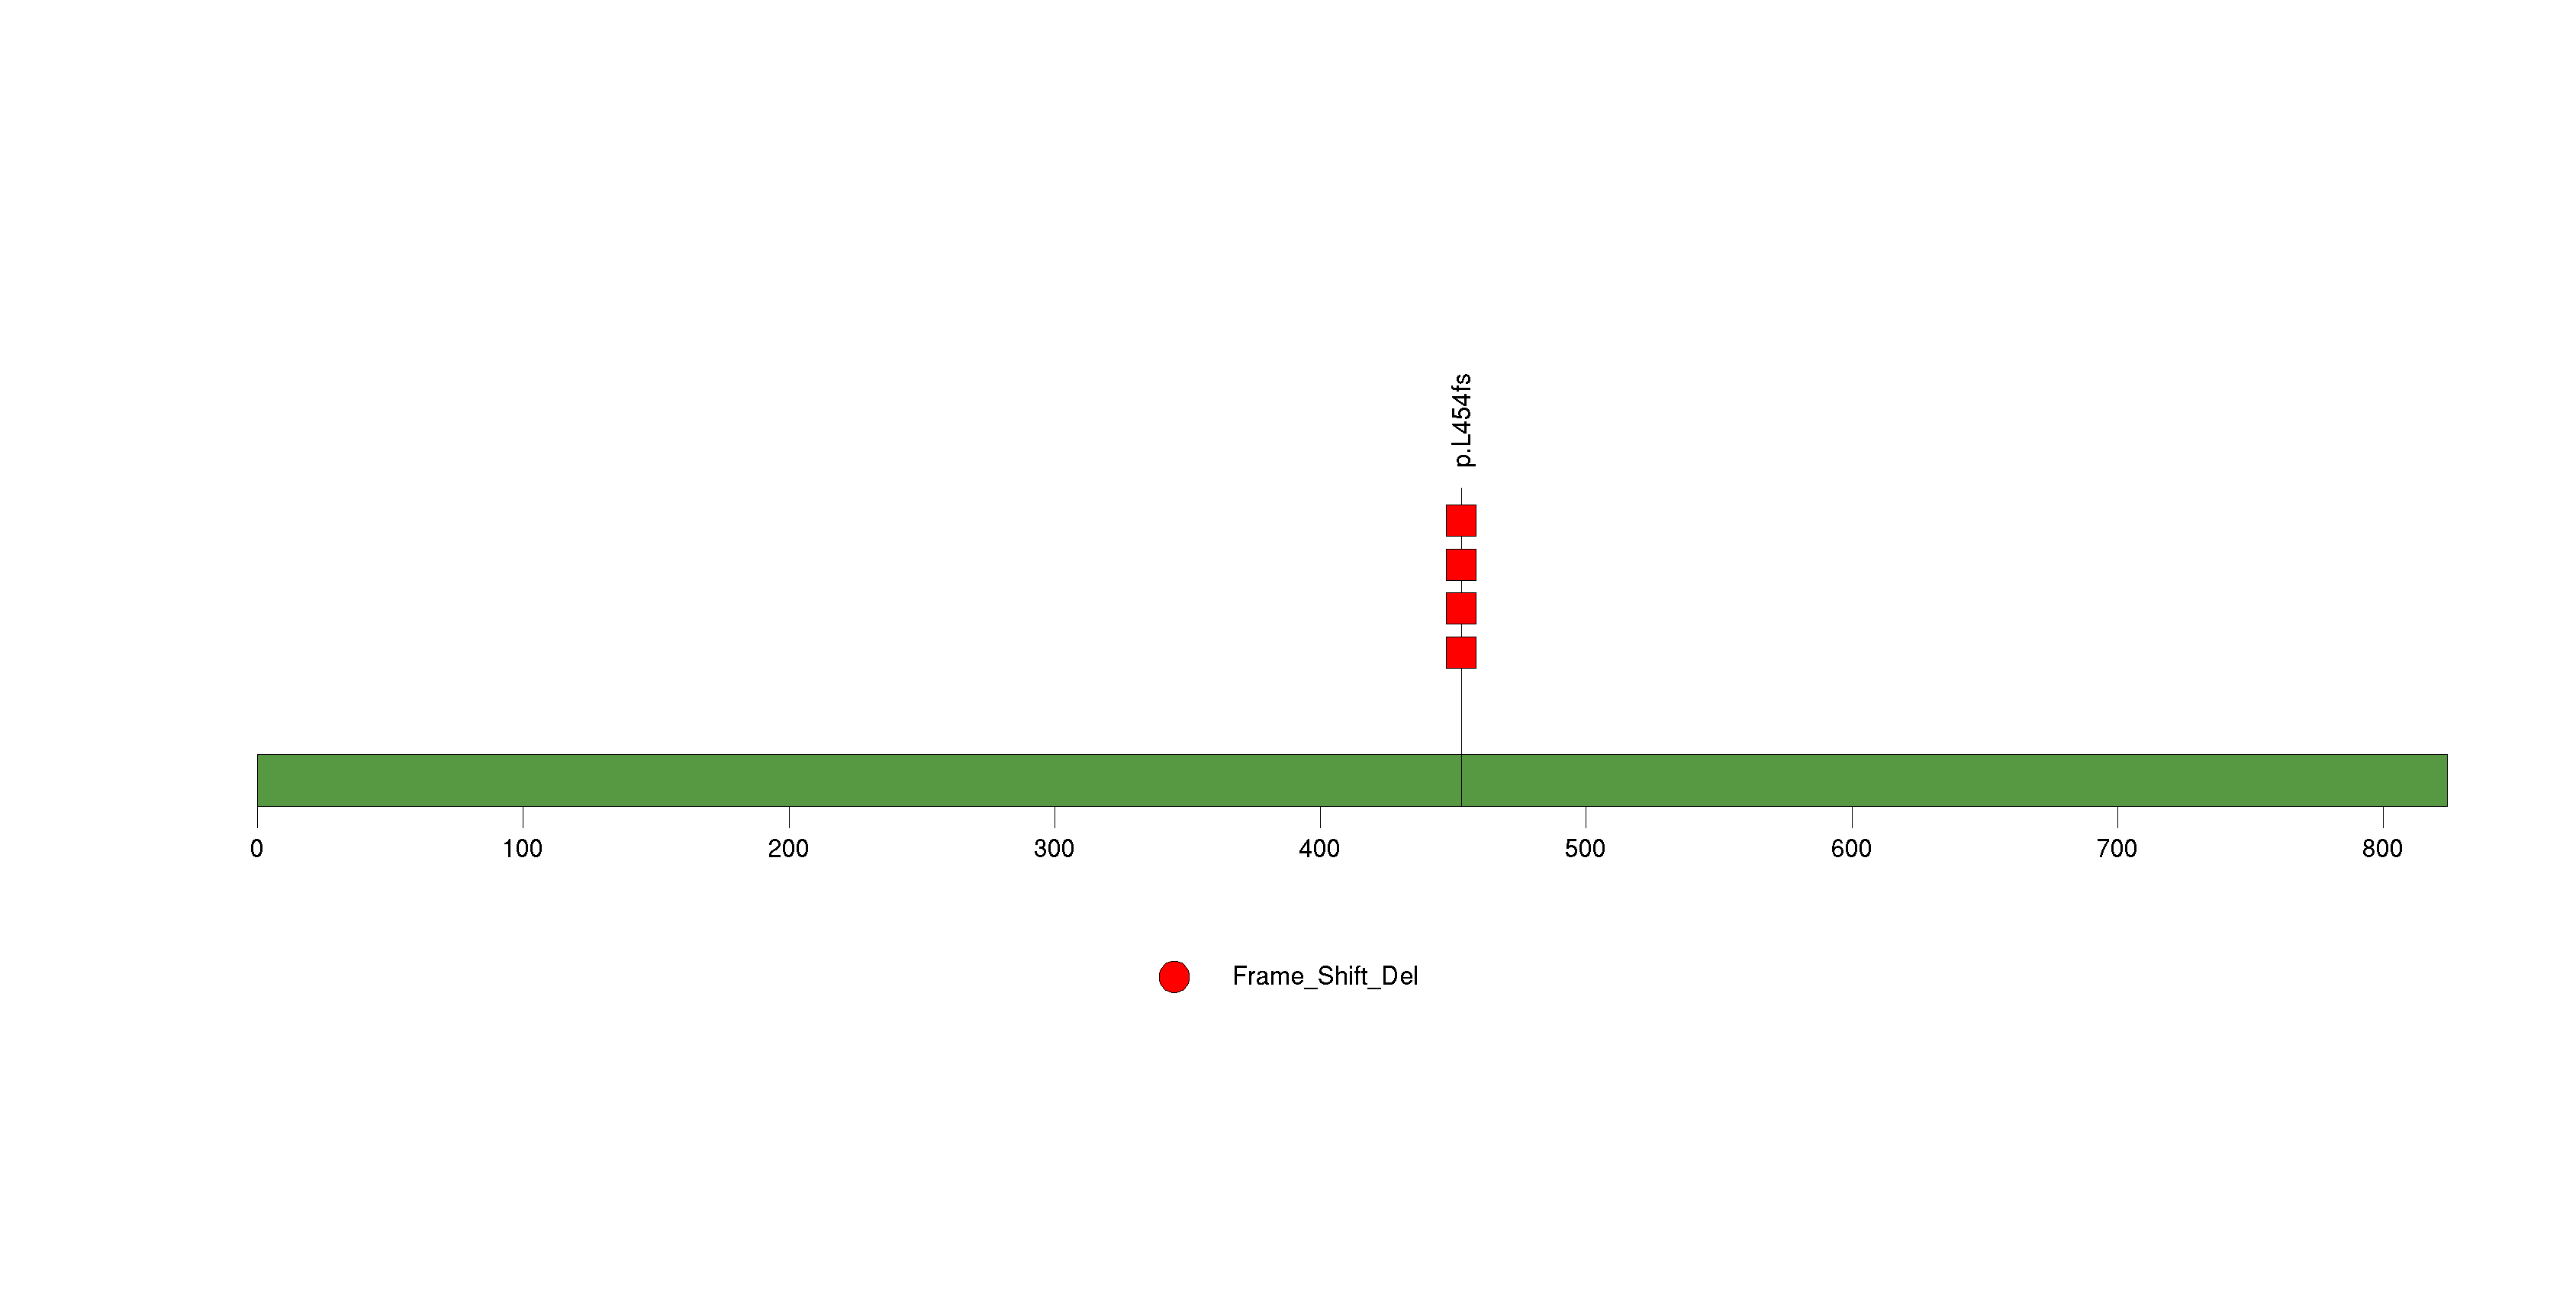
Figure S2. This figure depicts the distribution of mutations and mutation types across the IL32 significant gene.
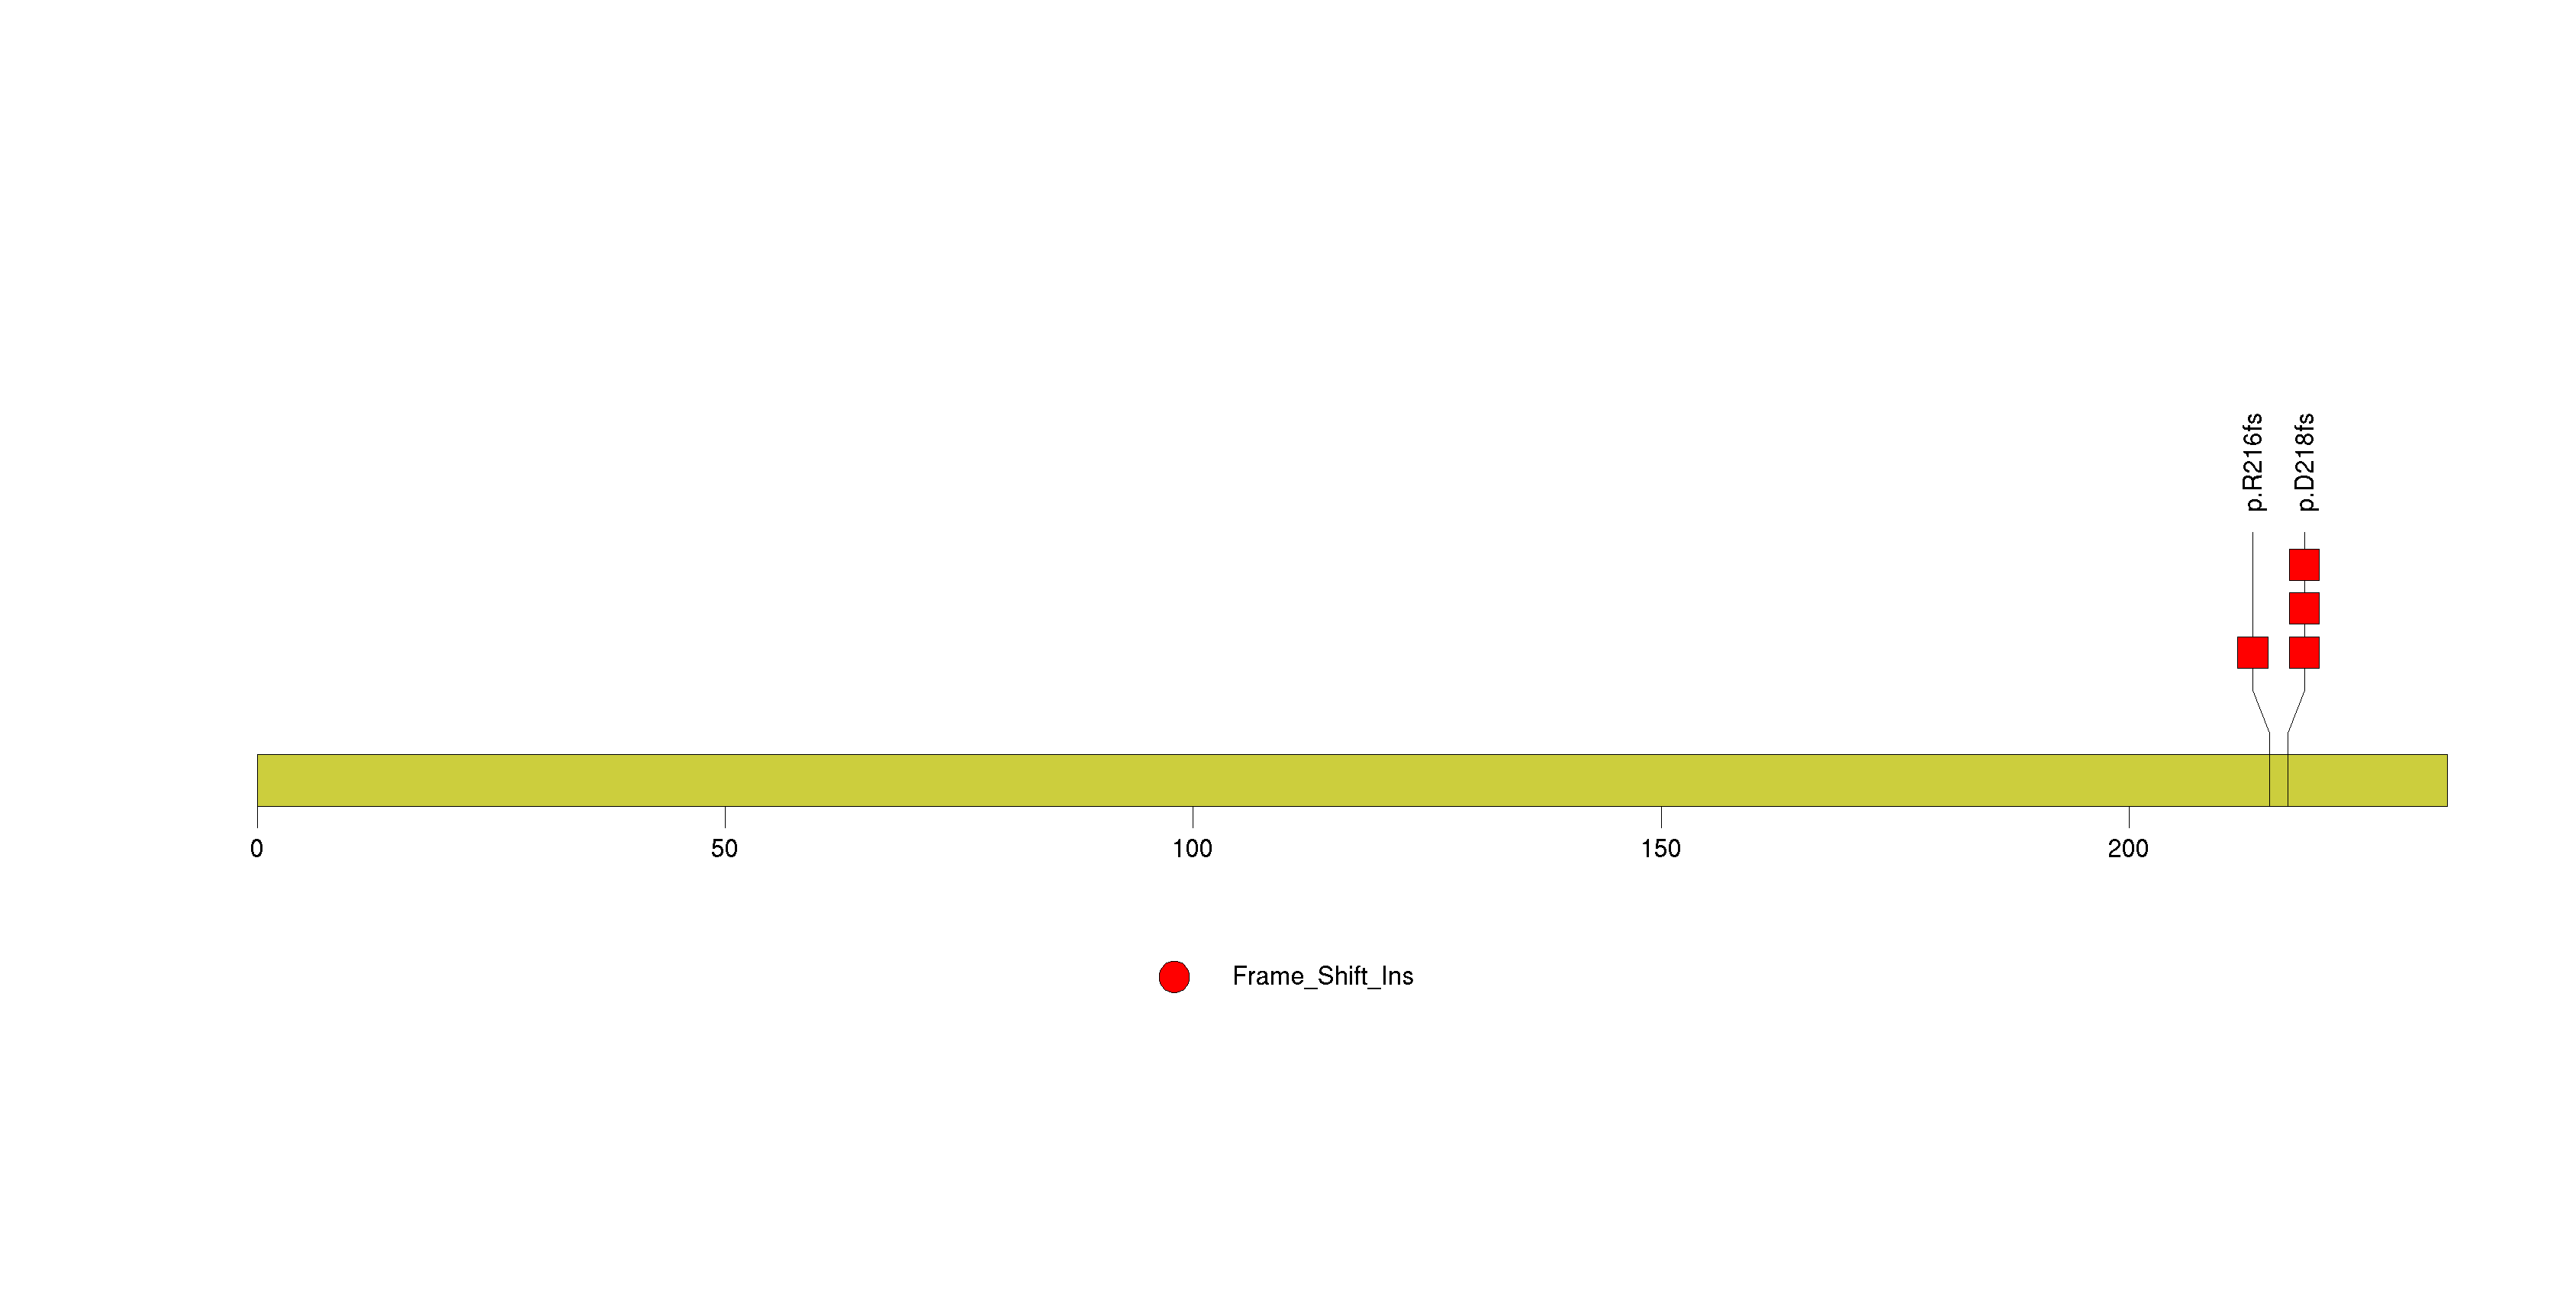
Figure S3. This figure depicts the distribution of mutations and mutation types across the MET significant gene.
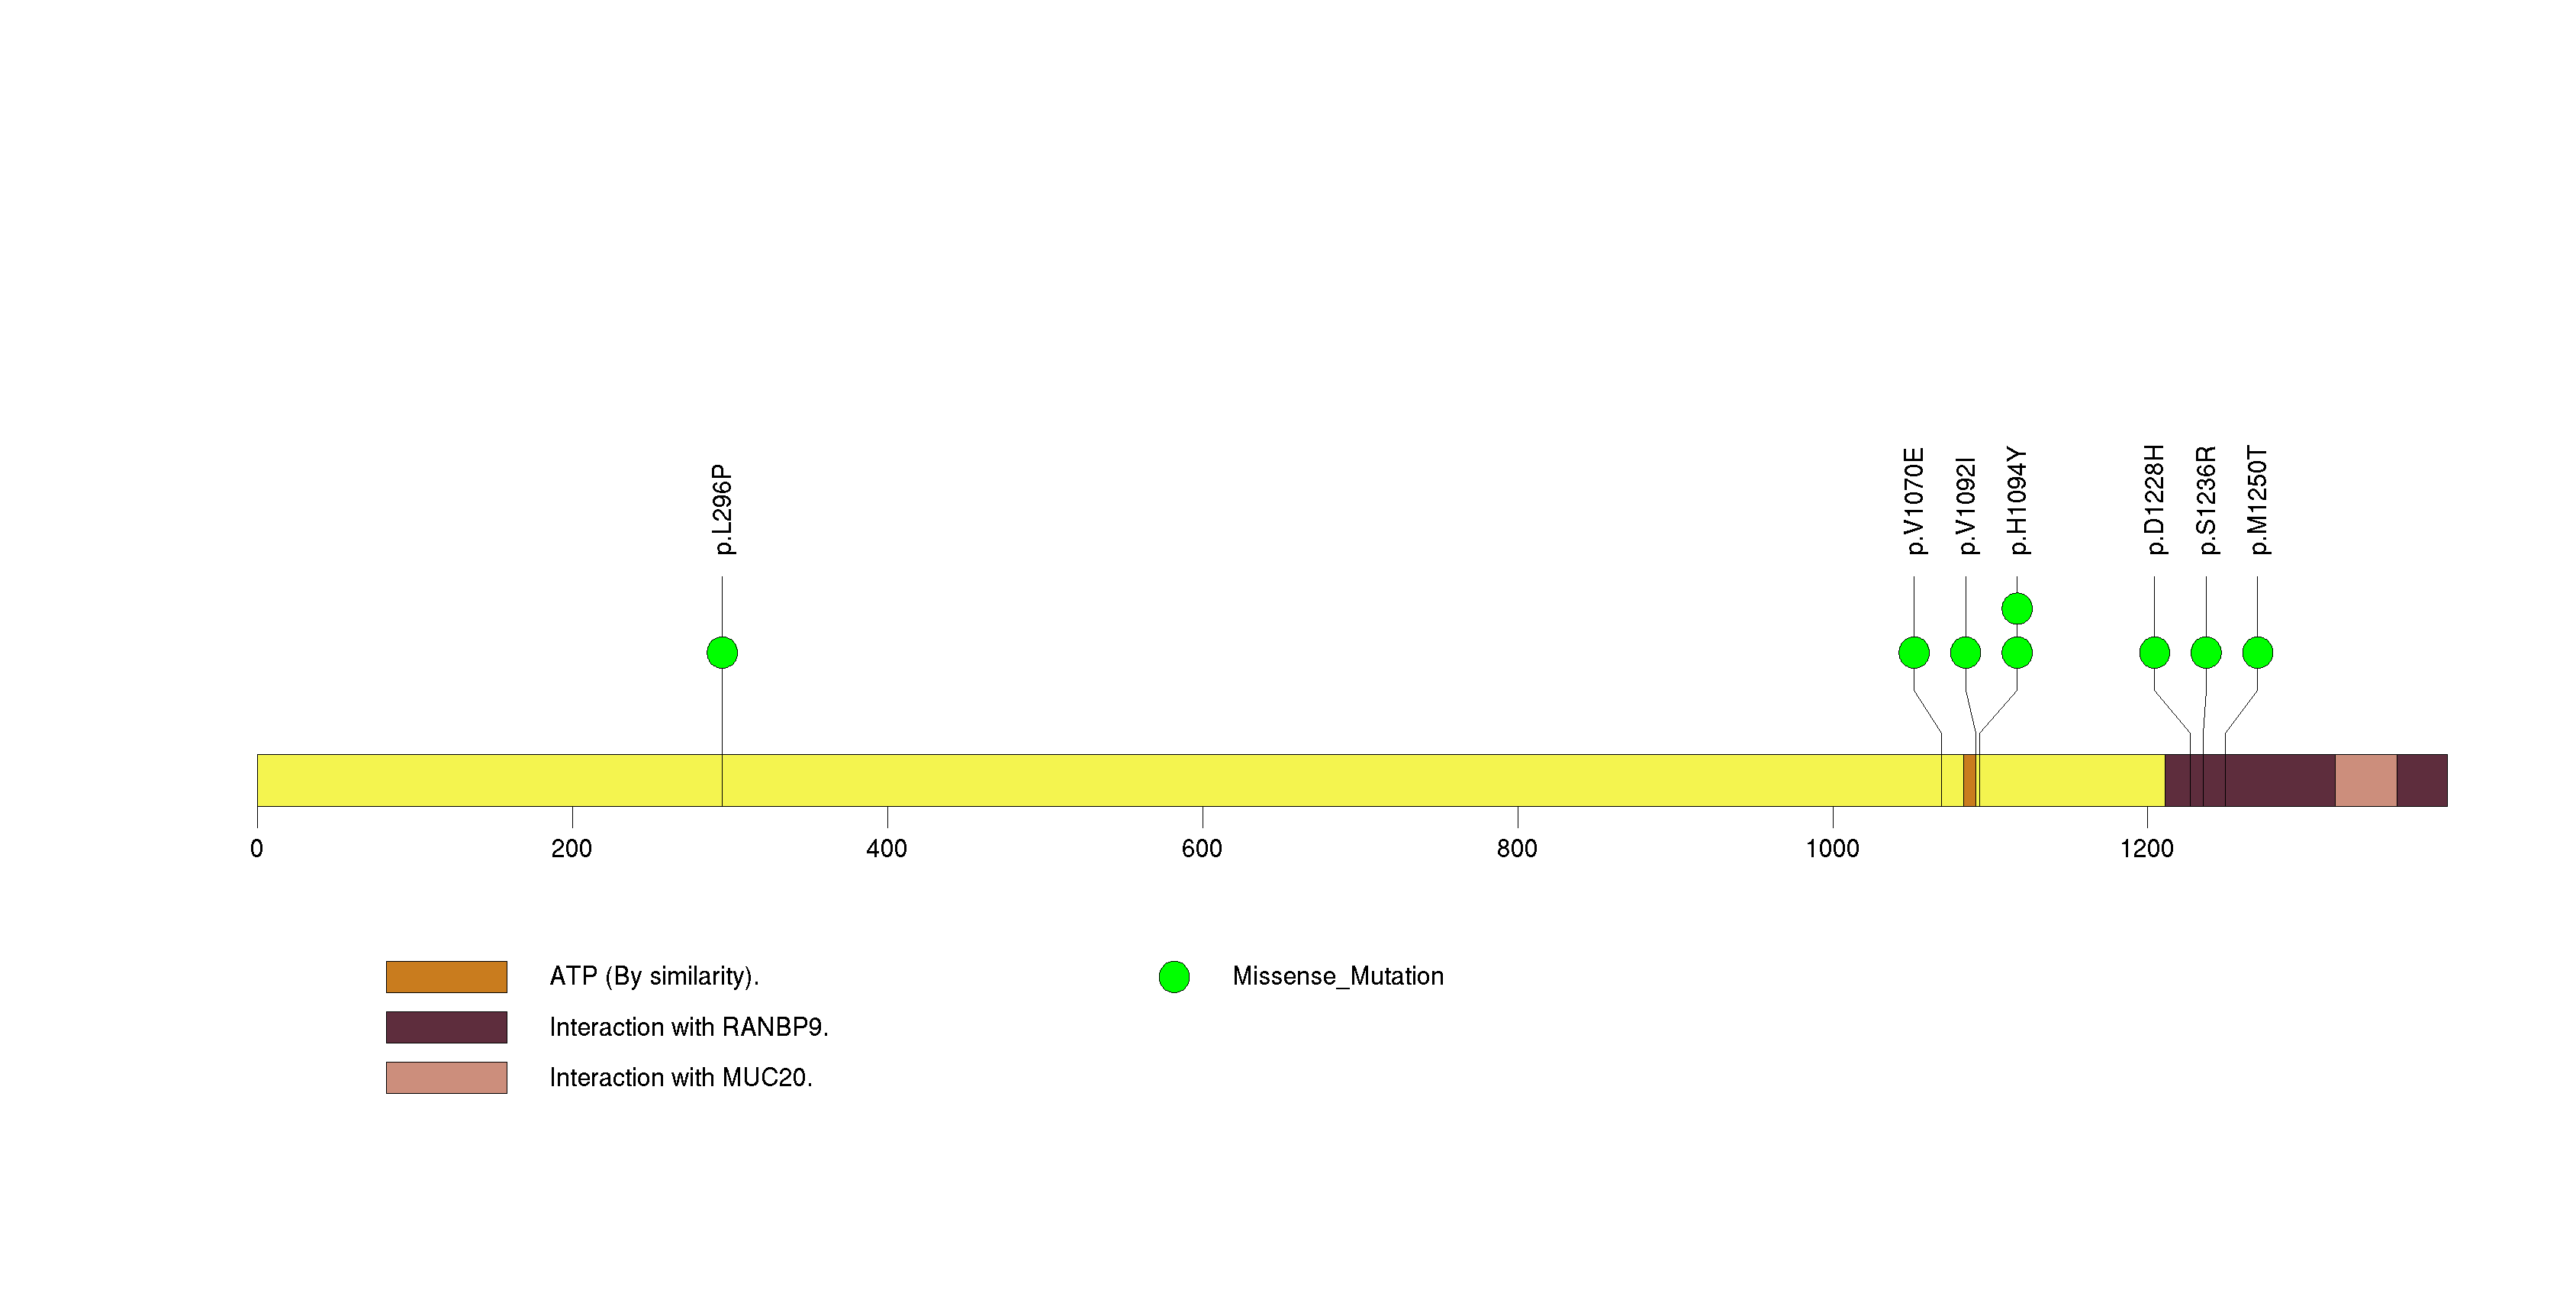
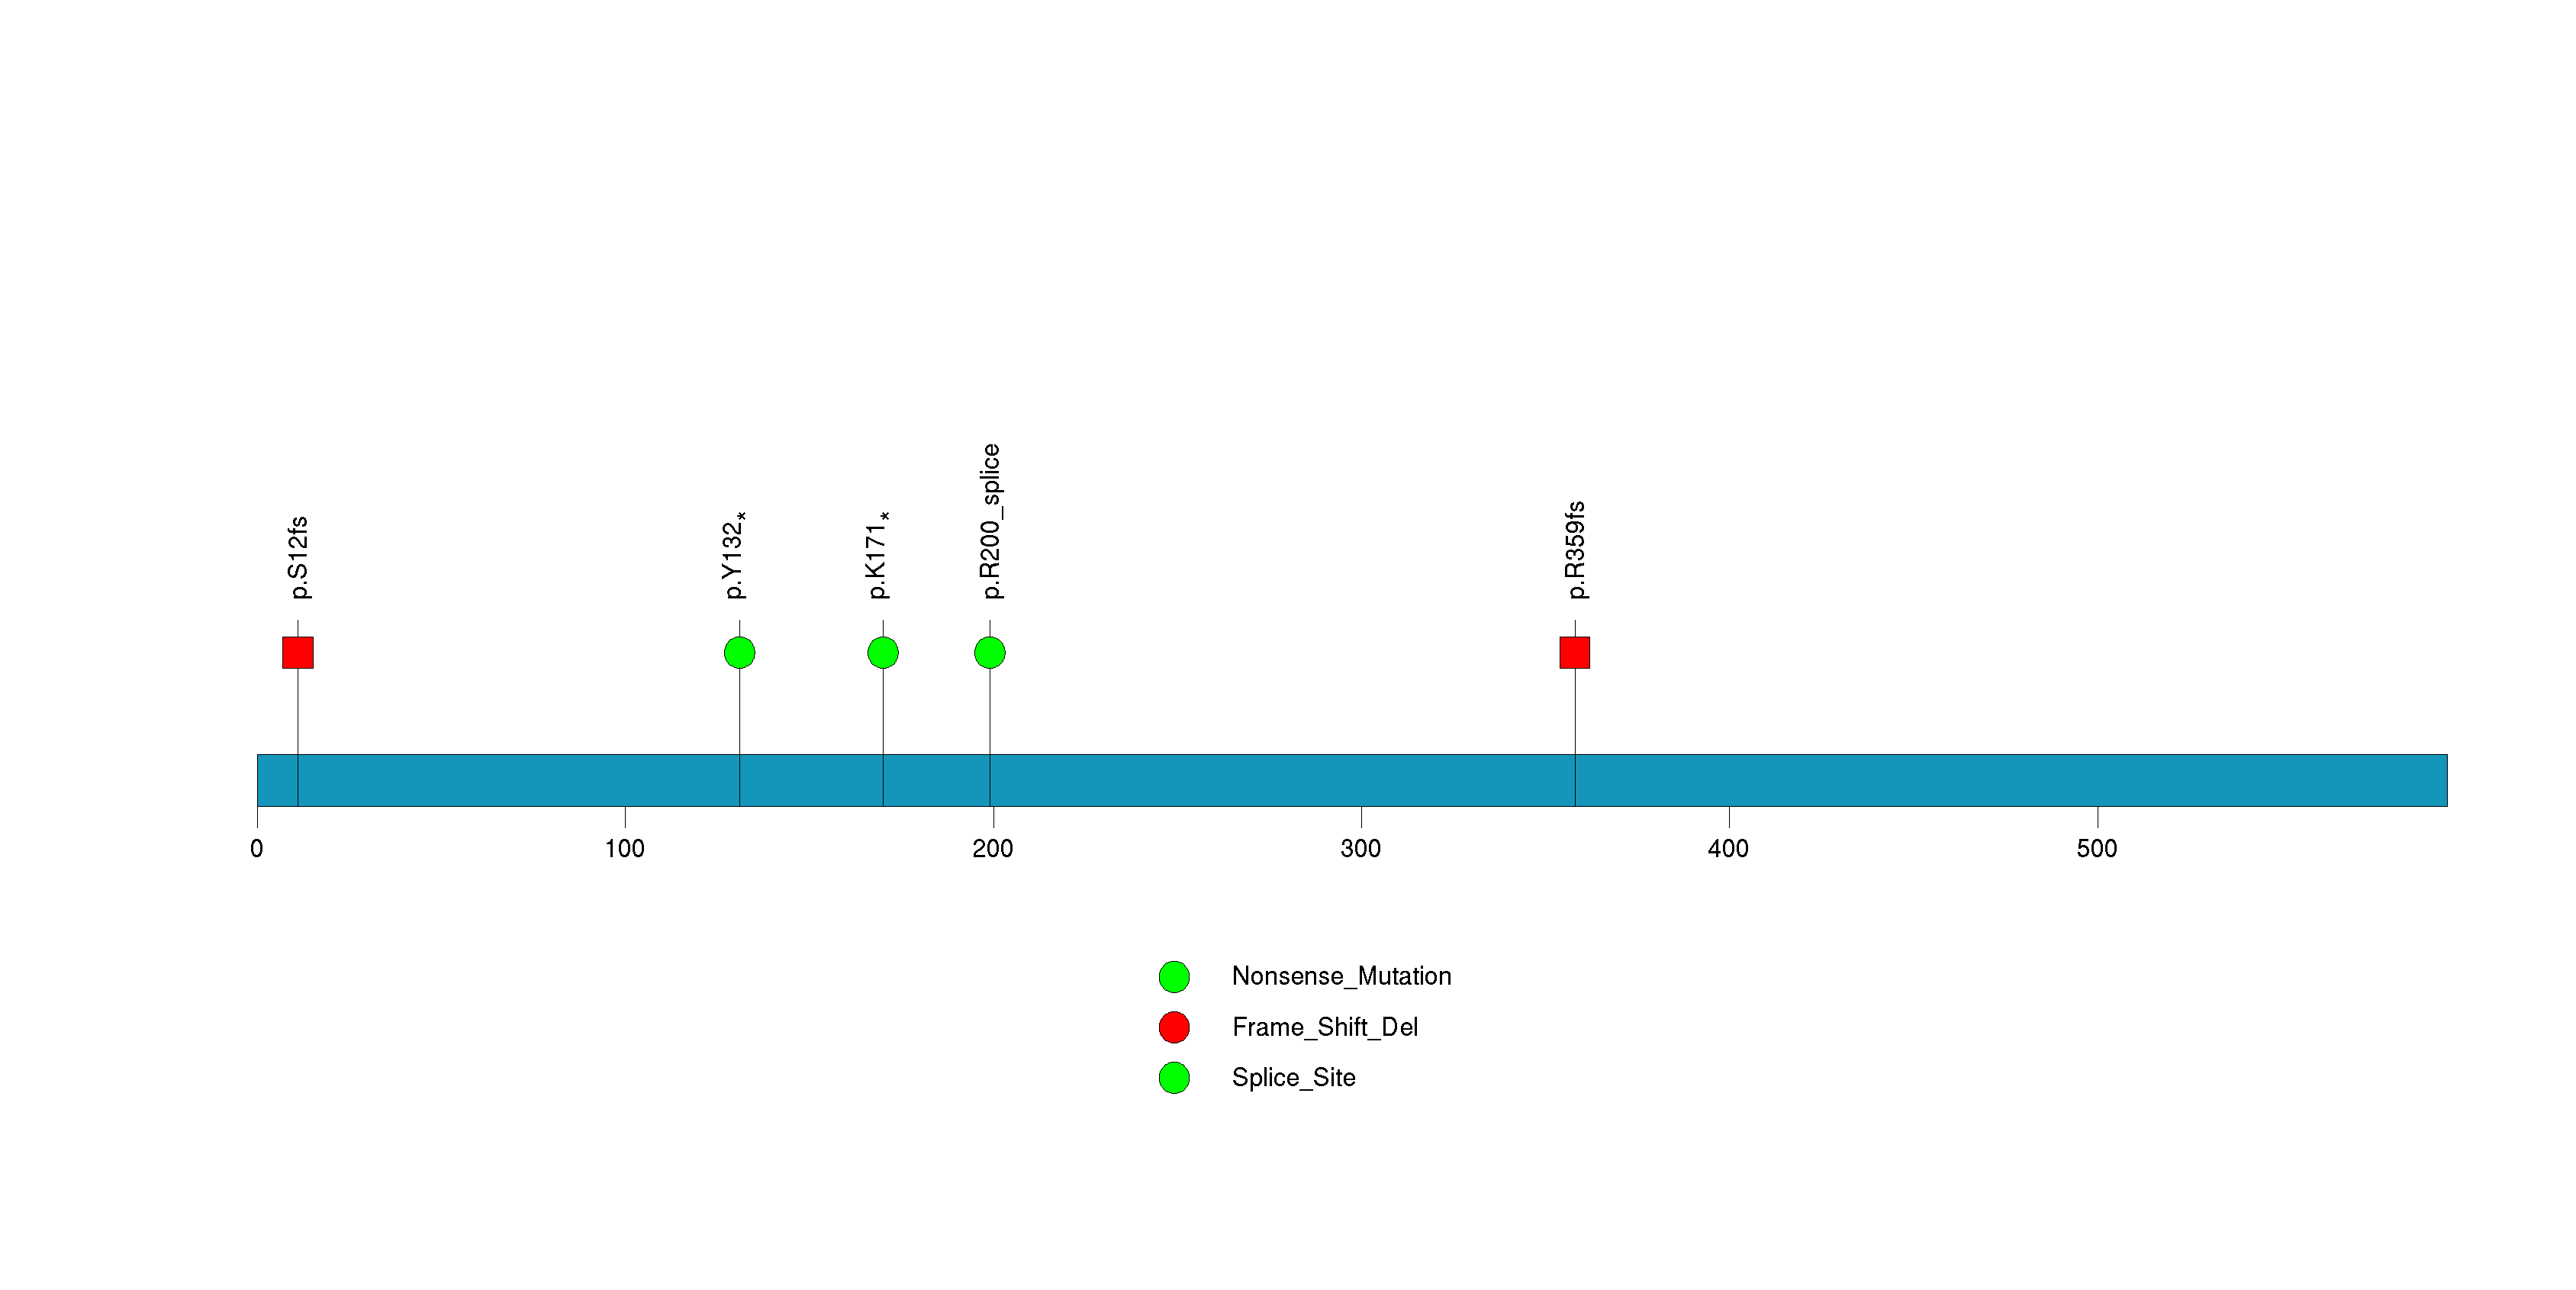
Figure S4. This figure depicts the distribution of mutations and mutation types across the PCF11 significant gene.
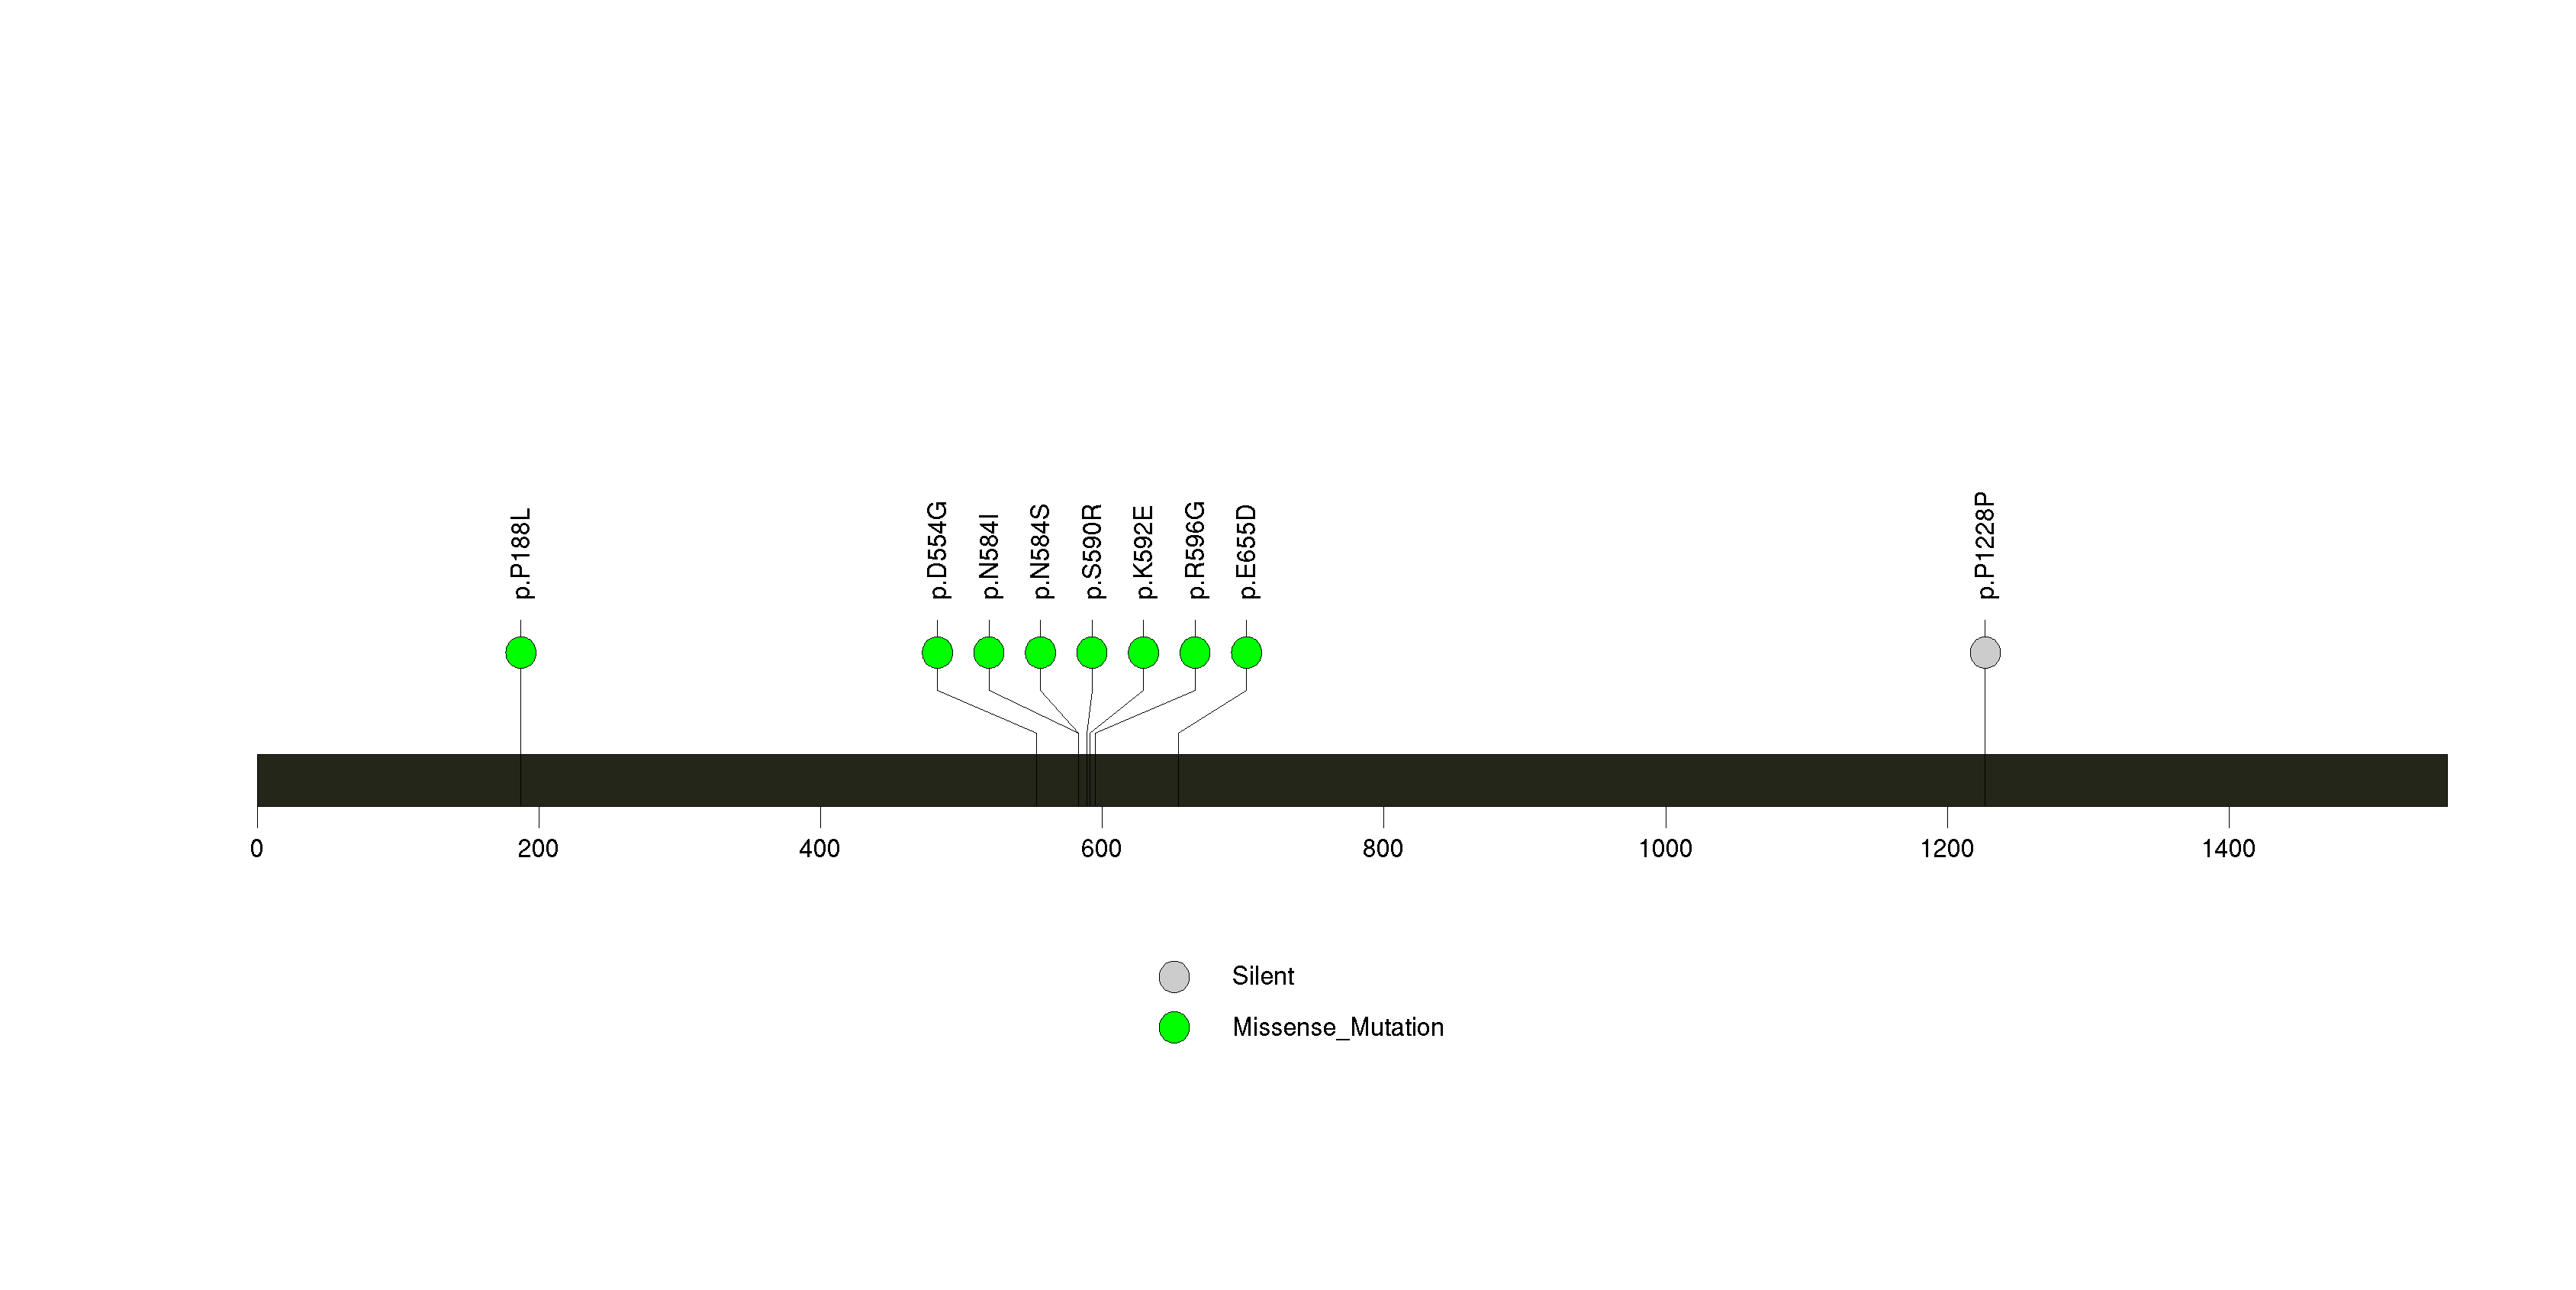
Figure S5. This figure depicts the distribution of mutations and mutation types across the LGI4 significant gene.
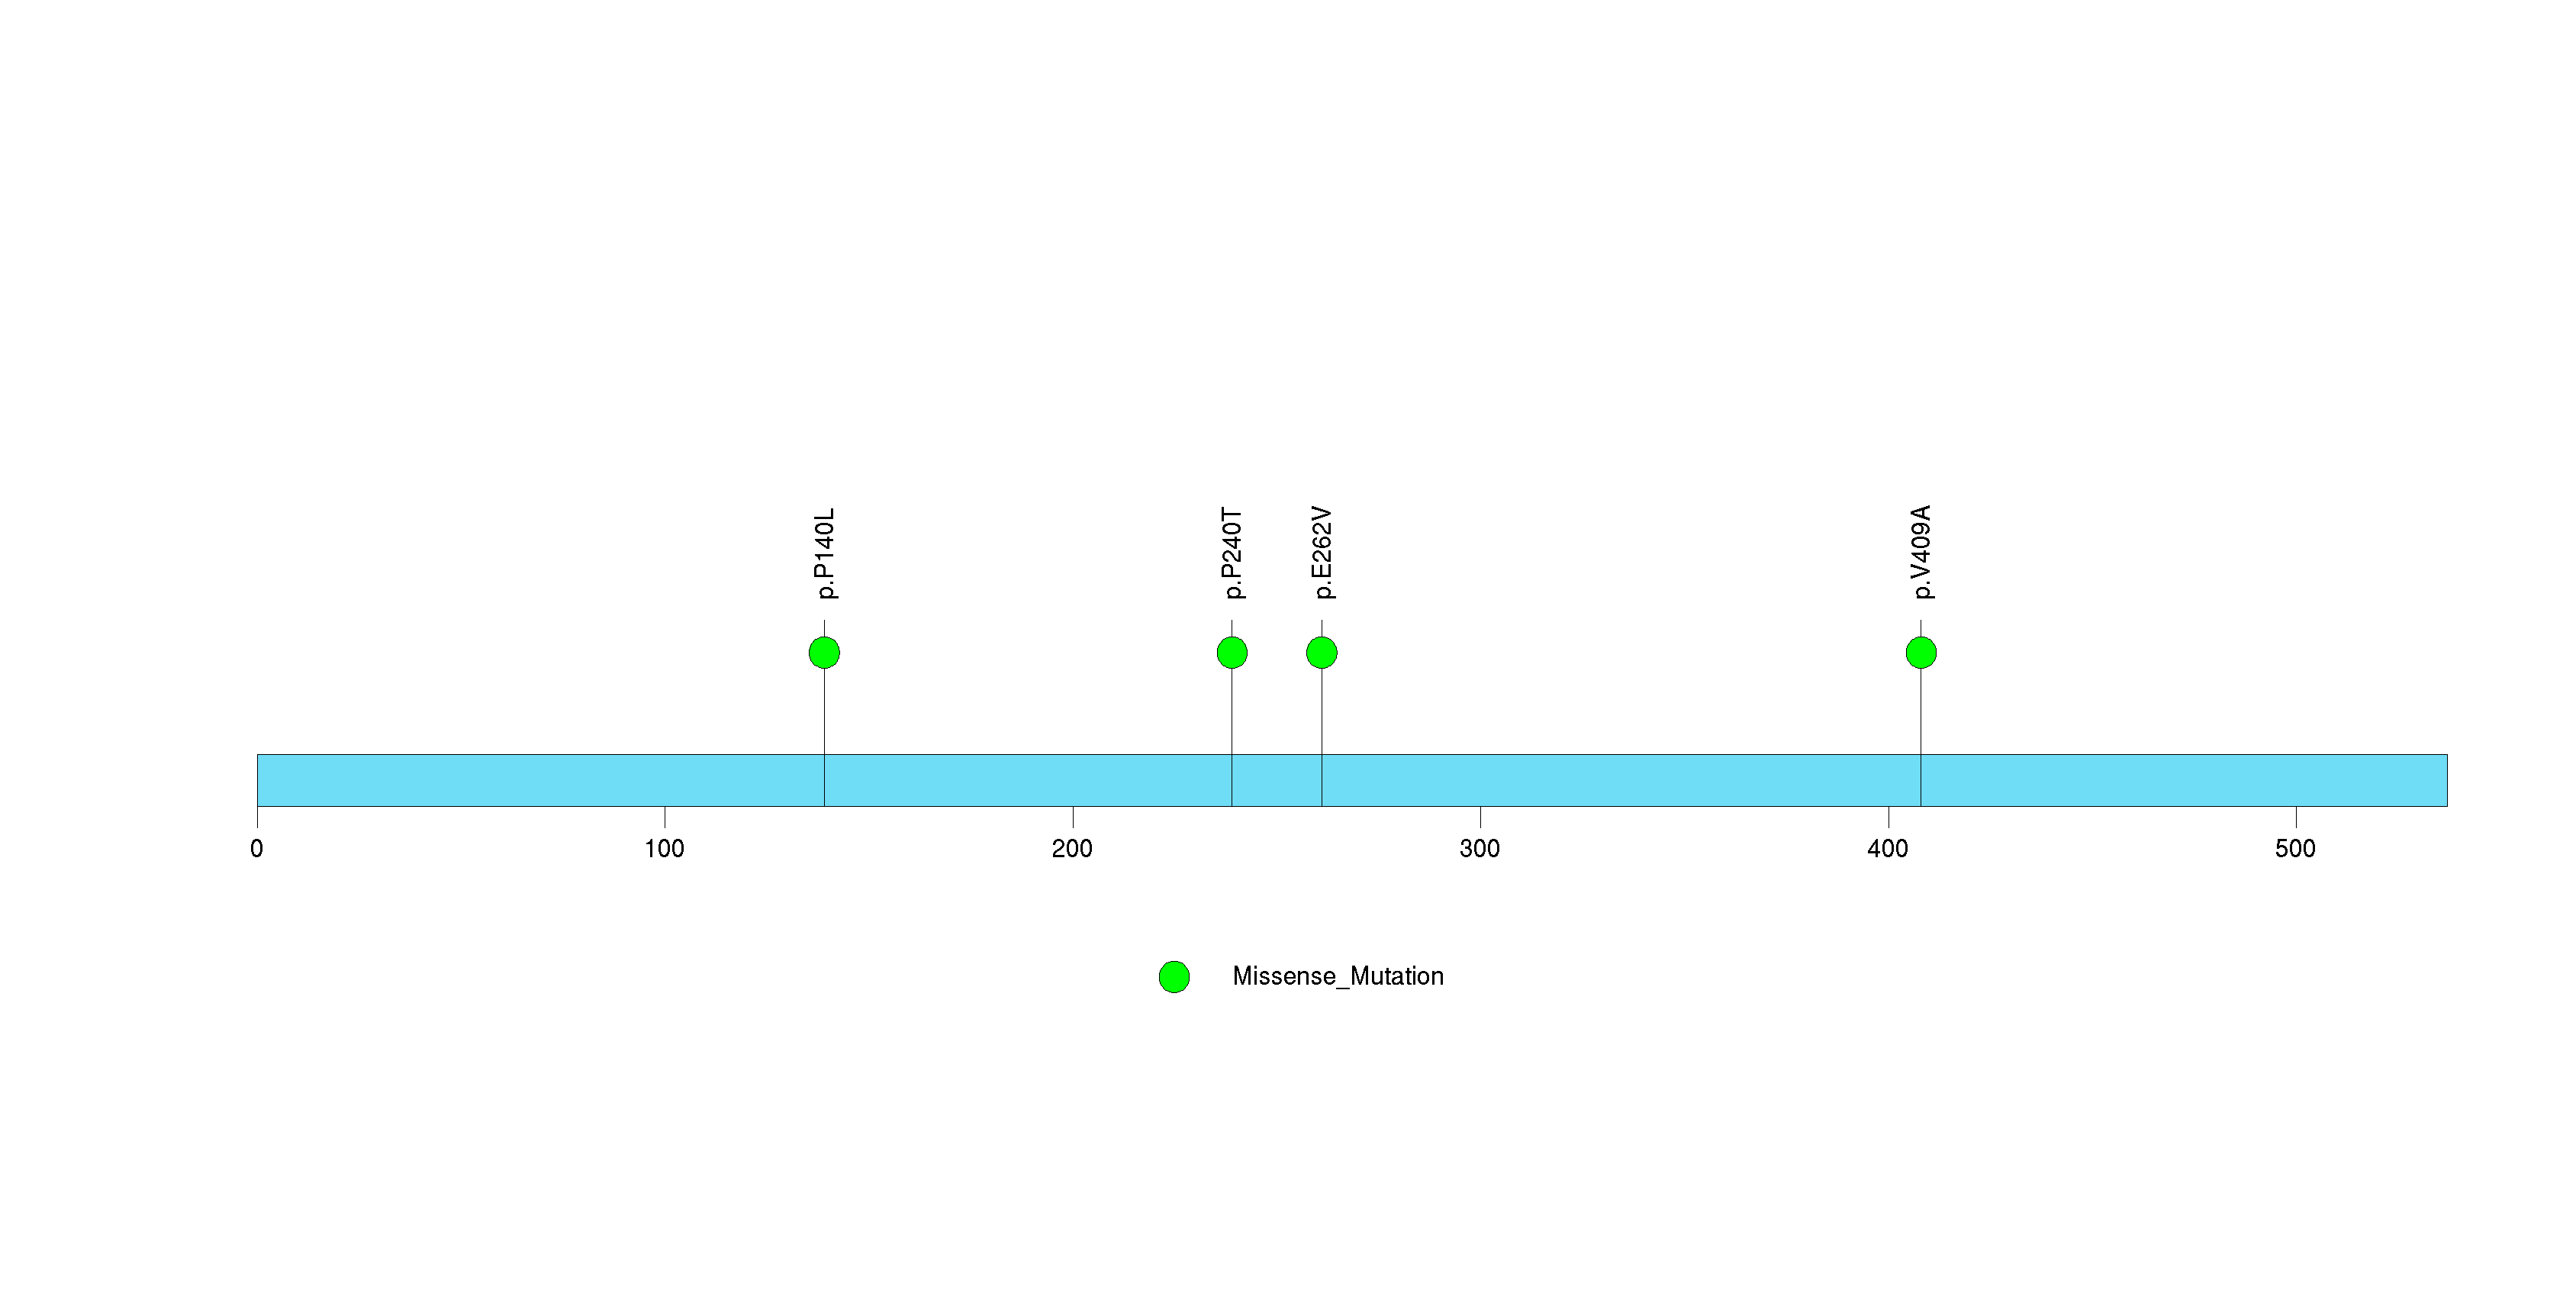
Figure S6. This figure depicts the distribution of mutations and mutation types across the GLCCI1 significant gene.
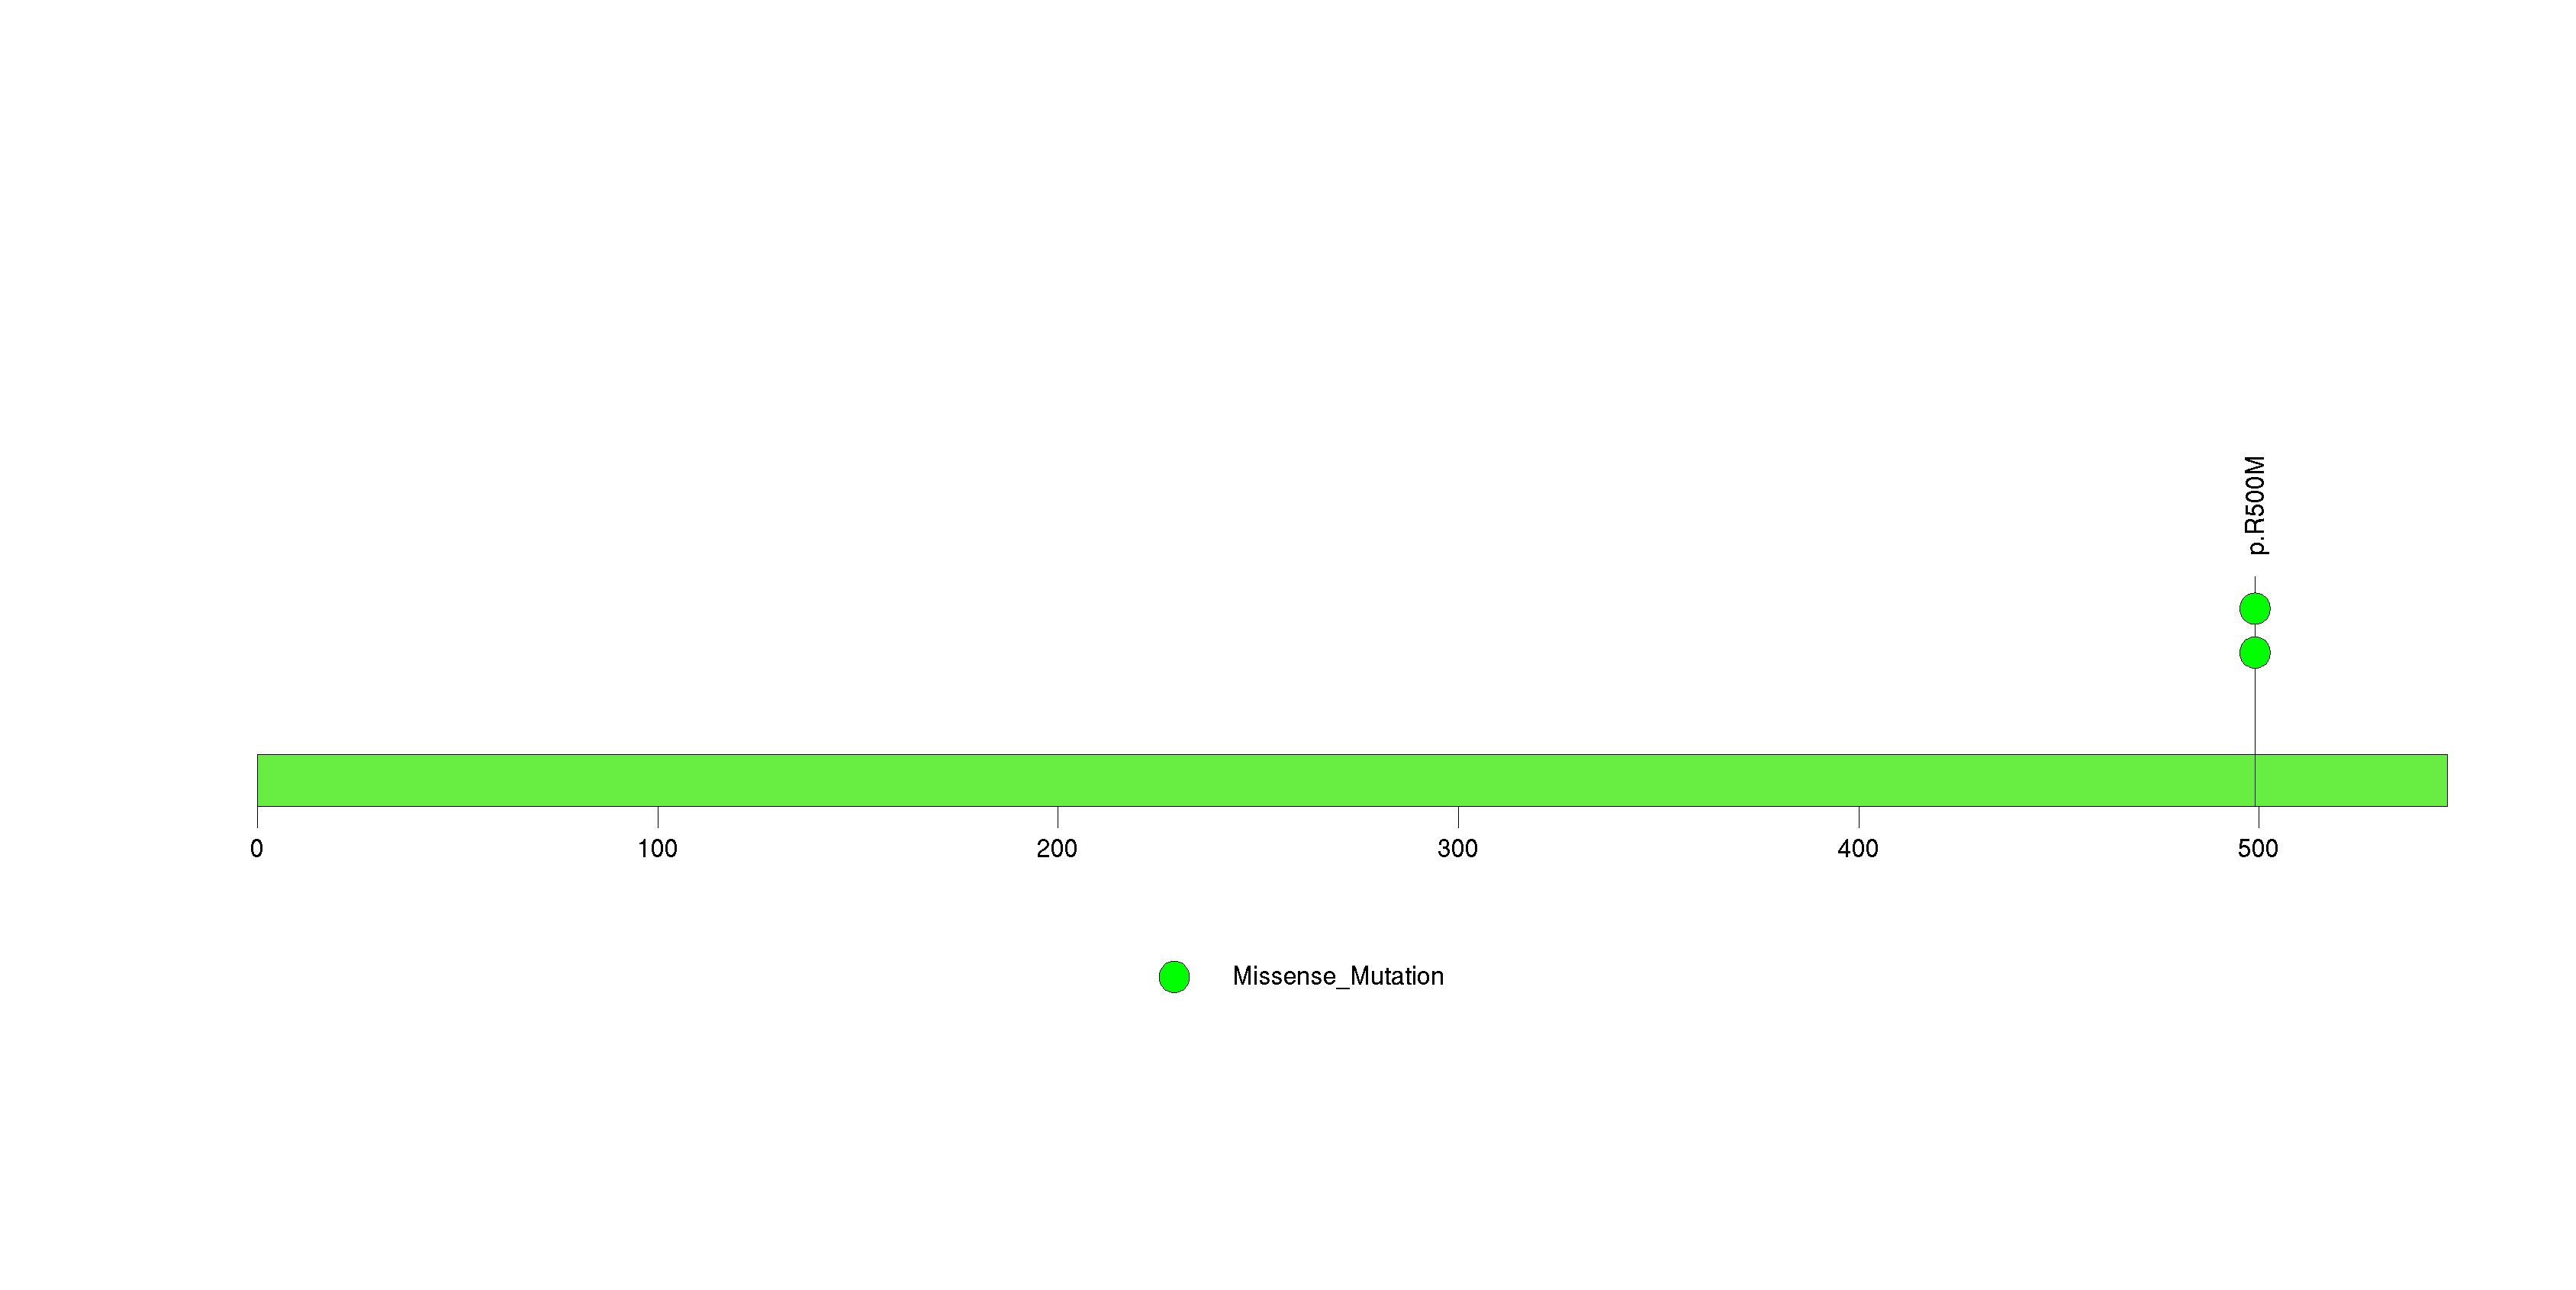
Figure S7. This figure depicts the distribution of mutations and mutation types across the ADAP2 significant gene.
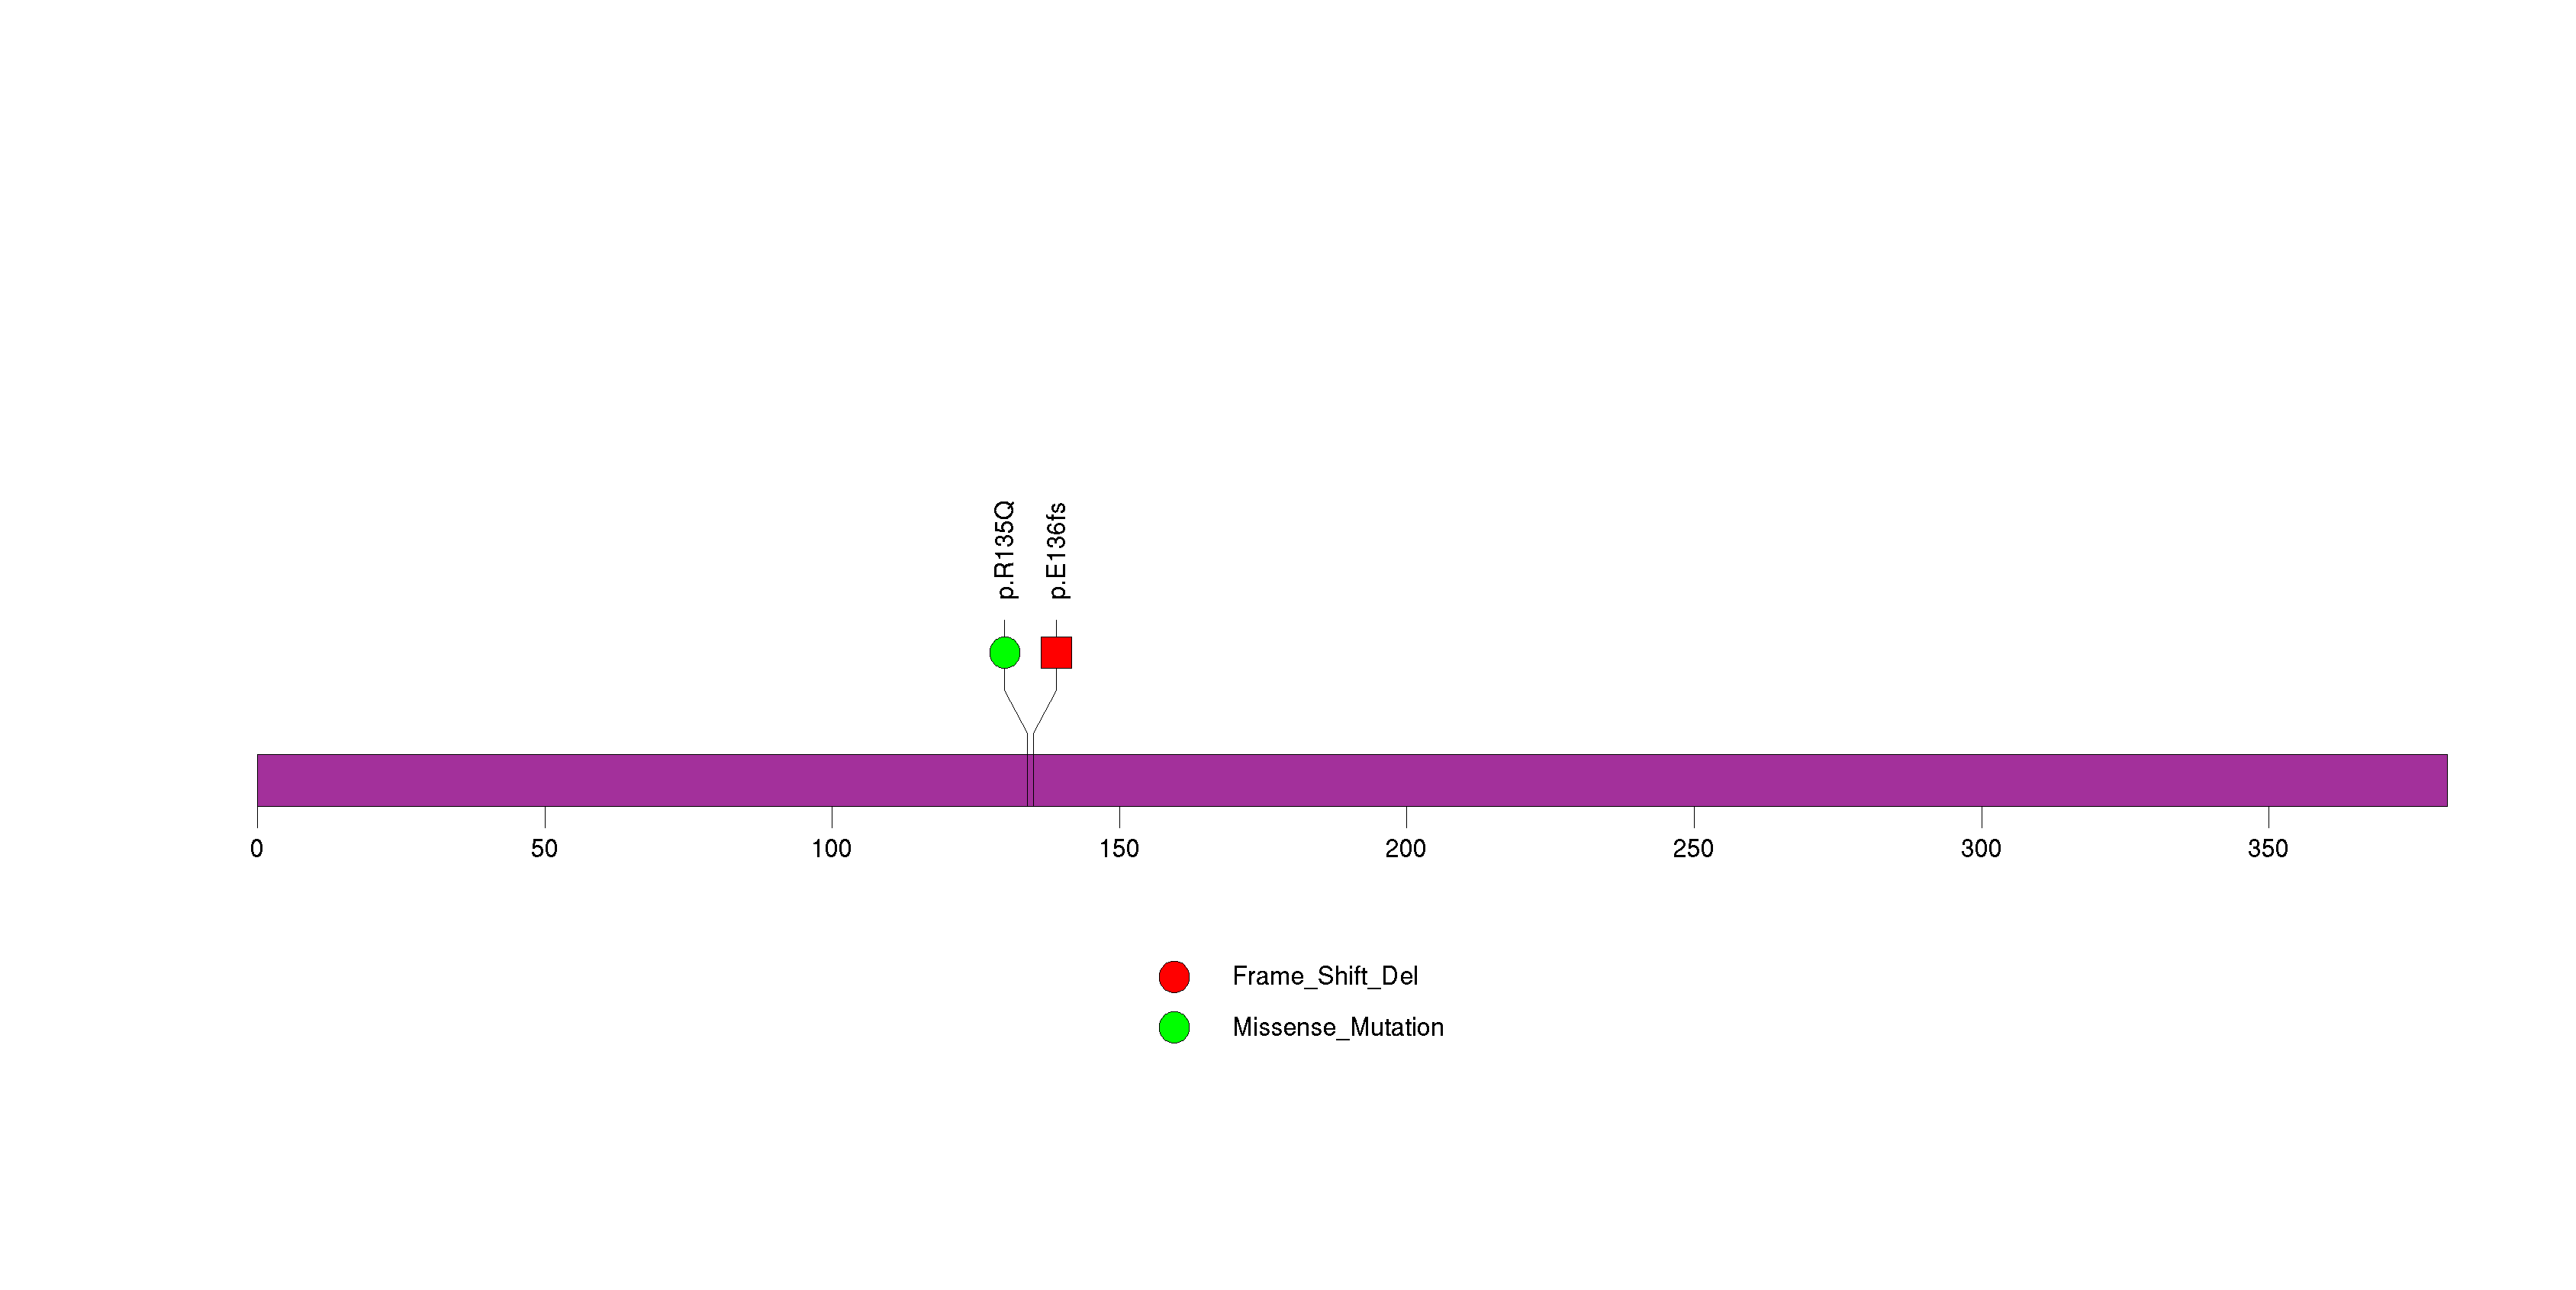
Figure S8. This figure depicts the distribution of mutations and mutation types across the PPARGC1B significant gene.
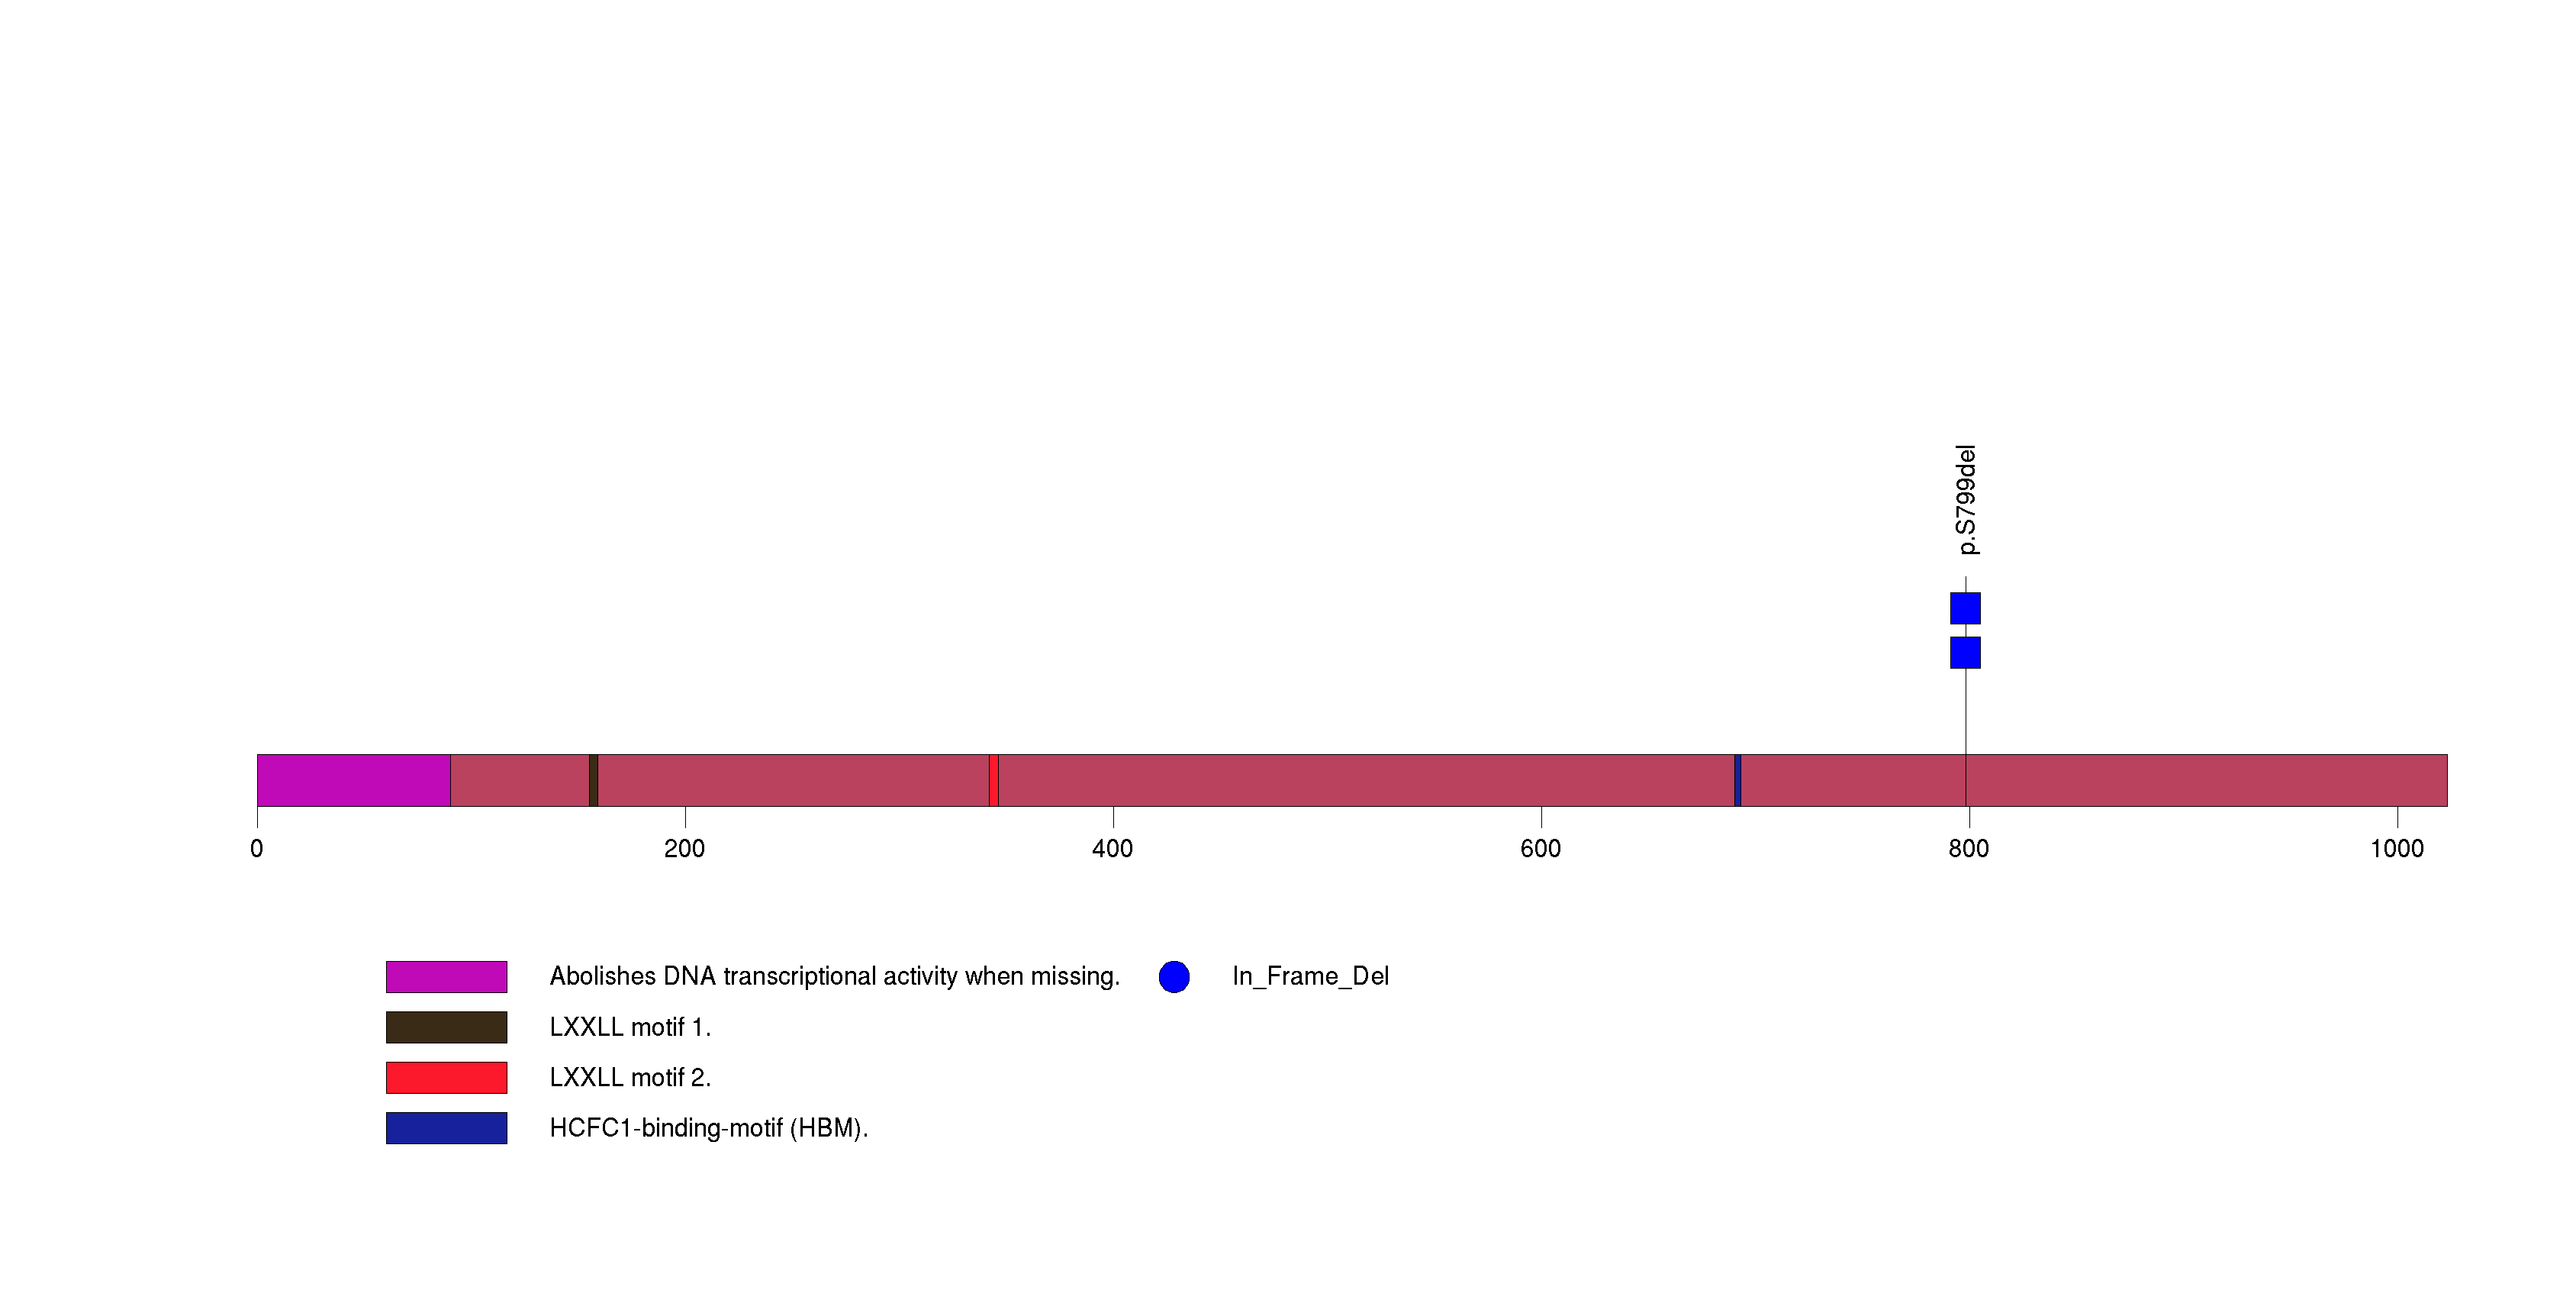
Figure S9. This figure depicts the distribution of mutations and mutation types across the NF2 significant gene.
In this analysis, COSMIC is used as a filter to increase power by restricting the territory of each gene. Cosmic version: v48.
Table 4. Get Full Table Significantly mutated genes (COSMIC territory only). To access the database please go to: COSMIC. Number of significant genes found: 3. Number of genes displayed: 10
| rank | gene | description | n | cos | n_cos | N_cos | cos_ev | p | q |
|---|---|---|---|---|---|---|---|---|---|
| 1 | MET | met proto-oncogene (hepatocyte growth factor receptor) | 8 | 33 | 4 | 3300 | 12 | 6.1e-11 | 2.8e-07 |
| 2 | FGFR3 | fibroblast growth factor receptor 3 (achondroplasia, thanatophoric dwarfism) | 4 | 43 | 3 | 4300 | 1469 | 8.7e-08 | 0.0002 |
| 3 | SMARCA4 | SWI/SNF related, matrix associated, actin dependent regulator of chromatin, subfamily a, member 4 | 4 | 29 | 2 | 2900 | 3 | 0.000015 | 0.022 |
| 4 | BRAF | v-raf murine sarcoma viral oncogene homolog B1 | 4 | 88 | 2 | 8800 | 10514 | 0.00013 | 0.11 |
| 5 | NF2 | neurofibromin 2 (merlin) | 5 | 543 | 3 | 54300 | 15 | 0.00016 | 0.11 |
| 6 | CDCA8 | cell division cycle associated 8 | 1 | 1 | 1 | 100 | 1 | 0.00019 | 0.11 |
| 7 | FLCN | folliculin | 1 | 1 | 1 | 100 | 1 | 0.00019 | 0.11 |
| 8 | PLXDC2 | plexin domain containing 2 | 1 | 1 | 1 | 100 | 1 | 0.00019 | 0.11 |
| 9 | SMARCB1 | SWI/SNF related, matrix associated, actin dependent regulator of chromatin, subfamily b, member 1 | 3 | 129 | 2 | 12900 | 8 | 0.00029 | 0.15 |
| 10 | PTEN | phosphatase and tensin homolog (mutated in multiple advanced cancers 1) | 3 | 728 | 3 | 72800 | 27 | 0.00038 | 0.17 |
Note:
n - number of (nonsilent) mutations in this gene across the individual set.
cos = number of unique mutated sites in this gene in COSMIC
n_cos = overlap between n and cos.
N_cos = number of individuals times cos.
cos_ev = total evidence: number of reports in COSMIC for mutations seen in this gene.
p = p-value for seeing the observed amount of overlap in this gene)
q = q-value, False Discovery Rate (Benjamini-Hochberg procedure)
Table 5. Get Full Table Genes with Clustered Mutations
| num | gene | desc | n | mindist | nmuts0 | nmuts3 | nmuts12 | npairs0 | npairs3 | npairs12 |
|---|---|---|---|---|---|---|---|---|---|---|
| 48 | ACSBG2 | acyl-CoA synthetase bubblegum family member 2 | 4 | 0 | 3 | 3 | 3 | 3 | 3 | 3 |
| 2138 | MET | met proto-oncogene (hepatocyte growth factor receptor) | 8 | 0 | 1 | 3 | 4 | 1 | 3 | 4 |
| 2622 | PCF11 | PCF11, cleavage and polyadenylation factor subunit, homolog (S. cerevisiae) | 8 | 0 | 1 | 2 | 10 | 1 | 2 | 10 |
| 2317 | NBPF9 | neuroblastoma breakpoint family, member 9 | 2 | 0 | 1 | 1 | 1 | 1 | 1 | 1 |
| 2654 | PEBP1 | phosphatidylethanolamine binding protein 1 | 2 | 0 | 1 | 1 | 1 | 1 | 1 | 1 |
| 2657 | PER1 | period homolog 1 (Drosophila) | 2 | 0 | 1 | 1 | 1 | 1 | 1 | 1 |
| 2799 | POTEH | POTE ankyrin domain family, member H | 3 | 0 | 1 | 1 | 1 | 1 | 1 | 1 |
| 3020 | RETSAT | retinol saturase (all-trans-retinol 13,14-reductase) | 2 | 0 | 1 | 1 | 1 | 1 | 1 | 1 |
| 4122 | ZNF423 | zinc finger protein 423 | 4 | 0 | 1 | 1 | 1 | 1 | 1 | 1 |
| 4159 | ZNF599 | zinc finger protein 599 | 2 | 0 | 1 | 1 | 1 | 1 | 1 | 1 |
Note:
n - number of mutations in this gene in the individual set.
mindist - distance (in aa) between closest pair of mutations in this gene
npairs3 - how many pairs of mutations are within 3 aa of each other.
npairs12 - how many pairs of mutations are within 12 aa of each other.
Table 6. Get Full Table A Ranked List of Significantly Mutated Genesets. (Source: MSigDB GSEA Cannonical Pathway Set).Number of significant genesets found: 0. Number of genesets displayed: 10
| rank | geneset | description | genes | N_genes | mut_tally | N | n | npat | nsite | nsil | n1 | n2 | n3 | n4 | n5 | n6 | p_ns_s | p | q |
|---|---|---|---|---|---|---|---|---|---|---|---|---|---|---|---|---|---|---|---|
| 1 | MTORPATHWAY | Mammalian target of rapamycin (mTOR) senses mitogenic factors and nutrients, including ATP, and induces cell proliferation. | AKT1, EIF3S10, EIF4A1, EIF4A2, EIF4B, EIF4E, EIF4EBP1, EIF4G1, EIF4G2, EIF4G3, FKBP1A, FRAP1, MKNK1, PDK2, PDPK1, PIK3CA, PIK3R1, PPP2CA, PTEN, RPS6, RPS6KB1, TSC1, TSC2 | 21 | EIF4B(2), EIF4G1(2), EIF4G3(4), PIK3CA(2), PIK3R1(1), PTEN(3), TSC1(2), TSC2(4) | 4154558 | 20 | 18 | 20 | 2 | 2 | 6 | 3 | 3 | 6 | 0 | 0.053 | 0.0009 | 0.55 |
| 2 | ALANINE_AND_ASPARTATE_METABOLISM | AARS, ABAT, ADSL, ADSS, AGXT, AGXT2, ASL, ASNS, ASPA, ASS, CAD, CRAT, DARS, DDO, GAD1, GAD2, GOT1, GOT2, GPT, GPT2, NARS, PC | 21 | AARS(1), ADSL(1), AGXT(1), AGXT2(1), CAD(3), CRAT(1), DARS(3), DDO(1), GOT2(1), GPT(1), PC(4) | 3908660 | 18 | 16 | 18 | 1 | 1 | 3 | 1 | 8 | 5 | 0 | 0.057 | 0.0029 | 0.75 | |
| 3 | KREBPATHWAY | The Krebs (citric acid) cycle takes place in mitochondria, where it extracts energy in the form of electron carriers NADH and FADH2, which drive the electron transport chain. | ACO2, CS, FH, IDH2, MDH1, OGDH, SDHA, SUCLA2 | 8 | FH(1), IDH2(1), MDH1(1), OGDH(2), SDHA(2) | 1404132 | 7 | 7 | 7 | 0 | 0 | 3 | 0 | 1 | 3 | 0 | 0.072 | 0.0043 | 0.75 |
| 4 | METHIONINE_METABOLISM | AHCY, BHMT, CBS, CTH, DNMT1, DNMT2, DNMT3A, DNMT3B, MARS, MARS2, MAT1A, MAT2B, MTR | 12 | AHCY(1), BHMT(3), CTH(1), DNMT1(1), DNMT3A(1), DNMT3B(1), MARS(1), MARS2(1), MAT2B(1) | 2607651 | 11 | 11 | 11 | 1 | 0 | 1 | 3 | 3 | 4 | 0 | 0.38 | 0.0061 | 0.75 | |
| 5 | SIG_PIP3_SIGNALING_IN_CARDIAC_MYOCTES | Genes related to PIP3 signaling in cardiac myocytes | AKT1, AKT2, AKT3, BAD, BCL2L1, CDC42, CDK2, CDKN1B, CDKN2A, CREB1, CREB3, CREB5, EBP, ERBB4, F2RL2, FOXO3A, FRAP1, GAB1, GADD45A, GRB2, GSK3A, GSK3B, IFI27, IGF1, IGFBP1, INPPL1, IRS1, IRS2, IRS4, MET, MYC, NOLC1, P101-PI3K, PAK1, PAK2, PAK3, PAK4, PAK6, PAK7, PARD3, PARD6A, PDK1, PIK3CA, PIK3CD, PPP1R13B, PREX1, PSCD3, PTEN, PTK2, PTPN1, RPS6KA1, RPS6KA2, RPS6KA3, RPS6KB1, SFN, SHC1, SLC2A4, SOS1, SOS2, TSC1, TSC2, YWHAB, YWHAE, YWHAG, YWHAH, YWHAQ, YWHAZ | 63 | AKT2(1), CDKN2A(1), CREB3(1), ERBB4(2), F2RL2(1), INPPL1(1), IRS1(1), MET(8), MYC(1), NOLC1(1), PAK1(1), PAK3(2), PAK4(1), PARD3(1), PIK3CA(2), PIK3CD(1), PTEN(3), PTPN1(1), RPS6KA1(1), RPS6KA3(1), SFN(1), SOS1(2), SOS2(1), TSC1(2), TSC2(4) | 11606420 | 42 | 35 | 41 | 4 | 4 | 11 | 9 | 9 | 9 | 0 | 0.0018 | 0.0067 | 0.75 |
| 6 | CBLPATHWAY | Activated EGF receptors undergo endocytosis into clathrin-coated vesicles, where they are recycled to the membrane or ubiquitinated by Cbl. | CBL, CSF1R, EGF, EGFR, GRB2, MET, PDGFRA, PRKCA, PRKCB1, SH3GLB1, SH3GLB2, SH3KBP1, SRC | 12 | EGF(1), MET(8), PDGFRA(2), SH3KBP1(1) | 2906209 | 12 | 11 | 11 | 1 | 1 | 3 | 2 | 5 | 1 | 0 | 0.13 | 0.0073 | 0.75 |
| 7 | CITRATE_CYCLE_TCA_CYCLE | ACO1, ACO2, CS, DLD, DLST, DLSTP, FH, IDH1, IDH2, IDH3A, IDH3B, IDH3G, MDH1, MDH2, PC, PCK1, SDHA, SDHA, SDHAL2, SDHB, SUCLA2, SUCLG1, SUCLG2 | 20 | ACO1(1), DLD(1), FH(1), IDH2(1), MDH1(1), PC(4), PCK1(1), SDHA(2) | 3076072 | 12 | 11 | 12 | 0 | 0 | 2 | 1 | 3 | 6 | 0 | 0.049 | 0.013 | 1 | |
| 8 | RABPATHWAY | Rab family GTPases regulate vesicle transport, endocytosis and exocytosis, and vesicle docking via interactions with the rabphilins. | ACTA1, MEL, RAB11A, RAB1A, RAB2, RAB27A, RAB3A, RAB4A, RAB5A, RAB6A, RAB7, RAB9A | 9 | ACTA1(1), RAB11A(1), RAB3A(1), RAB6A(1) | 636136 | 4 | 4 | 4 | 1 | 0 | 1 | 0 | 2 | 1 | 0 | 0.81 | 0.015 | 1 |
| 9 | NEUTROPHILPATHWAY | Neutrophils are phagocytotic leukocytes that destroy foreign cells with reactive oxygen species or enzymatic digestion and express CD11 and CD18. | CD44, ICAM1, ITGAL, ITGAM, ITGB2, PECAM1, SELE, SELL | 8 | ITGAL(3), ITGAM(2), ITGB2(1), SELL(1) | 1554500 | 7 | 7 | 7 | 0 | 1 | 2 | 0 | 3 | 1 | 0 | 0.13 | 0.016 | 1 |
| 10 | ST_G_ALPHA_S_PATHWAY | The G-alpha-s protein activates adenylyl cyclases, which catalyze cAMP formation. | ASAH1, BF, BFAR, BRAF, CAMP, CREB1, CREB3, CREB5, EPAC, GAS, GRF2, MAPK1, RAF1, SNX13, SRC, TERF2IP | 12 | BFAR(1), BRAF(4), CREB3(1), RAF1(1), SNX13(1), TERF2IP(1) | 1676241 | 9 | 7 | 9 | 1 | 0 | 0 | 3 | 5 | 1 | 0 | 0.35 | 0.019 | 1 |
Table 7. Get Full Table A Ranked List of Significantly Mutated Genesets (Excluding Significantly Mutated Genes). Number of significant genesets found: 0. Number of genesets displayed: 10
| rank | geneset | description | genes | N_genes | mut_tally | N | n | npat | nsite | nsil | n1 | n2 | n3 | n4 | n5 | n6 | p_ns_s | p | q |
|---|---|---|---|---|---|---|---|---|---|---|---|---|---|---|---|---|---|---|---|
| 1 | MTORPATHWAY | Mammalian target of rapamycin (mTOR) senses mitogenic factors and nutrients, including ATP, and induces cell proliferation. | AKT1, EIF3S10, EIF4A1, EIF4A2, EIF4B, EIF4E, EIF4EBP1, EIF4G1, EIF4G2, EIF4G3, FKBP1A, FRAP1, MKNK1, PDK2, PDPK1, PIK3CA, PIK3R1, PPP2CA, PTEN, RPS6, RPS6KB1, TSC1, TSC2 | 21 | EIF4B(2), EIF4G1(2), EIF4G3(4), PIK3CA(2), PIK3R1(1), PTEN(3), TSC1(2), TSC2(4) | 4154558 | 20 | 18 | 20 | 2 | 2 | 6 | 3 | 3 | 6 | 0 | 0.053 | 0.0009 | 0.55 |
| 2 | ALANINE_AND_ASPARTATE_METABOLISM | AARS, ABAT, ADSL, ADSS, AGXT, AGXT2, ASL, ASNS, ASPA, ASS, CAD, CRAT, DARS, DDO, GAD1, GAD2, GOT1, GOT2, GPT, GPT2, NARS, PC | 21 | AARS(1), ADSL(1), AGXT(1), AGXT2(1), CAD(3), CRAT(1), DARS(3), DDO(1), GOT2(1), GPT(1), PC(4) | 3908660 | 18 | 16 | 18 | 1 | 1 | 3 | 1 | 8 | 5 | 0 | 0.057 | 0.0029 | 0.88 | |
| 3 | KREBPATHWAY | The Krebs (citric acid) cycle takes place in mitochondria, where it extracts energy in the form of electron carriers NADH and FADH2, which drive the electron transport chain. | ACO2, CS, FH, IDH2, MDH1, OGDH, SDHA, SUCLA2 | 8 | FH(1), IDH2(1), MDH1(1), OGDH(2), SDHA(2) | 1404132 | 7 | 7 | 7 | 0 | 0 | 3 | 0 | 1 | 3 | 0 | 0.072 | 0.0043 | 0.89 |
| 4 | METHIONINE_METABOLISM | AHCY, BHMT, CBS, CTH, DNMT1, DNMT2, DNMT3A, DNMT3B, MARS, MARS2, MAT1A, MAT2B, MTR | 12 | AHCY(1), BHMT(3), CTH(1), DNMT1(1), DNMT3A(1), DNMT3B(1), MARS(1), MARS2(1), MAT2B(1) | 2607651 | 11 | 11 | 11 | 1 | 0 | 1 | 3 | 3 | 4 | 0 | 0.38 | 0.0061 | 0.93 | |
| 5 | CITRATE_CYCLE_TCA_CYCLE | ACO1, ACO2, CS, DLD, DLST, DLSTP, FH, IDH1, IDH2, IDH3A, IDH3B, IDH3G, MDH1, MDH2, PC, PCK1, SDHA, SDHA, SDHAL2, SDHB, SUCLA2, SUCLG1, SUCLG2 | 20 | ACO1(1), DLD(1), FH(1), IDH2(1), MDH1(1), PC(4), PCK1(1), SDHA(2) | 3076072 | 12 | 11 | 12 | 0 | 0 | 2 | 1 | 3 | 6 | 0 | 0.049 | 0.013 | 1 | |
| 6 | RABPATHWAY | Rab family GTPases regulate vesicle transport, endocytosis and exocytosis, and vesicle docking via interactions with the rabphilins. | ACTA1, MEL, RAB11A, RAB1A, RAB2, RAB27A, RAB3A, RAB4A, RAB5A, RAB6A, RAB7, RAB9A | 9 | ACTA1(1), RAB11A(1), RAB3A(1), RAB6A(1) | 636136 | 4 | 4 | 4 | 1 | 0 | 1 | 0 | 2 | 1 | 0 | 0.81 | 0.015 | 1 |
| 7 | NEUTROPHILPATHWAY | Neutrophils are phagocytotic leukocytes that destroy foreign cells with reactive oxygen species or enzymatic digestion and express CD11 and CD18. | CD44, ICAM1, ITGAL, ITGAM, ITGB2, PECAM1, SELE, SELL | 8 | ITGAL(3), ITGAM(2), ITGB2(1), SELL(1) | 1554500 | 7 | 7 | 7 | 0 | 1 | 2 | 0 | 3 | 1 | 0 | 0.13 | 0.016 | 1 |
| 8 | ST_G_ALPHA_S_PATHWAY | The G-alpha-s protein activates adenylyl cyclases, which catalyze cAMP formation. | ASAH1, BF, BFAR, BRAF, CAMP, CREB1, CREB3, CREB5, EPAC, GAS, GRF2, MAPK1, RAF1, SNX13, SRC, TERF2IP | 12 | BFAR(1), BRAF(4), CREB3(1), RAF1(1), SNX13(1), TERF2IP(1) | 1676241 | 9 | 7 | 9 | 1 | 0 | 0 | 3 | 5 | 1 | 0 | 0.35 | 0.019 | 1 |
| 9 | ACE_INHIBITOR_PATHWAY_PHARMGKB | ACE, AGT, AGTR1, AGTR2, BDKRB2, KNG1, NOS3, REN | 8 | ACE(2), AGT(3), AGTR2(1), NOS3(1) | 1506255 | 7 | 7 | 7 | 0 | 1 | 1 | 1 | 4 | 0 | 0 | 0.14 | 0.021 | 1 | |
| 10 | BETAOXIDATIONPATHWAY | Beta-Oxidation of Fatty Acids | ACADL, ACADM, ACADS, ACAT1, ECHS1, HADHA | 6 | ACADL(3), HADHA(1) | 810277 | 4 | 4 | 4 | 0 | 0 | 1 | 1 | 1 | 1 | 0 | 0.38 | 0.026 | 1 |
In brief, we tabulate the number of mutations and the number of covered bases for each gene. The counts are broken down by mutation context category: four context categories that are discovered by MutSig, and one for indel and 'null' mutations, which include indels, nonsense mutations, splice-site mutations, and non-stop (read-through) mutations. For each gene, we calculate the probability of seeing the observed constellation of mutations, i.e. the product P1 x P2 x ... x Pm, or a more extreme one, given the background mutation rates calculated across the dataset. [1]
This is an experimental feature. The full results of the analysis summarized in this report can be downloaded from the TCGA Data Coordination Center.