This report serves to describe the mutational landscape and properties of a given individual set, as well as rank genes and genesets according to mutational significance. MutSig v2.0 was used to generate the results found in this report.
-
Working with individual set: LGG-TP
-
Number of patients in set: 34
The input for this pipeline is a set of individuals with the following files associated for each:
-
An annotated .maf file describing the mutations called for the respective individual, and their properties.
-
A .wig file that contains information about the coverage of the sample.
-
MAF used for this analysis:LGG-TP.final_analysis_set.maf
-
Significantly mutated genes (q ≤ 0.1): 463
-
Mutations seen in COSMIC: 74
-
Significantly mutated genes in COSMIC territory: 10
-
Genes with clustered mutations (≤ 3 aa apart): 93
-
Significantly mutated genesets: 38
-
Significantly mutated genesets: (excluding sig. mutated genes):0
-
Read 34 MAFs of type "Broad"
-
Total number of mutations in input MAFs: 6470
-
After removing 26 mutations outside chr1-24: 6444
-
After removing 427 blacklisted mutations: 6017
-
After removing 196 noncoding mutations: 5821
-
Number of mutations before filtering: 5821
-
After removing 130 mutations outside gene set: 5691
-
After removing 20 mutations outside category set: 5671
Table 1. Get Full Table Table representing breakdown of mutations by type.
| type | count |
|---|---|
| Frame_Shift_Del | 760 |
| Frame_Shift_Ins | 257 |
| In_Frame_Del | 1066 |
| In_Frame_Ins | 15 |
| Missense_Mutation | 2295 |
| Nonsense_Mutation | 113 |
| Nonstop_Mutation | 2 |
| Silent | 1075 |
| Splice_Site | 74 |
| Translation_Start_Site | 14 |
| Total | 5671 |
Table 2. Get Full Table A breakdown of mutation rates per category discovered for this individual set.
| category | n | N | rate | rate_per_mb | relative_rate | exp_ns_s_ratio |
|---|---|---|---|---|---|---|
| *CpG->T | 783 | 61306617 | 0.000013 | 13 | 2.9 | 2.1 |
| *Cp(A/C/T)->T | 447 | 479872178 | 9.3e-07 | 0.93 | 0.21 | 1.7 |
| A->G | 363 | 510523730 | 7.1e-07 | 0.71 | 0.16 | 2.4 |
| transver | 713 | 1051702525 | 6.8e-07 | 0.68 | 0.16 | 5 |
| indel+null | 2271 | 1051702525 | 2.2e-06 | 2.2 | 0.49 | NaN |
| double_null | 19 | 1051702525 | 1.8e-08 | 0.018 | 0.0041 | NaN |
| Total | 4596 | 1051702525 | 4.4e-06 | 4.4 | 1 | 3.5 |
The x axis represents the samples. The y axis represents the exons, one row per exon, and they are sorted by average coverage across samples. For exons with exactly the same average coverage, they are sorted next by the %GC of the exon. (The secondary sort is especially useful for the zero-coverage exons at the bottom).
Figure 1.
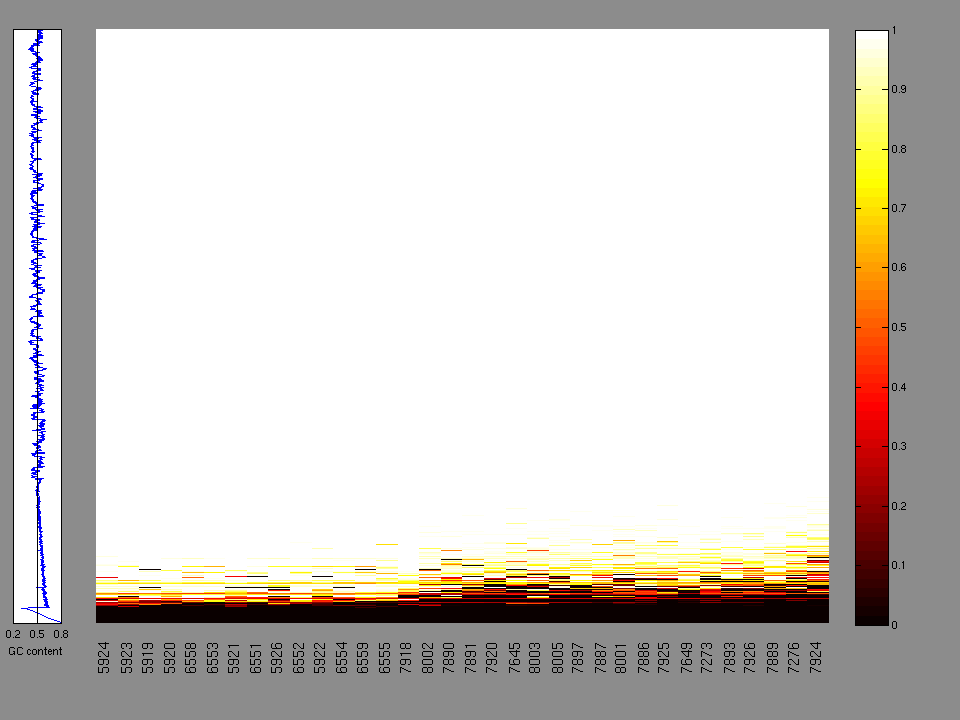
Figure 2. Patients counts and rates file used to generate this plot: LGG-TP.patients.counts_and_rates.txt
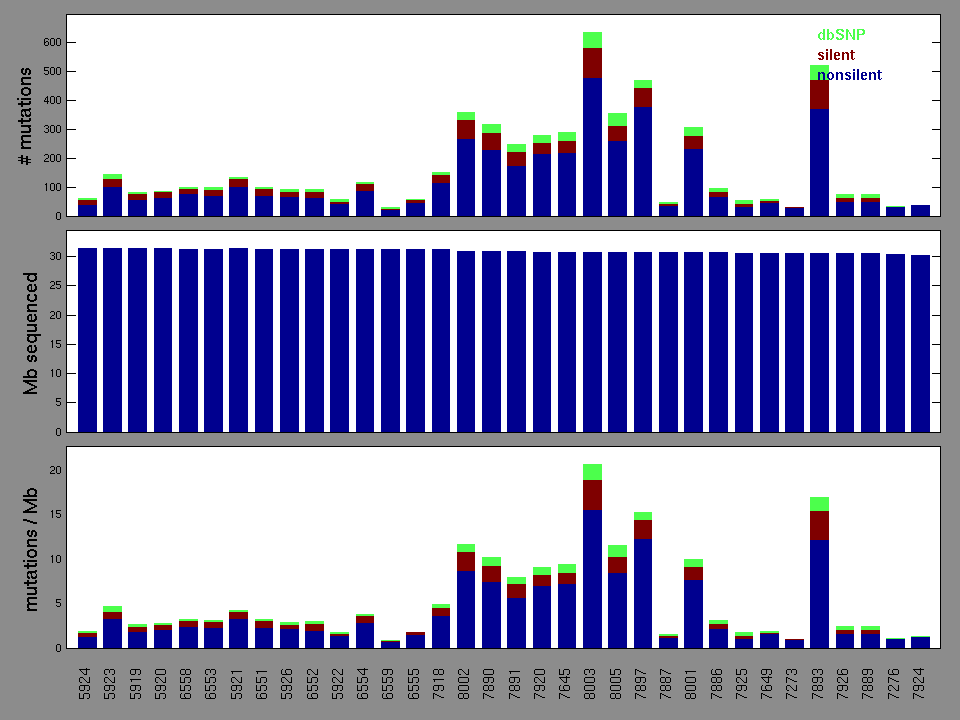
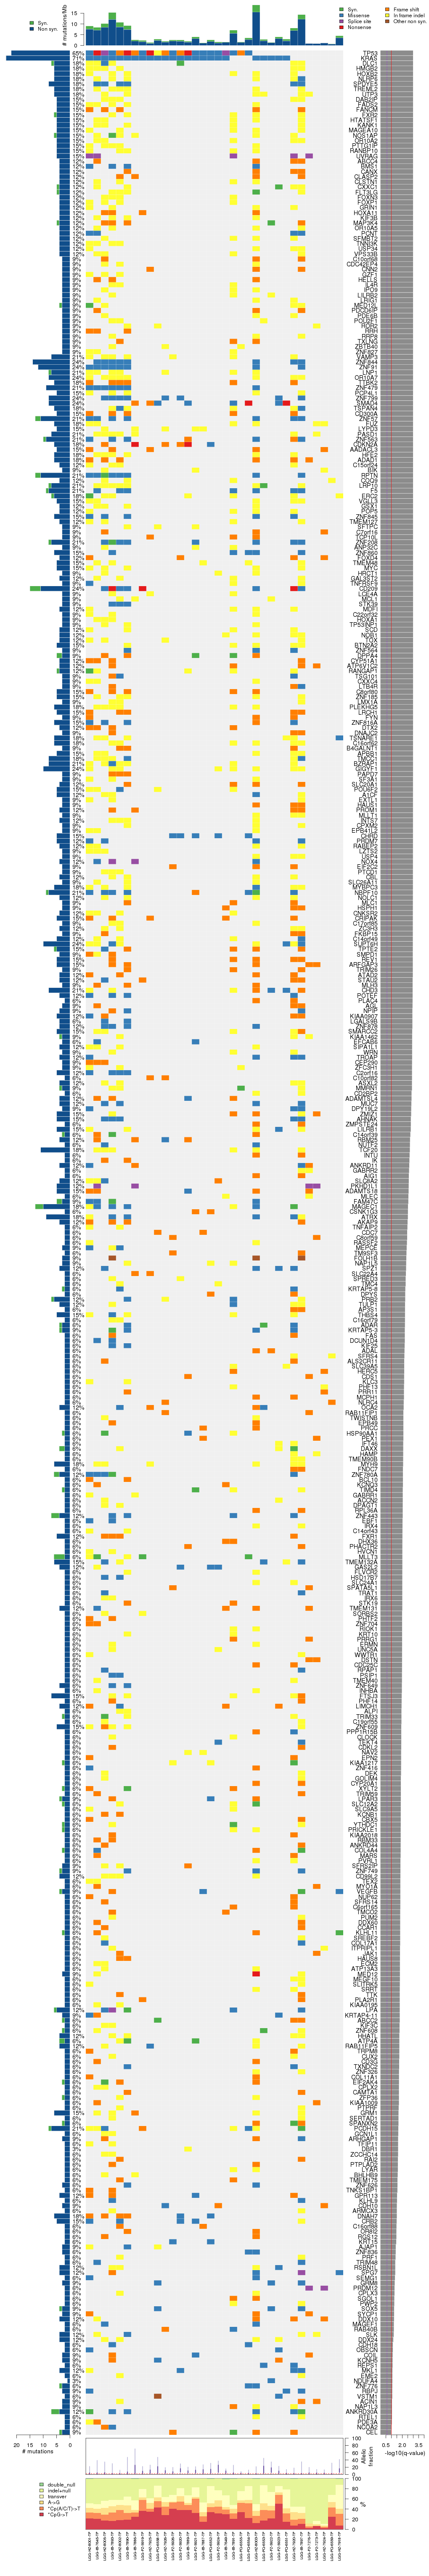
Figure 3. Get High-res Image The matrix in the center of the figure represents individual mutations in patient samples, color-coded by type of mutation, for the significantly mutated genes. The rate of synonymous and non-synonymous mutations is displayed at the top of the matrix. The barplot on the left of the matrix shows the number of mutations in each gene. The percentages represent the fraction of tumors with at least one mutation in the specified gene. The barplot to the right of the matrix displays the q-values for the most significantly mutated genes. The purple boxplots below the matrix (only displayed if required columns are present in the provided MAF) represent the distributions of allelic fractions observed in each sample. The plot at the bottom represents the base substitution distribution of individual samples, using the same categories that were used to calculate significance.
Column Descriptions:
-
N = number of sequenced bases in this gene across the individual set
-
n = number of (nonsilent) mutations in this gene across the individual set
-
npat = number of patients (individuals) with at least one nonsilent mutation
-
nsite = number of unique sites having a non-silent mutation
-
nsil = number of silent mutations in this gene across the individual set
-
n1 = number of nonsilent mutations of type: *CpG->T
-
n2 = number of nonsilent mutations of type: *Cp(A/C/T)->T
-
n3 = number of nonsilent mutations of type: A->G
-
n4 = number of nonsilent mutations of type: transver
-
n5 = number of nonsilent mutations of type: indel+null
-
n6 = number of nonsilent mutations of type: double_null
-
p_classic = p-value for the observed amount of nonsilent mutations being elevated in this gene
-
p_ns_s = p-value for the observed nonsilent/silent ratio being elevated in this gene
-
p_ks = p-value for clustering of mutations (Kolmogorov-Smirnoff test)
-
p_cons = p-value for enrichment of mutations at evolutionarily most-conserved sites in gene
-
p_joint = p-value for clustering + conservation
-
p = p-value (overall)
-
q = q-value, False Discovery Rate (Benjamini-Hochberg procedure)
Table 3. Get Full Table A Ranked List of Significantly Mutated Genes. Number of significant genes found: 463. Number of genes displayed: 35. Click on a gene name to display its stick figure depicting the distribution of mutations and mutation types across the chosen gene (this feature may not be available for all significant genes).
| rank | gene | description | N | n | npat | nsite | nsil | n1 | n2 | n3 | n4 | n5 | n6 | p_classic | p_ns_s | p_ks | p_cons | p_joint | p | q |
|---|---|---|---|---|---|---|---|---|---|---|---|---|---|---|---|---|---|---|---|---|
| 1 | TP53 | tumor protein p53 | 43384 | 22 | 22 | 21 | 0 | 4 | 0 | 1 | 5 | 12 | 0 | 3.9e-15 | 0.013 | 0.00075 | 0.0014 | 0.00015 | 0.000 | 0.000 |
| 2 | KRAS | v-Ki-ras2 Kirsten rat sarcoma viral oncogene homolog | 24009 | 24 | 24 | 4 | 0 | 0 | 8 | 1 | 15 | 0 | 0 | 3.3e-15 | 0.0058 | 2e-07 | 0.000048 | 0 | <1.00e-15 | <3.09e-13 |
| 3 | DLC1 | deleted in liver cancer 1 | 161114 | 6 | 6 | 2 | 1 | 0 | 0 | 0 | 1 | 5 | 0 | 0.00058 | 0.95 | 2e-07 | 0.44 | 0 | <1.00e-15 | <3.09e-13 |
| 4 | HMGB2 | high-mobility group box 2 | 21964 | 6 | 6 | 1 | 0 | 0 | 0 | 0 | 0 | 6 | 0 | 2.6e-08 | 1 | 2e-07 | 0.031 | 0 | <1.00e-15 | <3.09e-13 |
| 5 | HOXB2 | homeobox B2 | 36200 | 6 | 6 | 1 | 0 | 0 | 0 | 0 | 0 | 6 | 0 | 8.6e-07 | 1 | 2e-07 | 0.49 | 0 | <1.00e-15 | <3.09e-13 |
| 6 | NLRP6 | NLR family, pyrin domain containing 6 | 71555 | 6 | 6 | 2 | 0 | 0 | 0 | 1 | 0 | 5 | 0 | 0.000014 | 0.84 | 2e-07 | 0.0035 | 0 | <1.00e-15 | <3.09e-13 |
| 7 | SPDYE5 | speedy homolog E5 (Xenopus laevis) | 33064 | 8 | 6 | 2 | 0 | 8 | 0 | 0 | 0 | 0 | 0 | 4.7e-09 | 0.12 | 2e-07 | 0.46 | 0 | <1.00e-15 | <3.09e-13 |
| 8 | TREML2 | triggering receptor expressed on myeloid cells-like 2 | 33380 | 6 | 6 | 1 | 0 | 0 | 0 | 0 | 0 | 6 | 0 | 3.3e-07 | 1 | 2e-07 | 0.86 | 0 | <1.00e-15 | <3.09e-13 |
| 9 | UTP3 | UTP3, small subunit (SSU) processome component, homolog (S. cerevisiae) | 49096 | 6 | 6 | 1 | 0 | 0 | 0 | 0 | 0 | 6 | 0 | 3.6e-07 | 1 | 2e-07 | 0.008 | 0 | <1.00e-15 | <3.09e-13 |
| 10 | DAB2IP | DAB2 interacting protein | 114288 | 5 | 5 | 1 | 0 | 0 | 0 | 0 | 0 | 5 | 0 | 0.0015 | 1 | 2e-07 | 0.049 | 0 | <1.00e-15 | <3.09e-13 |
| 11 | FADS2 | fatty acid desaturase 2 | 46115 | 5 | 5 | 1 | 0 | 0 | 0 | 0 | 0 | 5 | 0 | 0.000026 | 1 | 2e-07 | 0.0098 | 0 | <1.00e-15 | <3.09e-13 |
| 12 | FANCM | Fanconi anemia, complementation group M | 212070 | 5 | 5 | 1 | 0 | 0 | 0 | 0 | 0 | 4 | 1 | 0.0023 | 1 | 2e-07 | 0.002 | 0 | <1.00e-15 | <3.09e-13 |
| 13 | FXR2 | fragile X mental retardation, autosomal homolog 2 | 61528 | 5 | 5 | 1 | 1 | 0 | 0 | 0 | 0 | 5 | 0 | 0.00011 | 1 | 2e-07 | 0.021 | 0 | <1.00e-15 | <3.09e-13 |
| 14 | HTATSF1 | HIV-1 Tat specific factor 1 | 78336 | 5 | 5 | 1 | 0 | 0 | 0 | 0 | 0 | 5 | 0 | 0.00023 | 1 | 2e-07 | 0.00055 | 0 | <1.00e-15 | <3.09e-13 |
| 15 | KANK1 | KN motif and ankyrin repeat domains 1 | 139489 | 5 | 5 | 1 | 0 | 0 | 0 | 0 | 0 | 5 | 0 | 0.0018 | 1 | 2e-07 | 0.24 | 0 | <1.00e-15 | <3.09e-13 |
| 16 | MAGEA10 | melanoma antigen family A, 10 | 37876 | 5 | 5 | 1 | 0 | 0 | 0 | 0 | 0 | 5 | 0 | 8.2e-06 | 1 | 2e-07 | 0.042 | 0 | <1.00e-15 | <3.09e-13 |
| 17 | NOS1AP | nitric oxide synthase 1 (neuronal) adaptor protein | 54739 | 5 | 5 | 1 | 1 | 0 | 0 | 0 | 0 | 5 | 0 | 0.000035 | 1 | 2e-07 | 0.24 | 0 | <1.00e-15 | <3.09e-13 |
| 18 | OR10A2 | olfactory receptor, family 10, subfamily A, member 2 | 31144 | 5 | 5 | 1 | 0 | 0 | 0 | 0 | 0 | 5 | 0 | 2.5e-06 | 1 | 4e-07 | 0.011 | 0 | <1.00e-15 | <3.09e-13 |
| 19 | PTTG1IP | pituitary tumor-transforming 1 interacting protein | 15232 | 5 | 5 | 1 | 0 | 0 | 0 | 0 | 0 | 5 | 0 | 2.5e-07 | 1 | 2e-07 | 0.000012 | 0 | <1.00e-15 | <3.09e-13 |
| 20 | RANBP10 | RAN binding protein 10 | 62459 | 5 | 5 | 1 | 0 | 0 | 0 | 0 | 0 | 5 | 0 | 0.000082 | 1 | 2e-07 | 0.0069 | 0 | <1.00e-15 | <3.09e-13 |
| 21 | UVRAG | UV radiation resistance associated gene | 67116 | 5 | 5 | 1 | 0 | 0 | 0 | 0 | 0 | 5 | 0 | 0.000035 | 1 | 2e-07 | 0.28 | 0 | <1.00e-15 | <3.09e-13 |
| 22 | ABCC4 | ATP-binding cassette, sub-family C (CFTR/MRP), member 4 | 138884 | 4 | 4 | 1 | 0 | 0 | 0 | 0 | 0 | 4 | 0 | 0.013 | 1 | 2e-07 | 0.016 | 0 | <1.00e-15 | <3.09e-13 |
| 23 | BMS1 | BMS1 homolog, ribosome assembly protein (yeast) | 133370 | 4 | 4 | 1 | 0 | 0 | 4 | 0 | 0 | 0 | 0 | 0.00042 | 0.19 | 2e-07 | 0.016 | 0 | <1.00e-15 | <3.09e-13 |
| 24 | CANX | calnexin | 62377 | 4 | 4 | 1 | 0 | 0 | 0 | 0 | 0 | 4 | 0 | 0.00077 | 1 | 4e-07 | 0.015 | 0 | <1.00e-15 | <3.09e-13 |
| 25 | CLASP2 | cytoplasmic linker associated protein 2 | 143224 | 4 | 4 | 1 | 0 | 0 | 0 | 0 | 0 | 4 | 0 | 0.0071 | 1 | 2e-07 | 0.019 | 0 | <1.00e-15 | <3.09e-13 |
| 26 | CLSTN1 | calsyntenin 1 | 99511 | 4 | 4 | 1 | 0 | 0 | 0 | 0 | 0 | 4 | 0 | 0.0044 | 1 | 2e-07 | 0.24 | 0 | <1.00e-15 | <3.09e-13 |
| 27 | CXXC1 | CXXC finger 1 (PHD domain) | 69461 | 4 | 4 | 1 | 1 | 0 | 0 | 0 | 0 | 4 | 0 | 0.0012 | 1 | 2e-07 | 0.27 | 0 | <1.00e-15 | <3.09e-13 |
| 28 | FLT3LG | fms-related tyrosine kinase 3 ligand | 24156 | 4 | 4 | 1 | 1 | 0 | 0 | 0 | 0 | 4 | 0 | 0.000031 | 1 | 2e-07 | 0.19 | 0 | <1.00e-15 | <3.09e-13 |
| 29 | FOXN3 | forkhead box N3 | 50878 | 4 | 4 | 1 | 0 | 0 | 0 | 0 | 0 | 4 | 0 | 0.00037 | 1 | 2e-07 | 0.38 | 0 | <1.00e-15 | <3.09e-13 |
| 30 | FOXP1 | forkhead box P1 | 77078 | 4 | 4 | 1 | 0 | 0 | 0 | 0 | 0 | 4 | 0 | 0.0012 | 1 | 2e-07 | 0.96 | 0 | <1.00e-15 | <3.09e-13 |
| 31 | GRIN1 | glutamate receptor, ionotropic, N-methyl D-aspartate 1 | 90248 | 4 | 4 | 1 | 0 | 0 | 0 | 0 | 0 | 4 | 0 | 0.0046 | 1 | 2e-07 | 0.0041 | 0 | <1.00e-15 | <3.09e-13 |
| 32 | HOXA11 | homeobox A11 | 27672 | 4 | 4 | 2 | 0 | 0 | 0 | 0 | 0 | 4 | 0 | 2e-05 | 1 | 2e-07 | 0.056 | 0 | <1.00e-15 | <3.09e-13 |
| 33 | KIF3B | kinesin family member 3B | 77370 | 4 | 4 | 1 | 0 | 0 | 0 | 0 | 0 | 4 | 0 | 0.0018 | 1 | 2e-07 | 0.00022 | 0 | <1.00e-15 | <3.09e-13 |
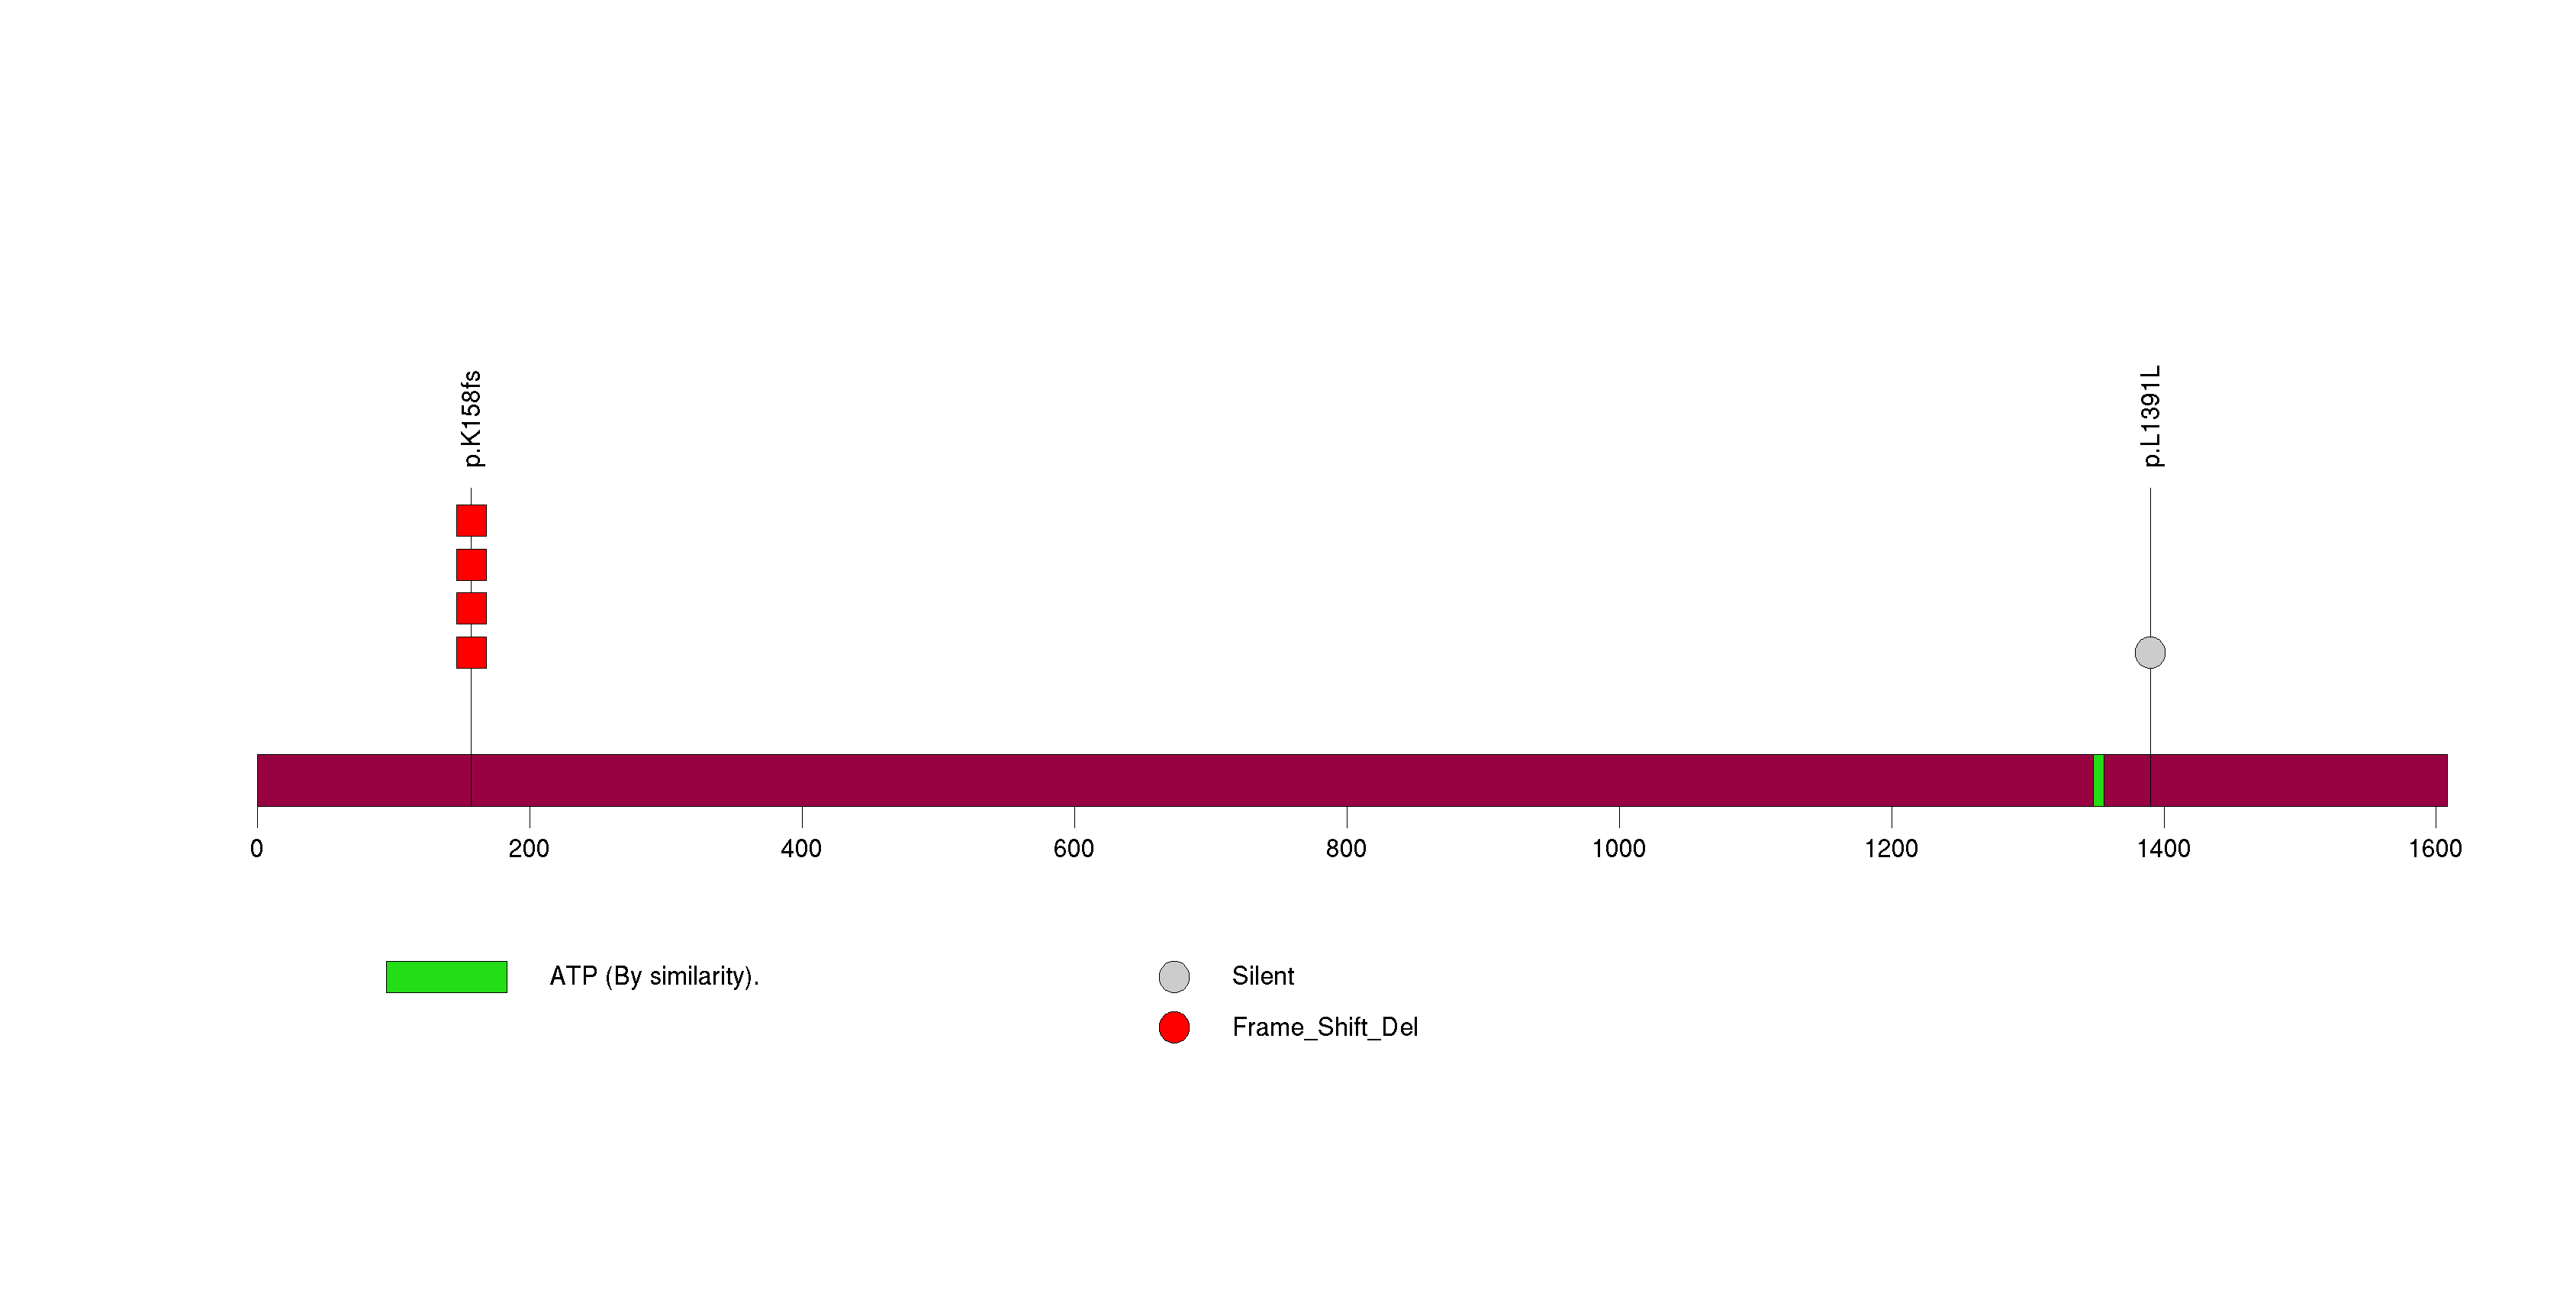
| 34 | MAP3K4 | mitogen-activated protein kinase kinase kinase 4 | 165777 | 4 | 4 | 1 | 1 | 0 | 0 | 0 | 0 | 4 | 0 | 0.018 | 1 | 2e-07 | 0.02 | 0 | <1.00e-15 | <3.09e-13 |
| 35 | OR10A5 | olfactory receptor, family 10, subfamily A, member 5 | 32572 | 4 | 4 | 1 | 0 | 0 | 0 | 0 | 0 | 4 | 0 | 0.00011 | 1 | 4e-07 | 0.054 | 0 | <1.00e-15 | <3.09e-13 |
Figure S1. This figure depicts the distribution of mutations and mutation types across the TP53 significant gene.
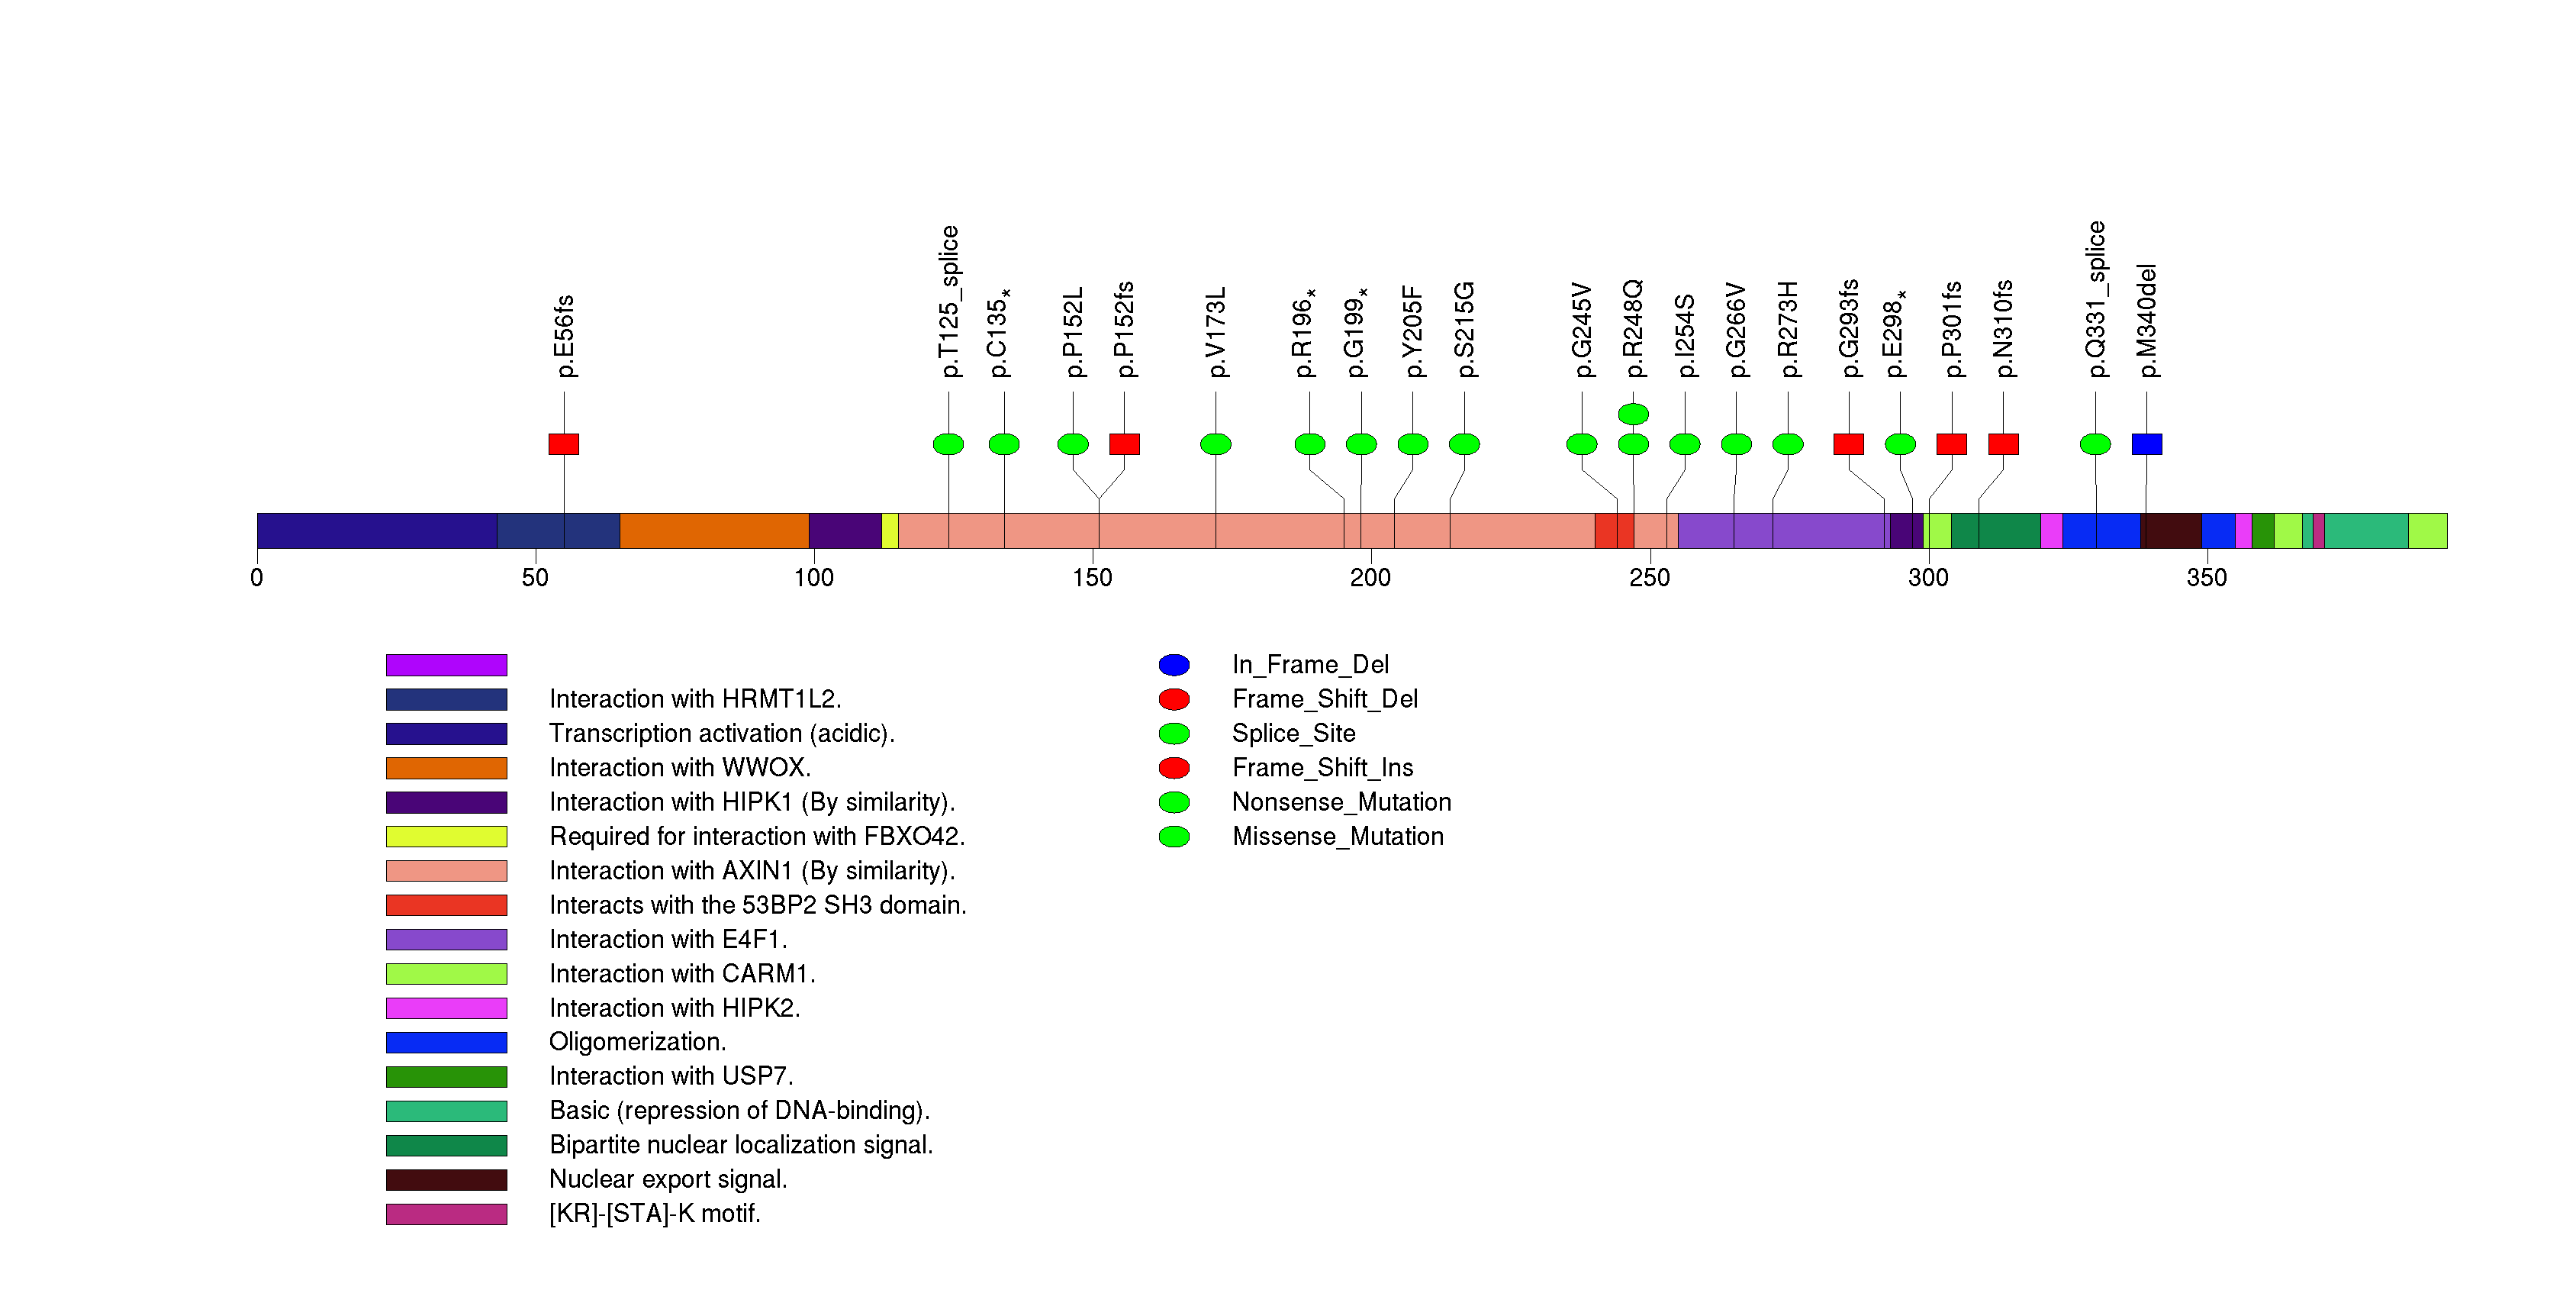
Figure S2. This figure depicts the distribution of mutations and mutation types across the KRAS significant gene.
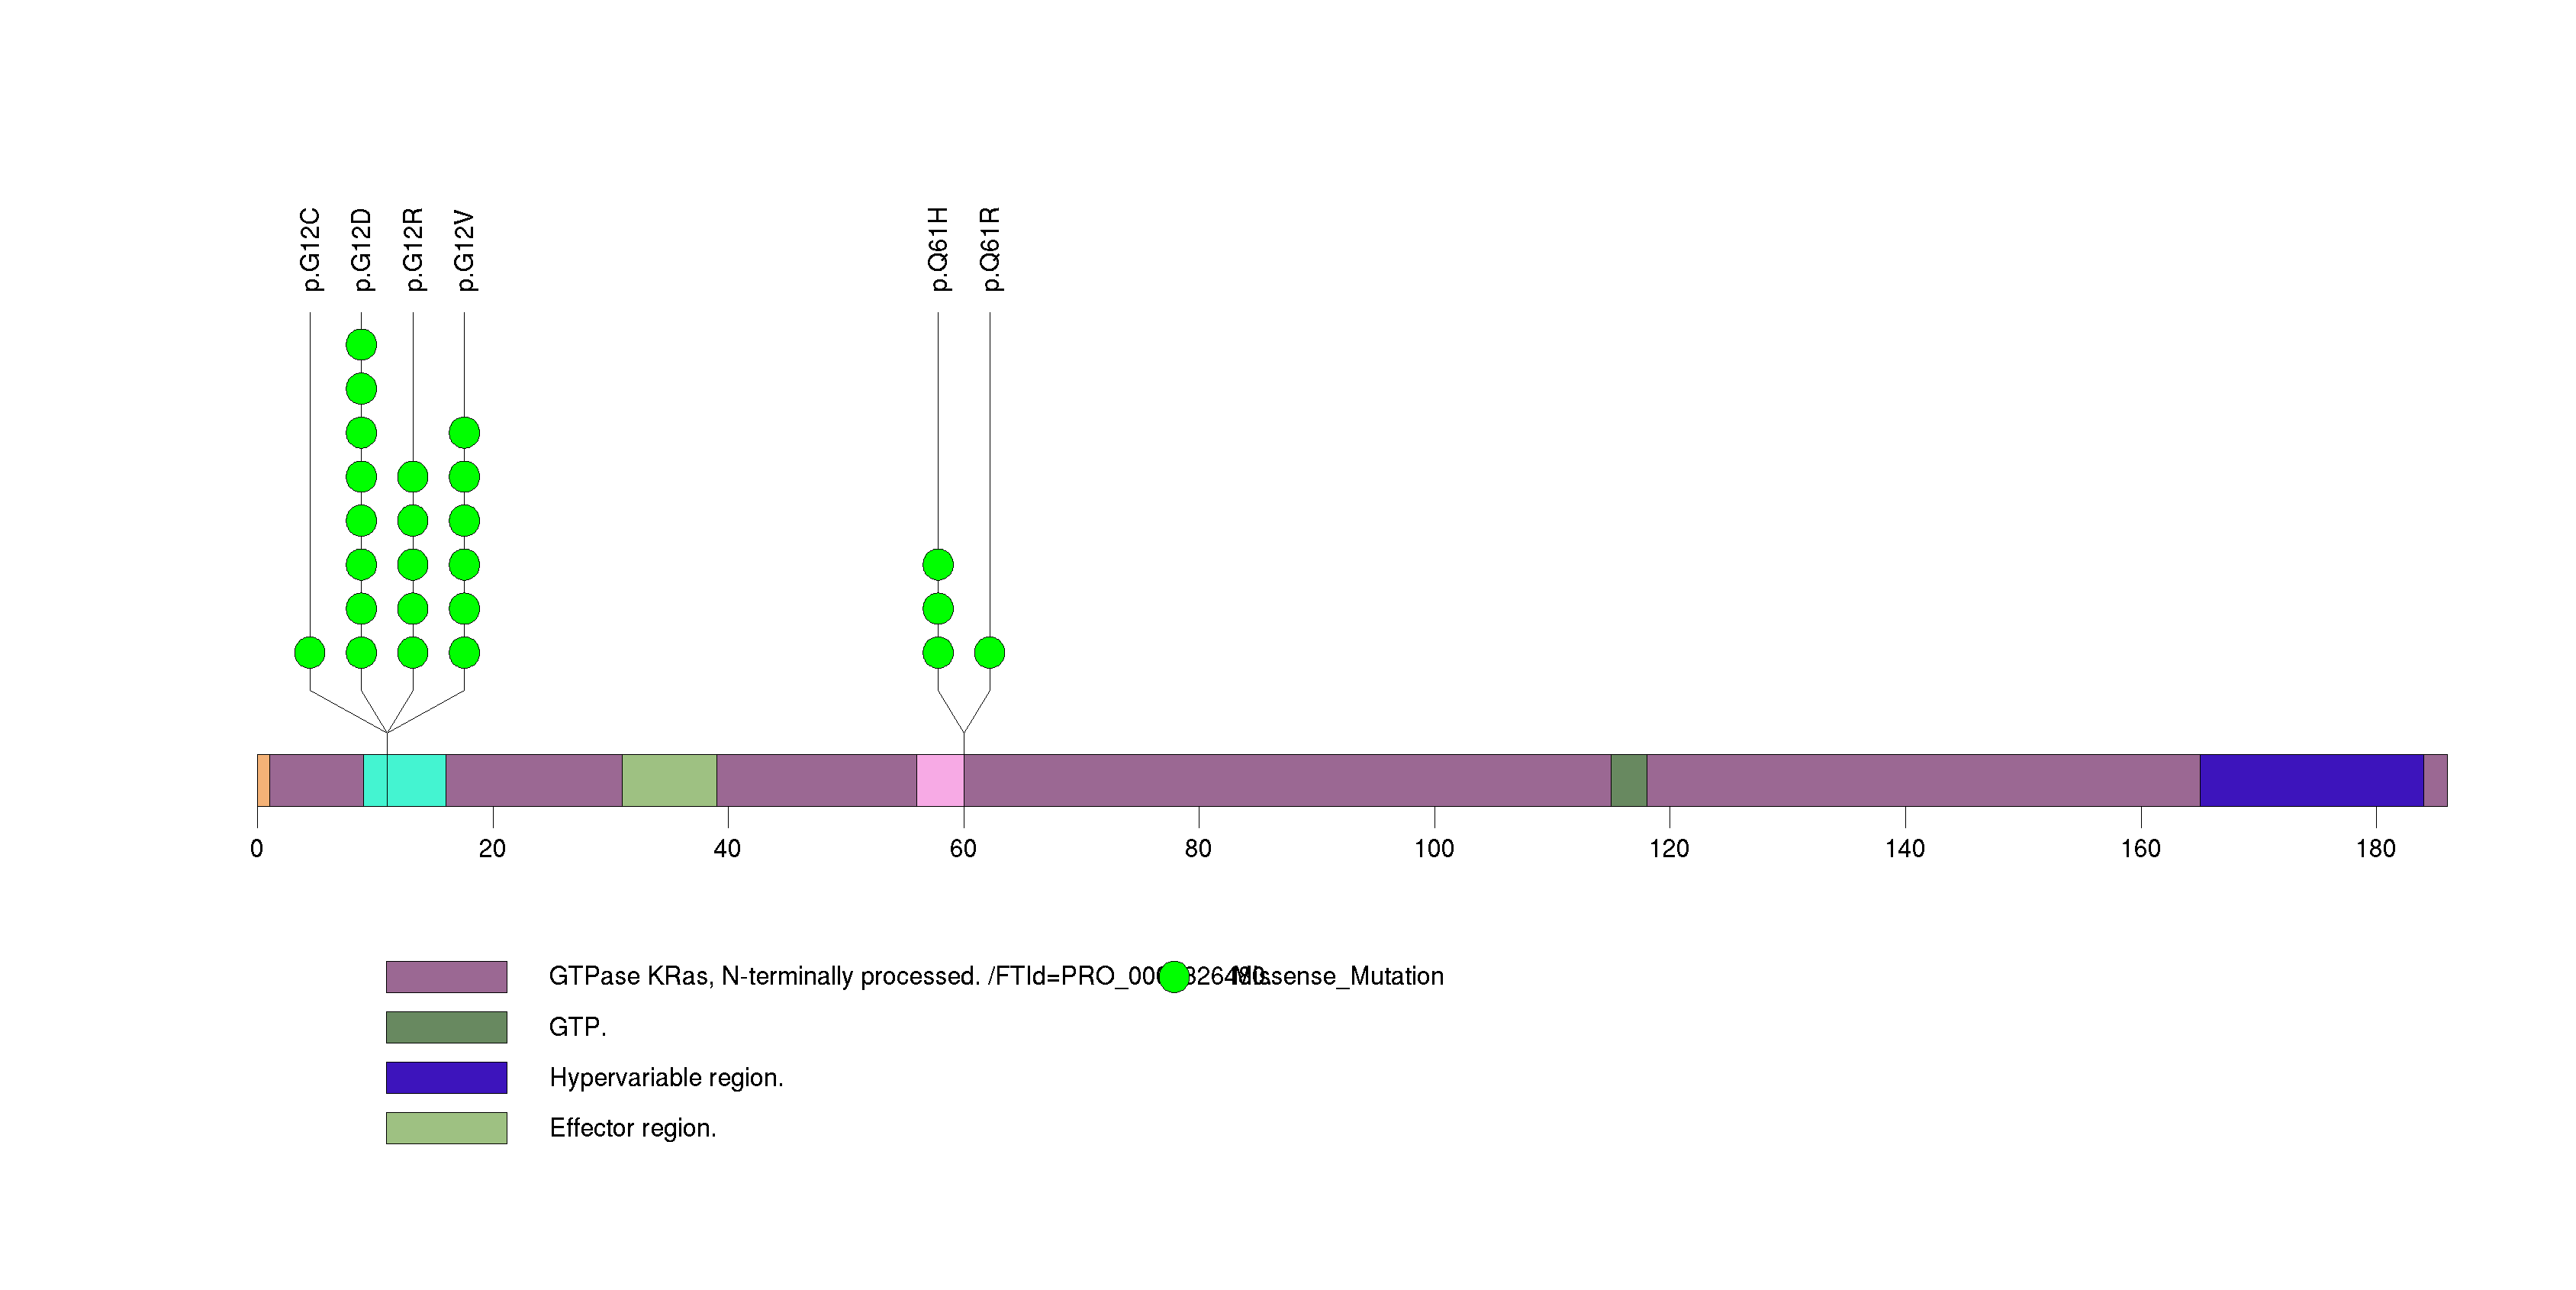
Figure S3. This figure depicts the distribution of mutations and mutation types across the DLC1 significant gene.
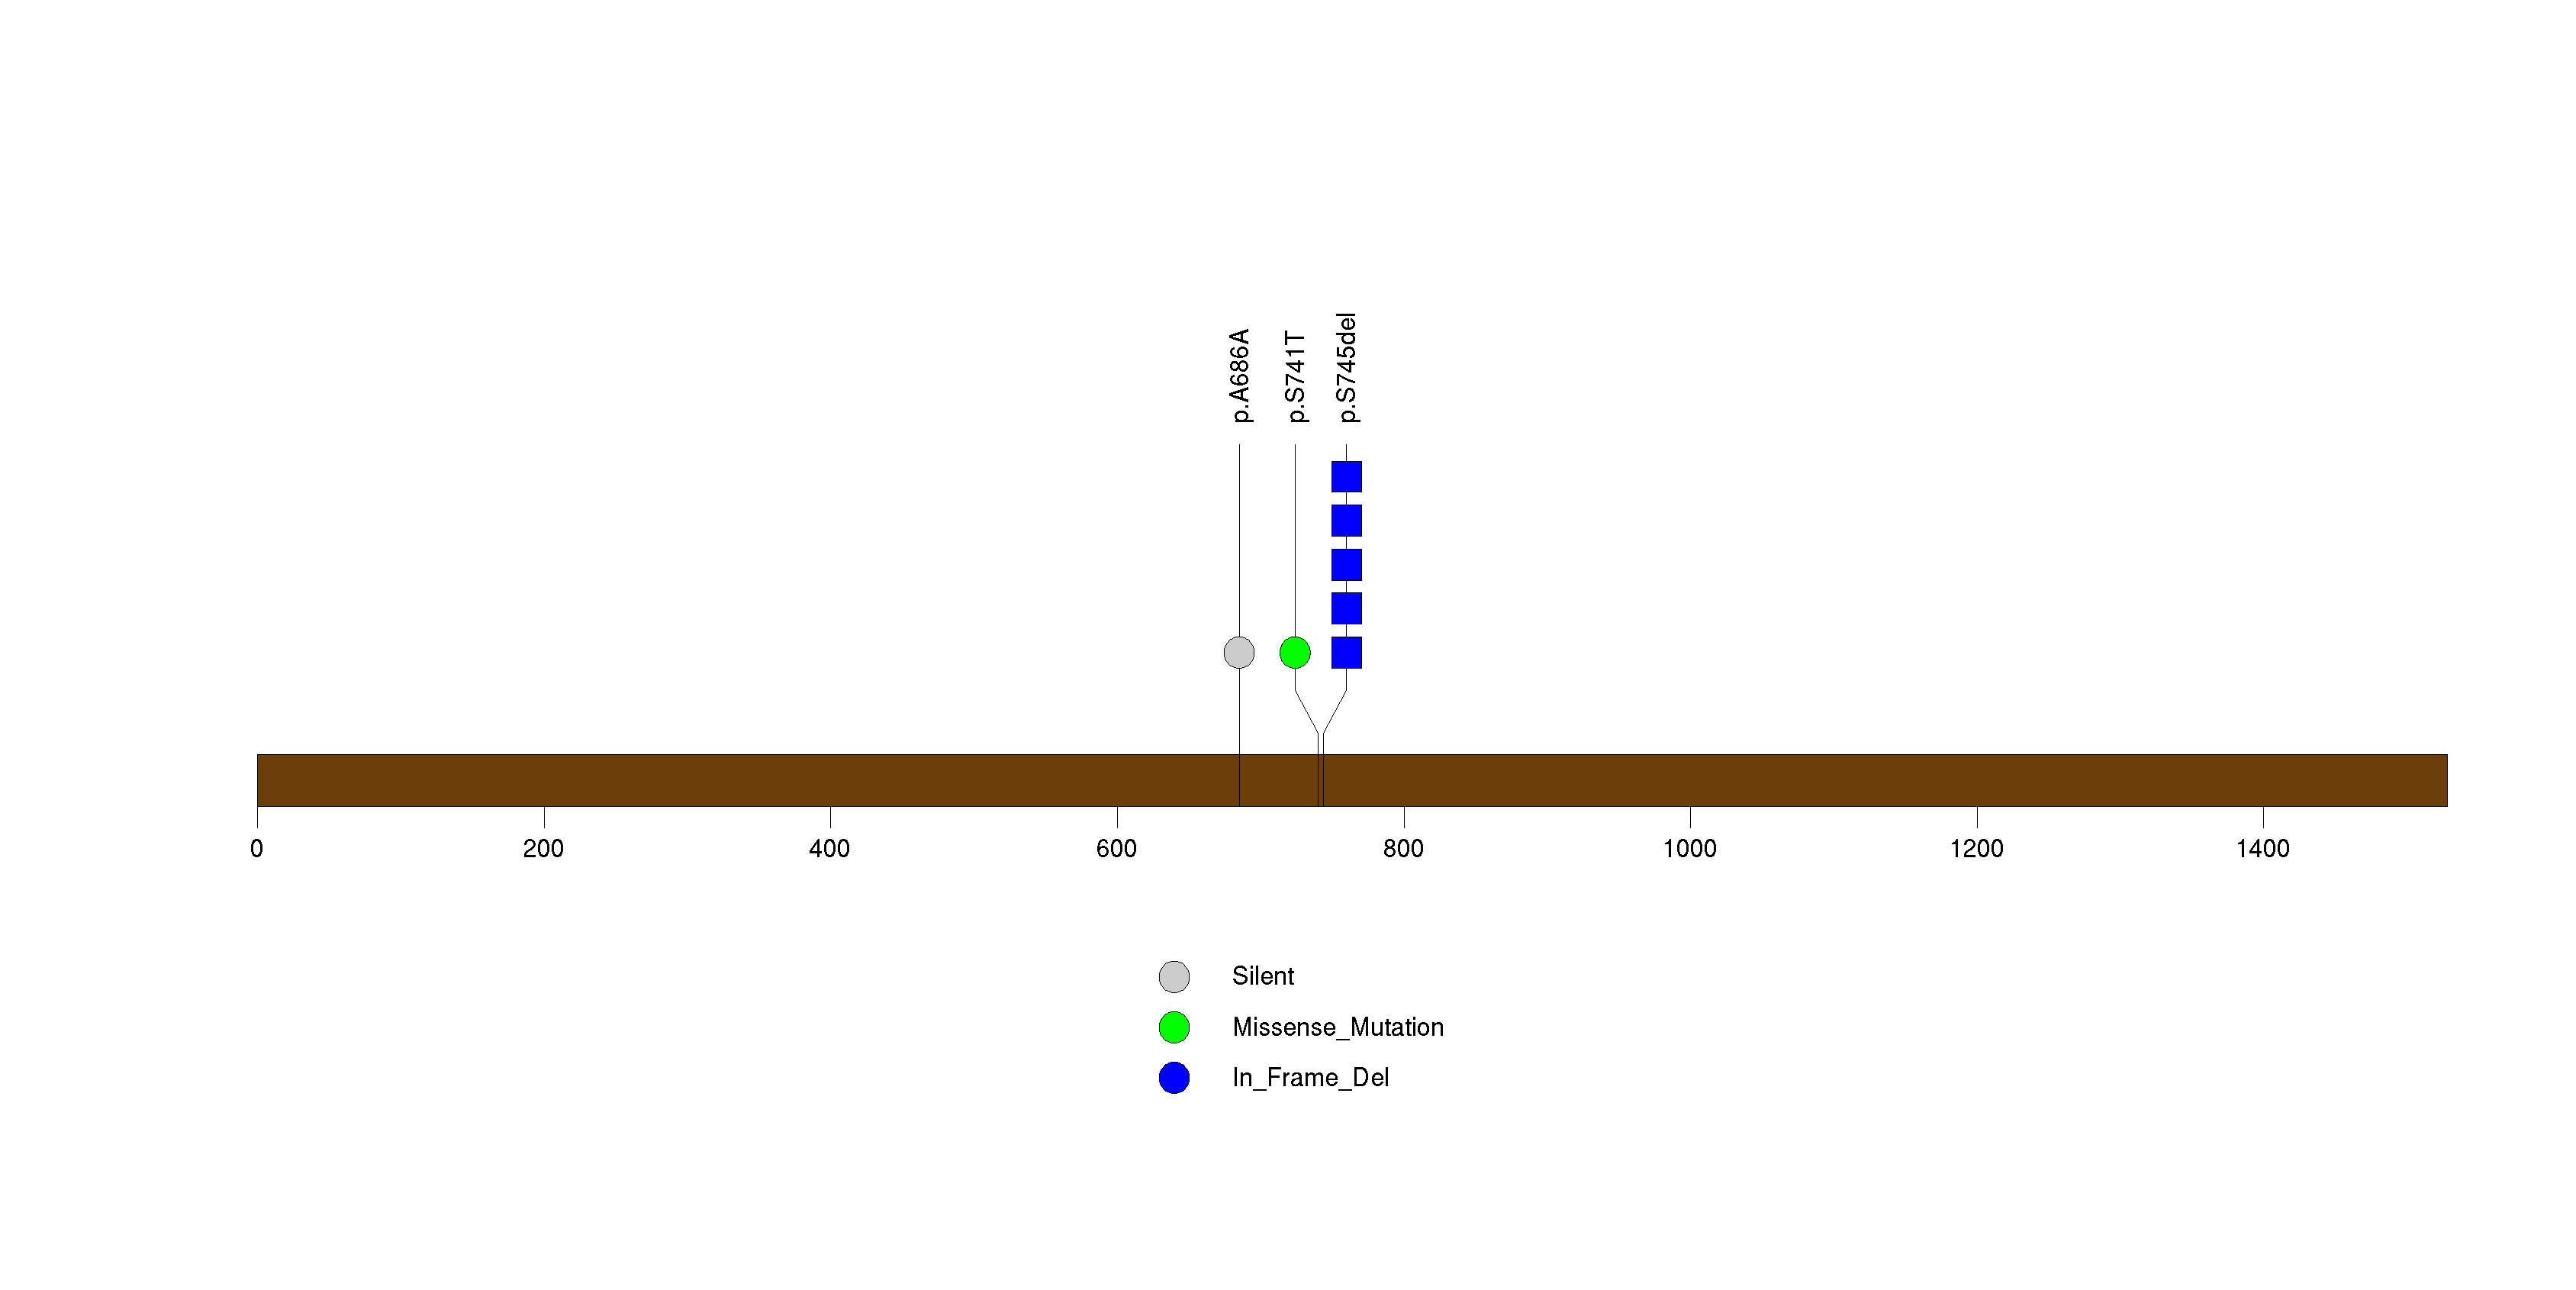
Figure S4. This figure depicts the distribution of mutations and mutation types across the HMGB2 significant gene.
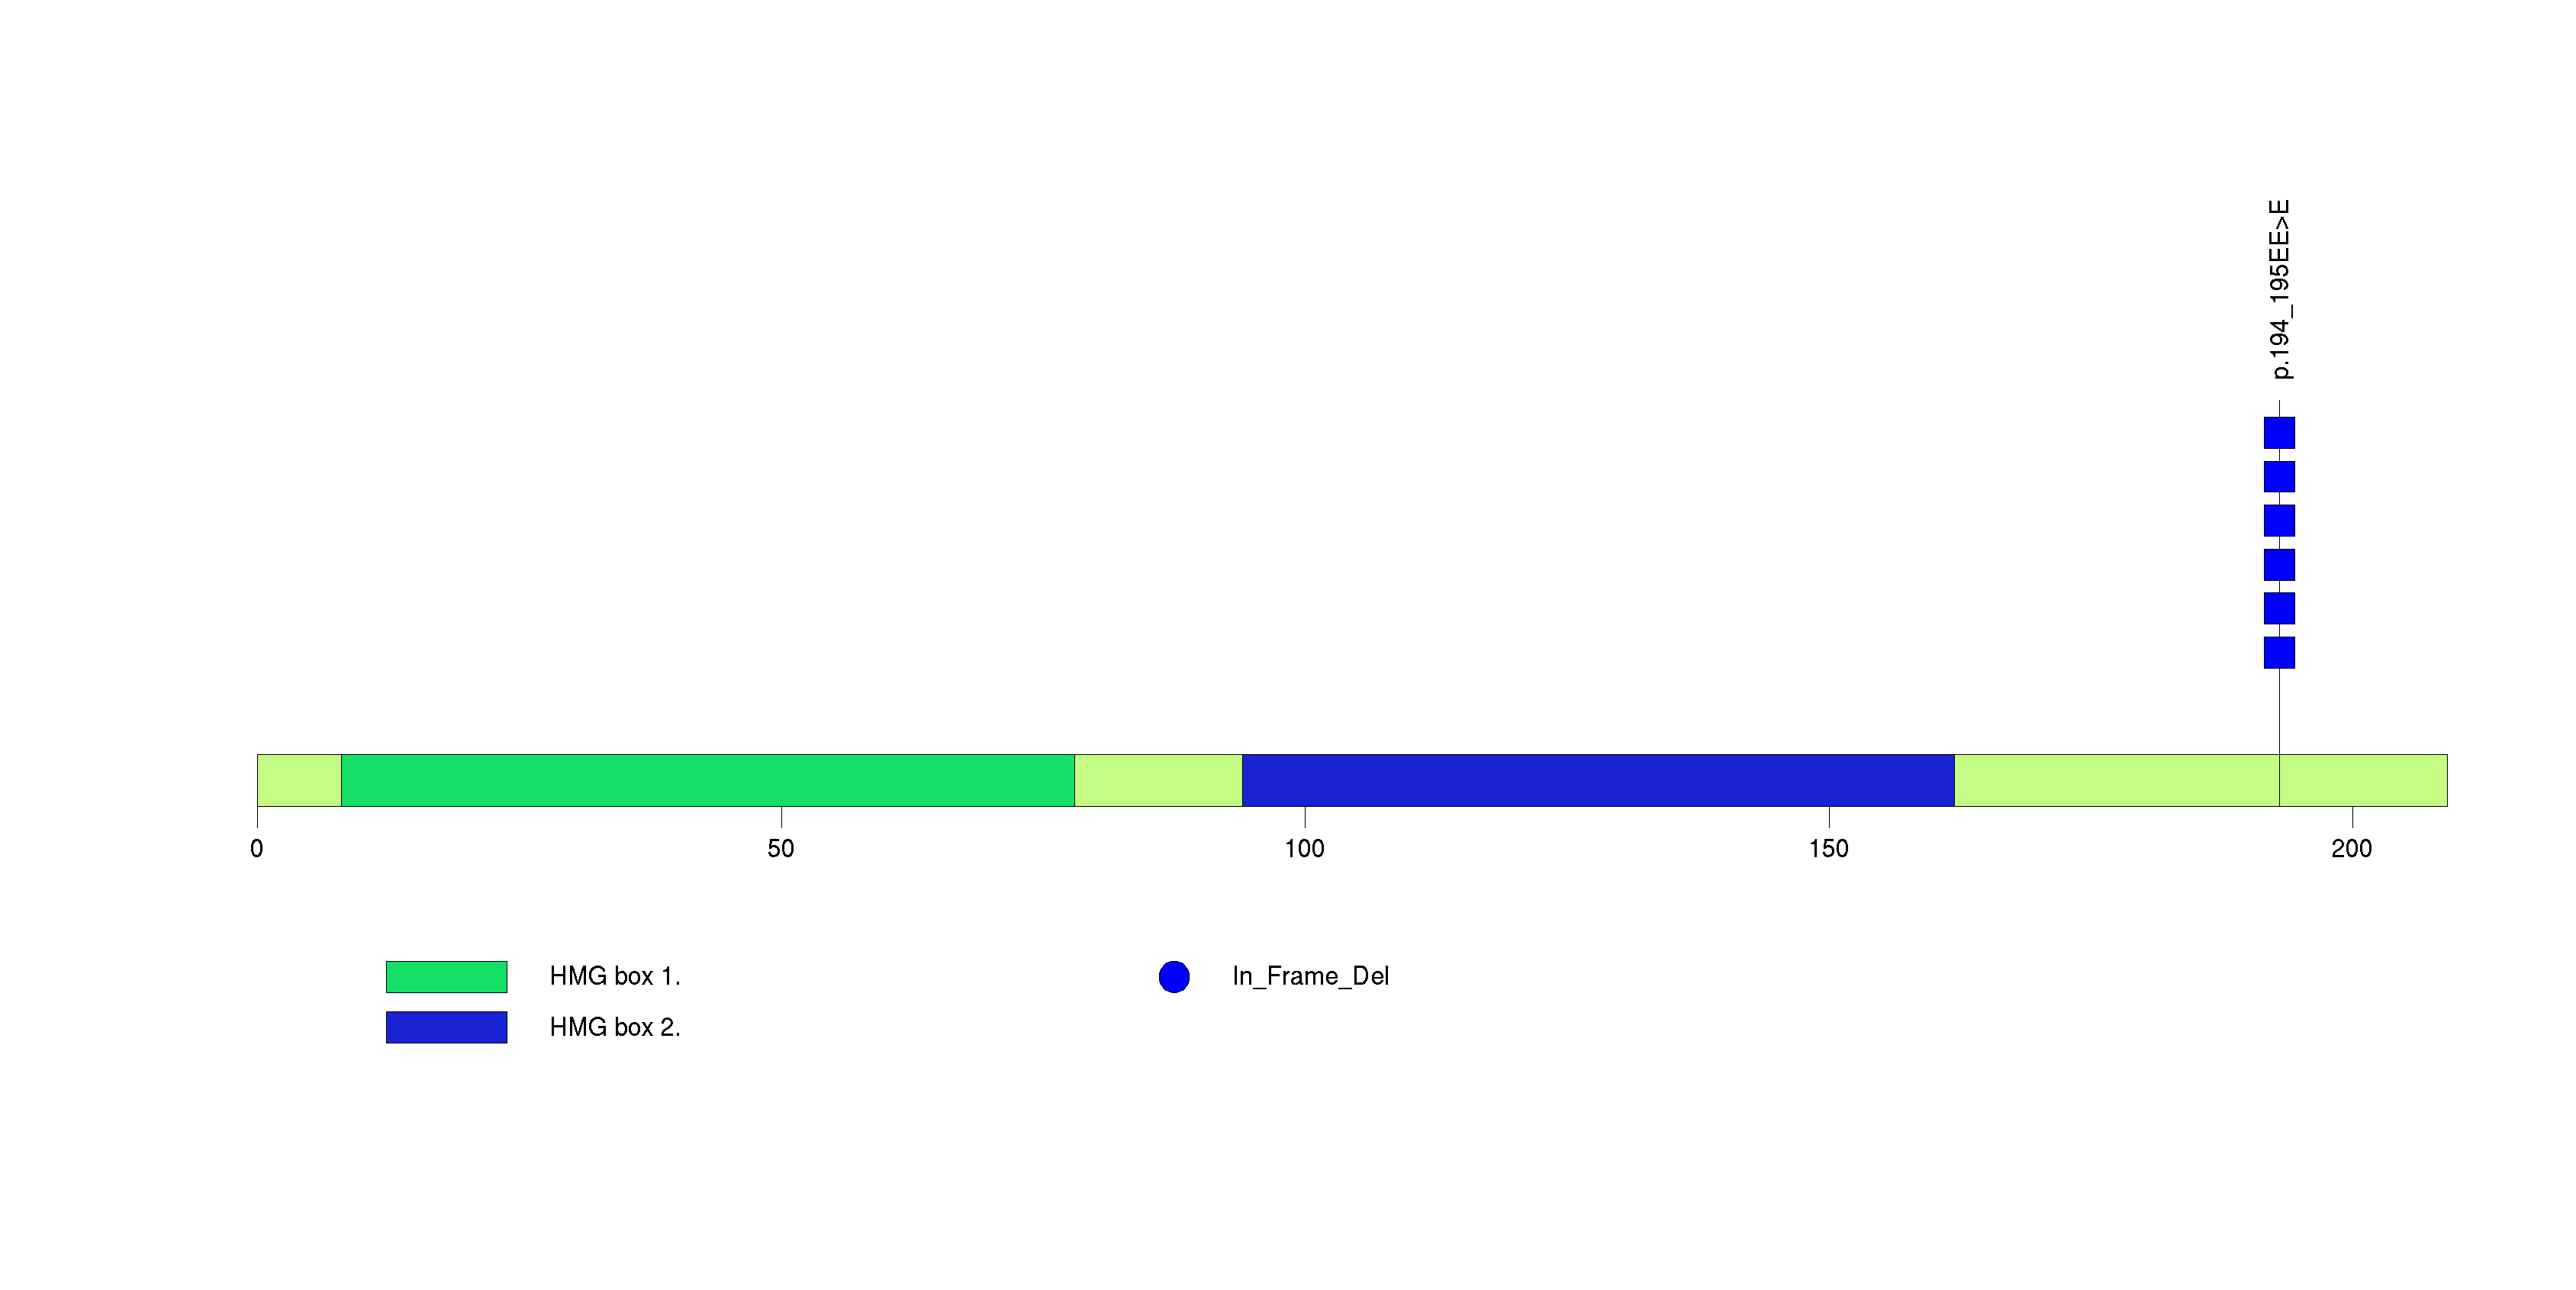
Figure S5. This figure depicts the distribution of mutations and mutation types across the HOXB2 significant gene.
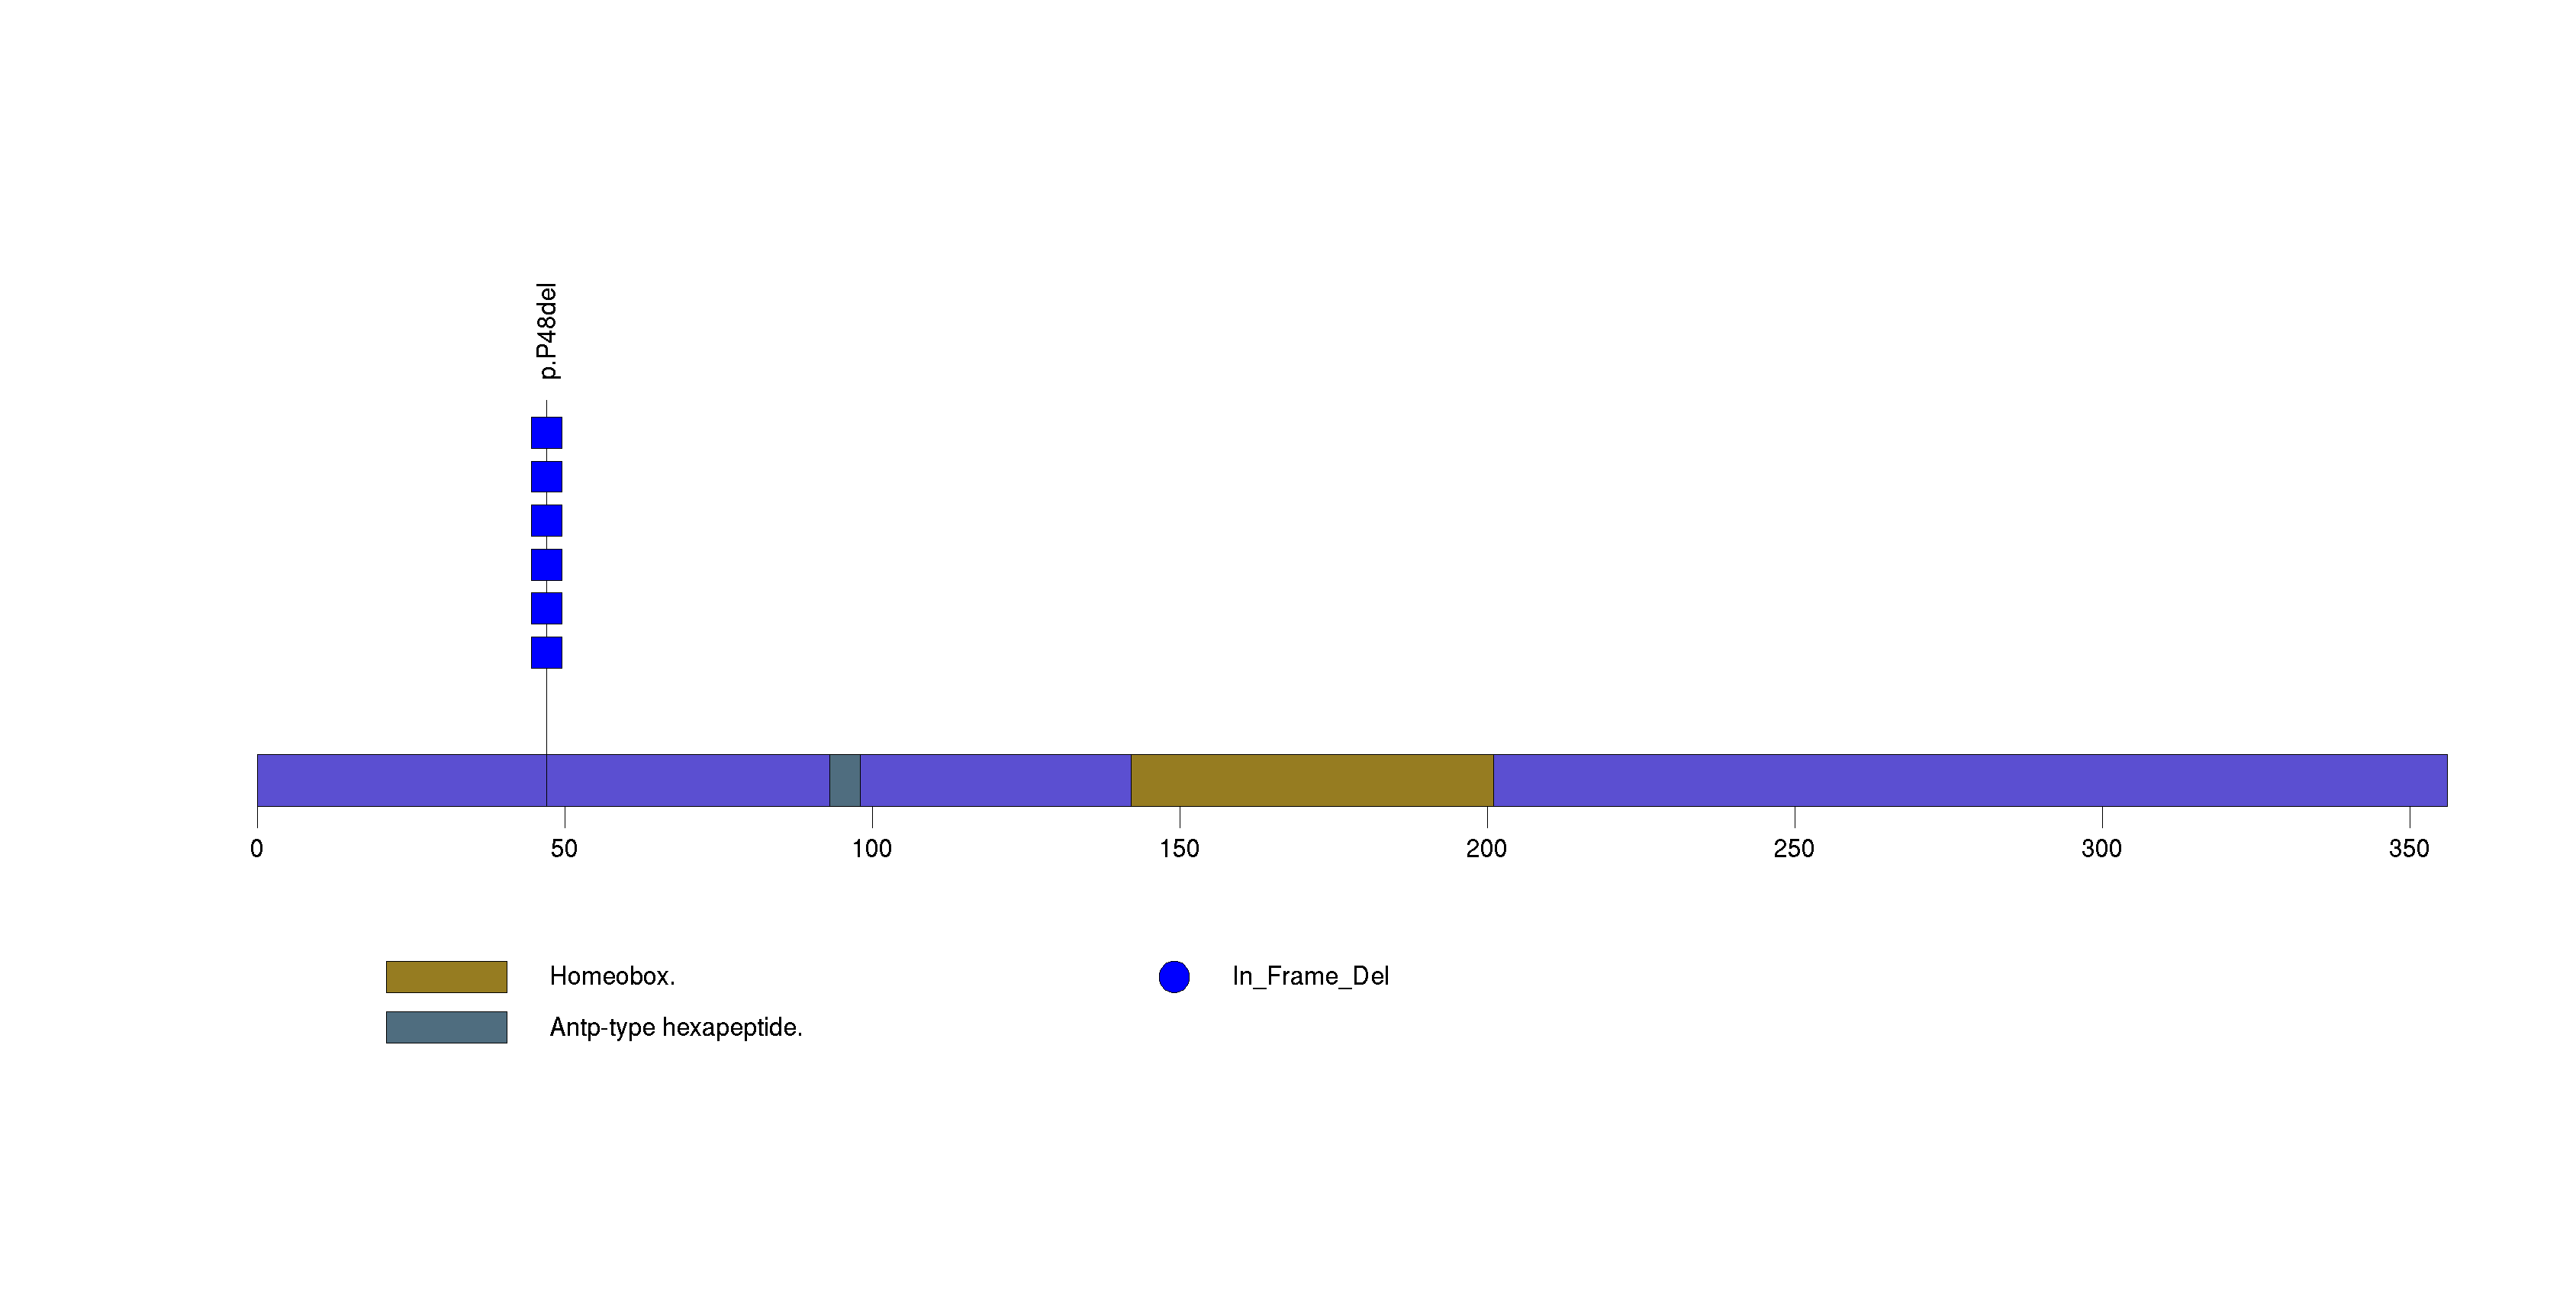
Figure S6. This figure depicts the distribution of mutations and mutation types across the NLRP6 significant gene.
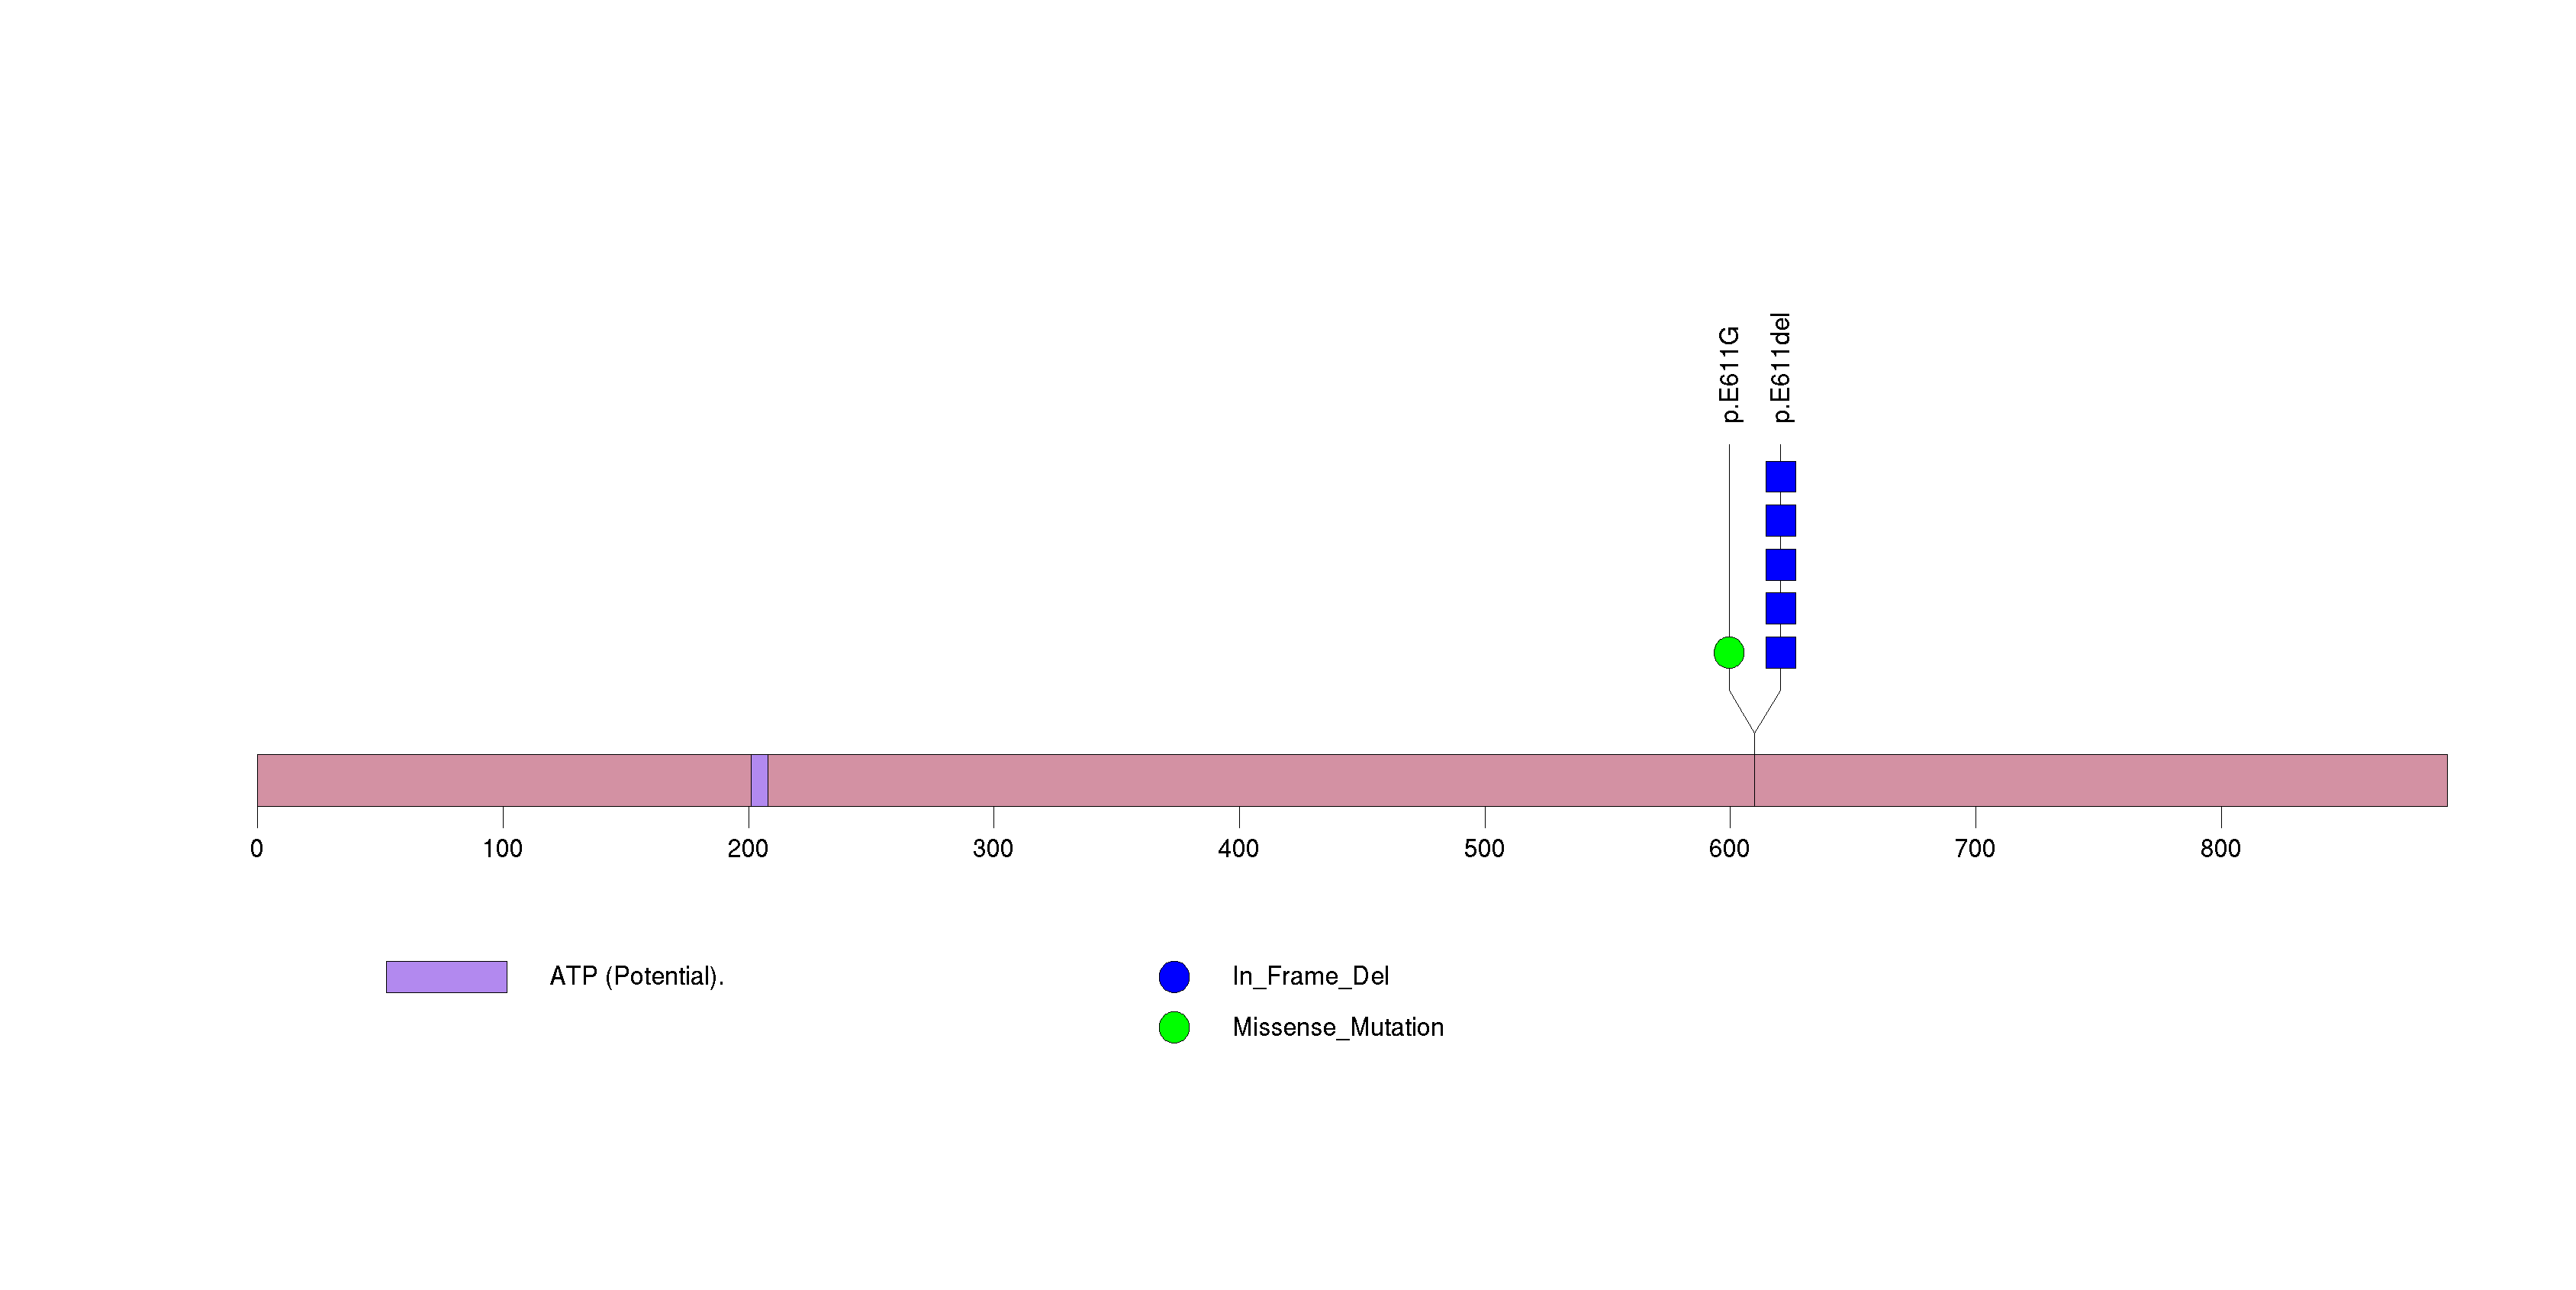
Figure S7. This figure depicts the distribution of mutations and mutation types across the SPDYE5 significant gene.
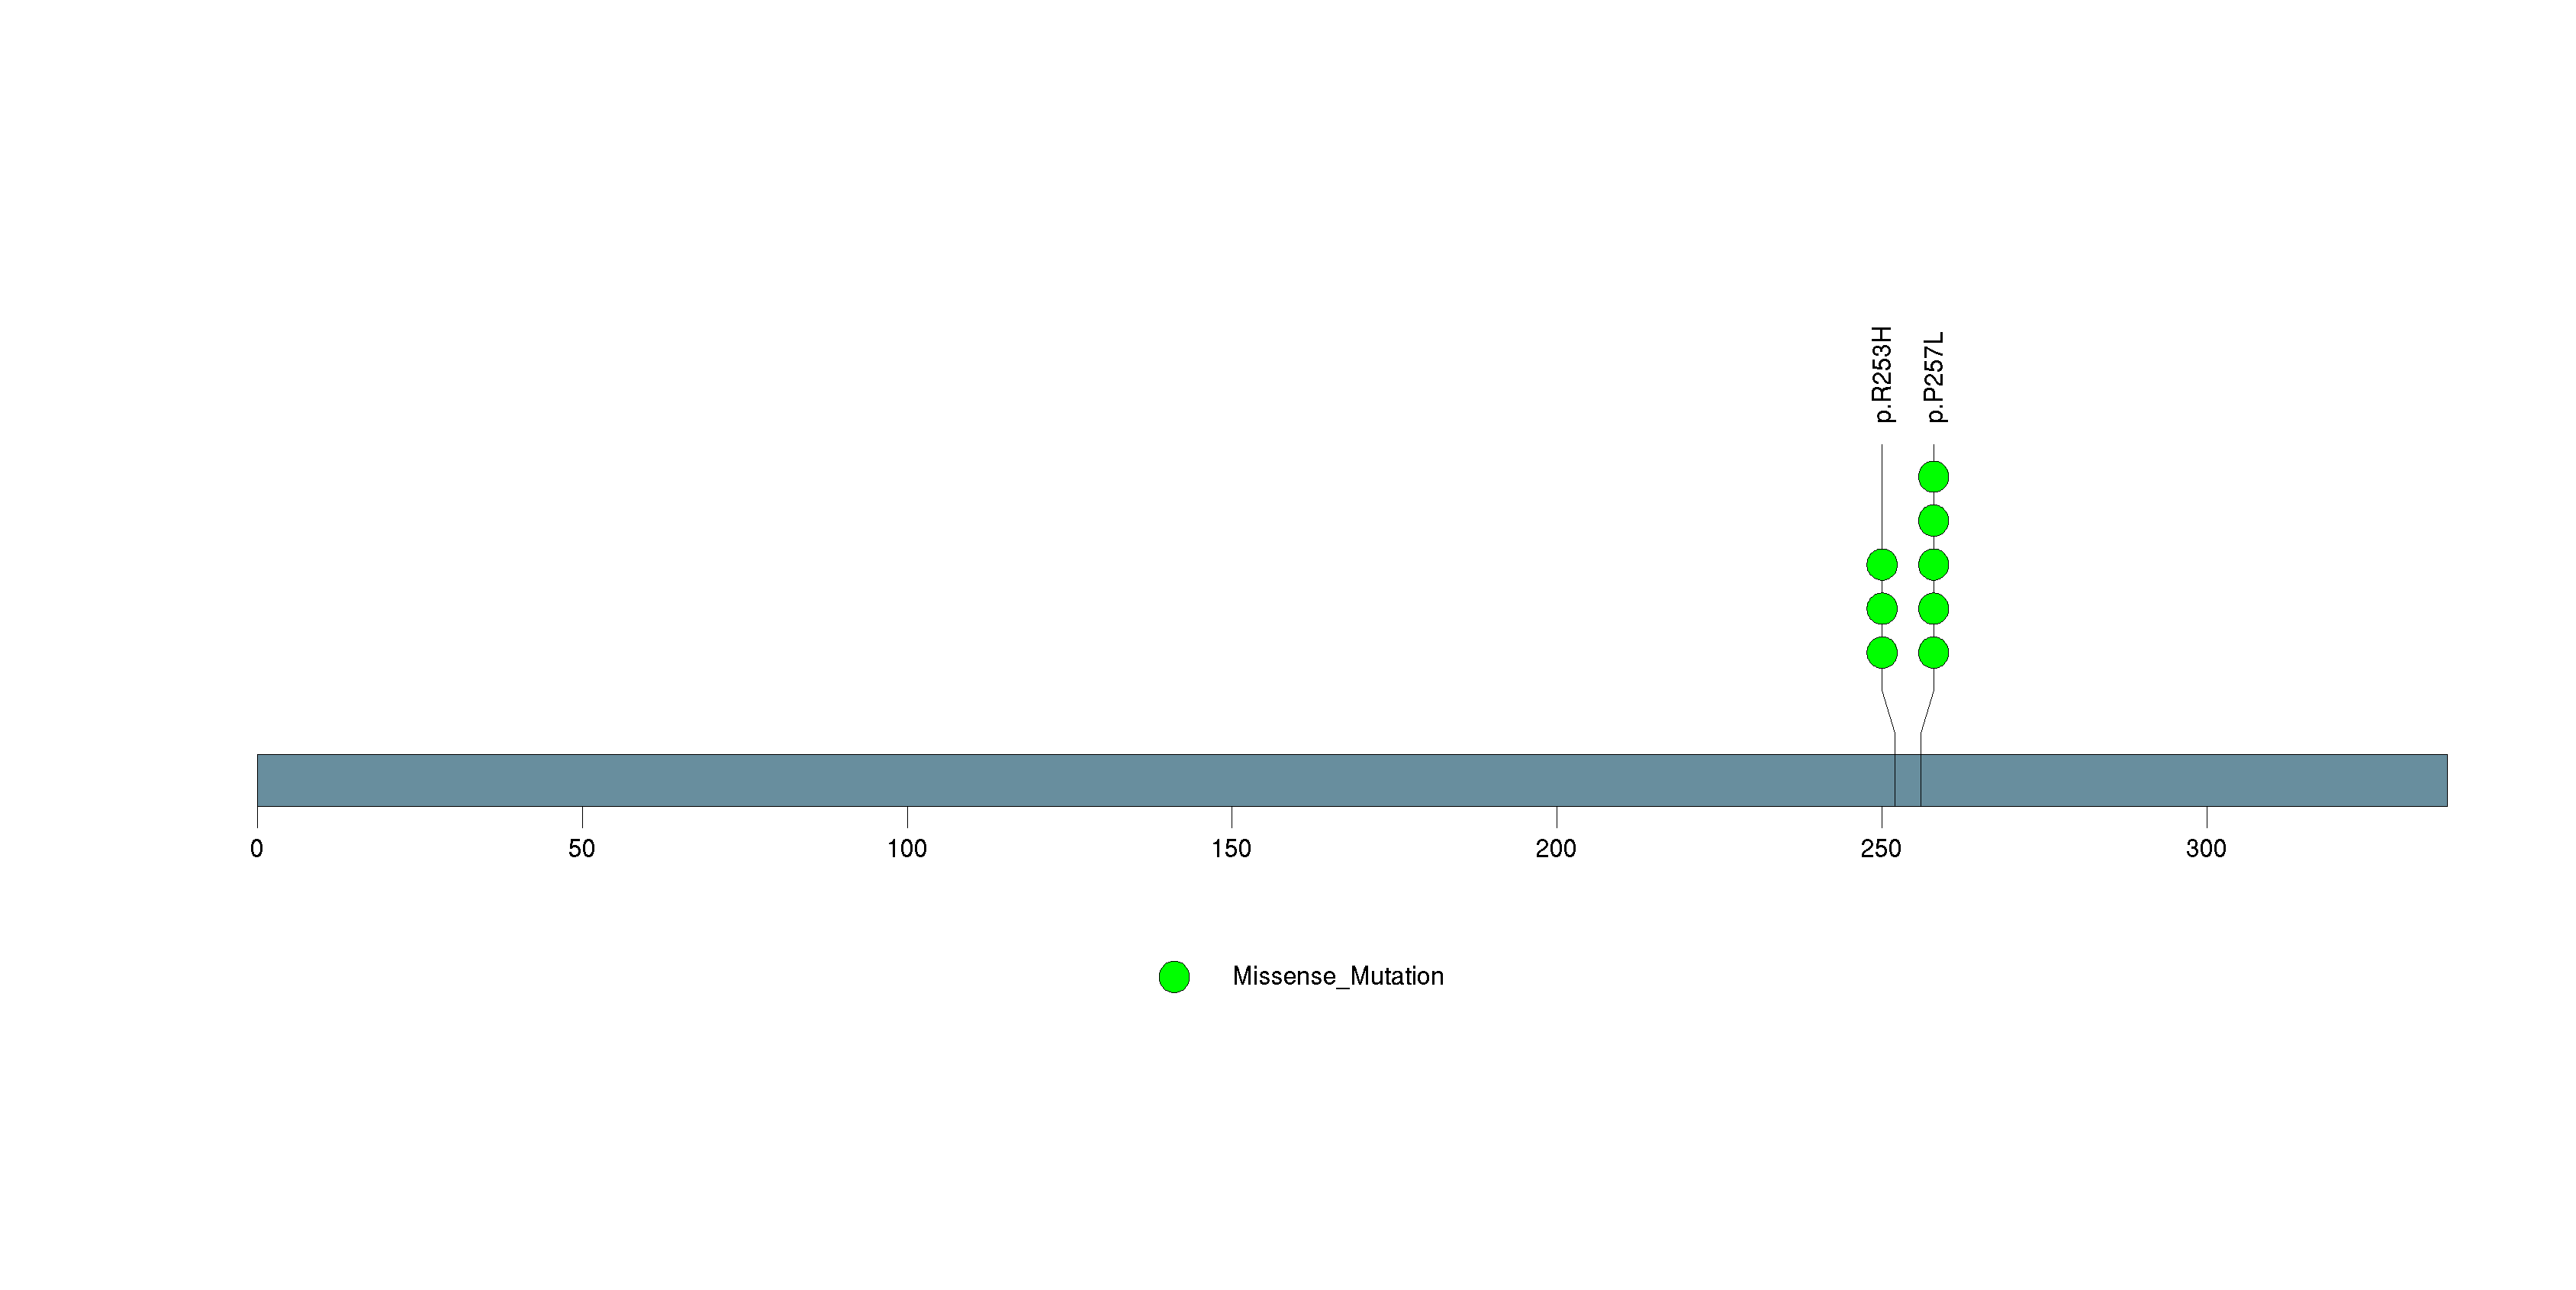
Figure S8. This figure depicts the distribution of mutations and mutation types across the TREML2 significant gene.
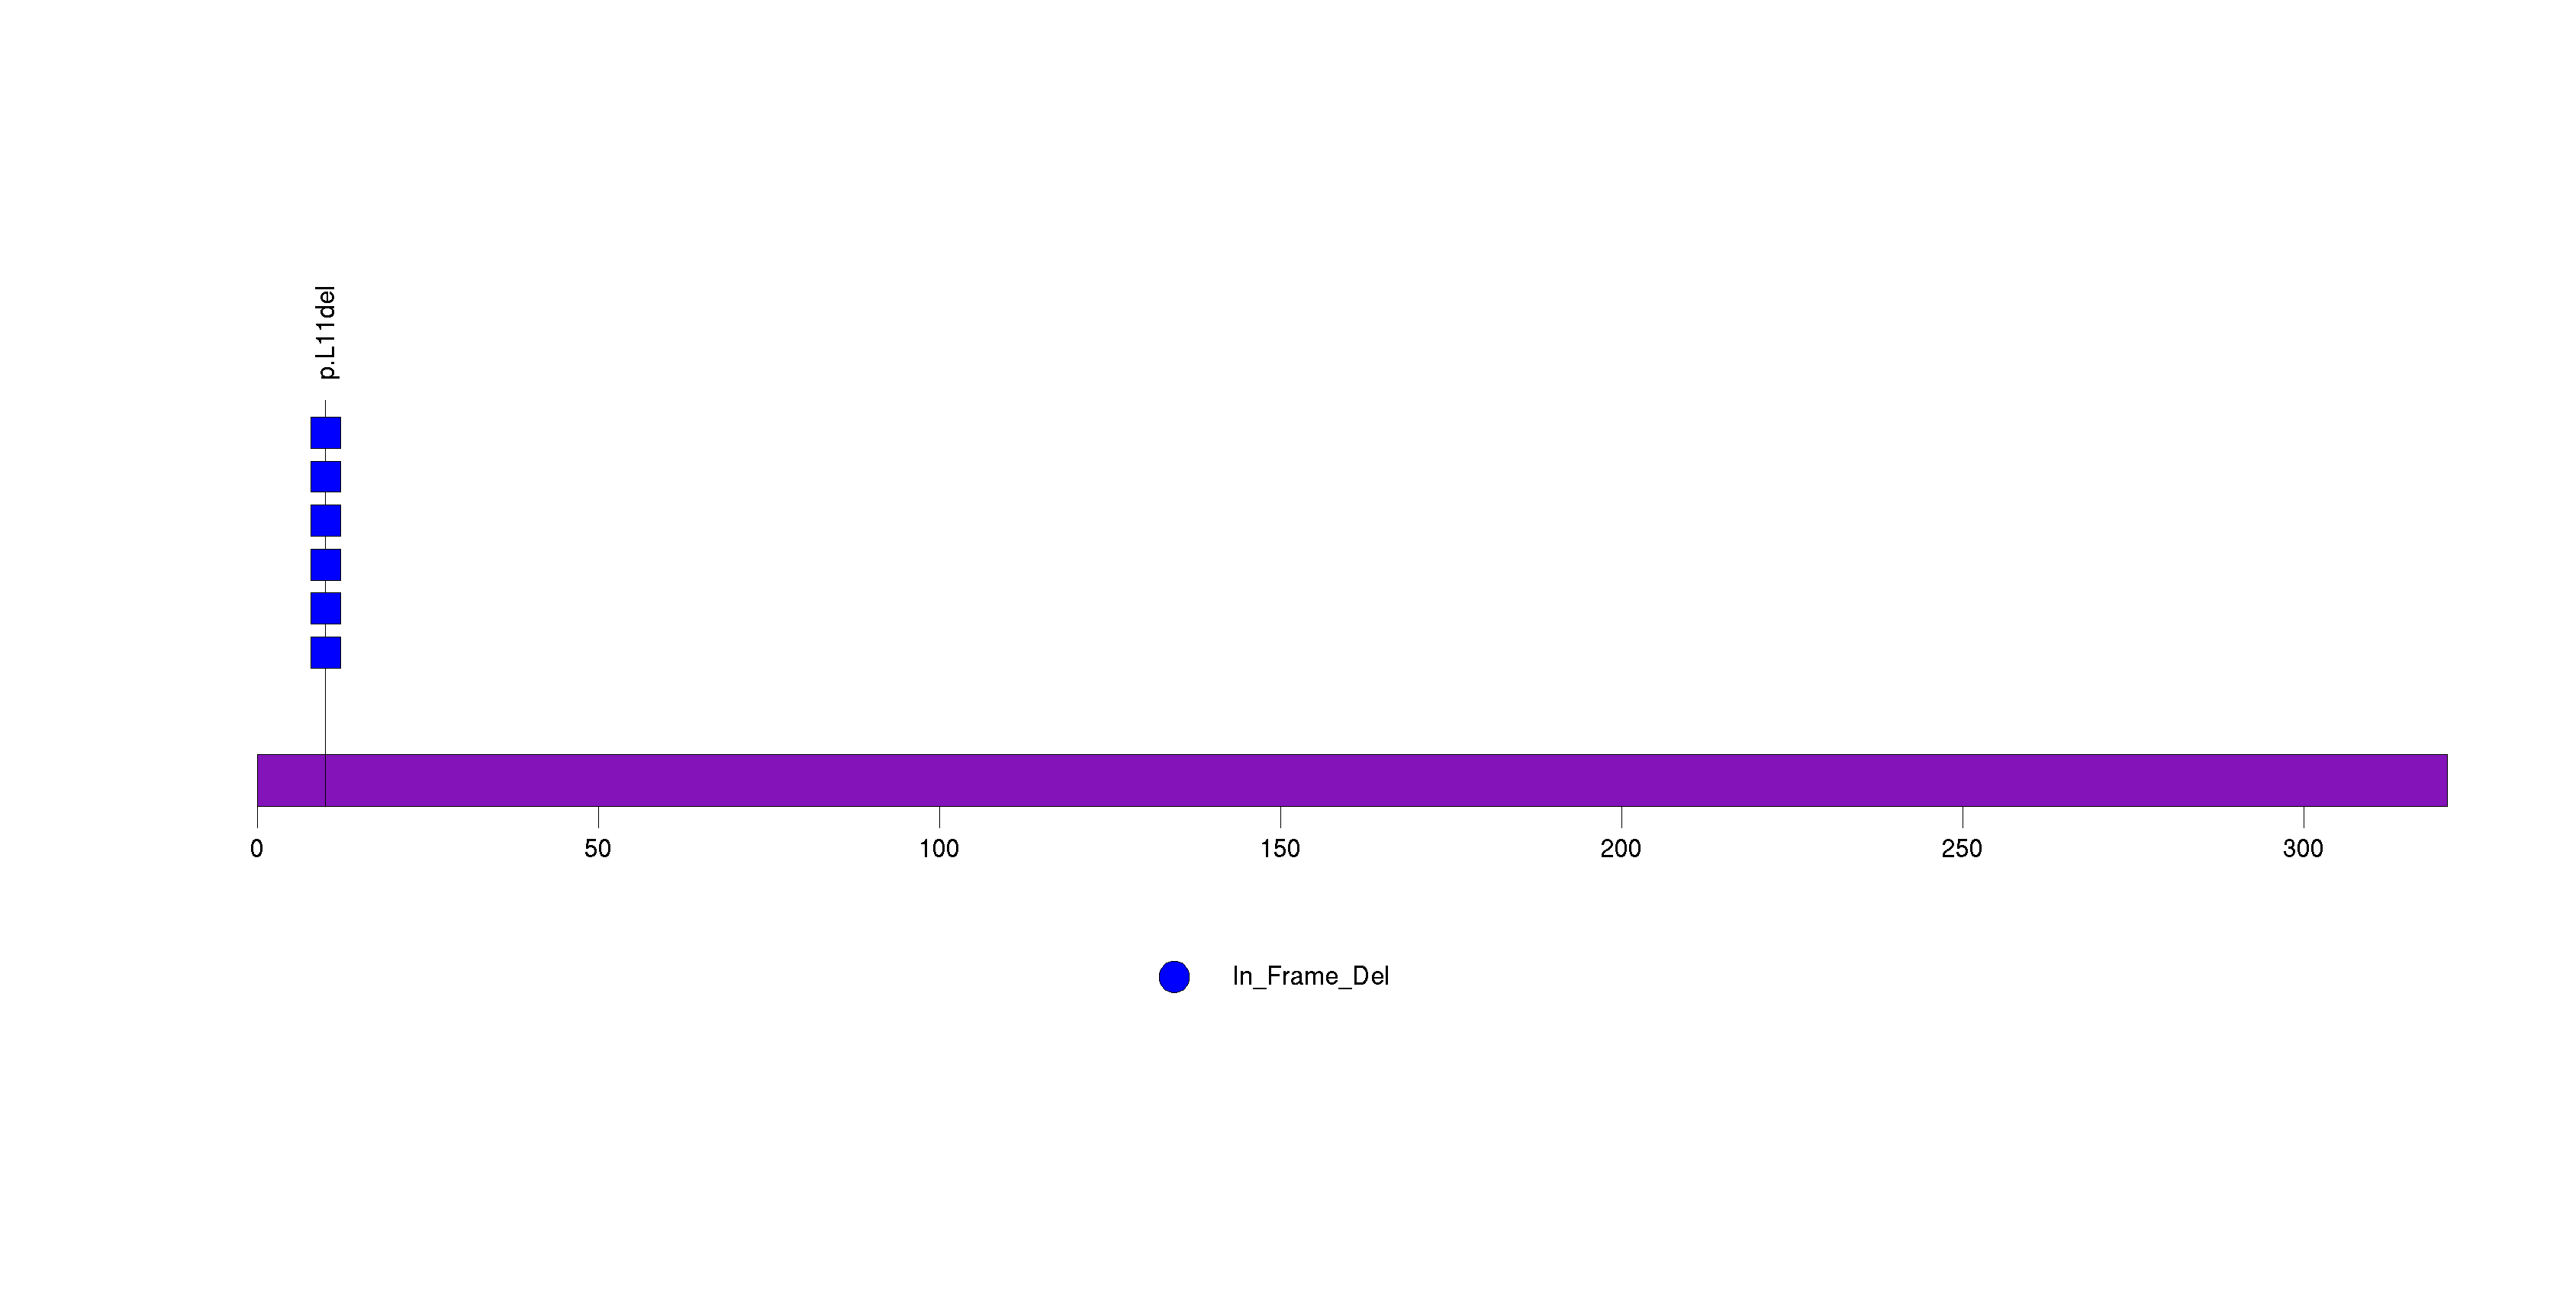
Figure S9. This figure depicts the distribution of mutations and mutation types across the UTP3 significant gene.
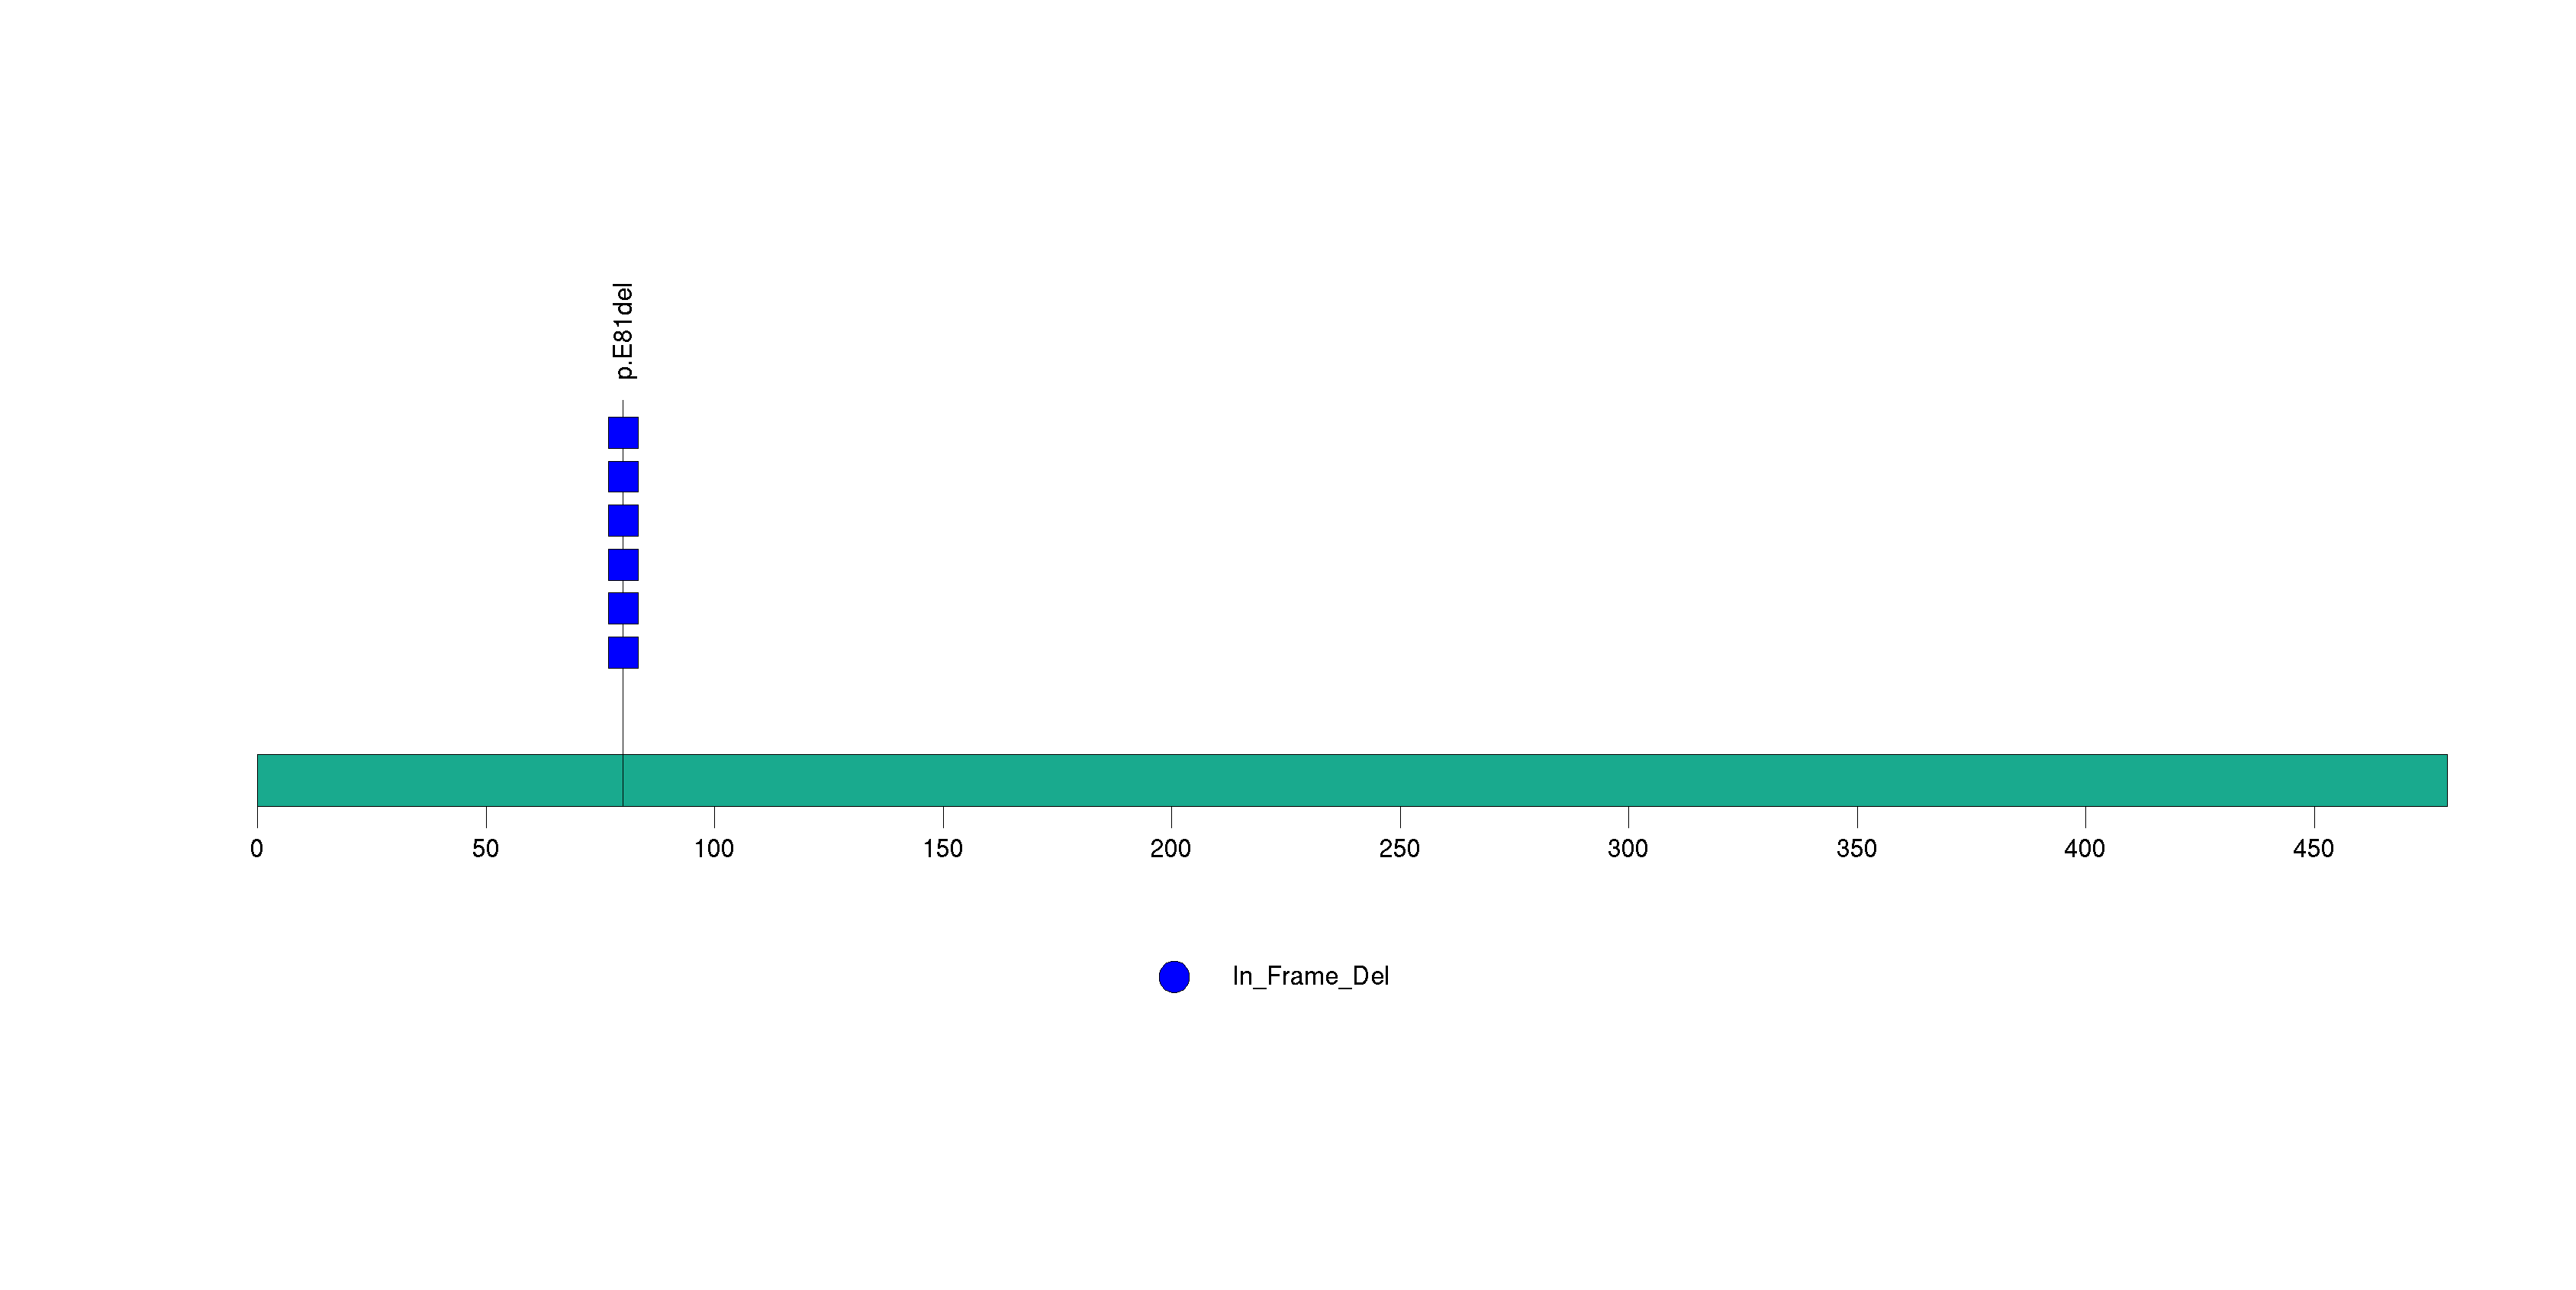
Figure S10. This figure depicts the distribution of mutations and mutation types across the DAB2IP significant gene.
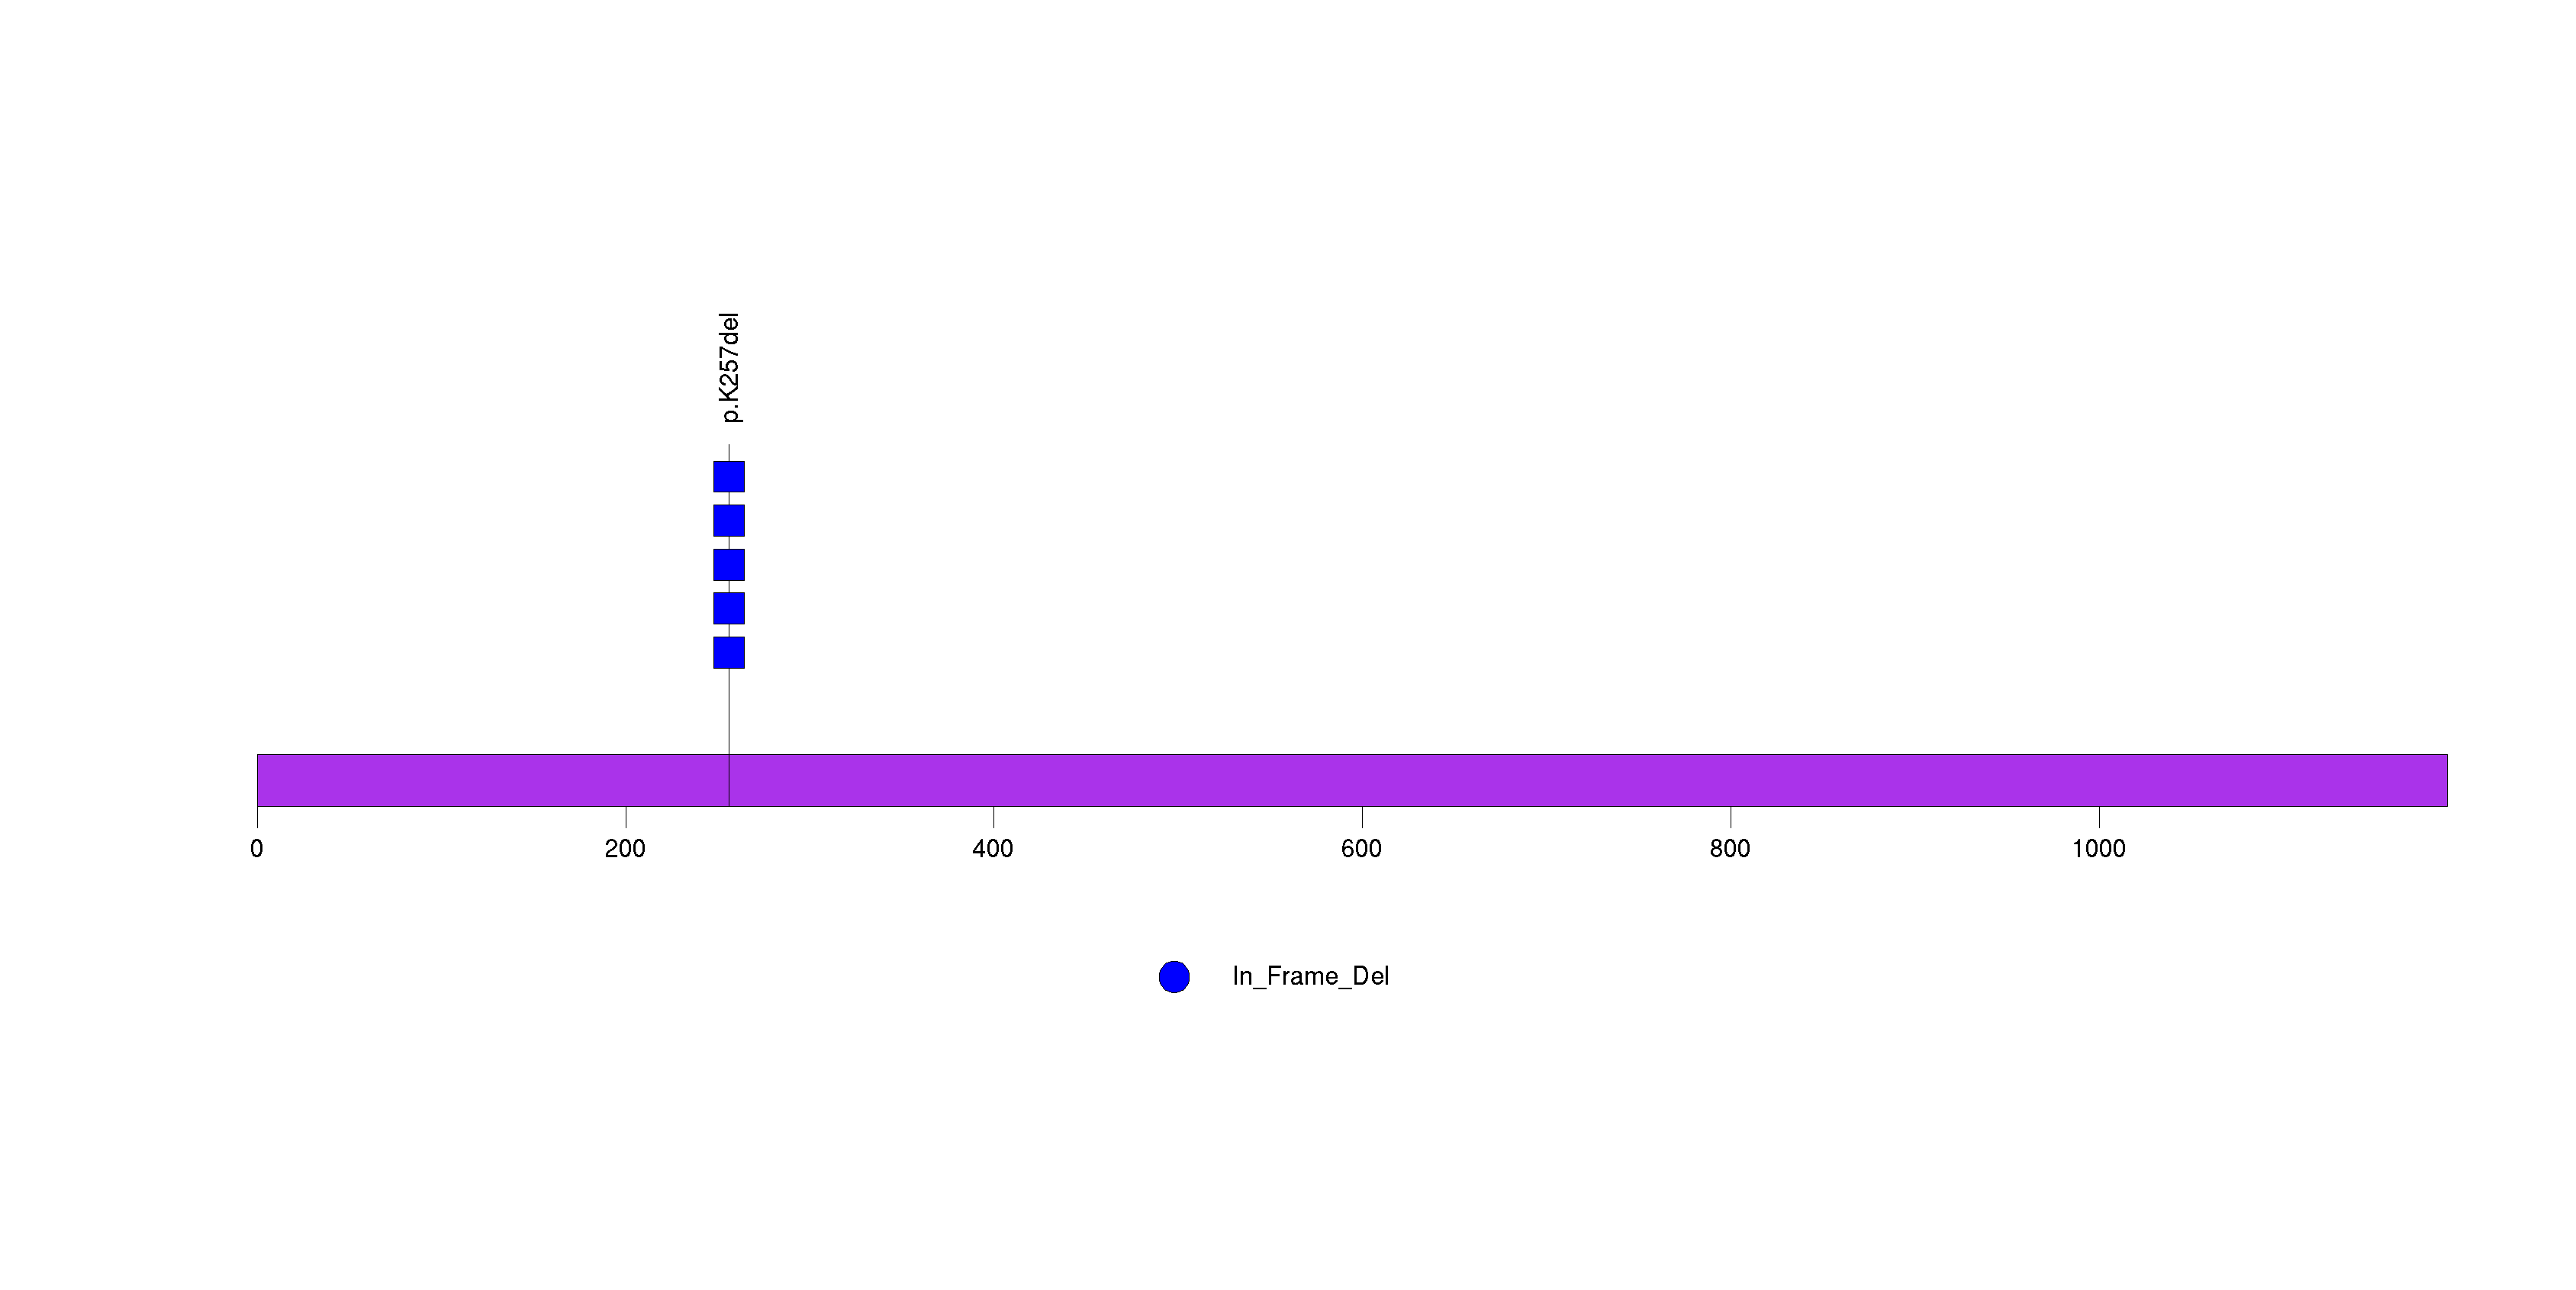
Figure S11. This figure depicts the distribution of mutations and mutation types across the FADS2 significant gene.
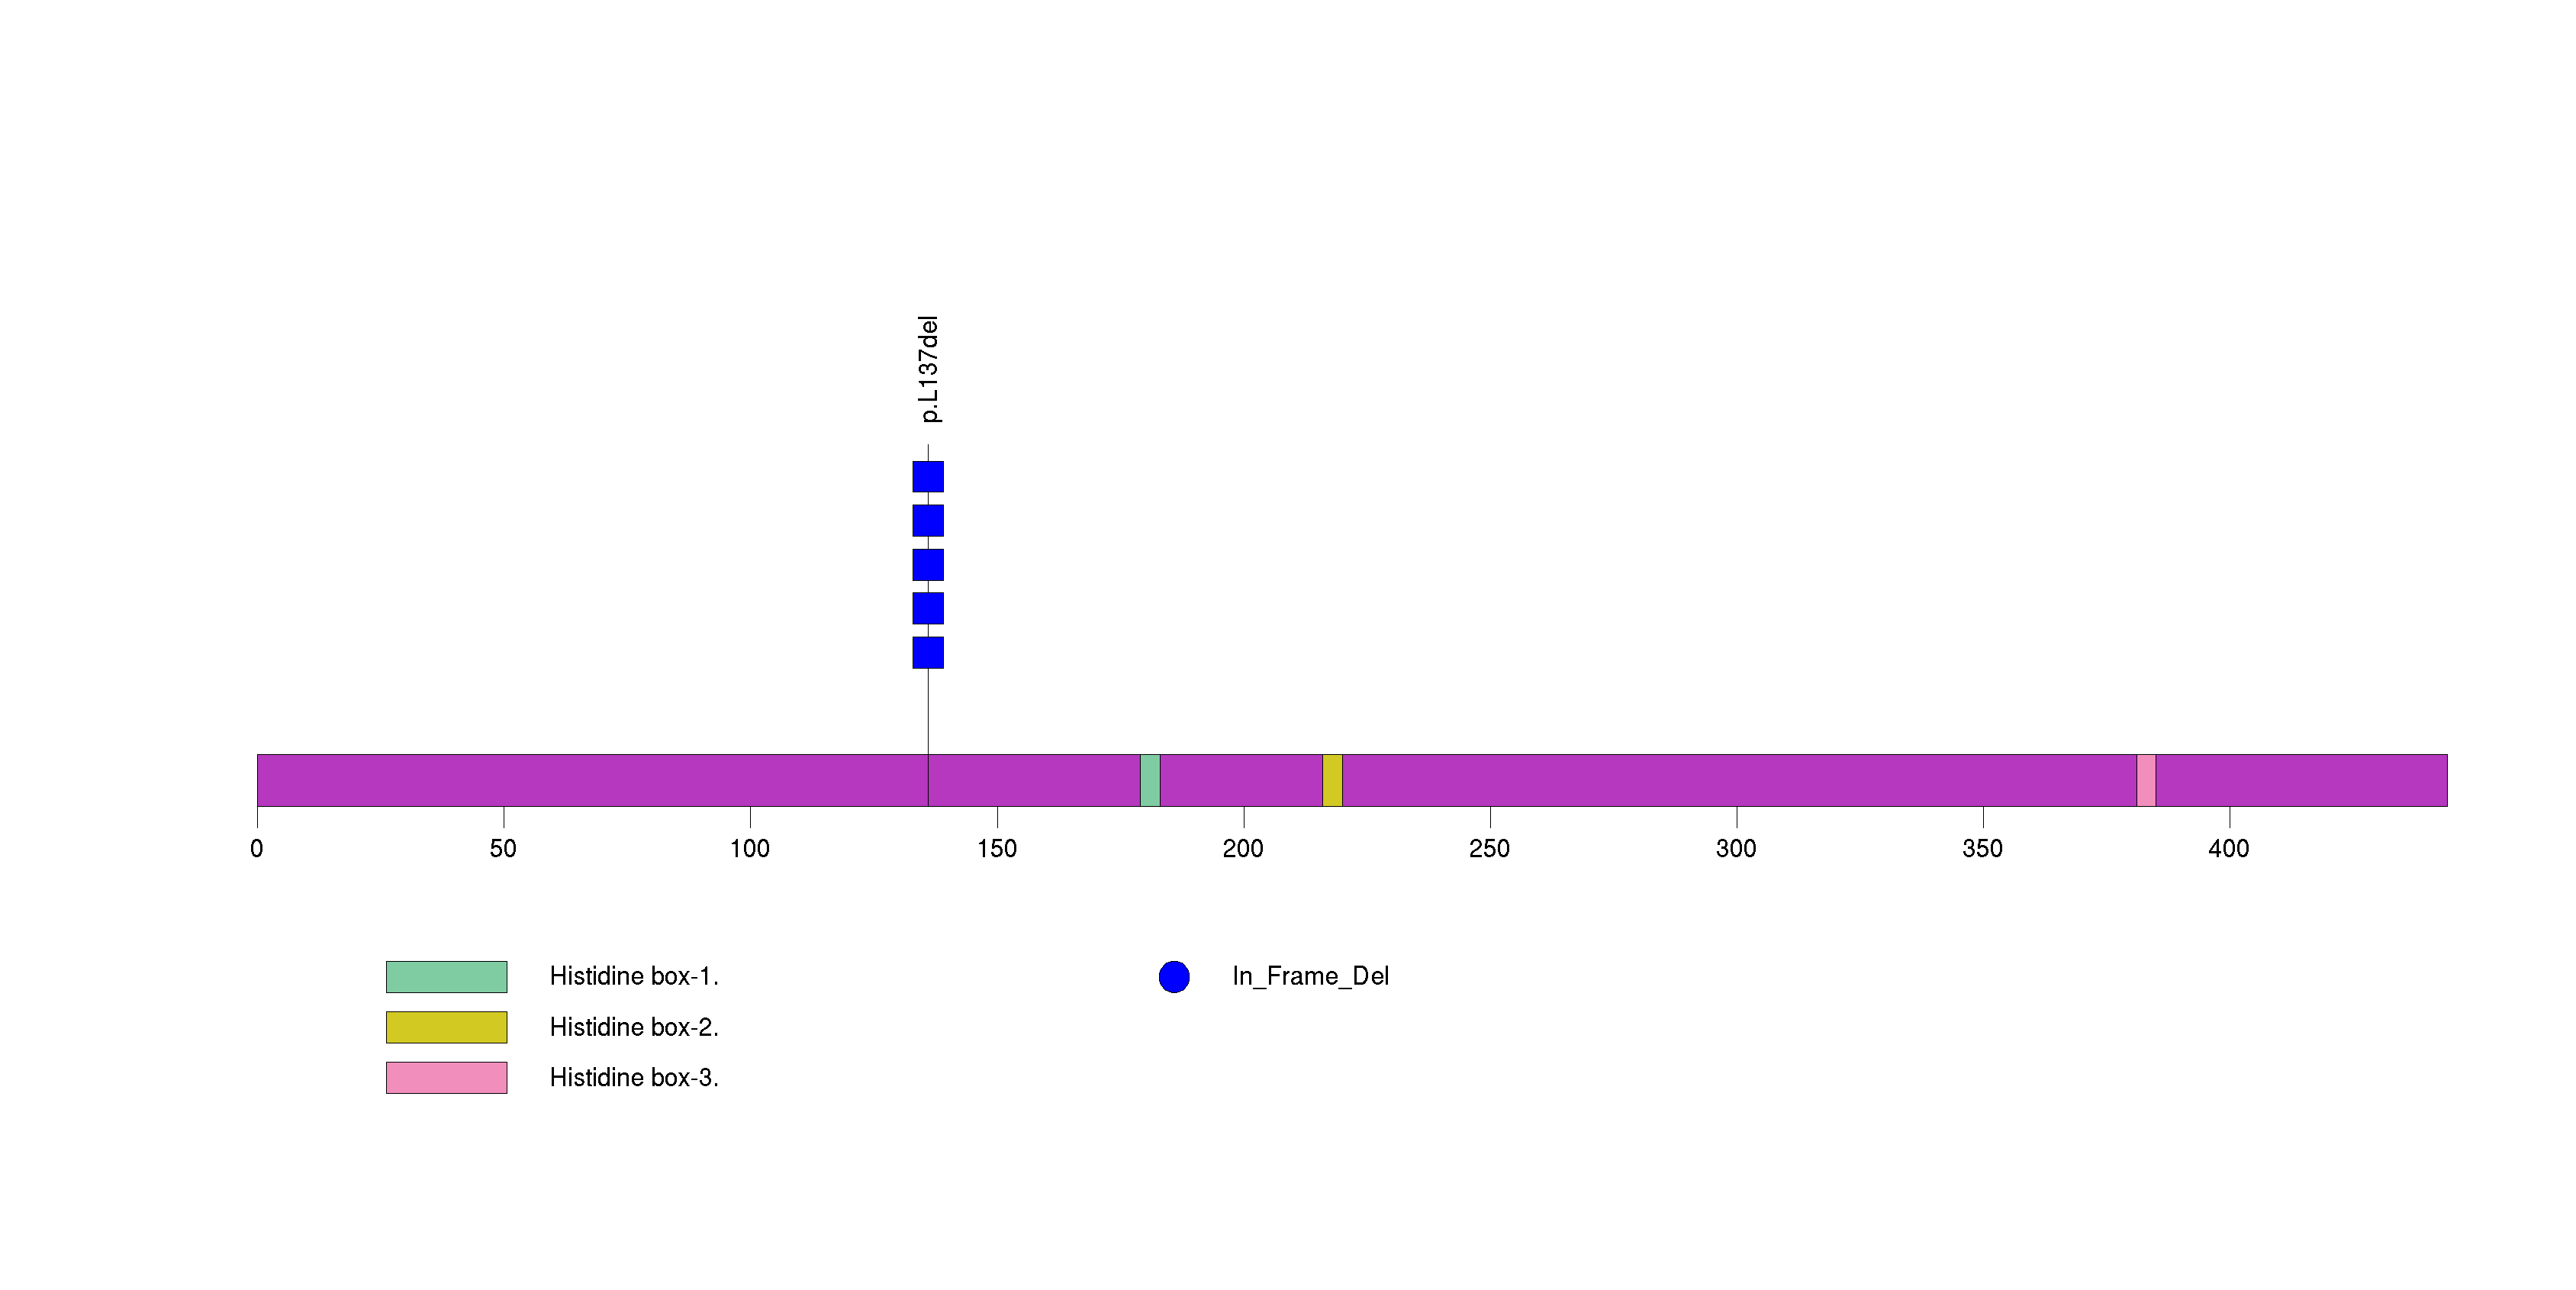
Figure S12. This figure depicts the distribution of mutations and mutation types across the FANCM significant gene.
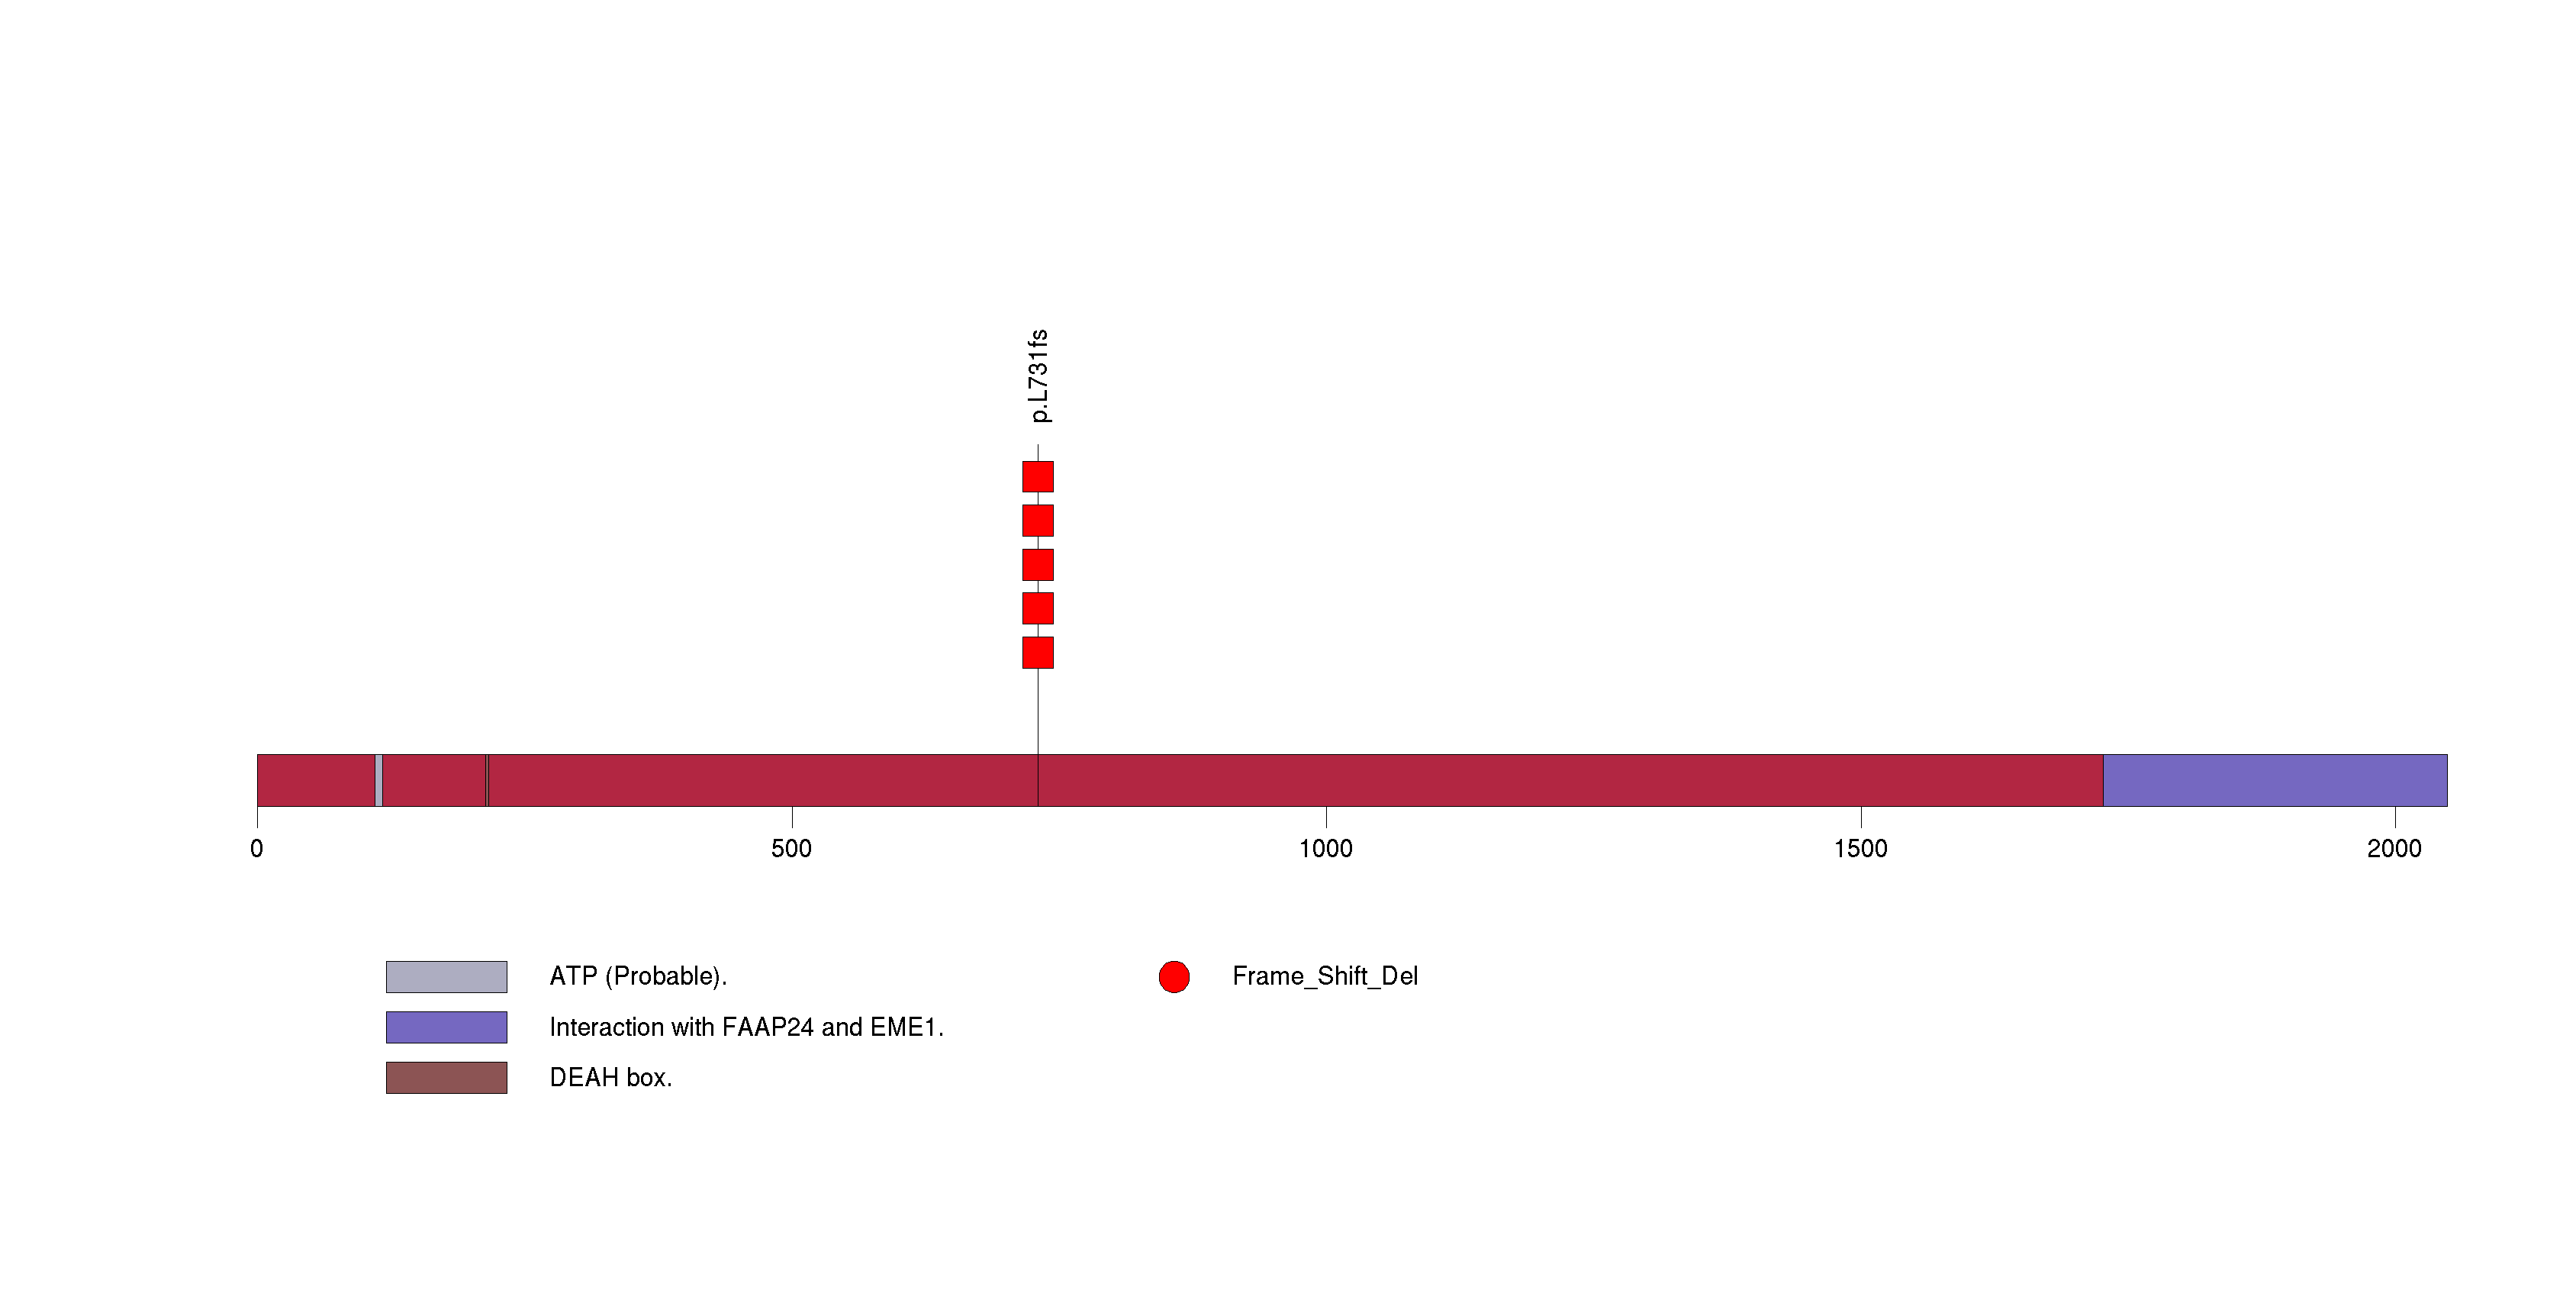
Figure S13. This figure depicts the distribution of mutations and mutation types across the FXR2 significant gene.
Figure S14. This figure depicts the distribution of mutations and mutation types across the HTATSF1 significant gene.
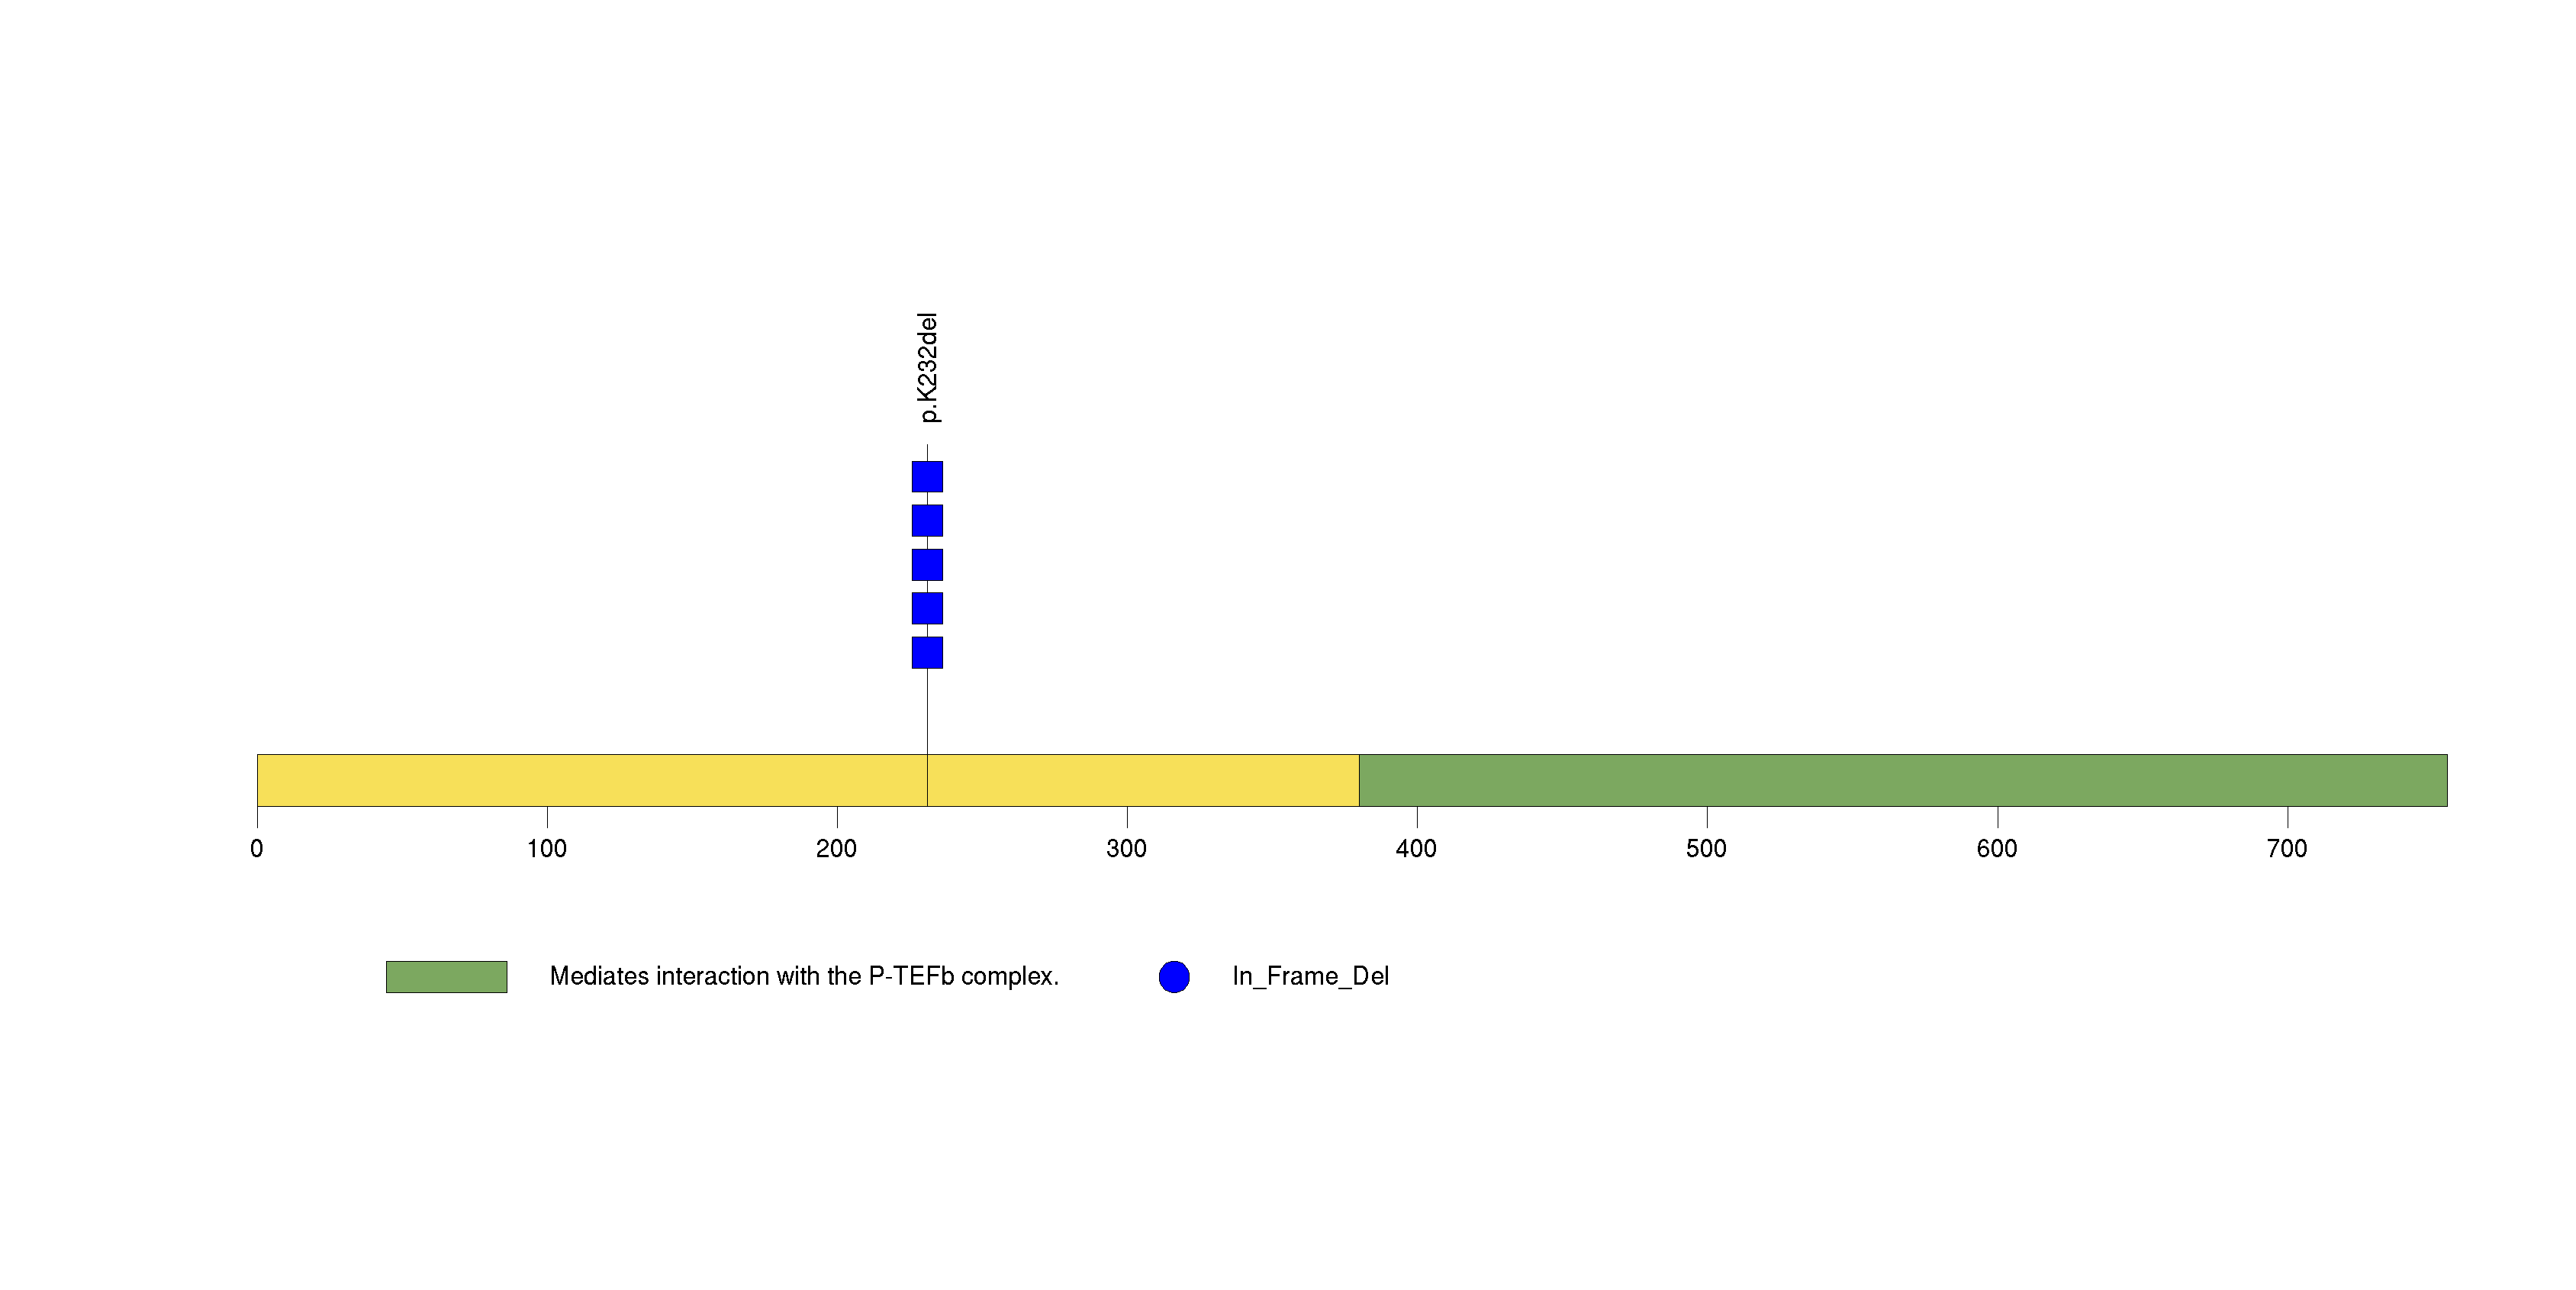
Figure S15. This figure depicts the distribution of mutations and mutation types across the KANK1 significant gene.
Figure S16. This figure depicts the distribution of mutations and mutation types across the MAGEA10 significant gene.
Figure S17. This figure depicts the distribution of mutations and mutation types across the NOS1AP significant gene.
Figure S18. This figure depicts the distribution of mutations and mutation types across the OR10A2 significant gene.
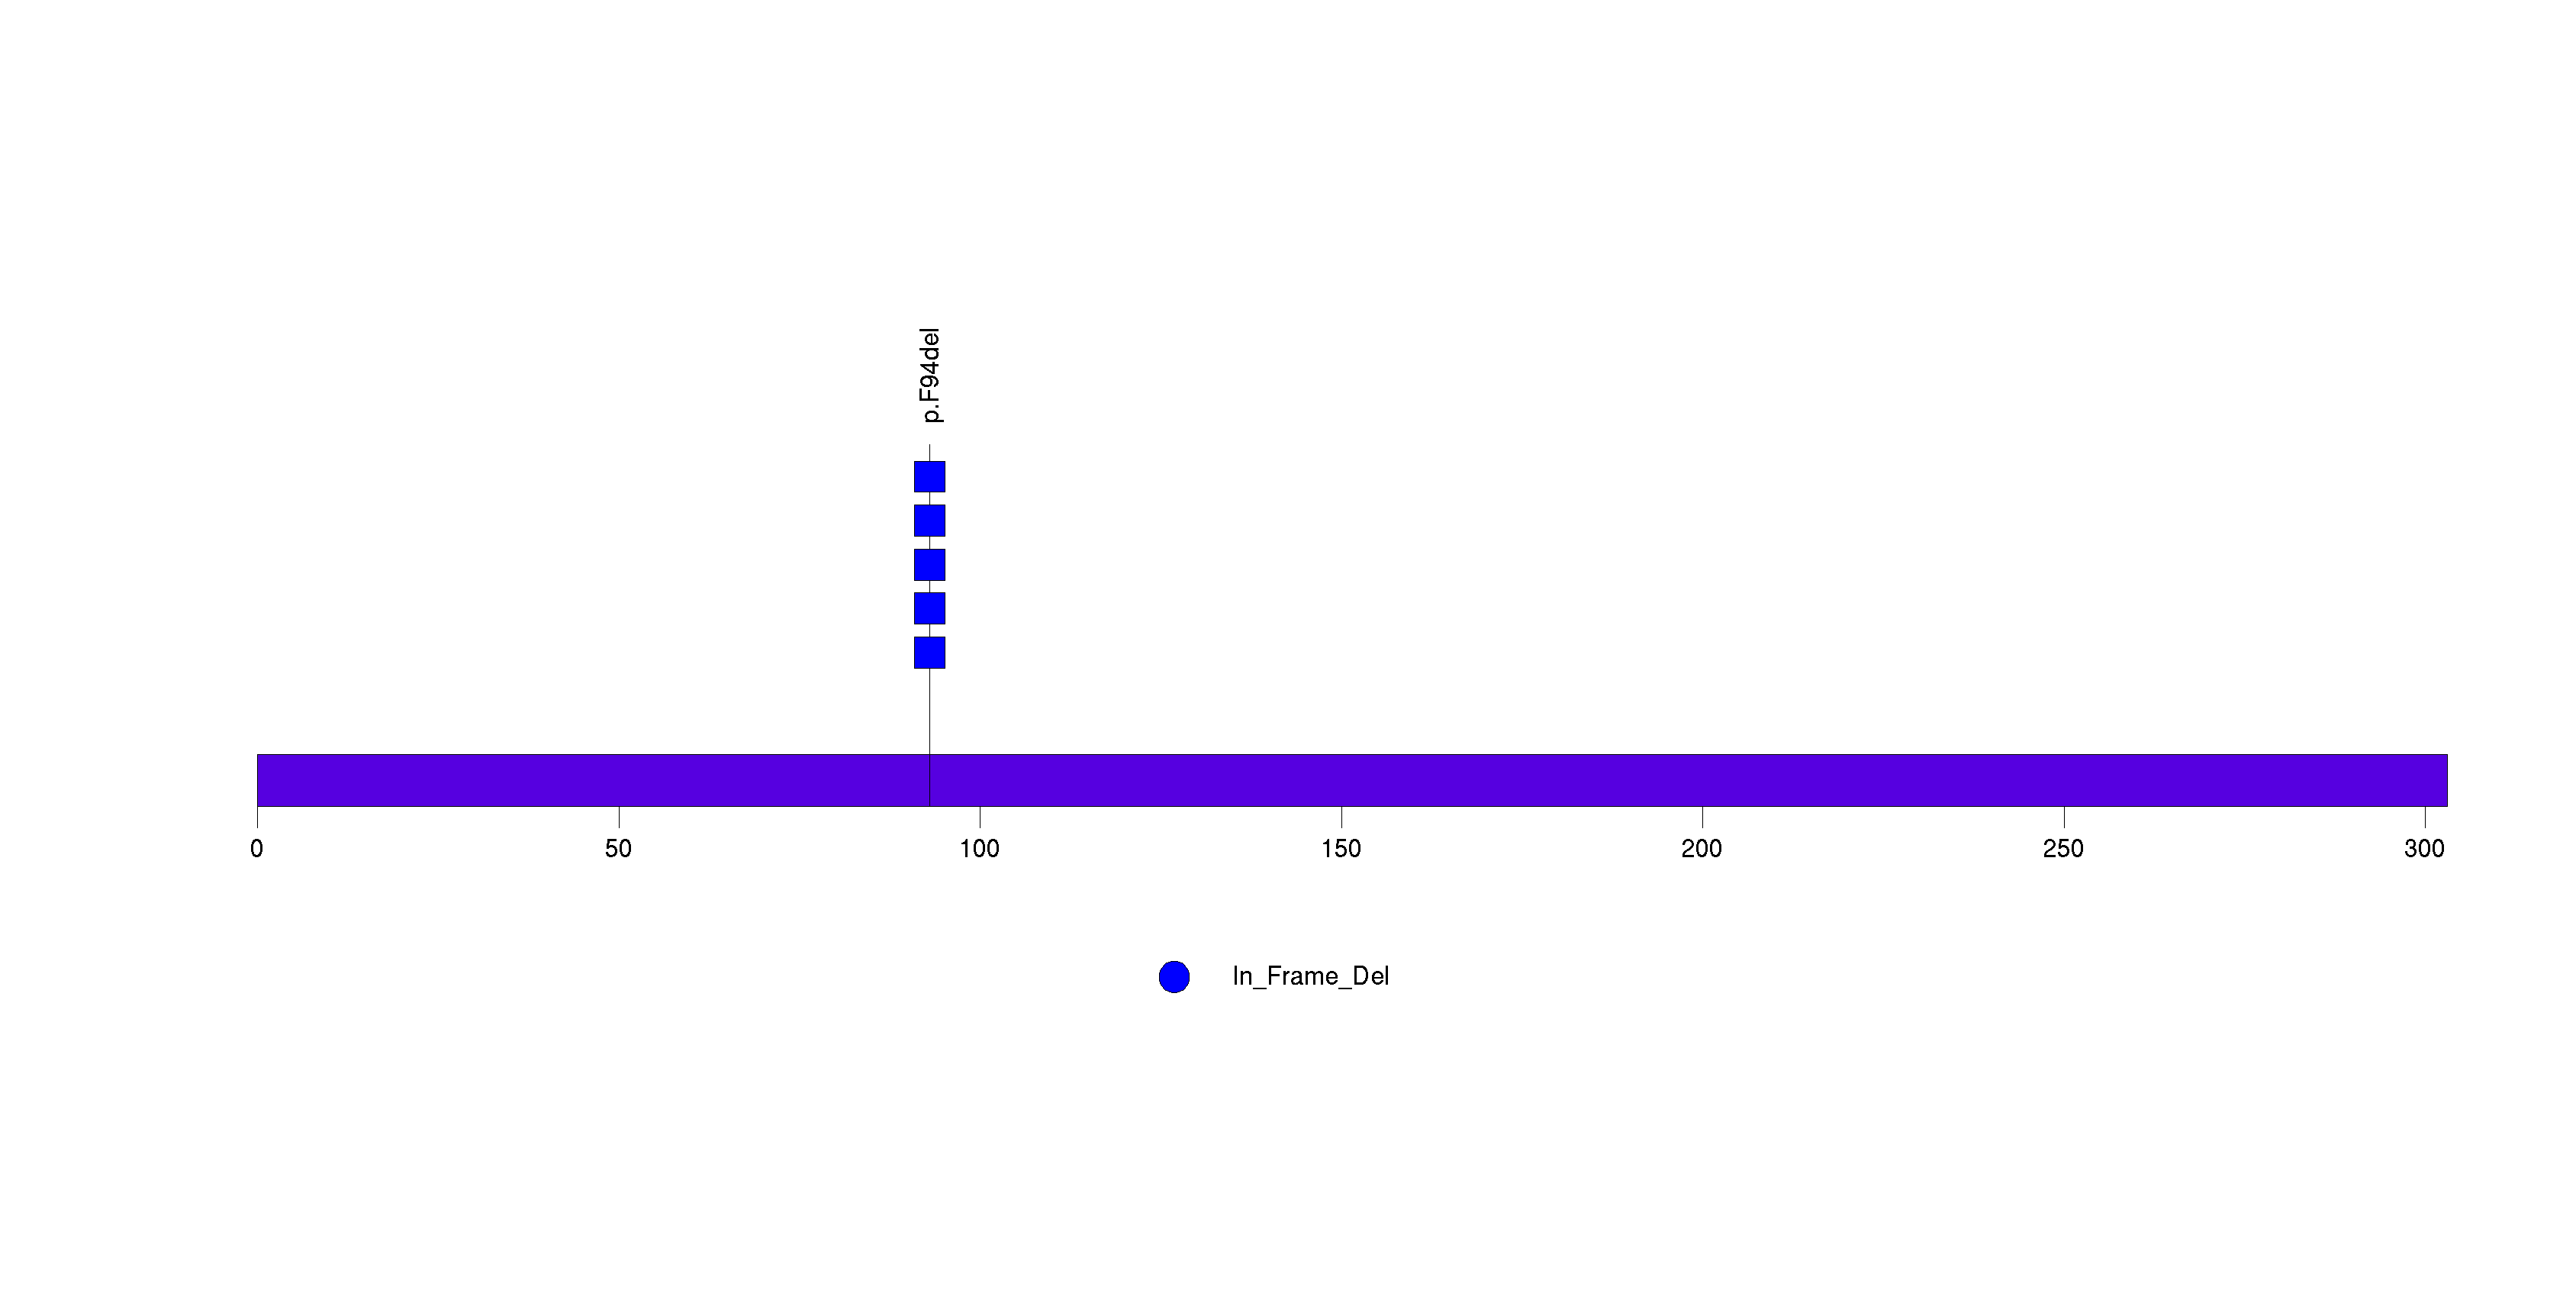
Figure S19. This figure depicts the distribution of mutations and mutation types across the PTTG1IP significant gene.
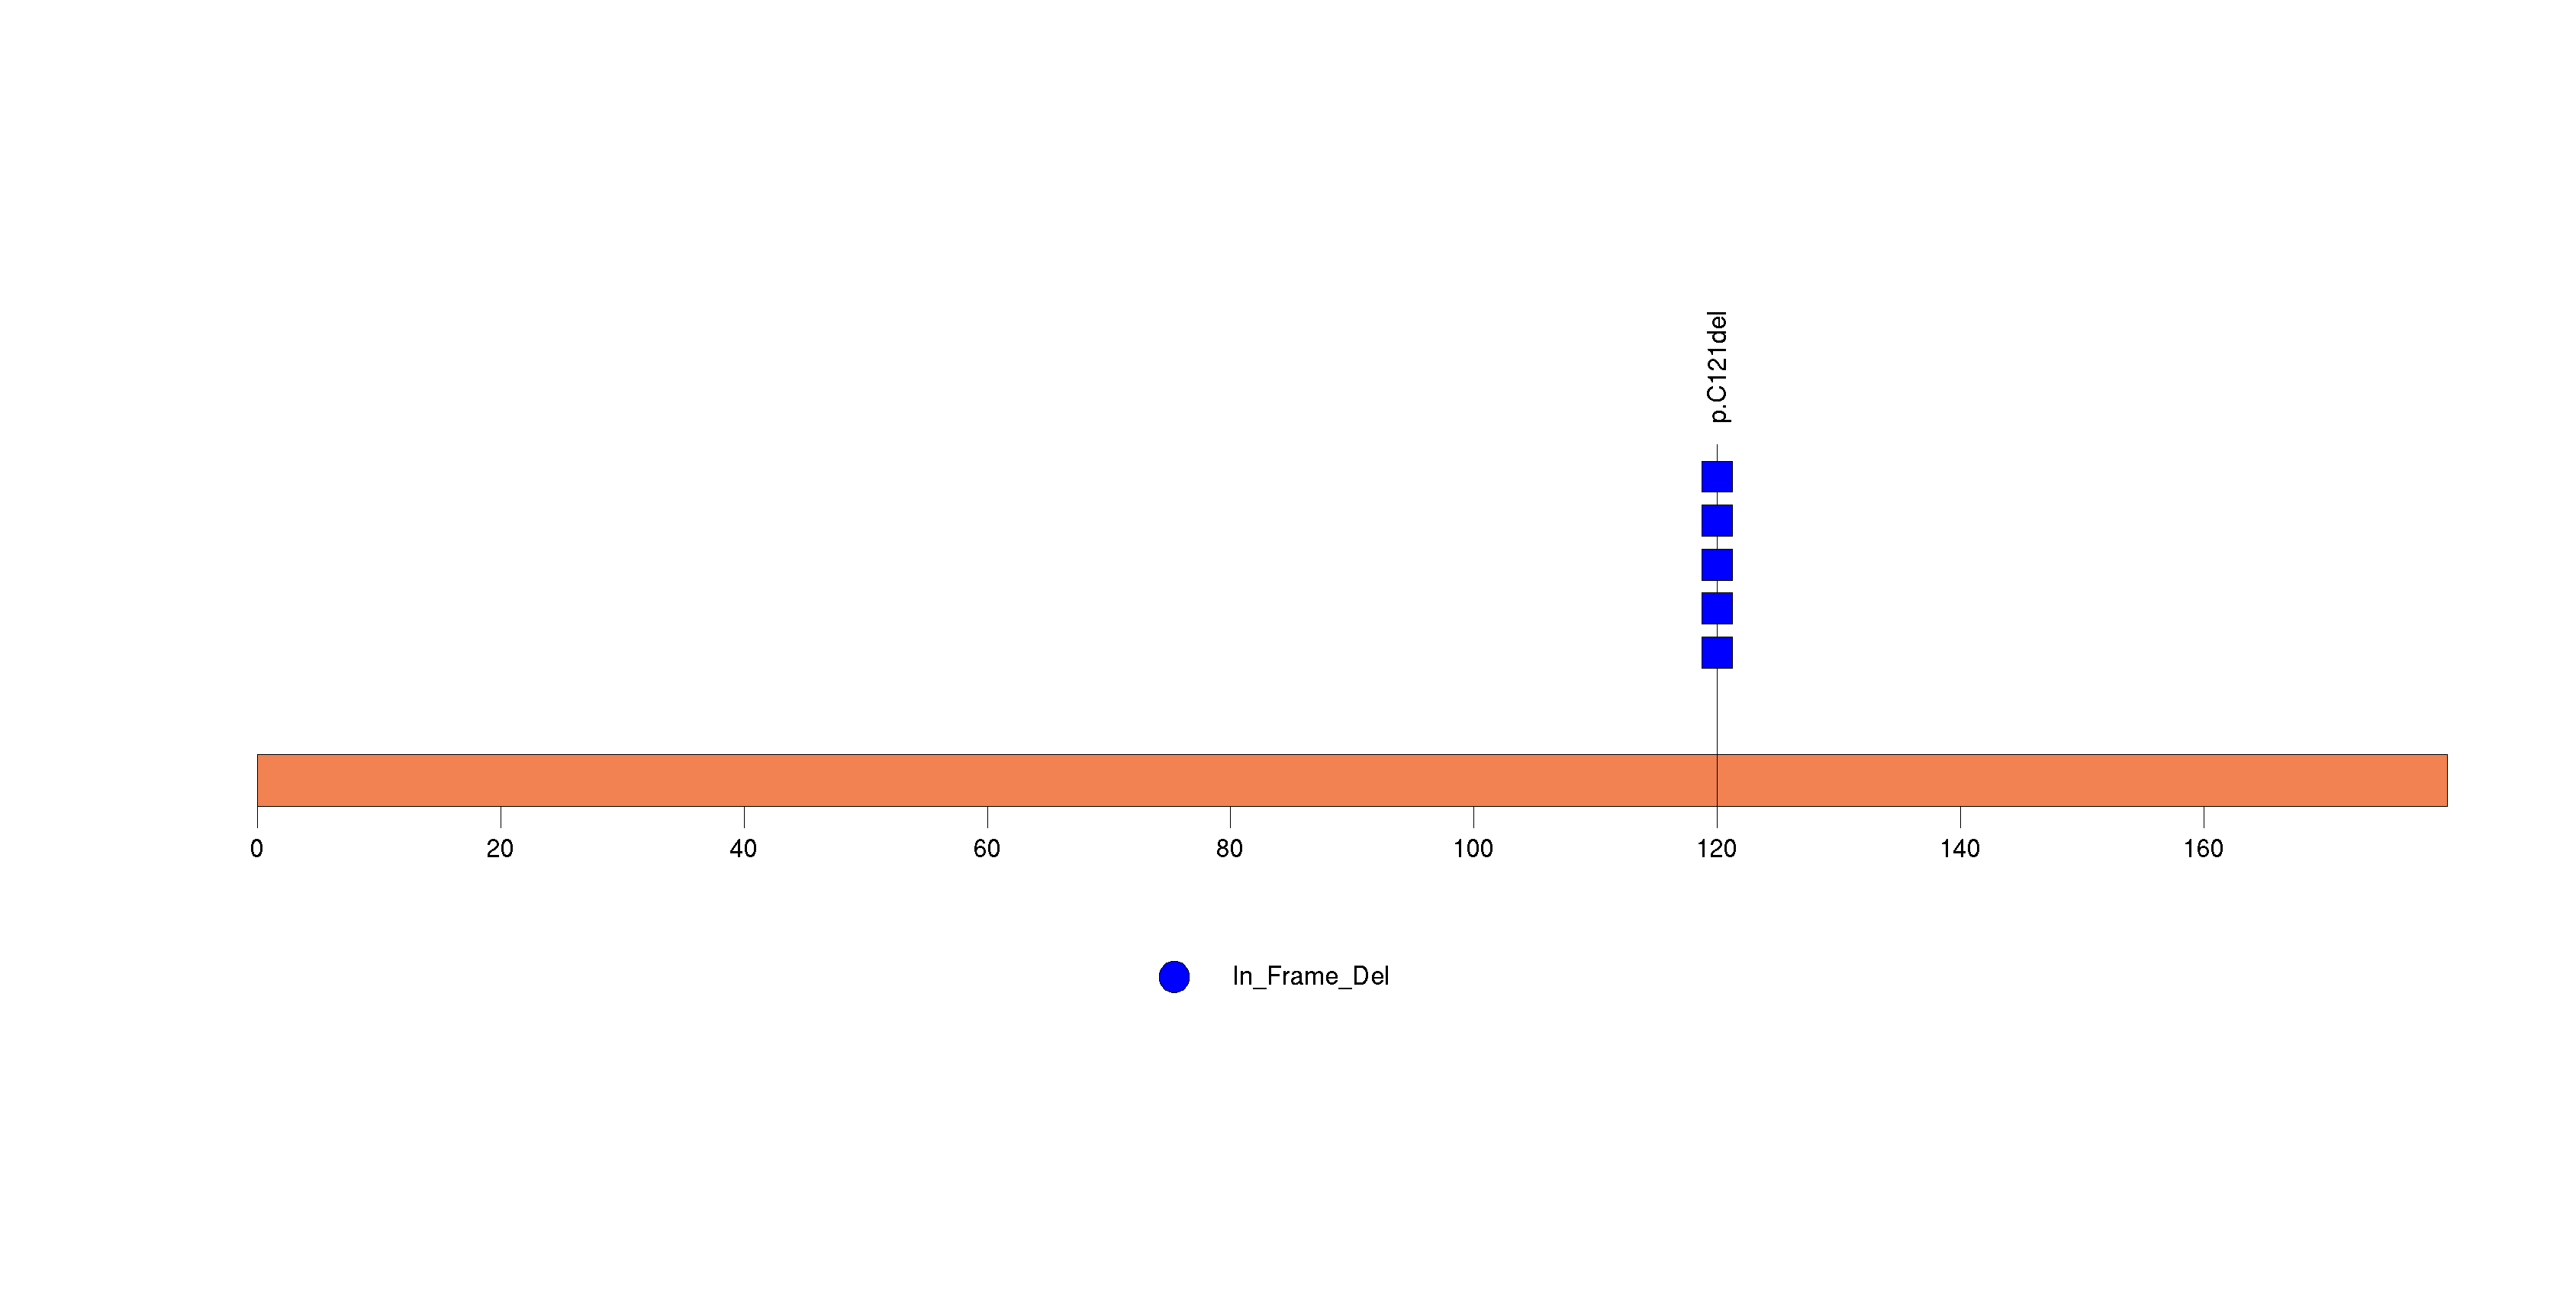
Figure S20. This figure depicts the distribution of mutations and mutation types across the RANBP10 significant gene.
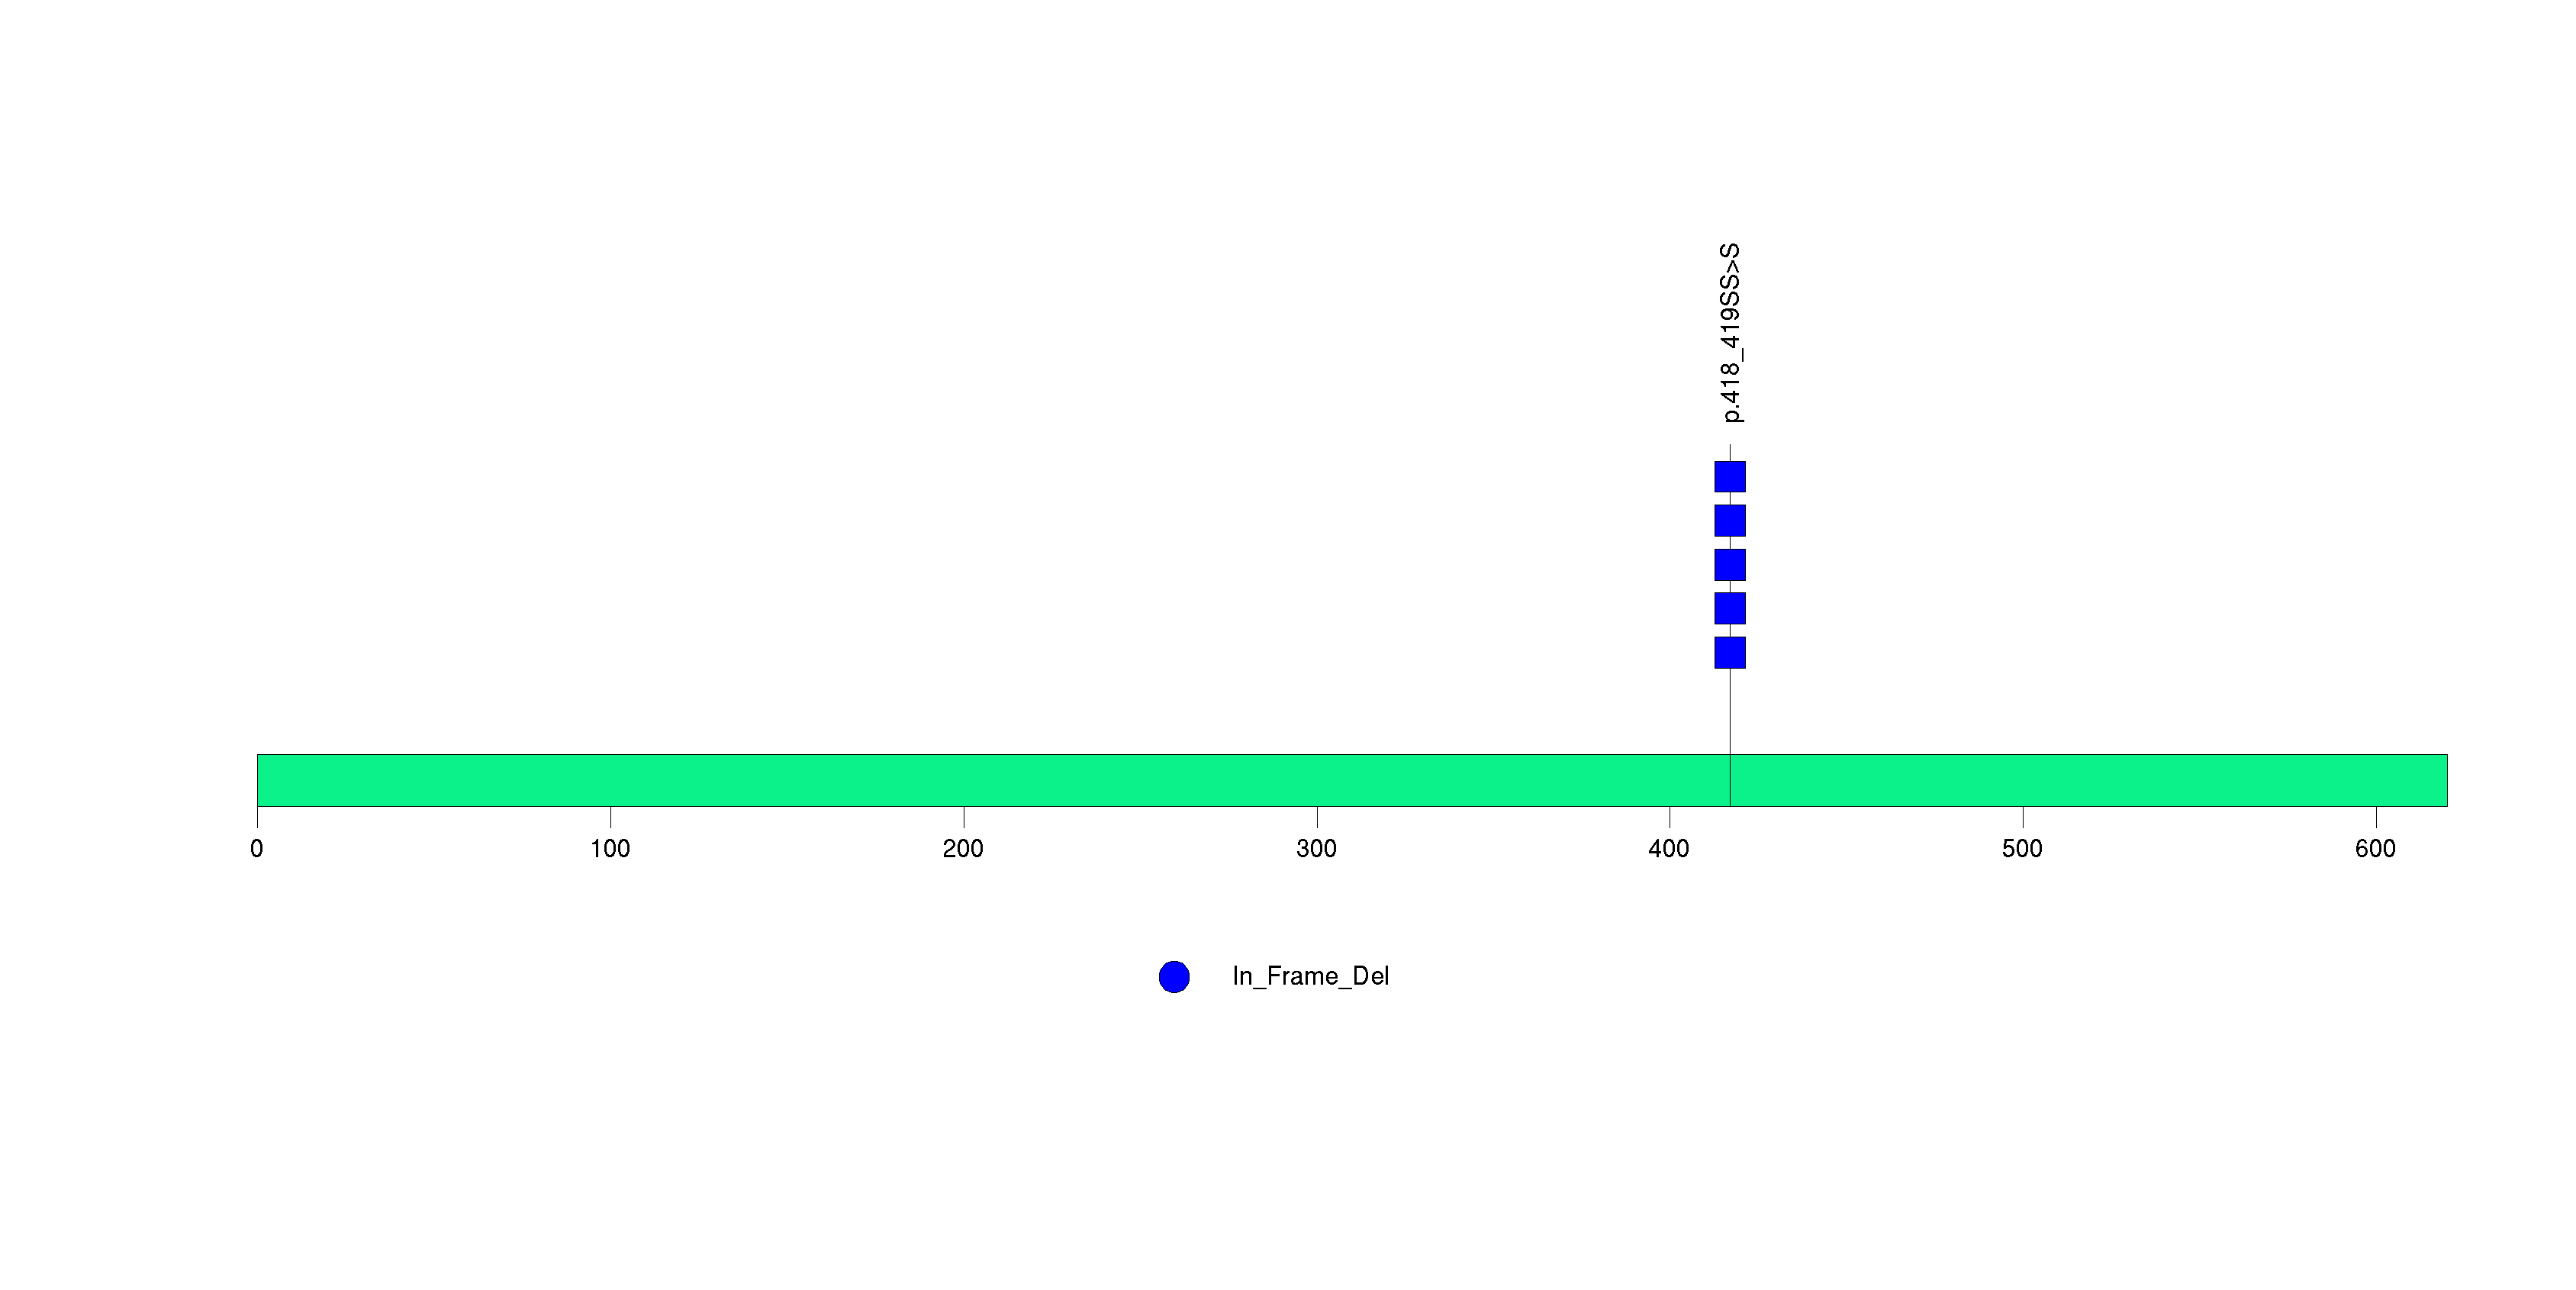
Figure S21. This figure depicts the distribution of mutations and mutation types across the UVRAG significant gene.
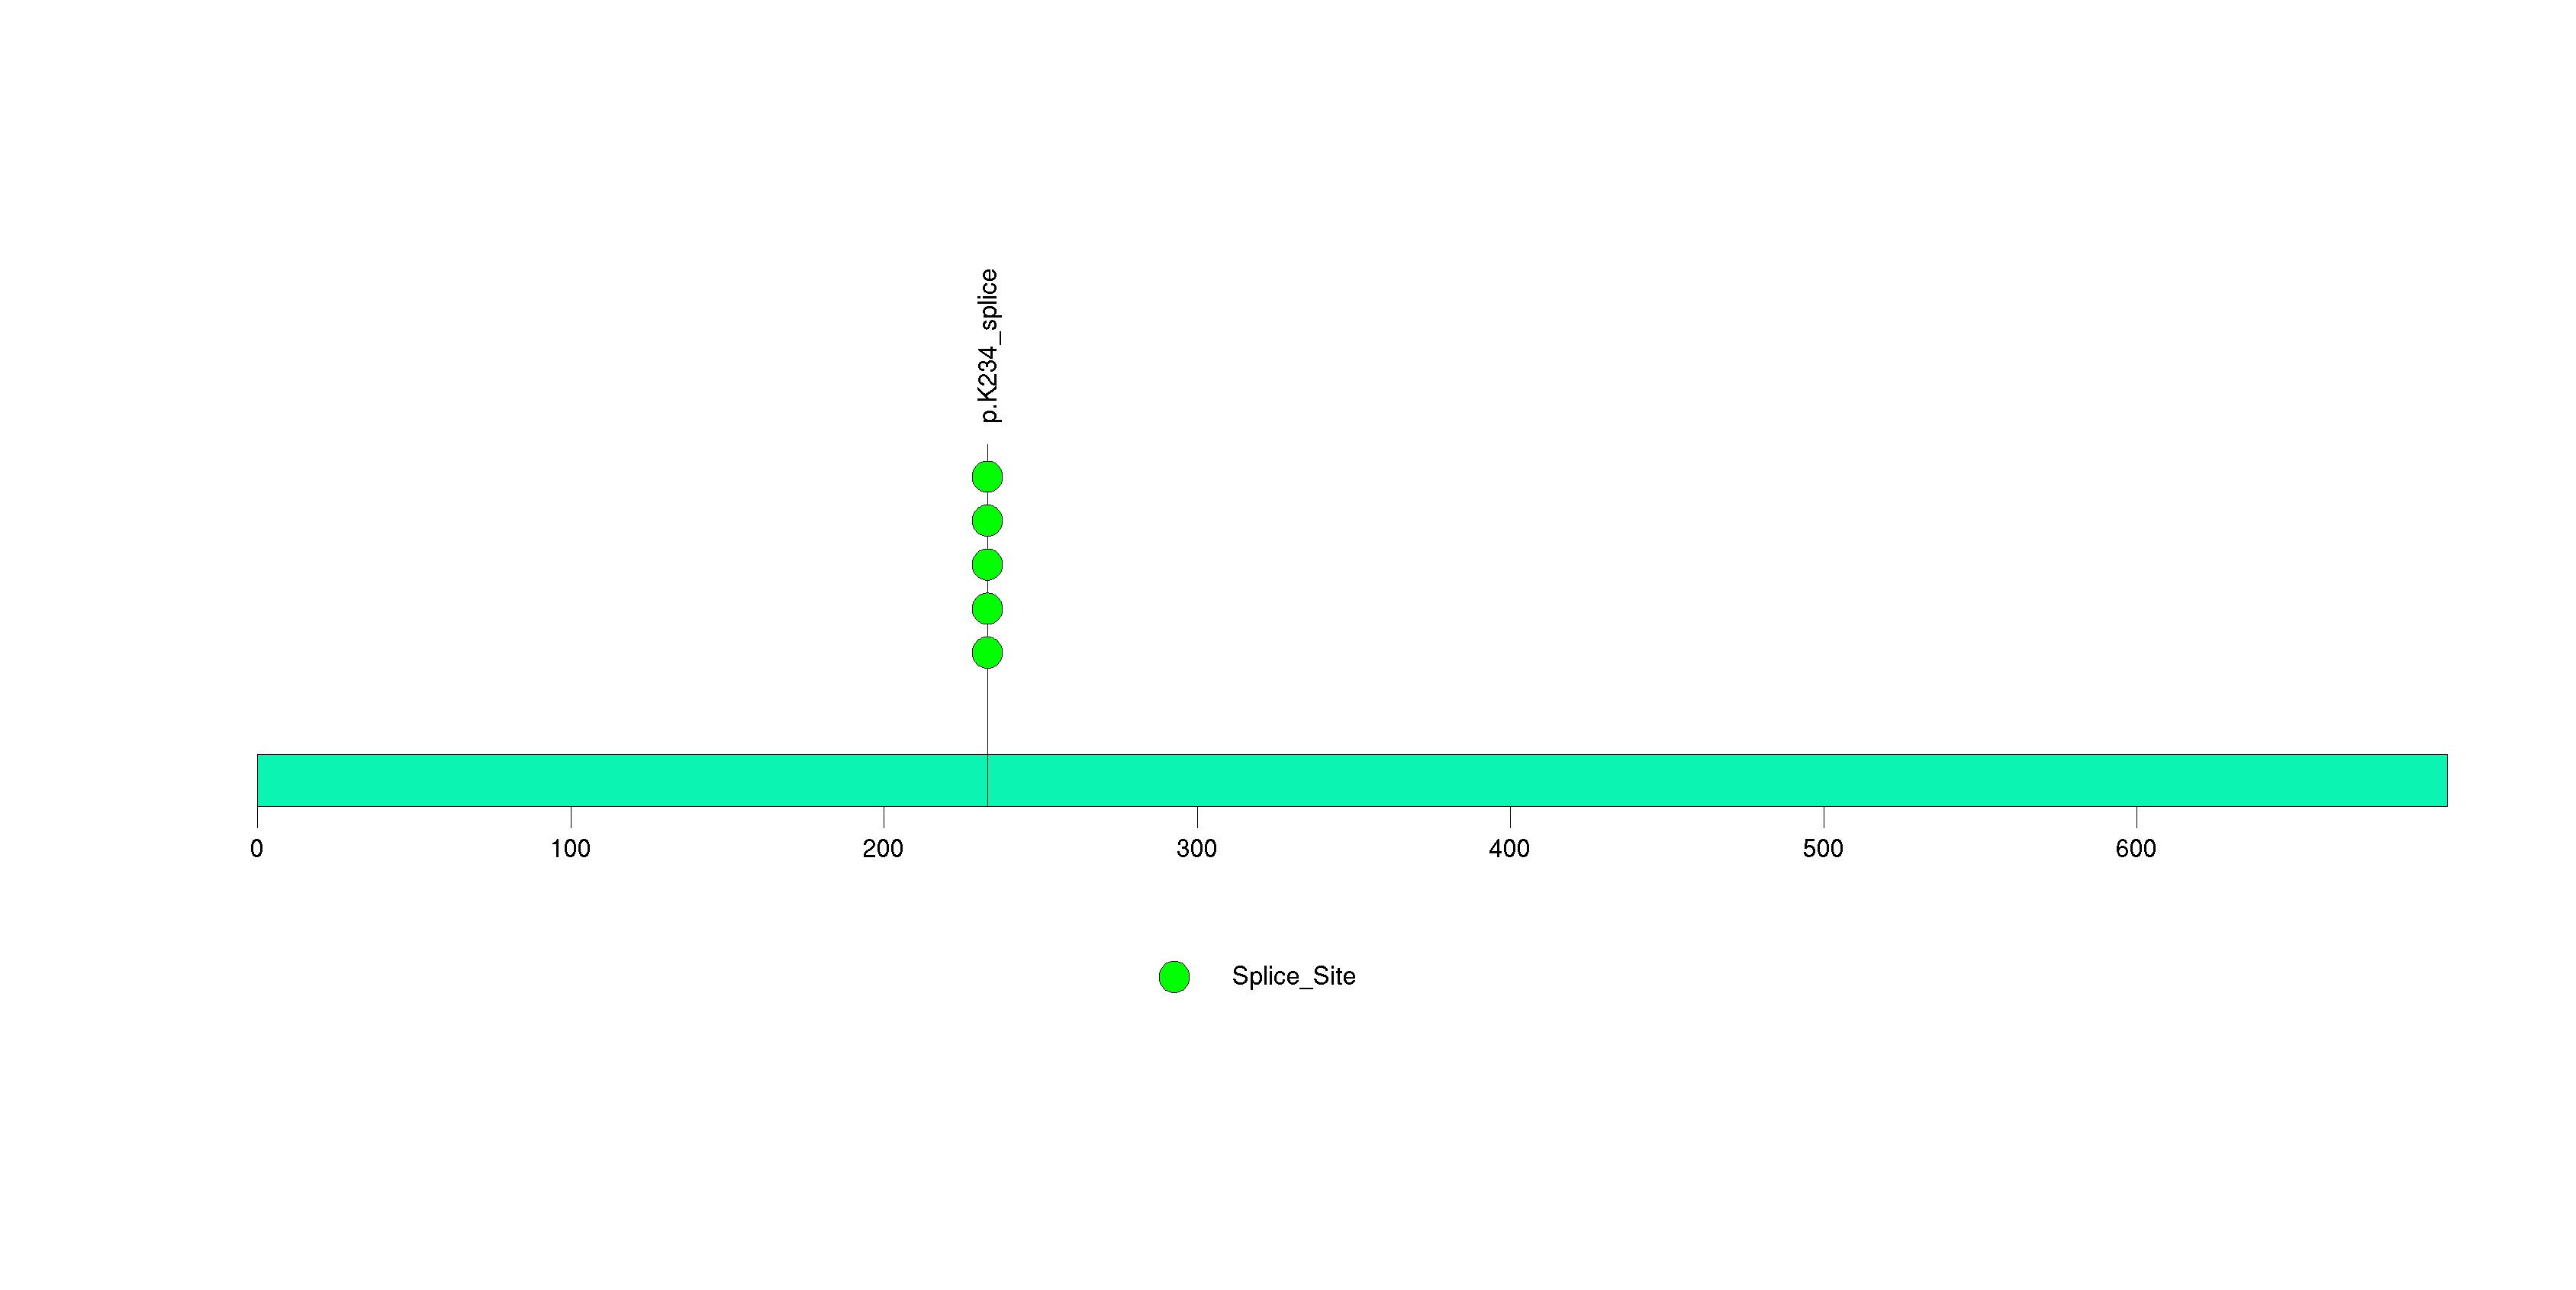
Figure S22. This figure depicts the distribution of mutations and mutation types across the ABCC4 significant gene.
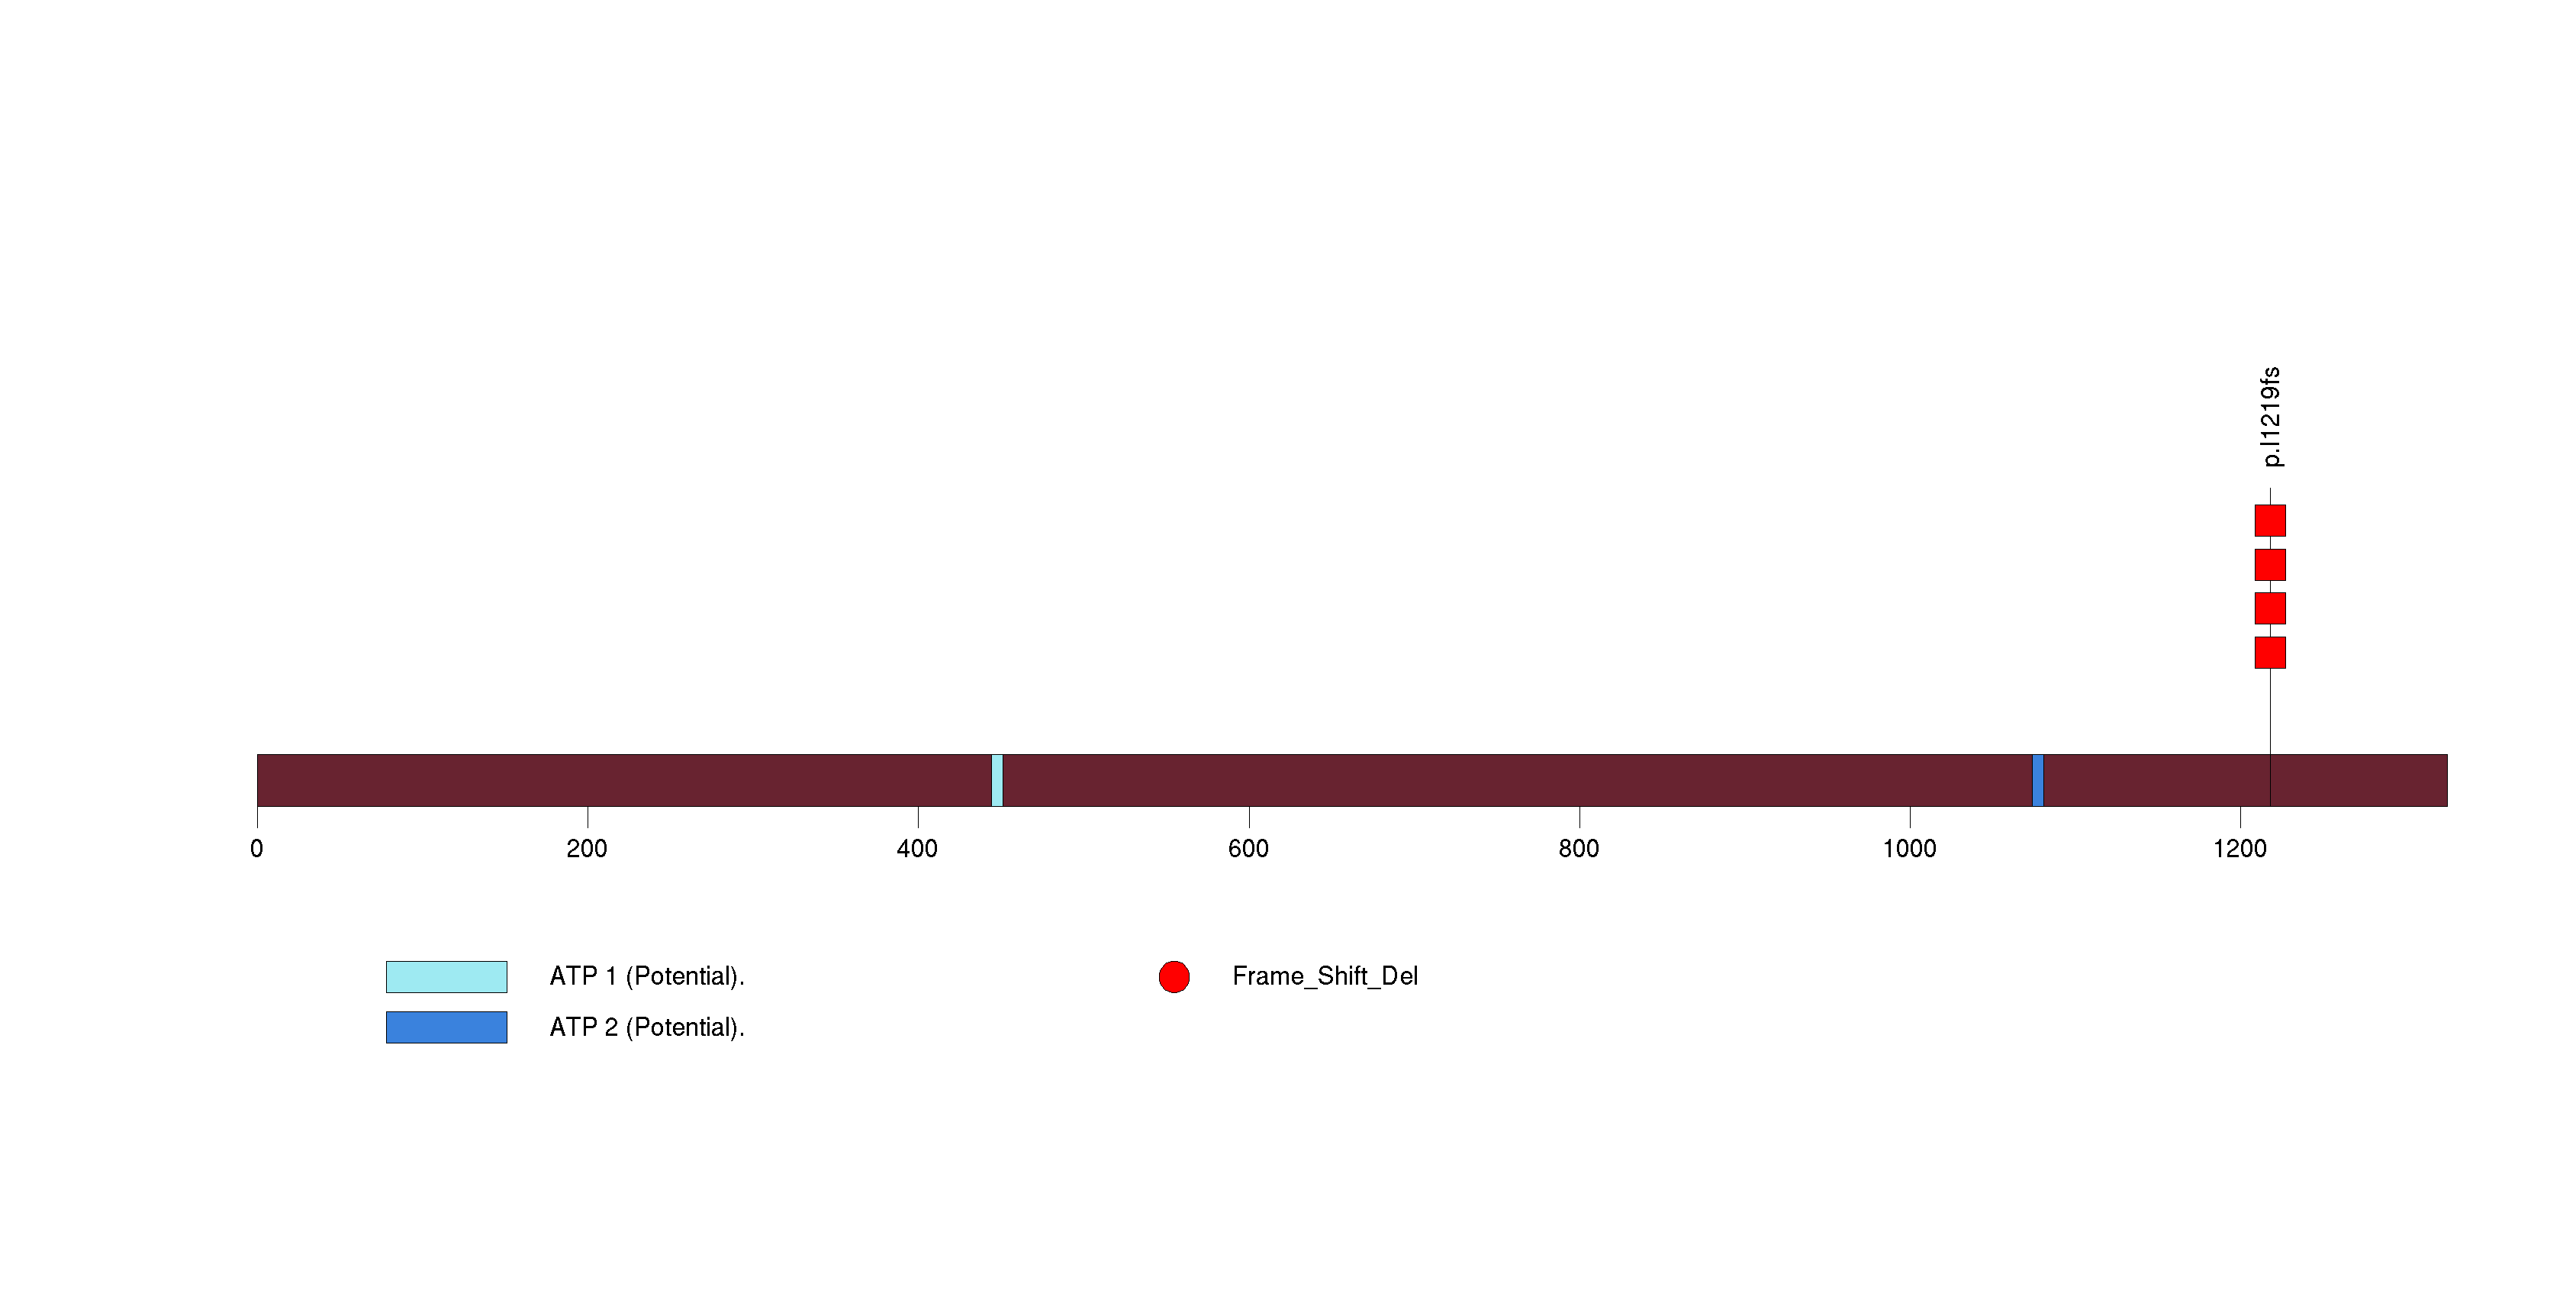
Figure S23. This figure depicts the distribution of mutations and mutation types across the BMS1 significant gene.
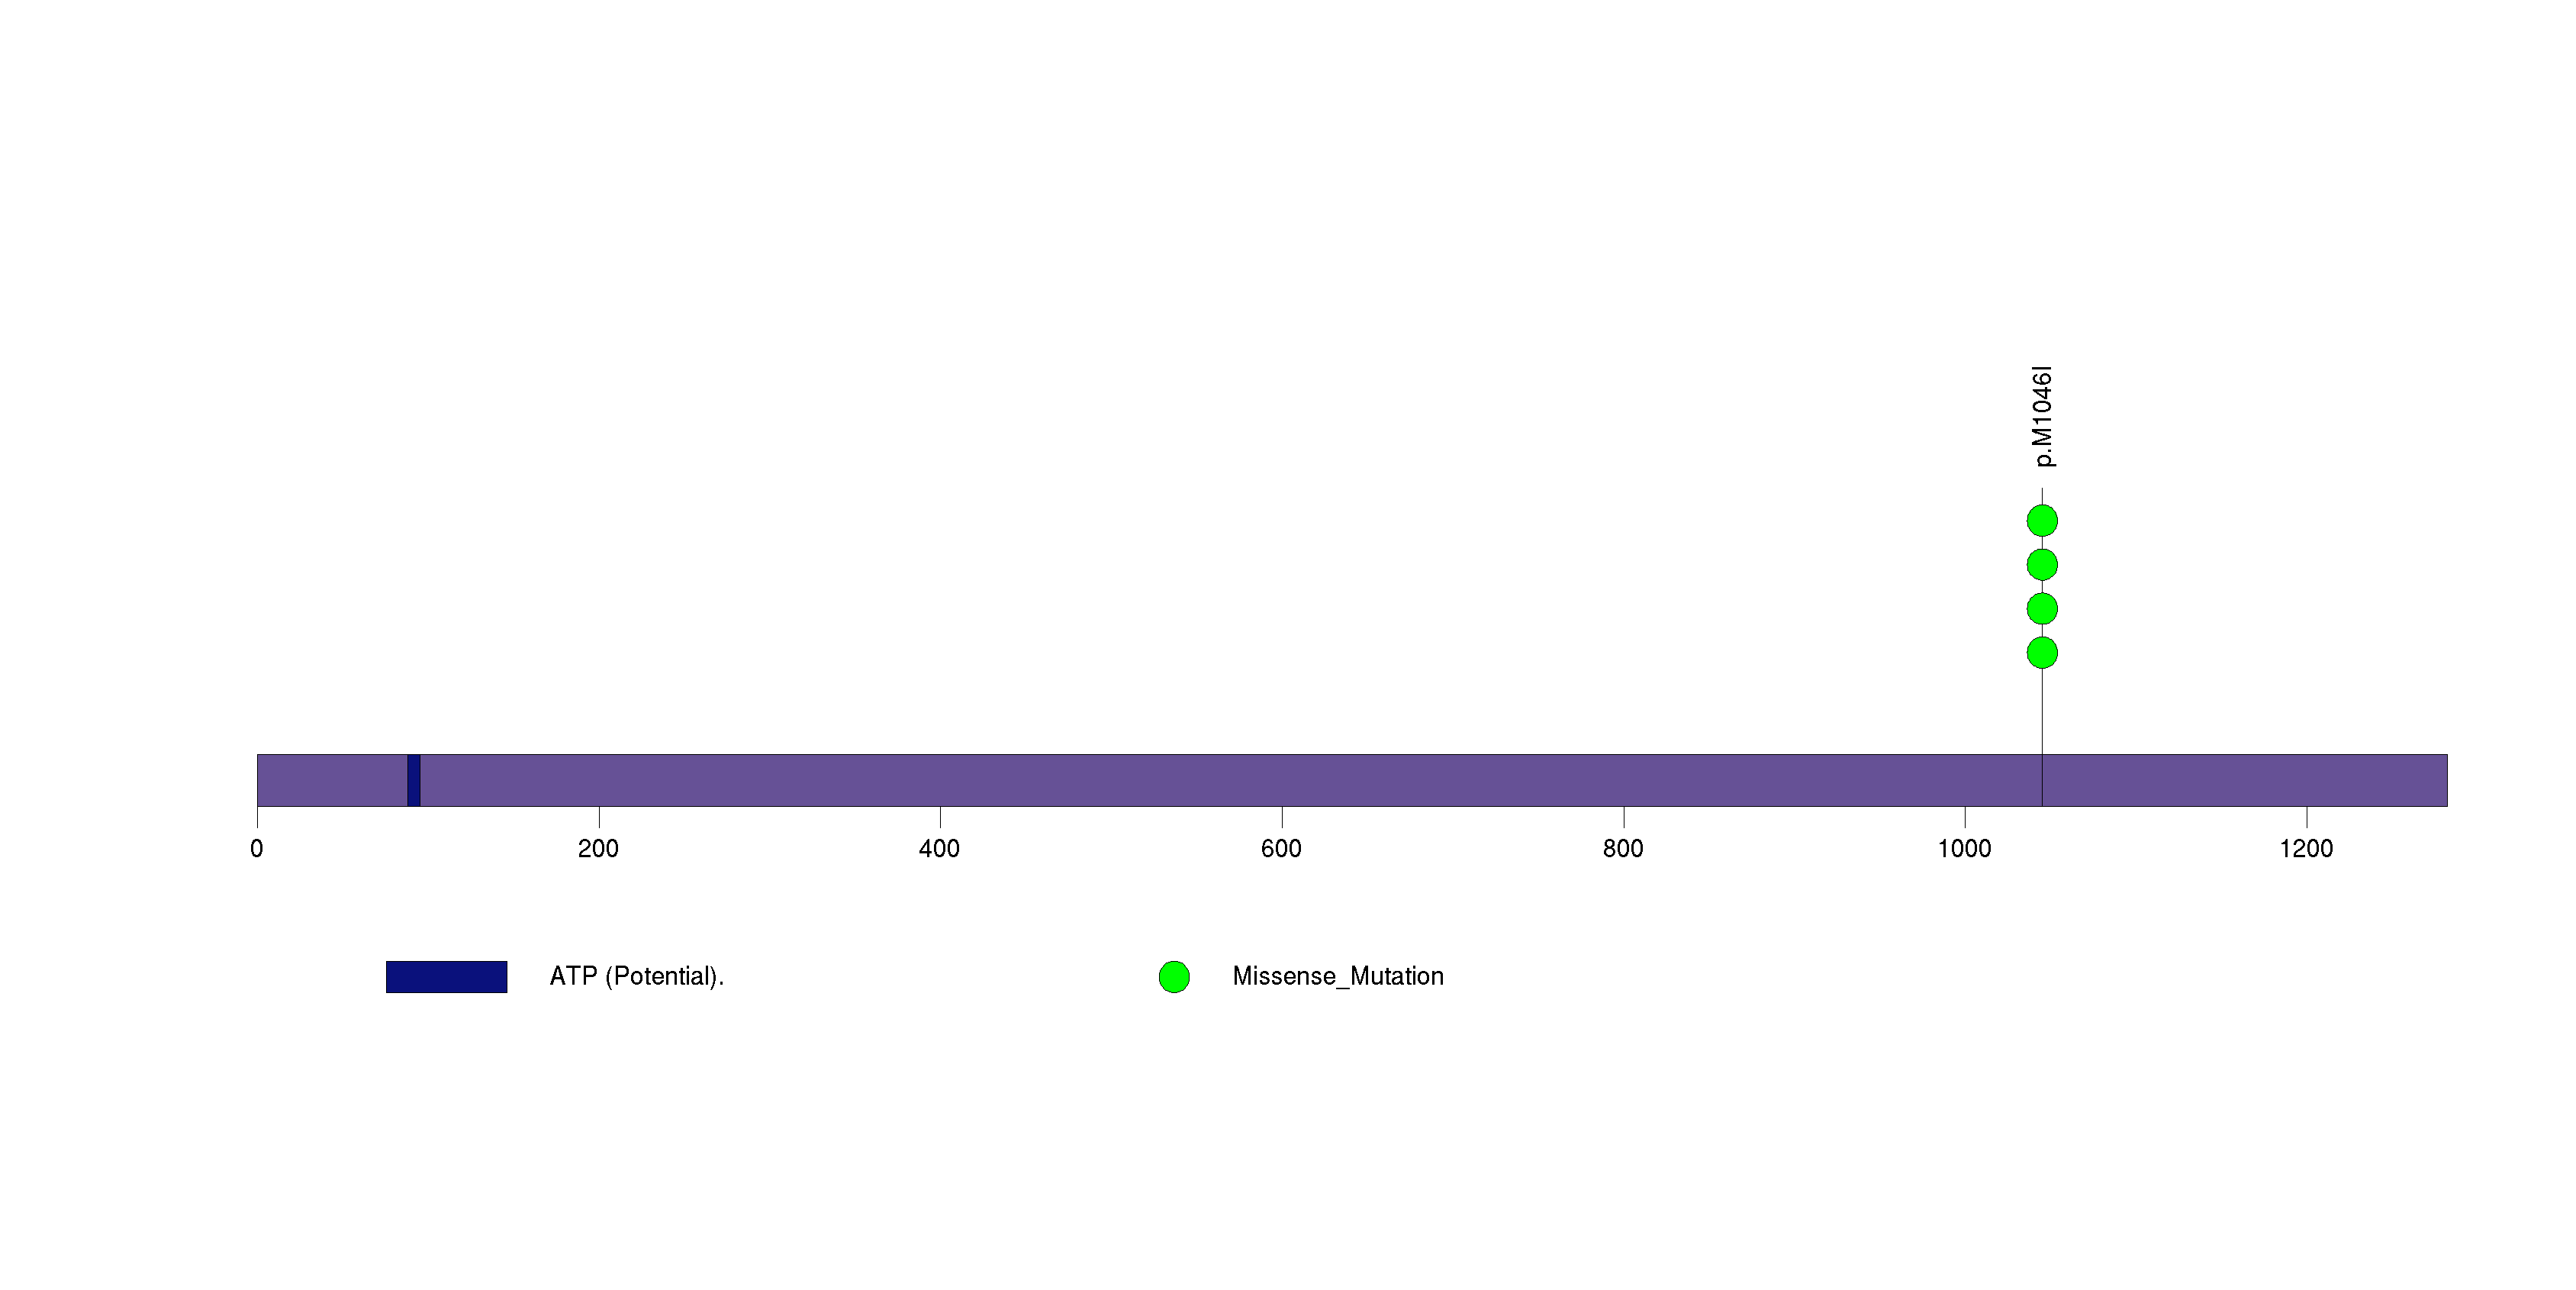
Figure S24. This figure depicts the distribution of mutations and mutation types across the CANX significant gene.
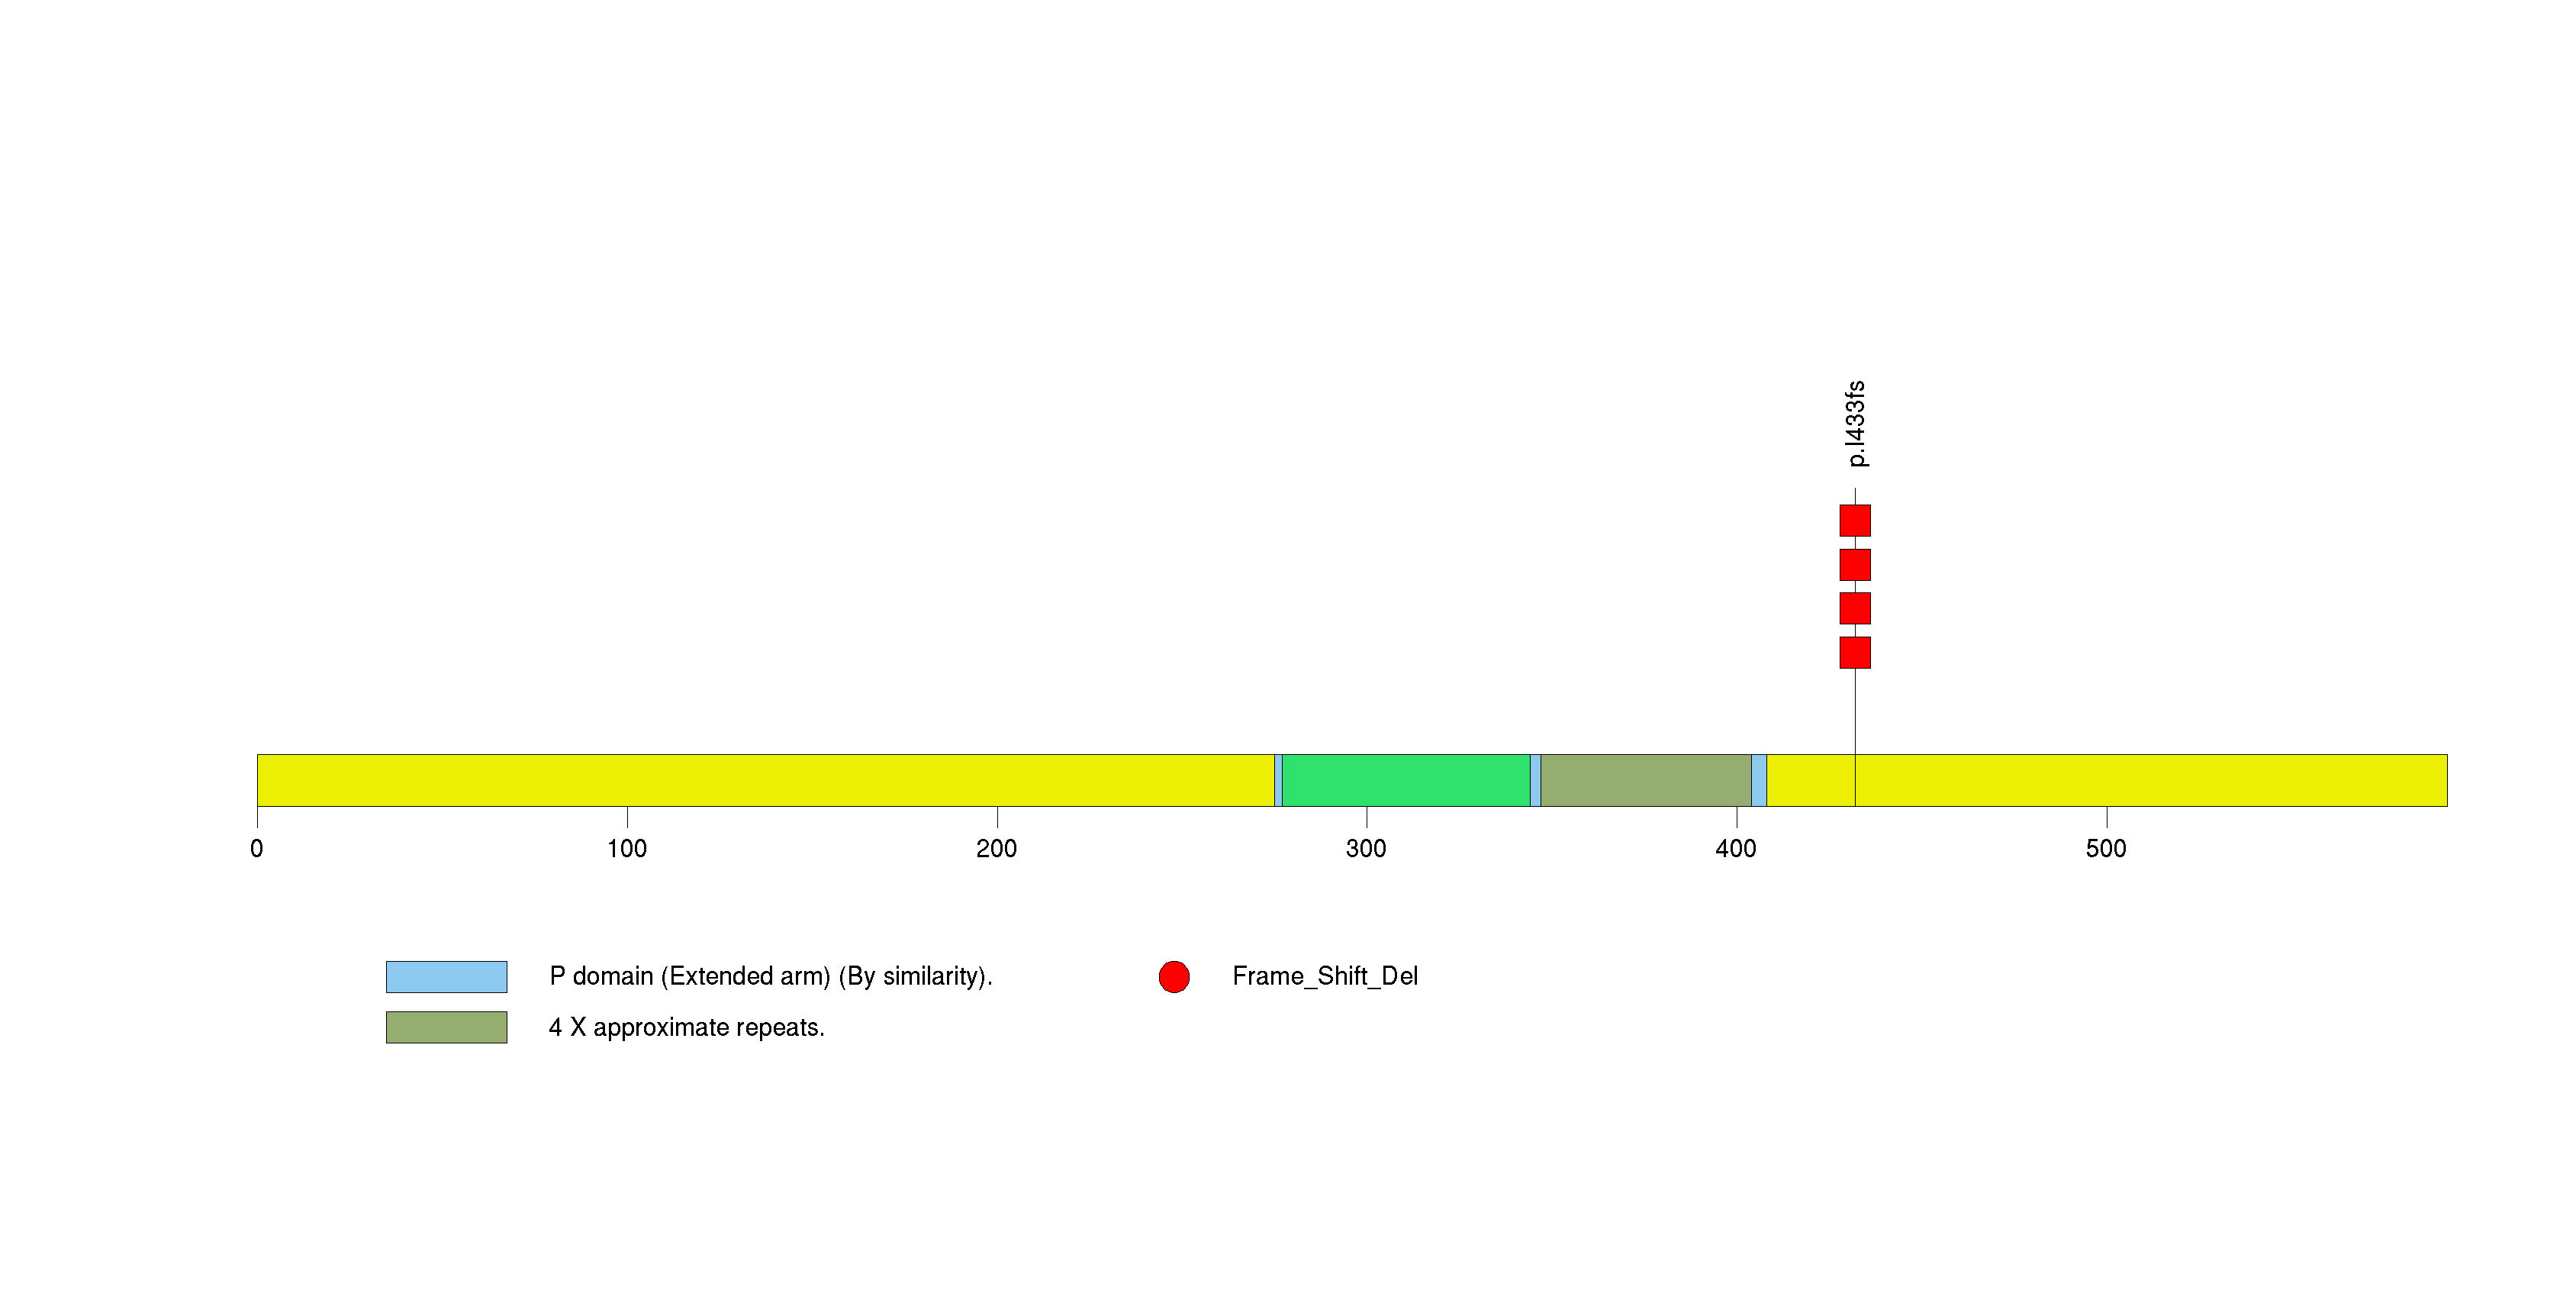
Figure S25. This figure depicts the distribution of mutations and mutation types across the CLSTN1 significant gene.
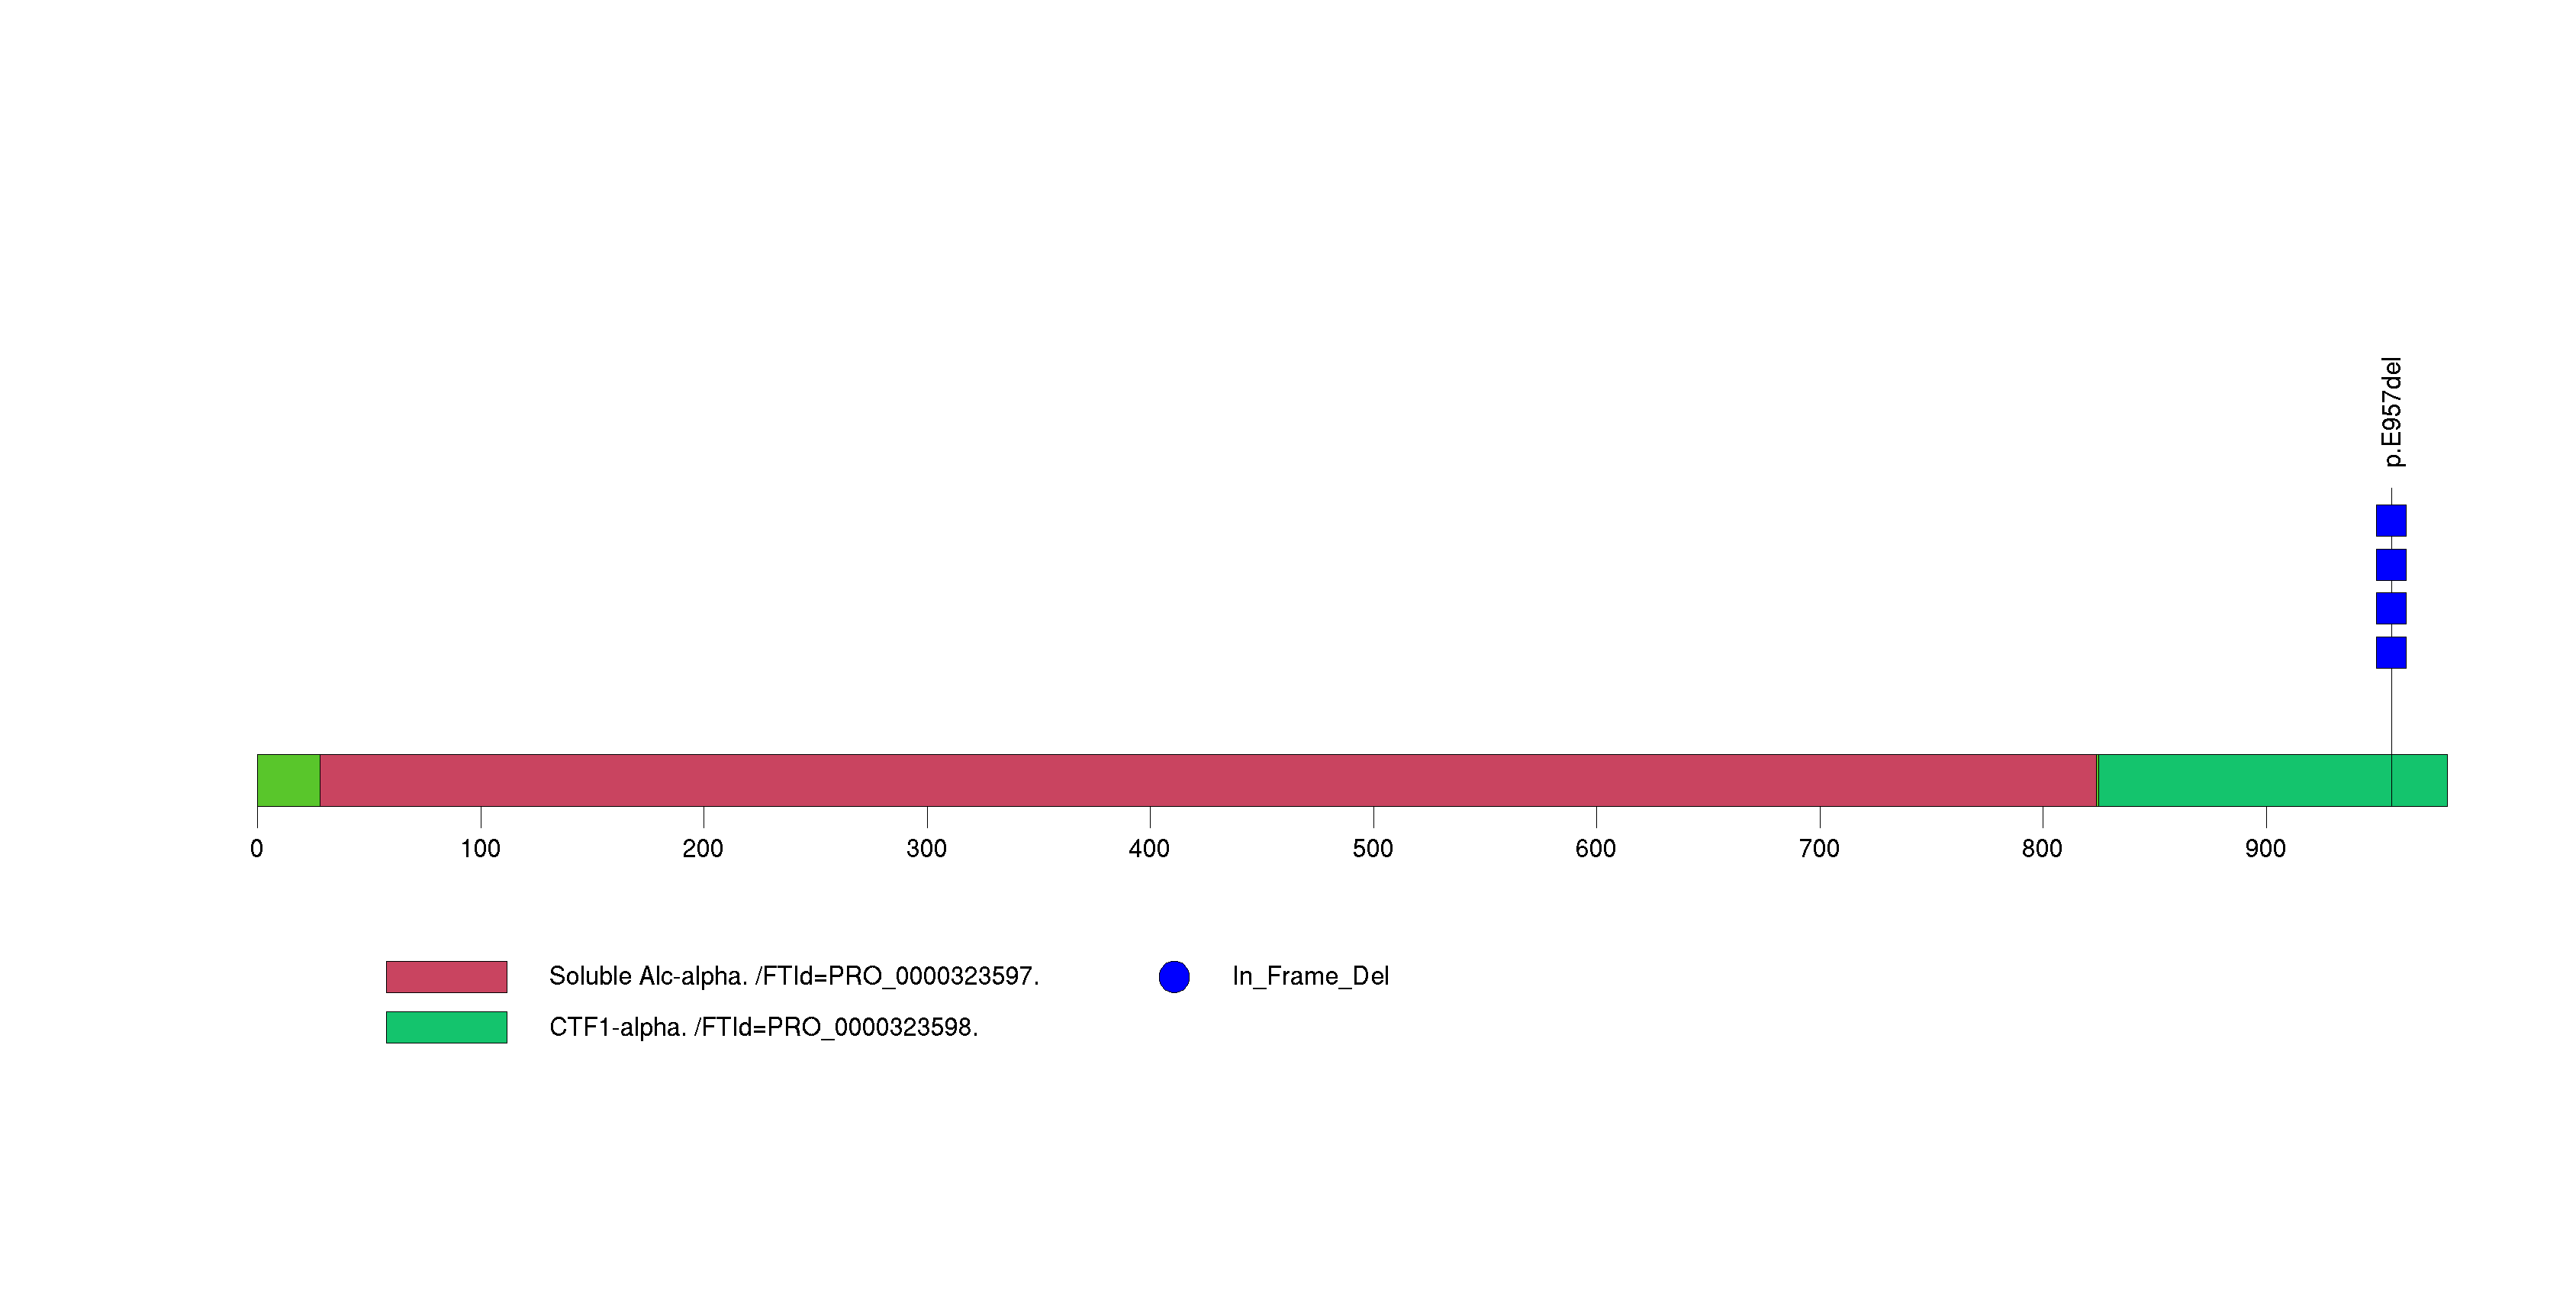
Figure S26. This figure depicts the distribution of mutations and mutation types across the CXXC1 significant gene.
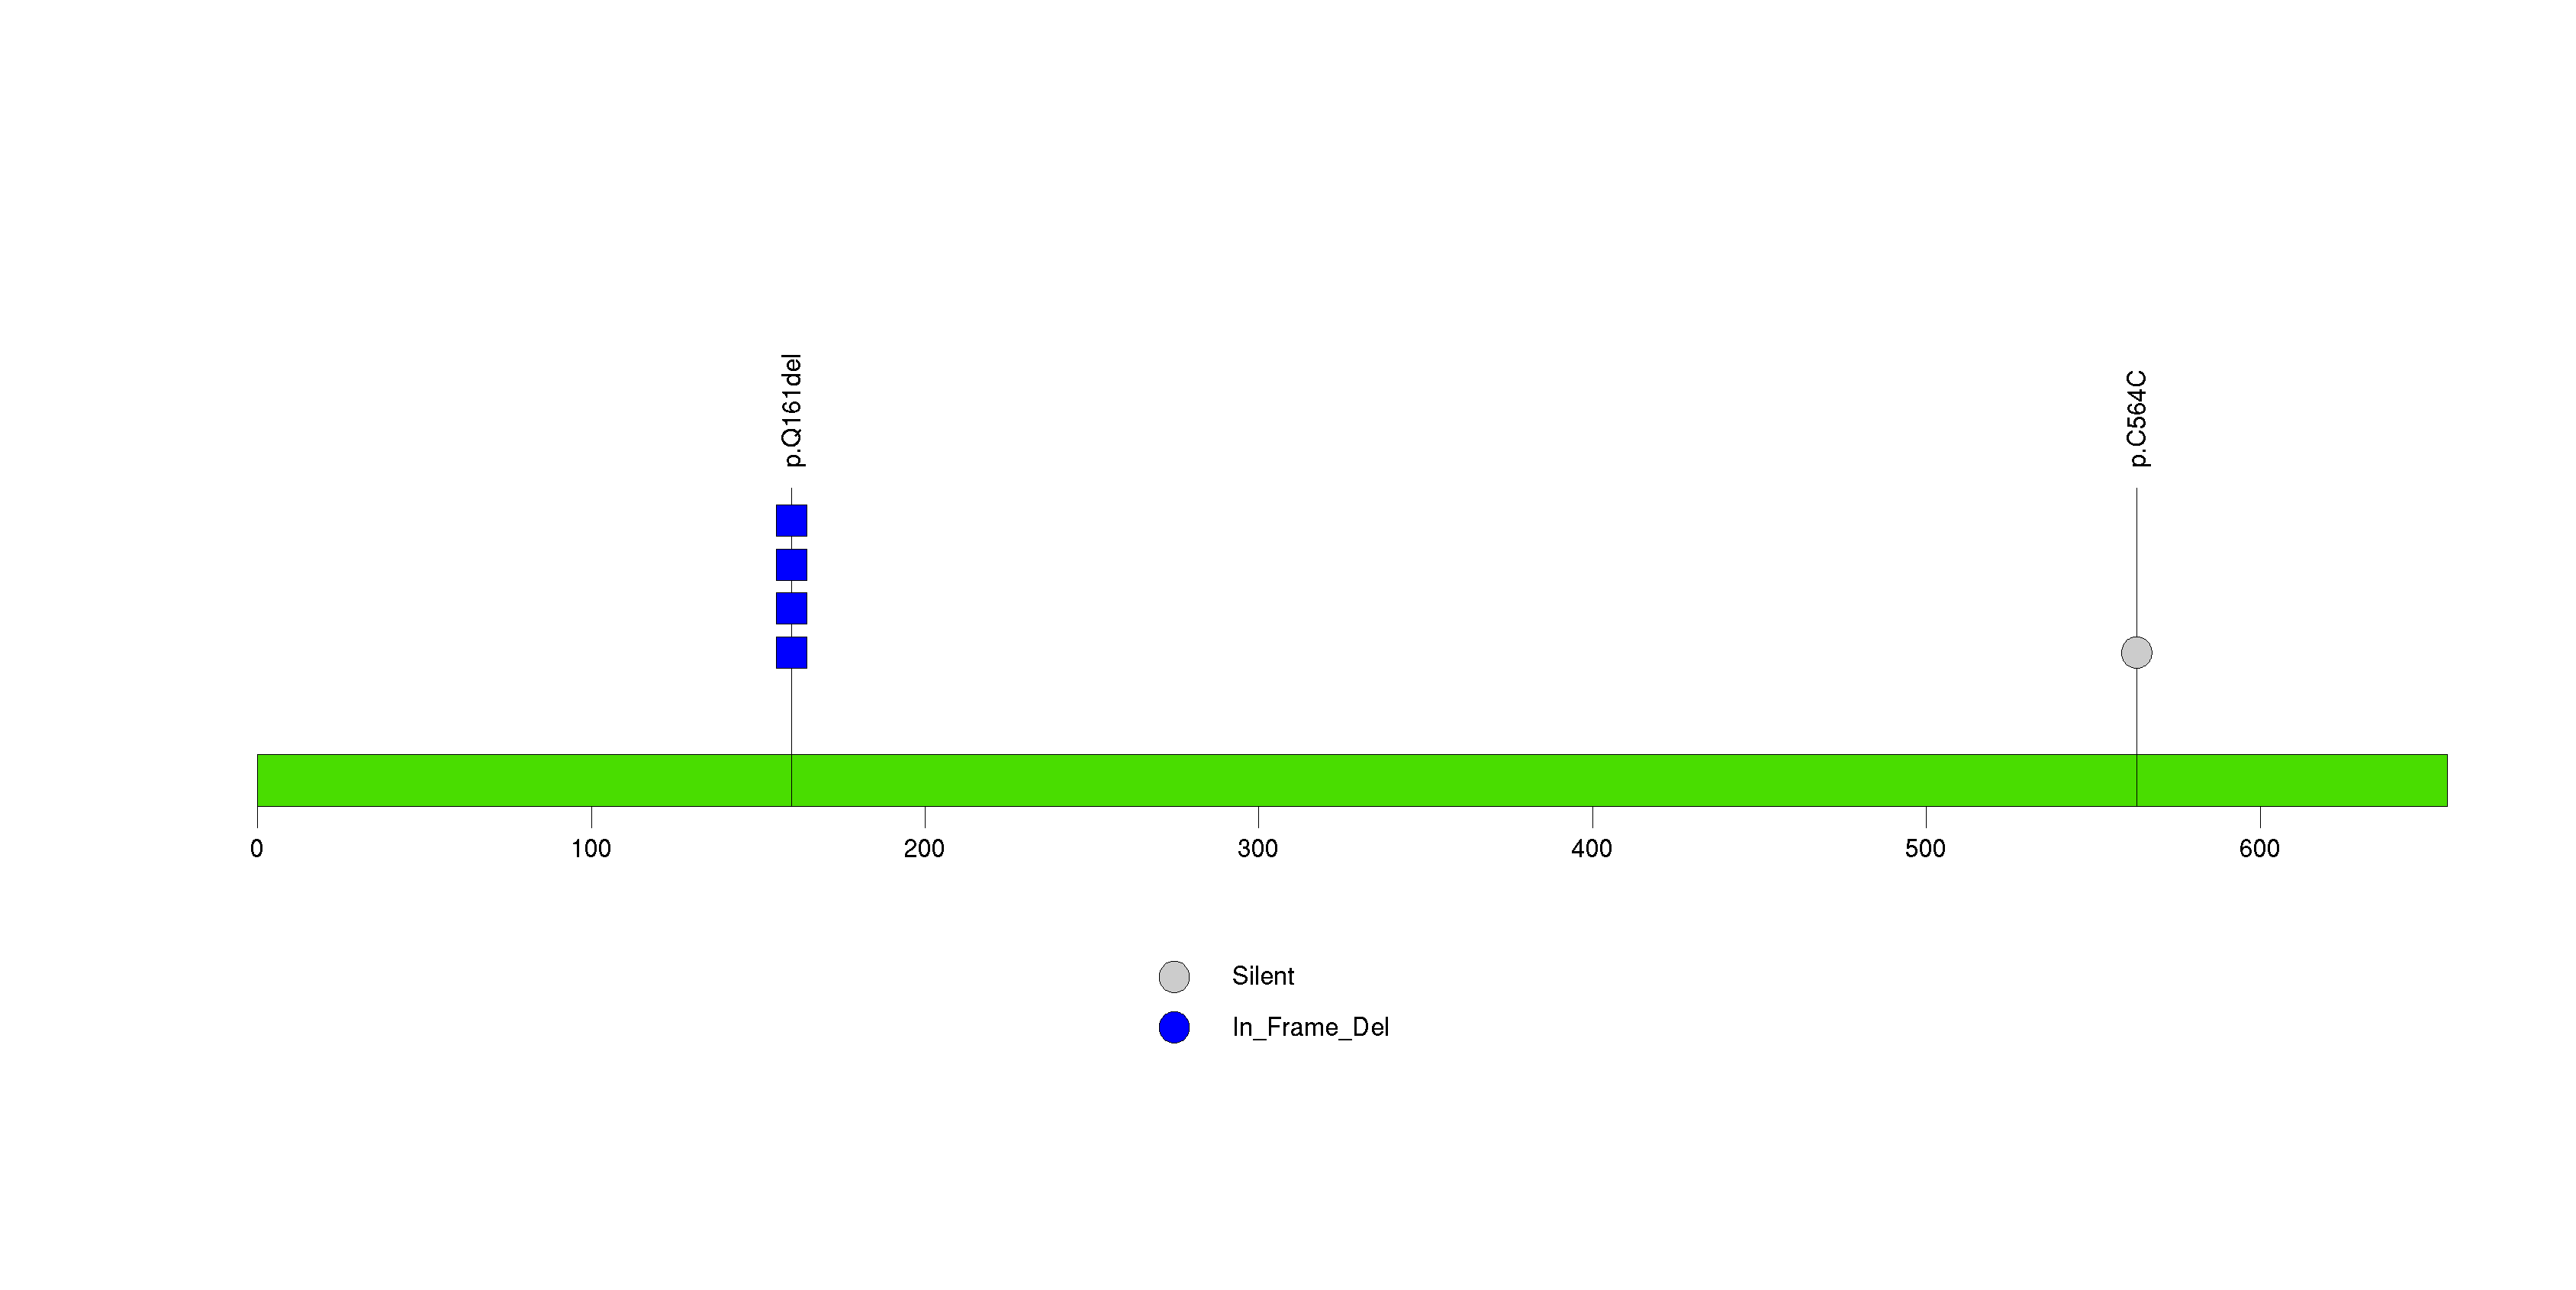
Figure S27. This figure depicts the distribution of mutations and mutation types across the FLT3LG significant gene.
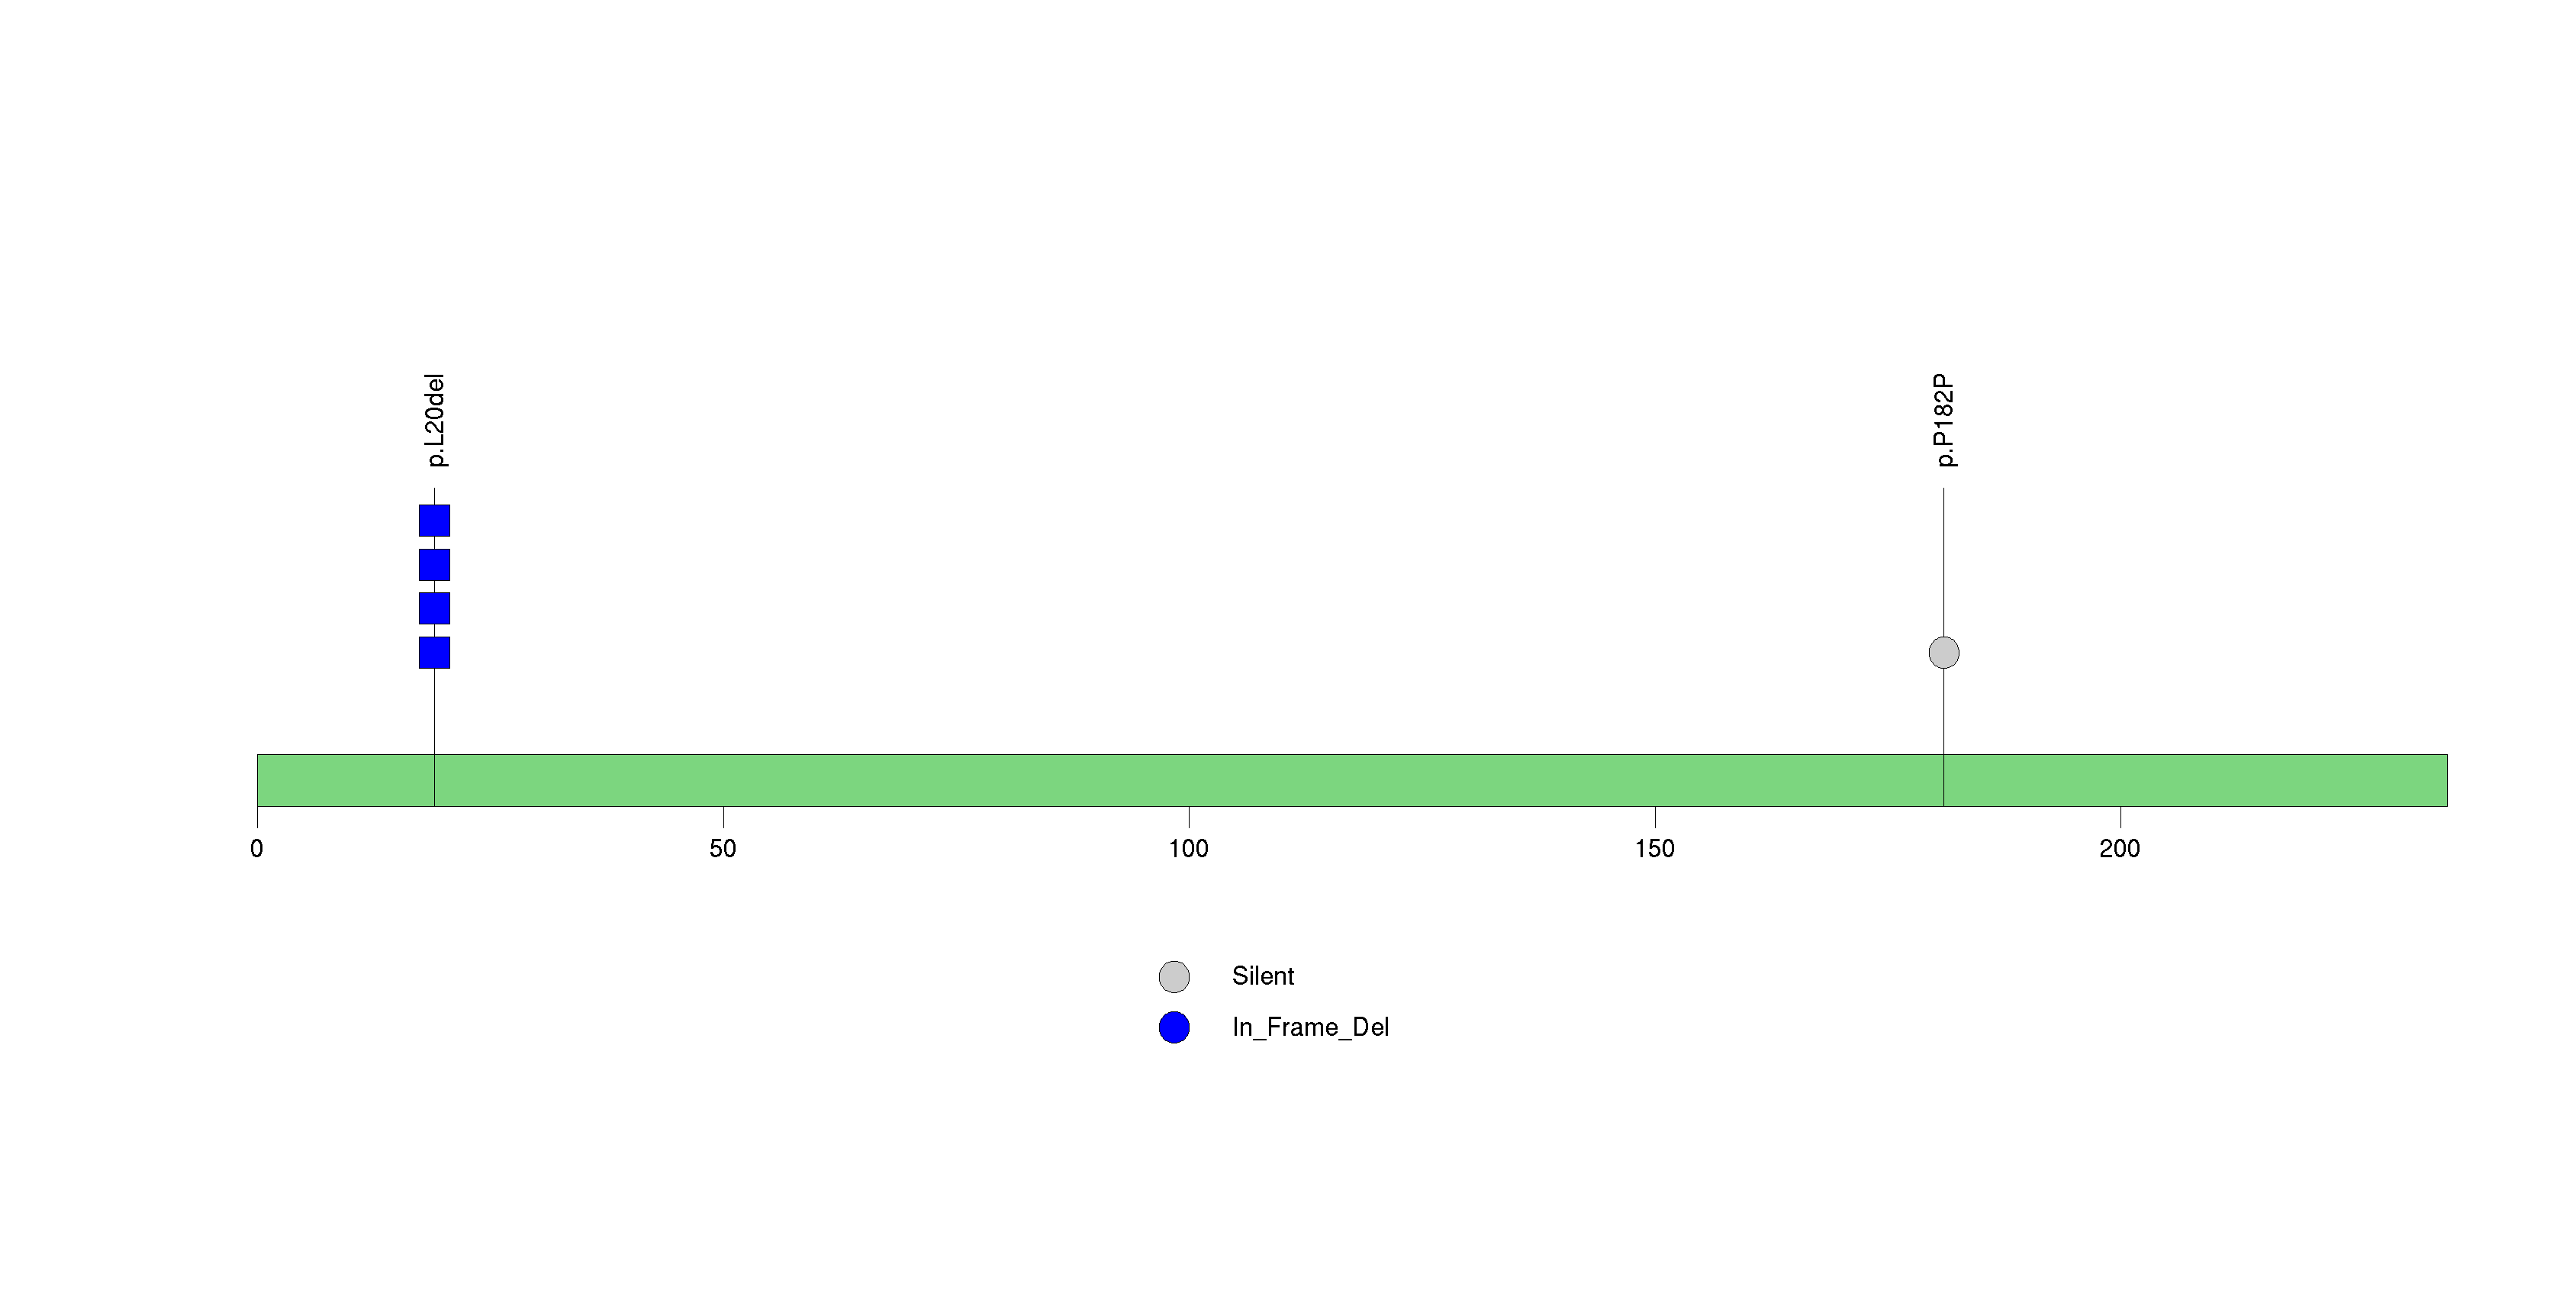
Figure S28. This figure depicts the distribution of mutations and mutation types across the FOXN3 significant gene.
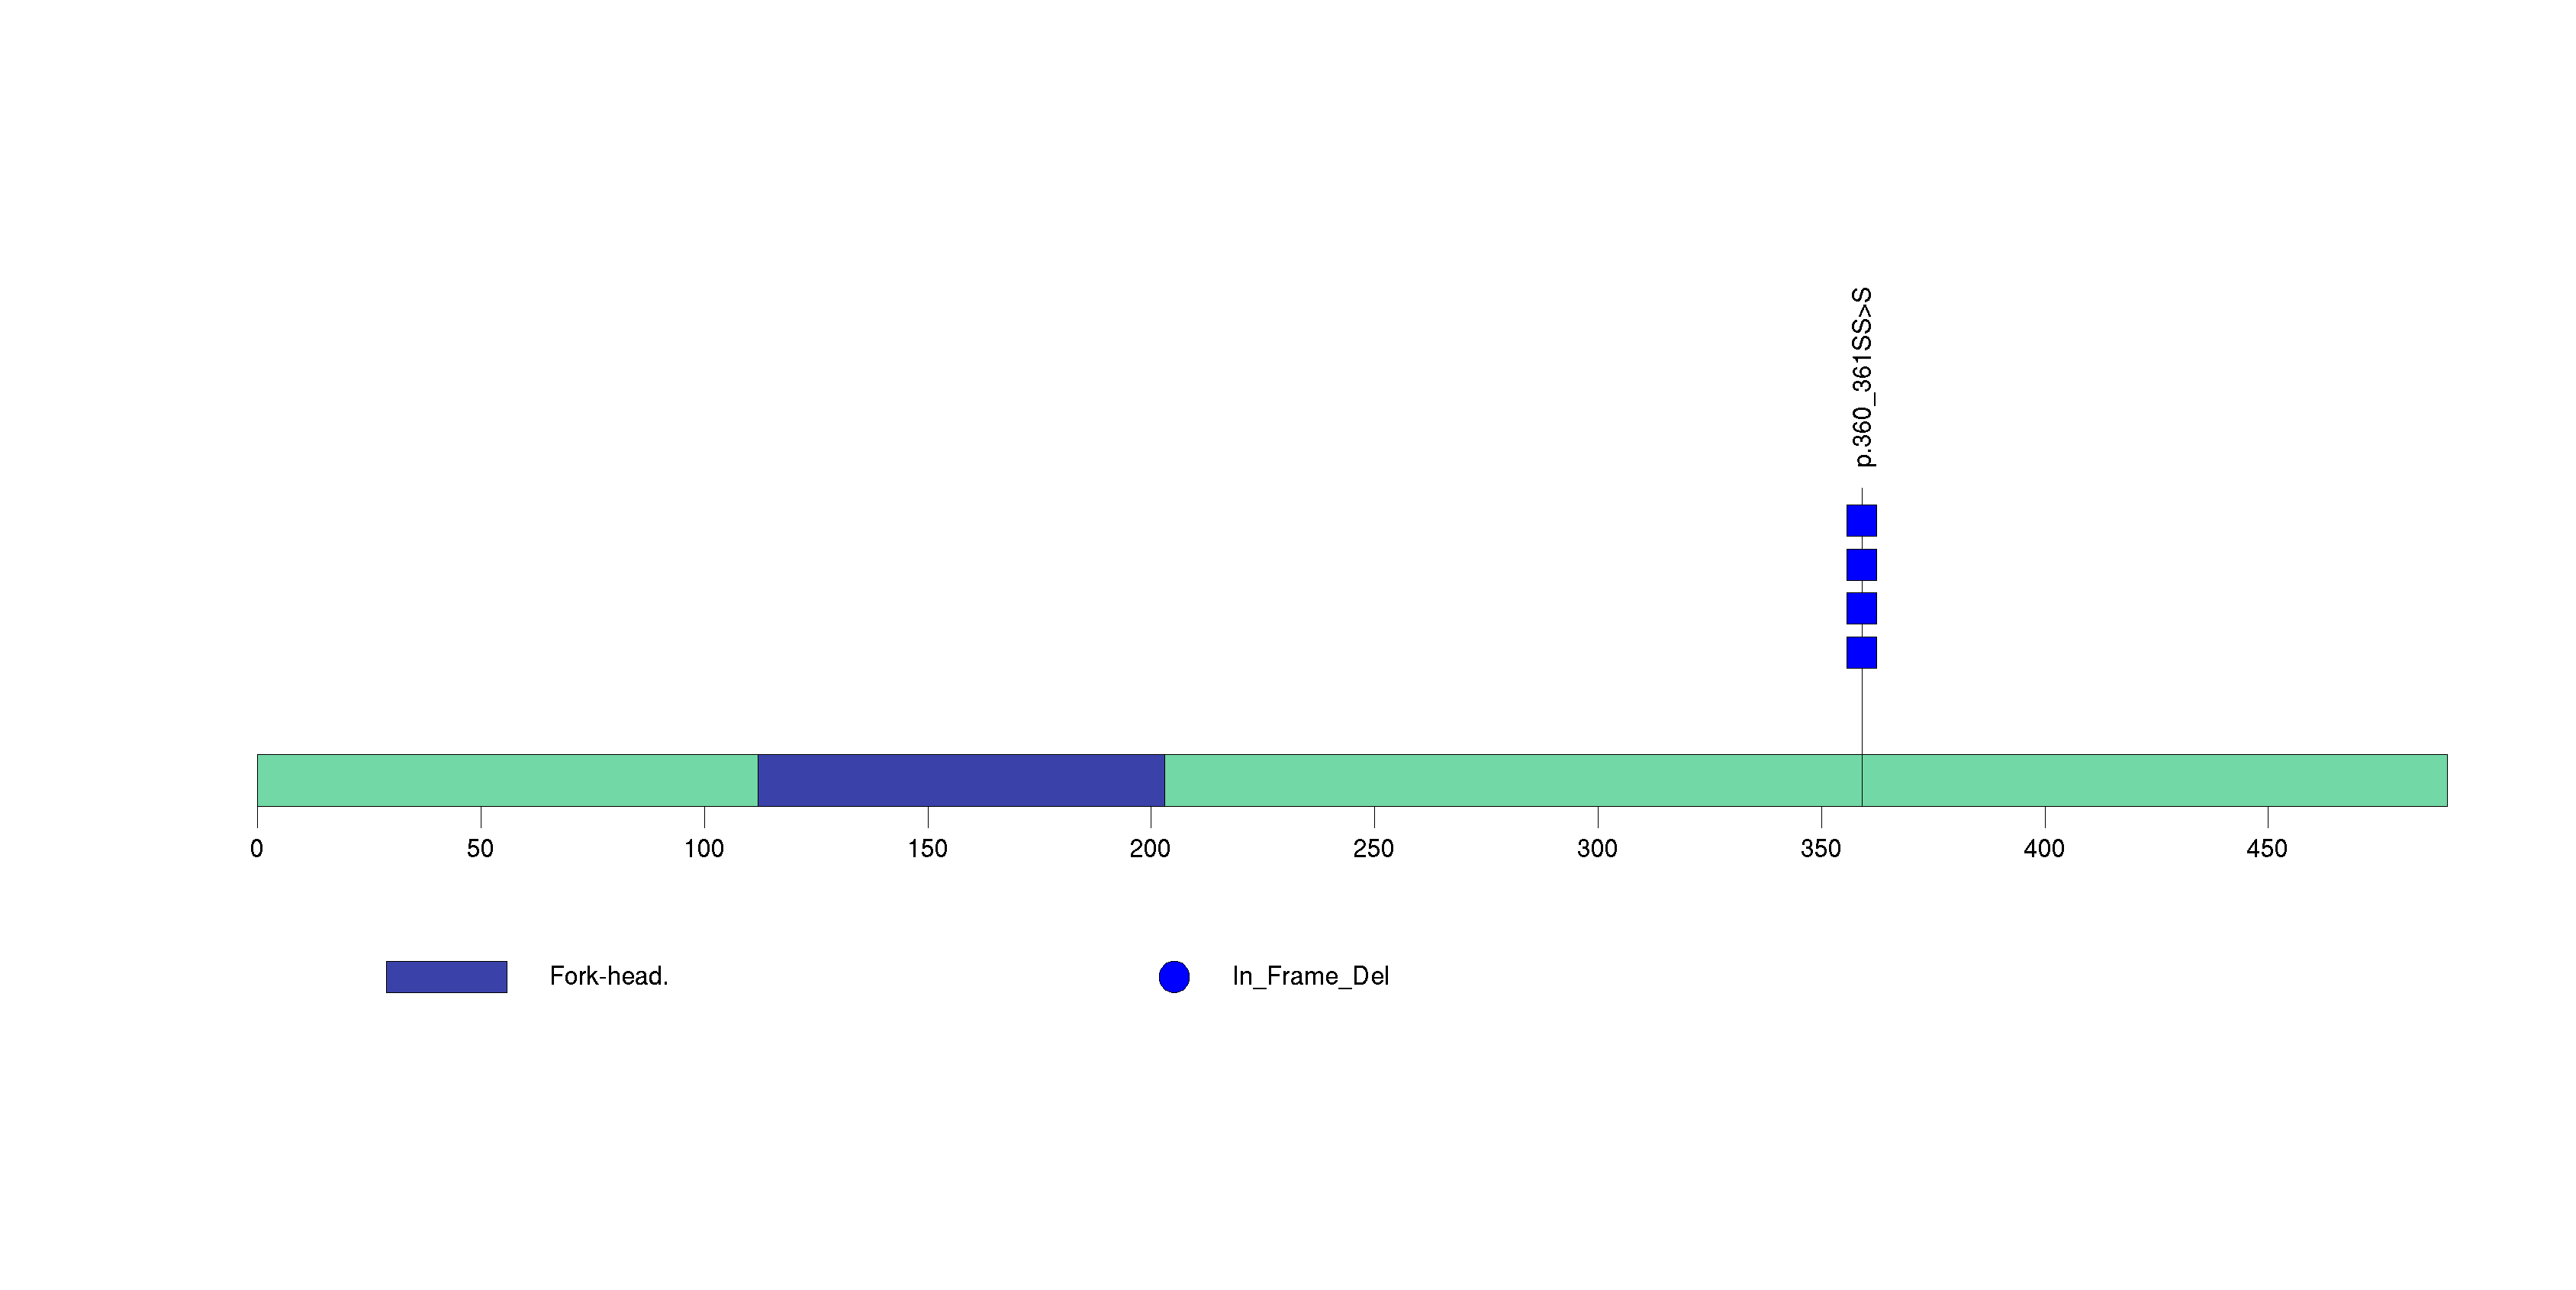
Figure S29. This figure depicts the distribution of mutations and mutation types across the FOXP1 significant gene.
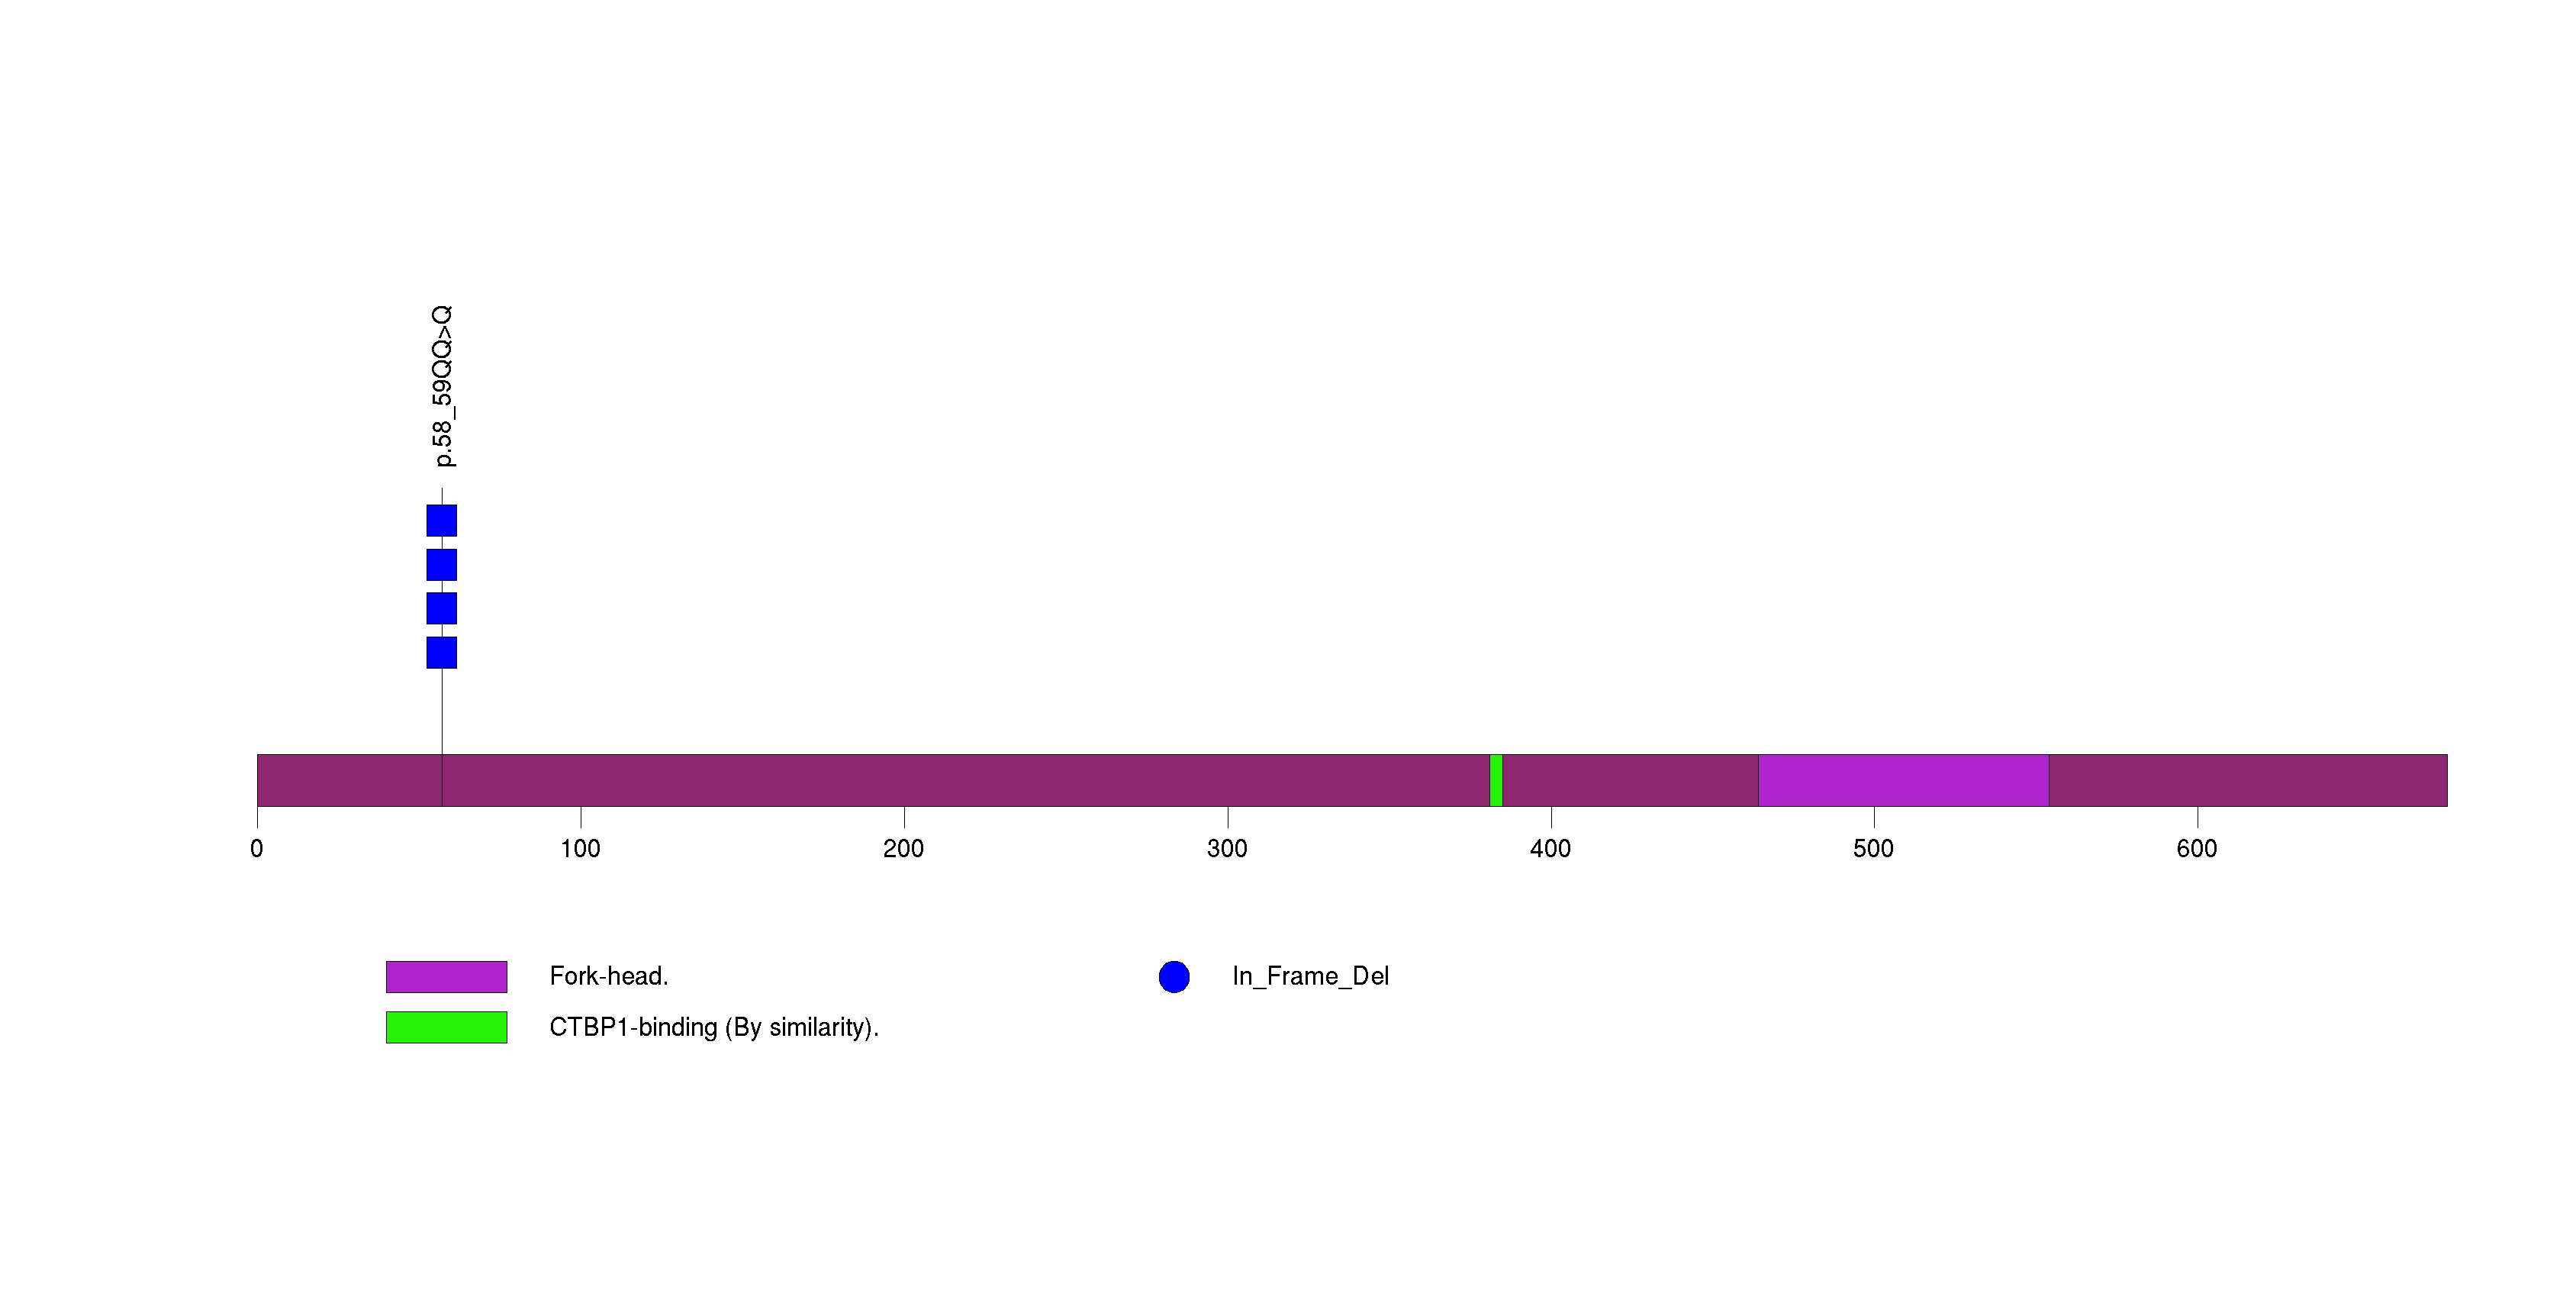
Figure S30. This figure depicts the distribution of mutations and mutation types across the GRIN1 significant gene.
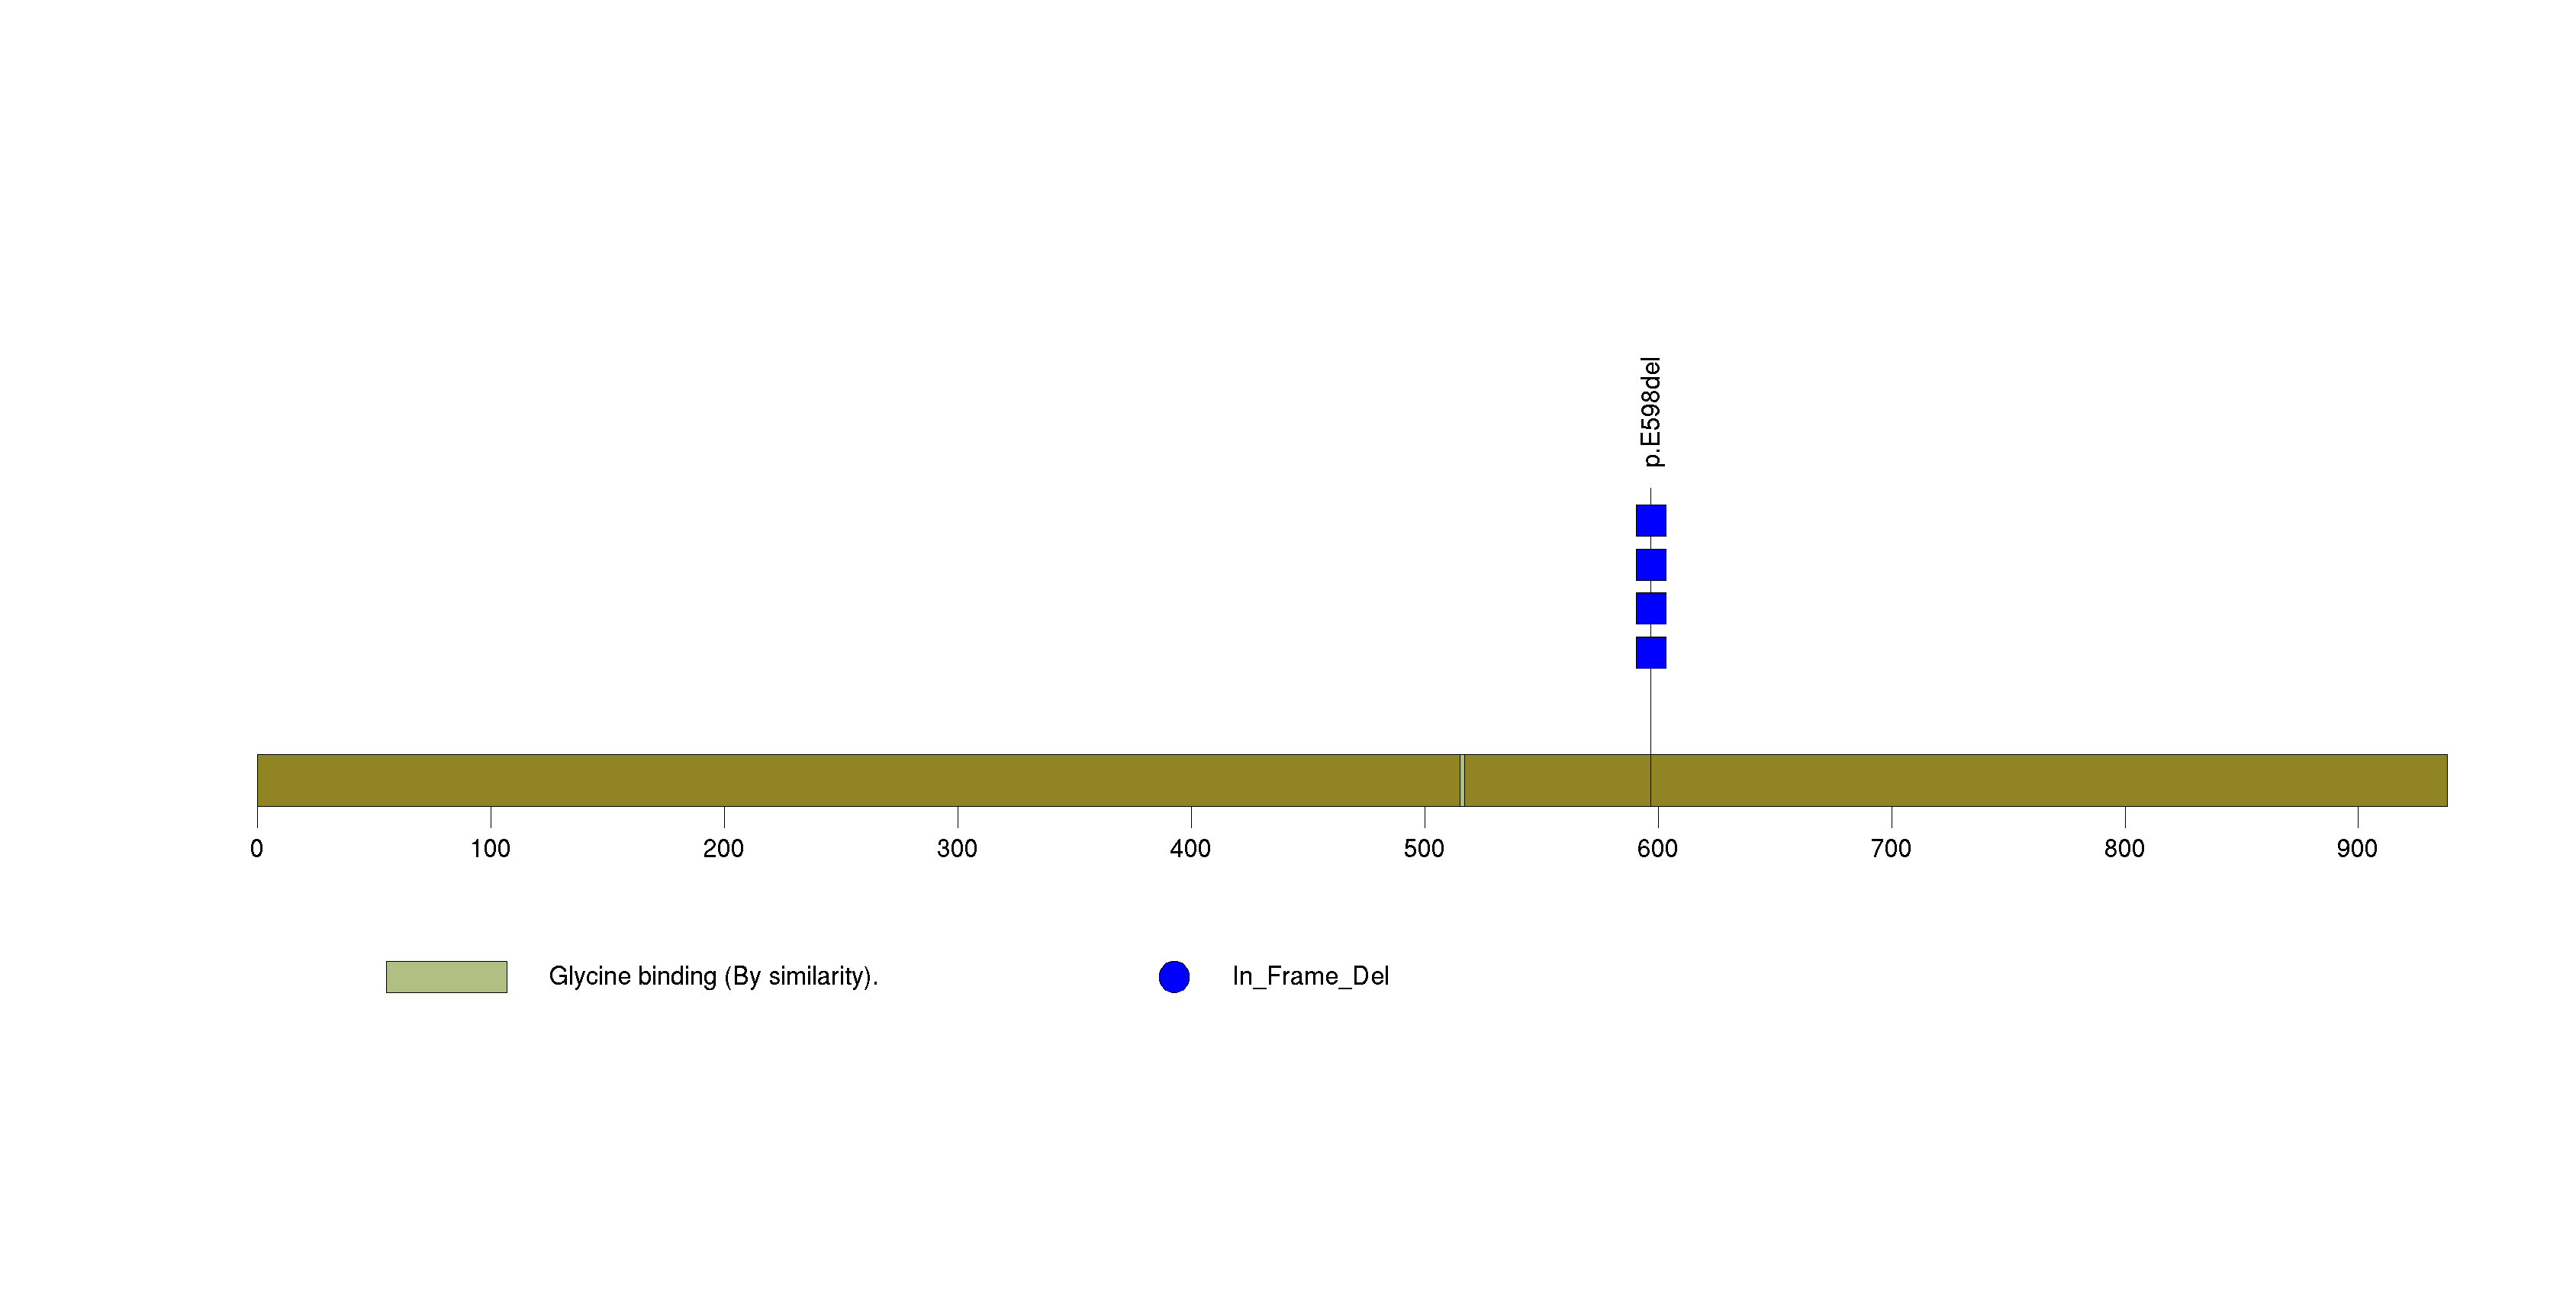
Figure S31. This figure depicts the distribution of mutations and mutation types across the HOXA11 significant gene.
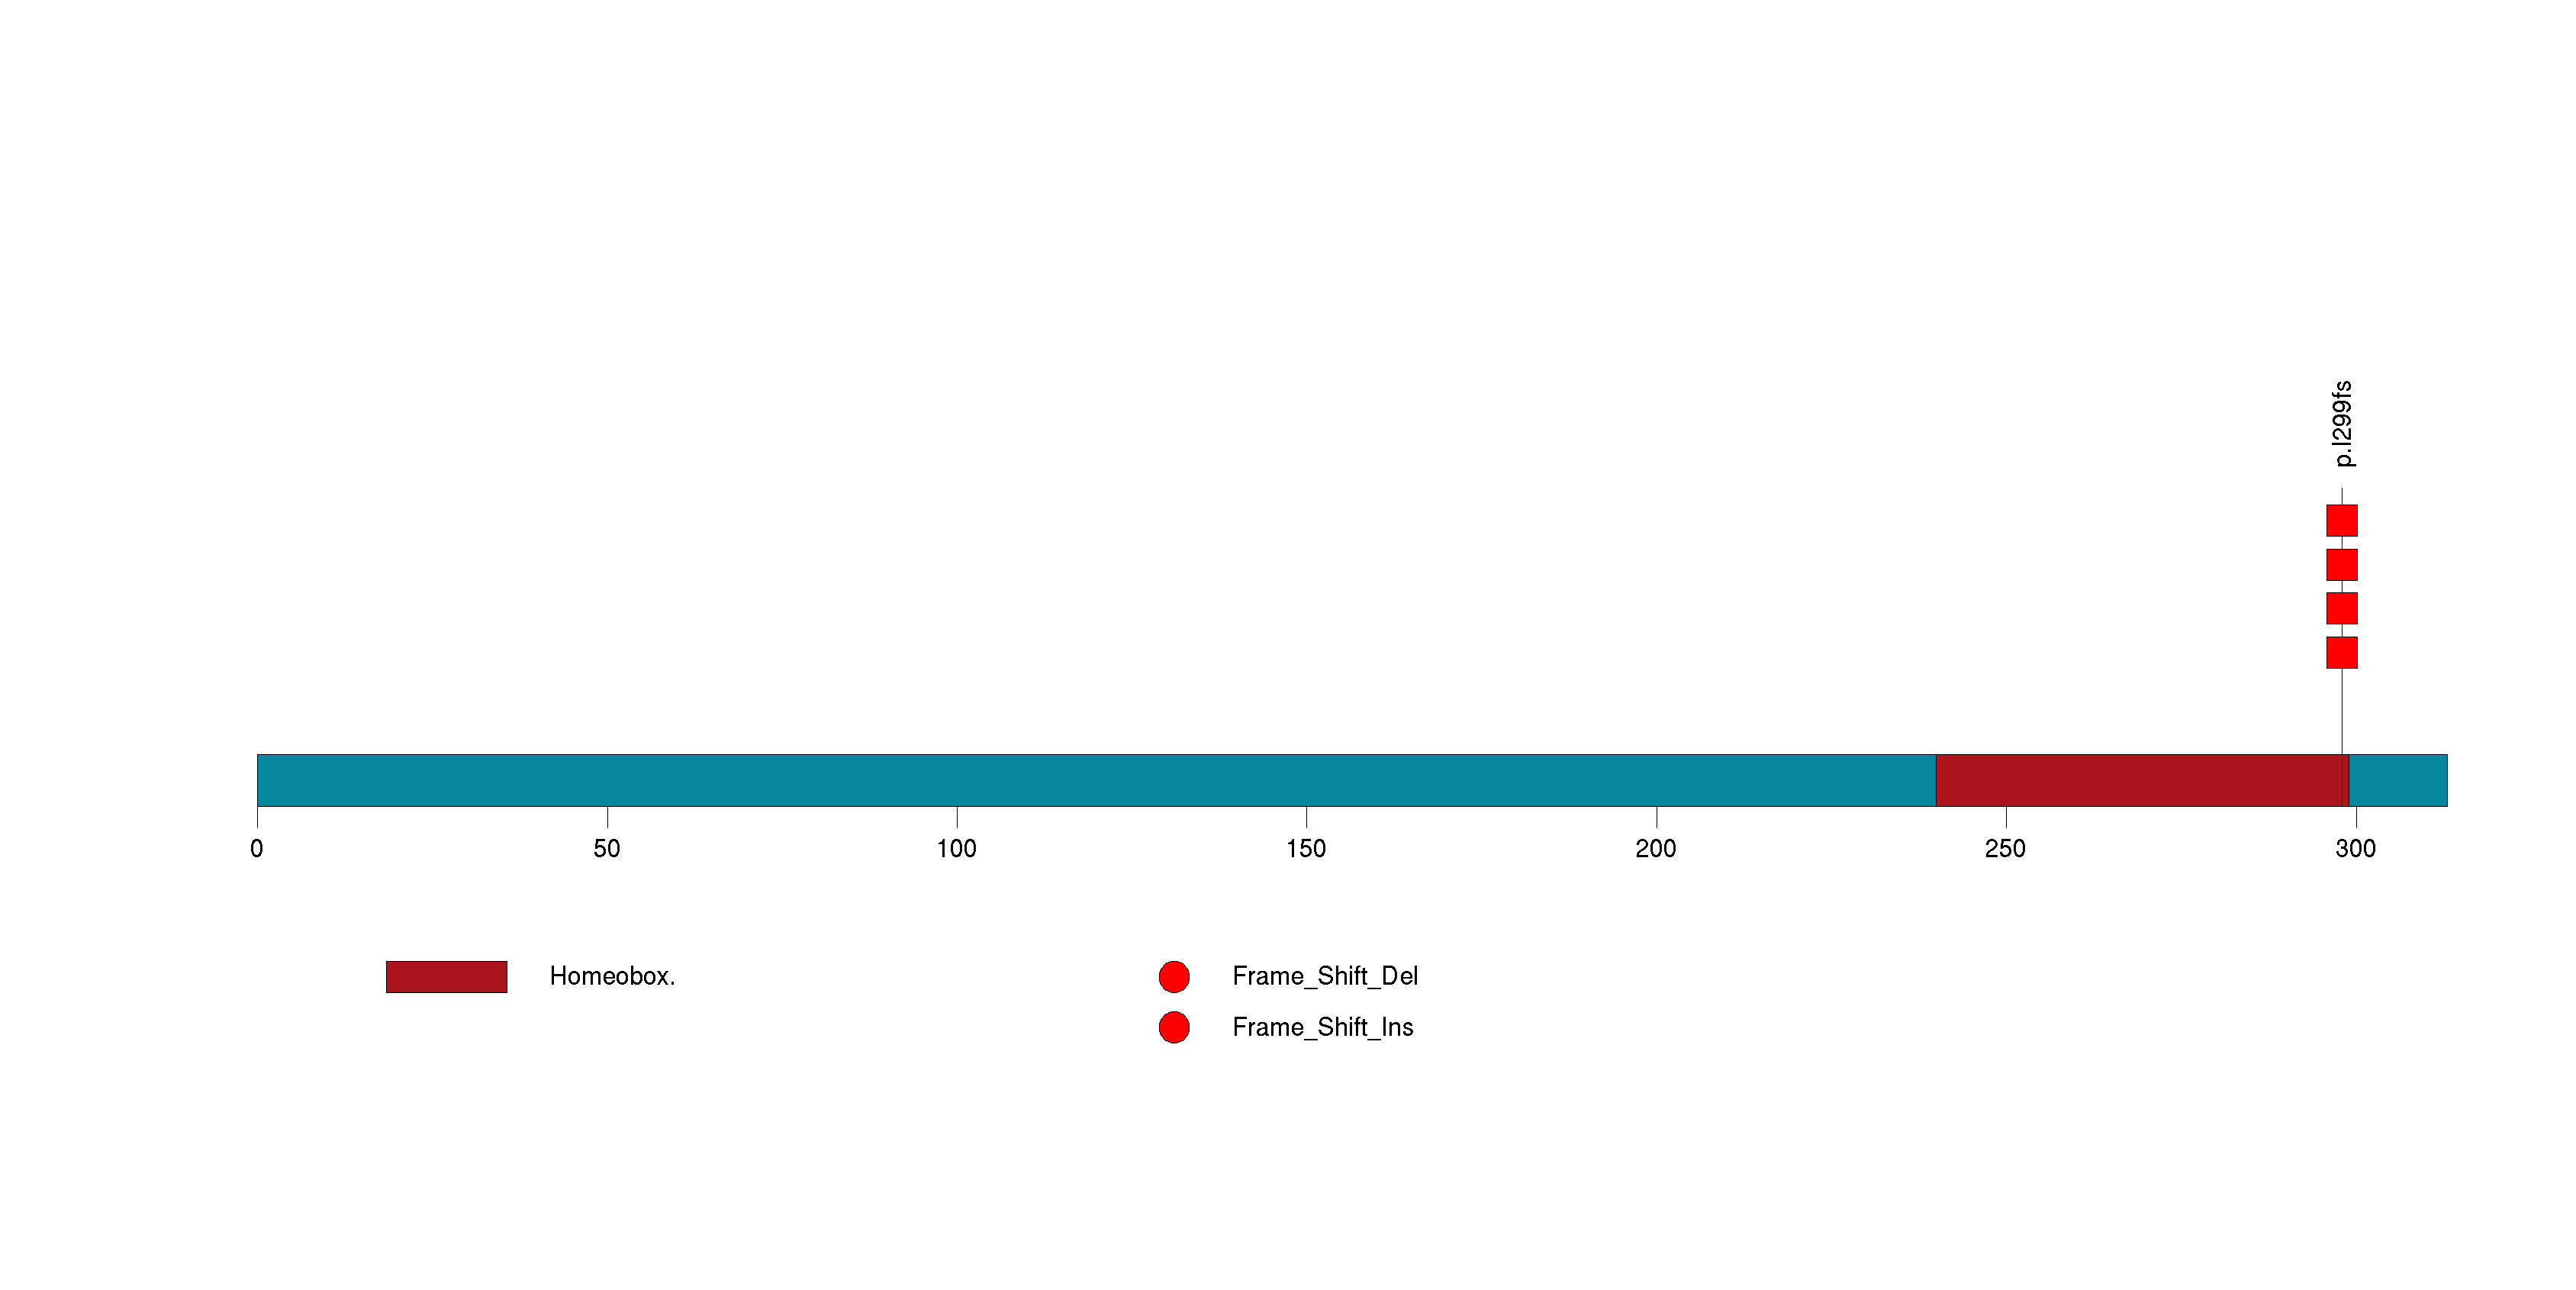
Figure S32. This figure depicts the distribution of mutations and mutation types across the KIF3B significant gene.
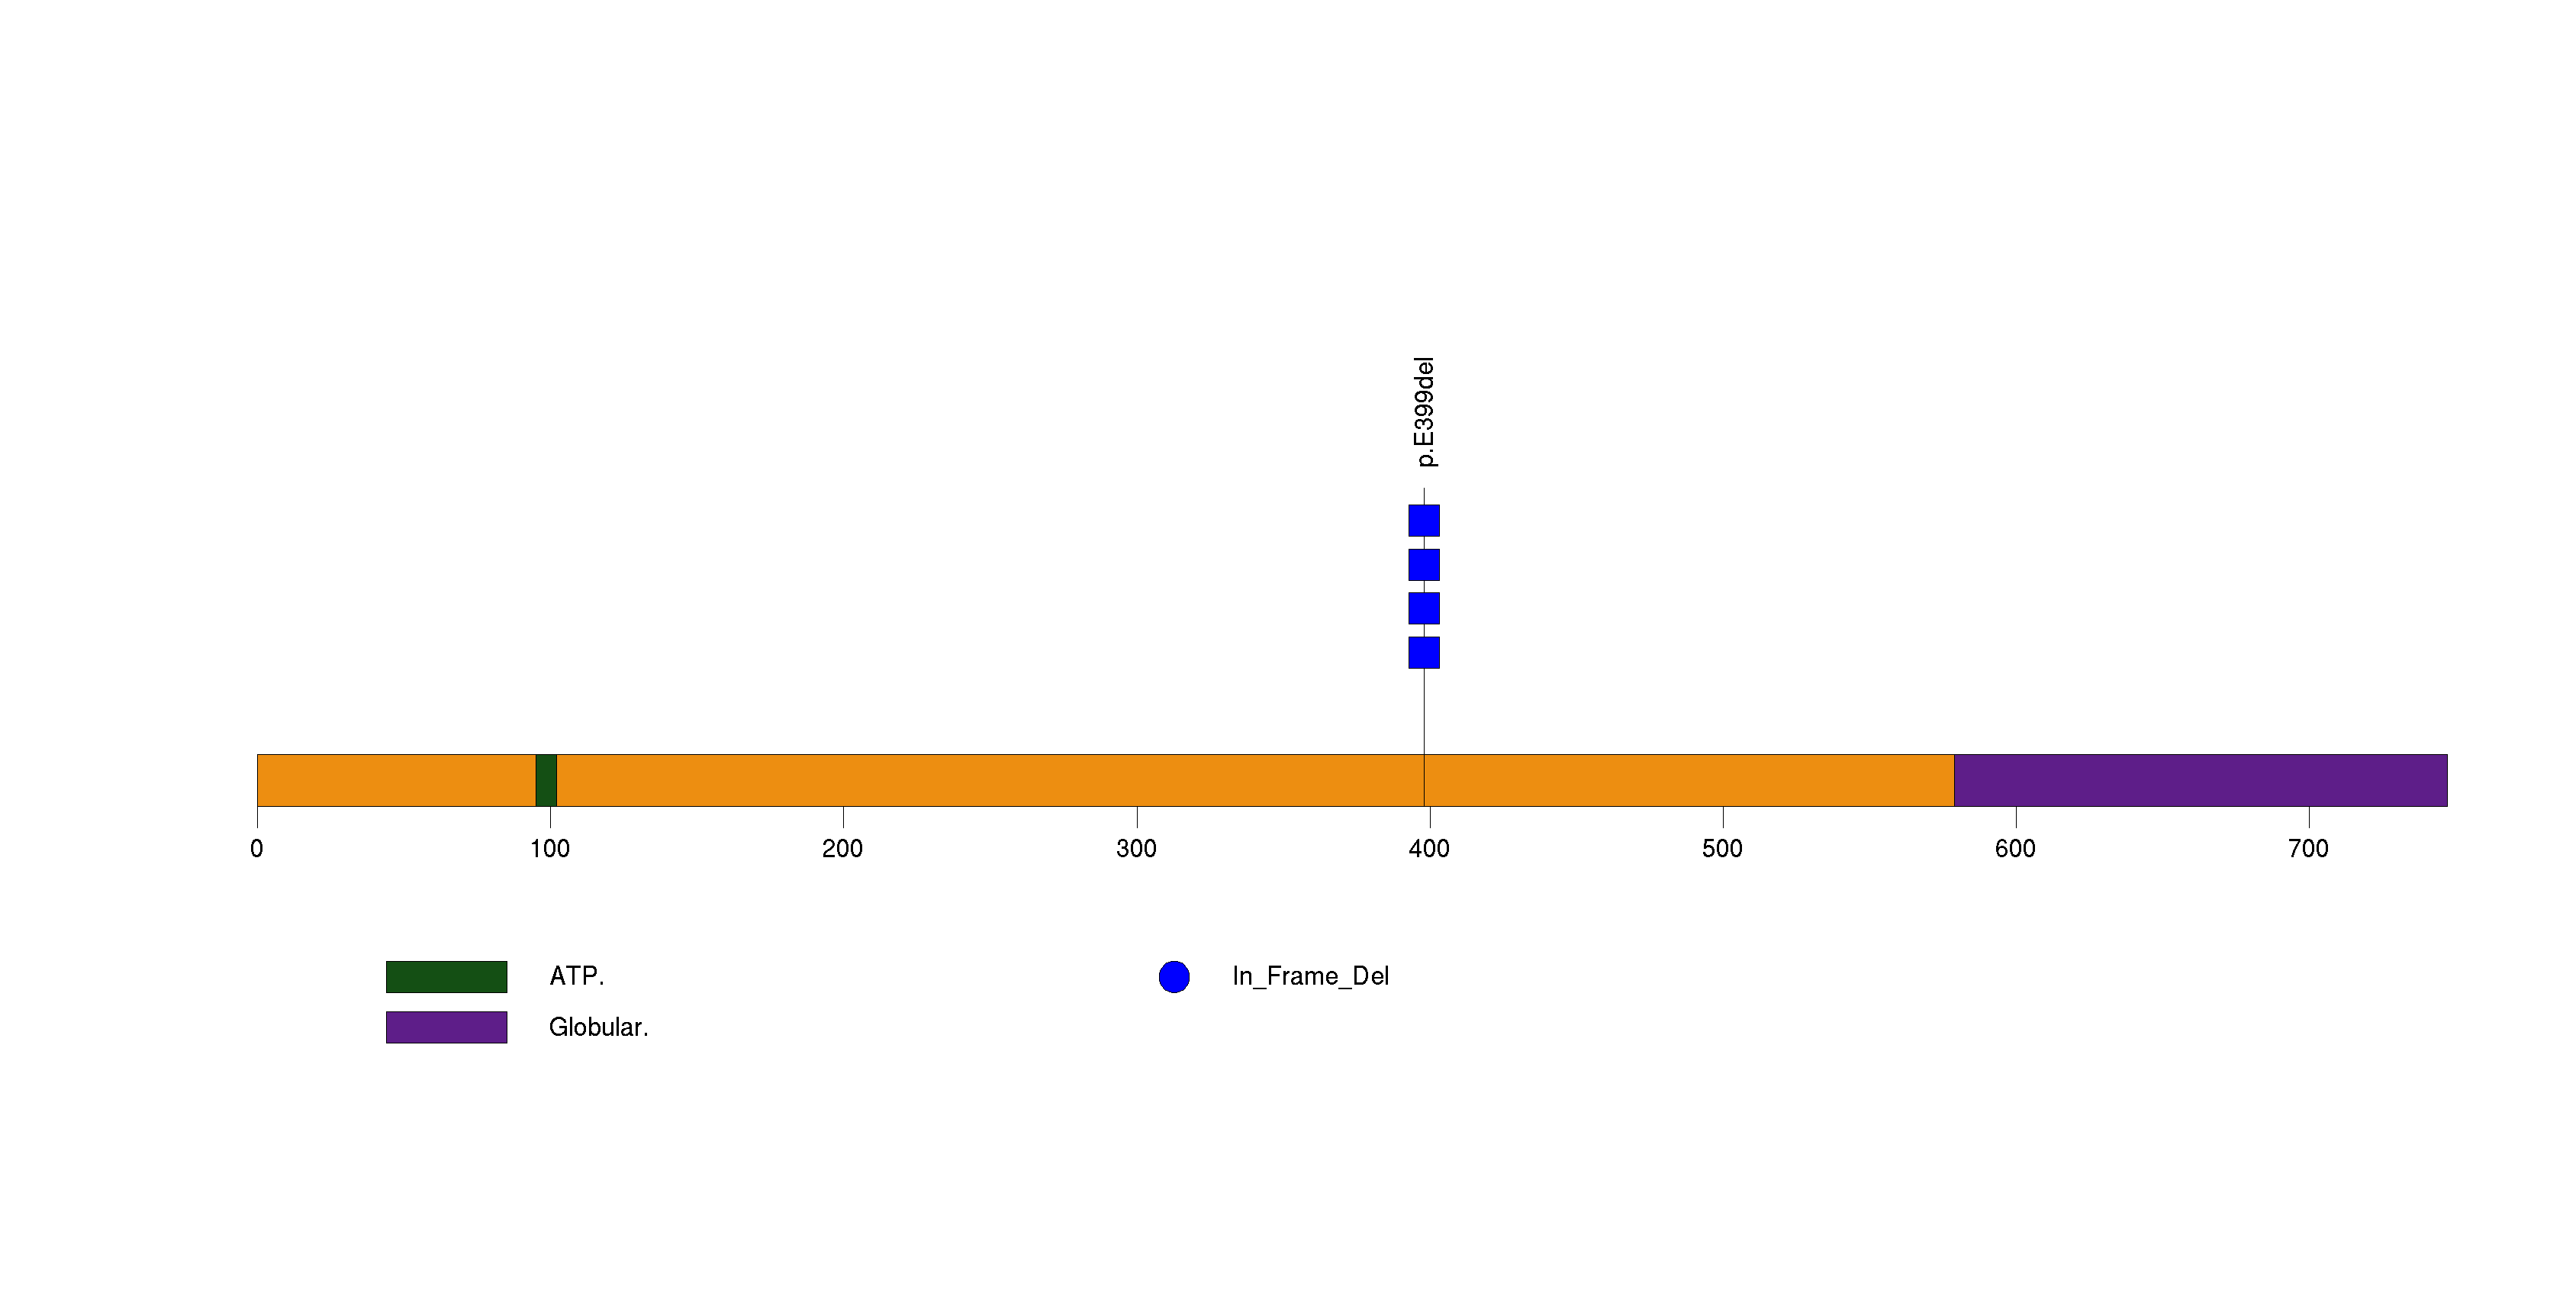
Figure S33. This figure depicts the distribution of mutations and mutation types across the MAP3K4 significant gene.
In this analysis, COSMIC is used as a filter to increase power by restricting the territory of each gene. Cosmic version: v48.
Table 4. Get Full Table Significantly mutated genes (COSMIC territory only). To access the database please go to: COSMIC. Number of significant genes found: 10. Number of genes displayed: 10
| rank | gene | description | n | cos | n_cos | N_cos | cos_ev | p | q |
|---|---|---|---|---|---|---|---|---|---|
| 1 | ZC3H3 | zinc finger CCCH-type containing 3 | 4 | 1 | 4 | 34 | 4 | 7.8e-16 | 3.5e-12 |
| 2 | KRAS | v-Ki-ras2 Kirsten rat sarcoma viral oncogene homolog | 24 | 51 | 24 | 1734 | 291429 | 4.2e-14 | 9.4e-11 |
| 3 | TP53 | tumor protein p53 | 22 | 308 | 19 | 10472 | 3969 | 2.4e-13 | 3.7e-10 |
| 4 | TNFRSF9 | tumor necrosis factor receptor superfamily, member 9 | 3 | 1 | 3 | 34 | 3 | 5e-13 | 5.7e-10 |
| 5 | CDKN2A | cyclin-dependent kinase inhibitor 2A (melanoma, p16, inhibits CDK4) | 6 | 315 | 6 | 10710 | 243 | 1.4e-11 | 1.3e-08 |
| 6 | SMAD4 | SMAD family member 4 | 8 | 159 | 5 | 5406 | 14 | 6e-11 | 4.5e-08 |
| 7 | ADAMTS18 | ADAM metallopeptidase with thrombospondin type 1 motif, 18 | 5 | 8 | 3 | 272 | 6 | 2.8e-10 | 1.8e-07 |
| 8 | TTK | TTK protein kinase | 2 | 2 | 2 | 68 | 6 | 4.3e-08 | 0.000025 |
| 9 | FHOD1 | formin homology 2 domain containing 1 | 1 | 1 | 1 | 34 | 1 | 0.00015 | 0.067 |
| 10 | PROKR2 | prokineticin receptor 2 | 1 | 1 | 1 | 34 | 1 | 0.00015 | 0.067 |
Note:
n - number of (nonsilent) mutations in this gene across the individual set.
cos = number of unique mutated sites in this gene in COSMIC
n_cos = overlap between n and cos.
N_cos = number of individuals times cos.
cos_ev = total evidence: number of reports in COSMIC for mutations seen in this gene.
p = p-value for seeing the observed amount of overlap in this gene)
q = q-value, False Discovery Rate (Benjamini-Hochberg procedure)
Table 5. Get Full Table Genes with Clustered Mutations
| num | gene | desc | n | mindist | nmuts0 | nmuts3 | nmuts12 | npairs0 | npairs3 | npairs12 |
|---|---|---|---|---|---|---|---|---|---|---|
| 1303 | KRAS | v-Ki-ras2 Kirsten rat sarcoma viral oncogene homolog | 24 | 0 | 196 | 196 | 196 | 196 | 196 | 196 |
| 2835 | ZNF91 | zinc finger protein 91 | 12 | 0 | 21 | 21 | 31 | 21 | 21 | 31 |
| 817 | F5 | coagulation factor V (proaccelerin, labile factor) | 8 | 0 | 21 | 21 | 21 | 21 | 21 | 21 |
| 2831 | ZNF844 | zinc finger protein 844 | 14 | 0 | 20 | 20 | 48 | 20 | 20 | 48 |
| 2776 | ZNF479 | zinc finger protein 479 | 9 | 0 | 16 | 16 | 16 | 16 | 16 | 16 |
| 1754 | OTUD4 | OTU domain containing 4 | 11 | 0 | 15 | 15 | 15 | 15 | 15 | 15 |
| 2322 | SPDYE5 | speedy homolog E5 (Xenopus laevis) | 8 | 0 | 13 | 13 | 28 | 13 | 13 | 28 |
| 2786 | ZNF563 | zinc finger protein 563 | 9 | 0 | 11 | 11 | 11 | 11 | 11 | 11 |
| 2117 | RPTN | repetin | 11 | 0 | 10 | 10 | 10 | 10 | 10 | 10 |
| 2825 | ZNF799 | zinc finger protein 799 | 8 | 0 | 10 | 10 | 10 | 10 | 10 | 10 |
Note:
n - number of mutations in this gene in the individual set.
mindist - distance (in aa) between closest pair of mutations in this gene
npairs3 - how many pairs of mutations are within 3 aa of each other.
npairs12 - how many pairs of mutations are within 12 aa of each other.
Table 6. Get Full Table A Ranked List of Significantly Mutated Genesets. (Source: MSigDB GSEA Cannonical Pathway Set).Number of significant genesets found: 38. Number of genesets displayed: 10
| rank | geneset | description | genes | N_genes | mut_tally | N | n | npat | nsite | nsil | n1 | n2 | n3 | n4 | n5 | n6 | p_ns_s | p | q |
|---|---|---|---|---|---|---|---|---|---|---|---|---|---|---|---|---|---|---|---|
| 1 | RNAPATHWAY | dsRNA-activated protein kinase phosphorylates elF2a, which generally inhibits translation, and activates NF-kB to provoke inflammation. | CHUK, DNAJC3, EIF2S1, EIF2S2, MAP3K14, NFKB1, NFKBIA, PRKR, RELA, TP53 | 9 | DNAJC3(1), NFKBIA(1), TP53(22) | 526284 | 24 | 23 | 23 | 1 | 4 | 0 | 1 | 6 | 13 | 0 | 0.042 | 3.3e-15 | 5.4e-13 |
| 2 | TIDPATHWAY | On ligand binding, interferon gamma receptors stimulate JAK2 kinase to phosphorylate STAT transcription factors, which promote expression of interferon responsive genes. | DNAJA3, HSPA1A, IFNG, IFNGR1, IFNGR2, IKBKB, JAK2, LIN7A, NFKB1, NFKBIA, RB1, RELA, TIP-1, TNF, TNFRSF1A, TNFRSF1B, TP53, USH1C, WT1 | 18 | IFNGR1(1), NFKBIA(1), TP53(22) | 971211 | 24 | 24 | 23 | 1 | 4 | 0 | 1 | 6 | 13 | 0 | 0.037 | 3.9e-15 | 5.4e-13 |
| 3 | RBPATHWAY | The ATM protein kinase recognizes DNA damage and blocks cell cycle progression by phosphorylating chk1 and p53, which normally inhibits Rb to allow G1/S transitions. | ATM, CDC2, CDC25A, CDC25B, CDC25C, CDK2, CDK4, CHEK1, MYT1, RB1, TP53, WEE1, YWHAH | 12 | ATM(1), CDC25A(1), CDC25C(2), CHEK1(1), MYT1(2), TP53(22) | 910791 | 29 | 25 | 27 | 1 | 4 | 0 | 1 | 6 | 18 | 0 | 0.061 | 5e-15 | 5.4e-13 |
| 4 | ARFPATHWAY | Cyclin-dependent kinase inhibitor 2A is a tumor suppressor that induces G1 arrest and can activate the p53 pathway, leading to G2/M arrest. | ABL1, CDKN2A, E2F1, MDM2, MYC, PIK3CA, PIK3R1, POLR1A, POLR1B, POLR1C, POLR1D, RAC1, RB1, TBX2, TP53, TWIST1 | 16 | CDKN2A(6), MYC(5), RAC1(1), TP53(22) | 1068936 | 34 | 24 | 28 | 0 | 5 | 1 | 1 | 5 | 22 | 0 | 0.0021 | 5.8e-15 | 5.4e-13 |
| 5 | P53PATHWAY | p53 induces cell cycle arrest or apoptosis under conditions of DNA damage. | APAF1, ATM, BAX, BCL2, CCND1, CCNE1, CDK2, CDK4, CDKN1A, E2F1, GADD45A, MDM2, PCNA, RB1, TIMP3, TP53 | 16 | ATM(1), TP53(22) | 944504 | 23 | 23 | 22 | 0 | 4 | 0 | 1 | 5 | 13 | 0 | 0.013 | 5.9e-15 | 5.4e-13 |
| 6 | PLK3PATHWAY | Active Plk3 phosphorylates CDC25c, blocking the G2/M transition, and phosphorylates p53 to induce apoptosis. | ATM, ATR, CDC25C, CHEK1, CHEK2, CNK, TP53, YWHAH | 7 | ATM(1), ATR(2), CDC25C(2), CHEK1(1), CHEK2(1), TP53(22) | 819506 | 29 | 26 | 27 | 3 | 4 | 1 | 1 | 7 | 16 | 0 | 0.29 | 6.6e-15 | 5.4e-13 |
| 7 | SA_G1_AND_S_PHASES | Cdk2, 4, and 6 bind cyclin D in G1, while cdk2/cyclin E promotes the G1/S transition. | ARF1, ARF3, CCND1, CDK2, CDK4, CDKN1A, CDKN1B, CDKN2A, CFL1, E2F1, E2F2, MDM2, NXT1, PRB1, TP53 | 15 | CDKN2A(6), PRB1(2), TP53(22) | 445333 | 30 | 22 | 28 | 2 | 4 | 1 | 1 | 7 | 17 | 0 | 0.041 | 7.4e-15 | 5.4e-13 |
| 8 | TERTPATHWAY | hTERC, the RNA subunit of telomerase, and hTERT, the catalytic protein subunit, are required for telomerase activity and are overexpressed in many cancers. | HDAC1, MAX, MYC, SP1, SP3, TP53, WT1, ZNF42 | 7 | MYC(5), SP3(1), TP53(22) | 365474 | 28 | 24 | 23 | 0 | 4 | 1 | 1 | 5 | 17 | 0 | 0.0048 | 7.6e-15 | 5.4e-13 |
| 9 | G1PATHWAY | CDK4/6-cyclin D and CDK2-cyclin E phosphorylate Rb, which allows the transcription of genes needed for the G1/S cell cycle transition. | ABL1, ATM, ATR, CCNA1, CCND1, CCNE1, CDC2, CDC25A, CDK2, CDK4, CDK6, CDKN1A, CDKN1B, CDKN2A, CDKN2B, DHFR, E2F1, GSK3B, HDAC1, MADH3, MADH4, RB1, SKP2, TFDP1, TGFB1, TGFB2, TGFB3, TP53 | 25 | ATM(1), ATR(2), CDC25A(1), CDKN2A(6), TP53(22) | 1573452 | 32 | 25 | 30 | 1 | 4 | 2 | 1 | 6 | 19 | 0 | 0.012 | 7.9e-15 | 5.4e-13 |
| 10 | CHEMICALPATHWAY | DNA damage promotes Bid cleavage, which stimulates mitochondrial cytochrome c release and consequent caspase activation, resulting in apoptosis. | ADPRT, AKT1, APAF1, ATM, BAD, BAX, BCL2, BCL2L1, BID, CASP3, CASP6, CASP7, CASP9, CYCS, EIF2S1, PRKCA, PRKCB1, PTK2, PXN, STAT1, TLN1, TP53 | 20 | AKT1(1), ATM(1), PTK2(1), TP53(22) | 1425530 | 25 | 23 | 24 | 0 | 4 | 0 | 1 | 6 | 14 | 0 | 0.01 | 2.5e-13 | 1.6e-11 |
Table 7. Get Full Table A Ranked List of Significantly Mutated Genesets (Excluding Significantly Mutated Genes). Number of significant genesets found: 0. Number of genesets displayed: 10
| rank | geneset | description | genes | N_genes | mut_tally | N | n | npat | nsite | nsil | n1 | n2 | n3 | n4 | n5 | n6 | p_ns_s | p | q |
|---|---|---|---|---|---|---|---|---|---|---|---|---|---|---|---|---|---|---|---|
| 1 | HSA00785_LIPOIC_ACID_METABOLISM | Genes involved in lipoic acid metabolism | LIAS, LIPT1, LOC387787 | 2 | LIAS(2) | 77825 | 2 | 2 | 2 | 0 | 0 | 0 | 0 | 1 | 1 | 0 | 0.85 | 0.019 | 1 |
| 2 | SETPATHWAY | Cytotoxic T cells release perforin, which to allow entry into target cells of granzyme B, which activates caspases, and granzyme A, which induces caspase-independent apoptosis. | ANP32A, APEX1, CREBBP, DFFA, DFFB, GZMA, GZMB, HMGB2, NME1, PRF1, SET | 9 | CREBBP(2), GZMA(1), GZMB(1) | 475550 | 4 | 4 | 4 | 0 | 0 | 1 | 2 | 0 | 1 | 0 | 0.32 | 0.039 | 1 |
| 3 | GSPATHWAY | Activated G-protein coupled receptors stimulate cAMP production and thus activate protein kinase A, involved in a number of signal transduction pathways. | ADCY1, GNAS, GNB1, GNGT1, PRKACA, PRKAR1A | 6 | GNAS(2), GNGT1(1) | 356110 | 3 | 3 | 3 | 0 | 1 | 1 | 0 | 1 | 0 | 0 | 0.4 | 0.041 | 1 |
| 4 | RANPATHWAY | RanGEF (aka RCC1) and RanGFP regulate the GTP- or GDP-bound state of Ran, creating a Ran gradient across the nuclear membrane that is used in nuclear import. | CHC1, RAN, RANBP1, RANBP2, RANGAP1 | 3 | RANBP2(3) | 372946 | 3 | 3 | 3 | 0 | 0 | 0 | 0 | 0 | 3 | 0 | 1 | 0.042 | 1 |
| 5 | NEUROTRANSMITTERSPATHWAY | Biosynthesis of neurotransmitters | DBH, GAD1, HDC, PNMT, TH, TPH1 | 6 | DBH(1), GAD1(2) | 321286 | 3 | 3 | 3 | 0 | 1 | 0 | 0 | 1 | 1 | 0 | 0.55 | 0.056 | 1 |
| 6 | ACTINYPATHWAY | The Arp 2/3 complex localizes to the Y-junction of polymerizing actin fibers that enable lamellipod extension and consequent cell motility. | ABI-2, ACTA1, ACTR2, ACTR3, ARPC1A, ARPC1B, ARPC2, ARPC3, ARPC4, NCK1, NCKAP1, NTRK1, PIR, PSMA7, RAC1, WASF1, WASF2, WASF3, WASL | 18 | NTRK1(1), RAC1(1), WASF2(1), WASF3(2), WASL(3) | 791369 | 8 | 6 | 7 | 0 | 2 | 1 | 0 | 0 | 5 | 0 | 0.3 | 0.068 | 1 |
| 7 | AMIPATHWAY | Endogenous anti-thrombosis pathways are overwhelmed in plaque-narrowed blood vessels, resulting in potentially lethal myocardial infarction. | ADCY1, CD3D, CD3E, CD3G, CD3Z, CD4, CREBBP, CSK, GNAS, GNB1, GNGT1, HLA-DRA, HLA-DRB1, LCK, PRKACB, PRKACG, PRKAR1A, PRKAR1B, PRKAR2A, PRKAR2B, PTPRC, TRA@, TRB@, ZAP70 | 20 | CREBBP(2), CSK(1), GNAS(2), GNGT1(1) | 1204765 | 6 | 6 | 6 | 1 | 2 | 2 | 0 | 1 | 1 | 0 | 0.4 | 0.069 | 1 |
| 8 | CSKPATHWAY | Csk inhibits T-cell activation by phosphorylating Lck; Csk is regulated by cAMP-dependent kinases and is opposed by the T-cell activator CD45. | ADCY1, CD3D, CD3E, CD3G, CD3Z, CD4, CREBBP, CSK, GNAS, GNB1, GNGT1, HLA-DRA, HLA-DRB1, LCK, PRKACB, PRKACG, PRKAR1A, PRKAR1B, PRKAR2A, PRKAR2B, PTPRC, TRA@, TRB@, ZAP70 | 20 | CREBBP(2), CSK(1), GNAS(2), GNGT1(1) | 1204765 | 6 | 6 | 6 | 1 | 2 | 2 | 0 | 1 | 1 | 0 | 0.4 | 0.069 | 1 |
| 9 | CREMPATHWAY | The transcription factor CREM activates a post-meiotic transcriptional cascade culminating in spermatogenesis. | ADCY1, CREM, FHL5, FSHB, FSHR, GNAS, XPO1 | 7 | FSHR(1), GNAS(2) | 507559 | 3 | 3 | 3 | 0 | 1 | 0 | 0 | 2 | 0 | 0 | 0.55 | 0.08 | 1 |
| 10 | SALMONELLAPATHWAY | Salmonella induces membrane ruffling in infected cells via bacterial proteins including SipA, SipC, and SopE, which alter actin structure. | ACTA1, ACTR2, ACTR3, ARPC1A, ARPC1B, ARPC2, ARPC3, ARPC4, CDC42, RAC1, WASF1, WASL | 12 | CDC42(1), RAC1(1), WASL(3) | 416707 | 5 | 4 | 4 | 0 | 1 | 1 | 1 | 0 | 2 | 0 | 0.3 | 0.088 | 1 |
In brief, we tabulate the number of mutations and the number of covered bases for each gene. The counts are broken down by mutation context category: four context categories that are discovered by MutSig, and one for indel and 'null' mutations, which include indels, nonsense mutations, splice-site mutations, and non-stop (read-through) mutations. For each gene, we calculate the probability of seeing the observed constellation of mutations, i.e. the product P1 x P2 x ... x Pm, or a more extreme one, given the background mutation rates calculated across the dataset. [1]
This is an experimental feature. The full results of the analysis summarized in this report can be downloaded from the TCGA Data Coordination Center.