This pipeline uses various statistical tests to identify genes whose promoter methylation levels correlated to selected clinical features.
Testing the association between 13026 genes and 4 clinical features across 262 samples, statistically thresholded by Q value < 0.05, 1 clinical feature related to at least one genes.
-
20 genes correlated to 'AGE'.
-
KLK12 , PCDHGA3 , PCDHGA8 , PCDHGB3 , C16ORF45 , ...
-
No genes correlated to 'Time to Death', 'KARNOFSKY.PERFORMANCE.SCORE', and 'TUMOR.STAGE'.
Complete statistical result table is provided in Supplement Table 1
Table 1. Get Full Table This table shows the clinical features, statistical methods used, and the number of genes that are significantly associated with each clinical feature at Q value < 0.05.
| Clinical feature | Statistical test | Significant genes | Associated with | Associated with | ||
|---|---|---|---|---|---|---|
| Time to Death | Cox regression test | N=0 | ||||
| AGE | Spearman correlation test | N=20 | older | N=6 | younger | N=14 |
| KARNOFSKY PERFORMANCE SCORE | Spearman correlation test | N=0 | ||||
| TUMOR STAGE | Spearman correlation test | N=0 |
Table S1. Basic characteristics of clinical feature: 'Time to Death'
| Time to Death | Duration (Months) | 0.3-180.2 (median=28) |
| censored | N = 113 | |
| death | N = 147 | |
| Significant markers | N = 0 |
Table S2. Basic characteristics of clinical feature: 'AGE'
| AGE | Mean (SD) | 59.02 (11) |
| Significant markers | N = 20 | |
| pos. correlated | 6 | |
| neg. correlated | 14 |
Table S3. Get Full Table List of top 10 genes significantly correlated to 'AGE' by Spearman correlation test
| SpearmanCorr | corrP | Q | |
|---|---|---|---|
| KLK12 | -0.3192 | 1.893e-07 | 0.00247 |
| PCDHGA3 | 0.3179 | 2.149e-07 | 0.0028 |
| PCDHGA8 | 0.3179 | 2.149e-07 | 0.0028 |
| PCDHGB3 | 0.3179 | 2.149e-07 | 0.0028 |
| C16ORF45 | -0.3145 | 2.937e-07 | 0.00382 |
| PCDHGB6 | 0.3142 | 3.002e-07 | 0.00391 |
| PCDHGB7 | 0.3142 | 3.002e-07 | 0.00391 |
| PDZK1 | -0.3127 | 4.047e-07 | 0.00527 |
| KCNIP1 | -0.2999 | 1.073e-06 | 0.014 |
| VWA5B1 | -0.2956 | 1.547e-06 | 0.0201 |
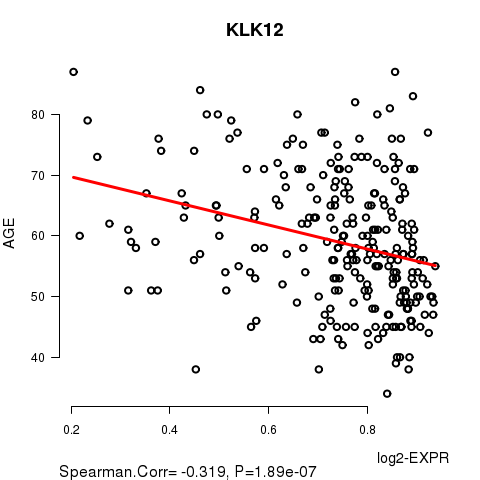
Figure S1. Get High-res Image As an example, this figure shows the association of KLK12 to 'AGE'. P value = 1.89e-07 with Spearman correlation analysis. The straight line presents the best linear regression.
No gene related to 'KARNOFSKY.PERFORMANCE.SCORE'.
Table S4. Basic characteristics of clinical feature: 'KARNOFSKY.PERFORMANCE.SCORE'
| KARNOFSKY.PERFORMANCE.SCORE | Mean (SD) | 74.29 (12) |
| Score | N | |
| 60 | 5 | |
| 80 | 8 | |
| 100 | 1 | |
| Significant markers | N = 0 |
-
Expresson data file = OV-TP.meth.for_correlation.filtered_data.txt
-
Clinical data file = OV-TP.clin.merged.picked.txt
-
Number of patients = 262
-
Number of genes = 13026
-
Number of clinical features = 4
For survival clinical features, Wald's test in univariate Cox regression analysis with proportional hazards model (Andersen and Gill 1982) was used to estimate the P values using the 'coxph' function in R. Kaplan-Meier survival curves were plot using the four quartile subgroups of patients based on expression levels
For continuous numerical clinical features, Spearman's rank correlation coefficients (Spearman 1904) and two-tailed P values were estimated using 'cor.test' function in R
For multiple hypothesis correction, Q value is the False Discovery Rate (FDR) analogue of the P value (Benjamini and Hochberg 1995), defined as the minimum FDR at which the test may be called significant. We used the 'Benjamini and Hochberg' method of 'p.adjust' function in R to convert P values into Q values.
This is an experimental feature. The full results of the analysis summarized in this report can be downloaded from the TCGA Data Coordination Center.