This pipeline uses various statistical tests to identify miRs whose expression levels correlated to selected clinical features.
Testing the association between 817 miRs and 6 clinical features across 560 samples, statistically thresholded by Q value < 0.05, 3 clinical features related to at least one miRs.
-
5 miRs correlated to 'AGE'.
-
HSA-MIR-30B* , HSA-MIR-30D* , HSA-MIR-30B , HUR_4 , HSA-MIR-30D
-
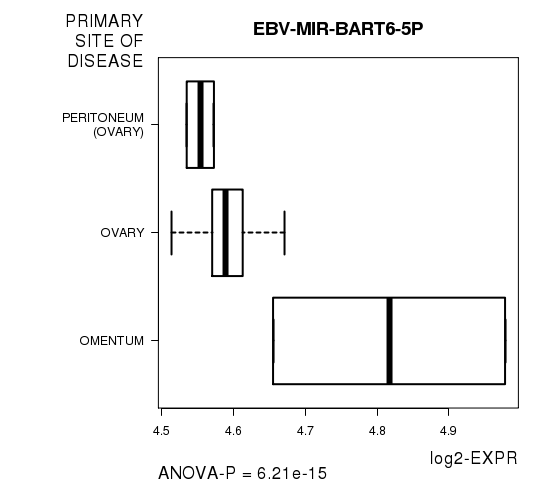
14 miRs correlated to 'PRIMARY.SITE.OF.DISEASE'.
-
EBV-MIR-BART6-5P , HSA-MIR-96* , HSA-MIR-614 , KSHV-MIR-K12-9* , HSA-MIR-600 , ...
-
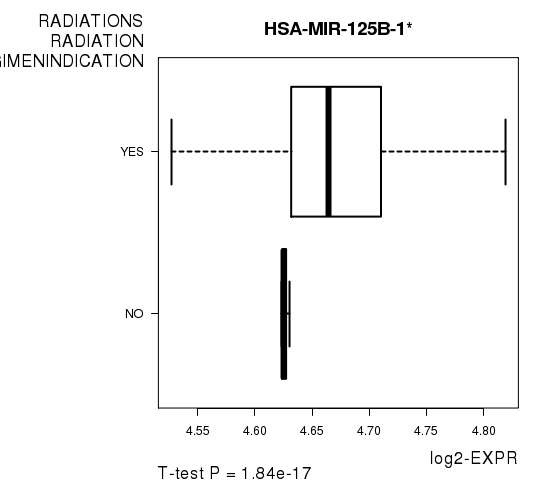
6 miRs correlated to 'RADIATIONS.RADIATION.REGIMENINDICATION'.
-
HSA-MIR-125B-1* , HSA-MIR-338-5P , EBV-MIR-BART17-5P , HSA-MIR-589* , HSA-MIR-518D-5P , ...
-
No miRs correlated to 'Time to Death', 'KARNOFSKY.PERFORMANCE.SCORE', and 'TUMOR.STAGE'.
Complete statistical result table is provided in Supplement Table 1
Table 1. Get Full Table This table shows the clinical features, statistical methods used, and the number of miRs that are significantly associated with each clinical feature at Q value < 0.05.
| Clinical feature | Statistical test | Significant miRs | Associated with | Associated with | ||
|---|---|---|---|---|---|---|
| Time to Death | Cox regression test | N=0 | ||||
| AGE | Spearman correlation test | N=5 | older | N=1 | younger | N=4 |
| PRIMARY SITE OF DISEASE | ANOVA test | N=14 | ||||
| KARNOFSKY PERFORMANCE SCORE | Spearman correlation test | N=0 | ||||
| TUMOR STAGE | Spearman correlation test | N=0 | ||||
| RADIATIONS RADIATION REGIMENINDICATION | t test | N=6 | yes | N=6 | no | N=0 |
Table S1. Basic characteristics of clinical feature: 'Time to Death'
| Time to Death | Duration (Months) | 0.3-180.2 (median=28.2) |
| censored | N = 265 | |
| death | N = 290 | |
| Significant markers | N = 0 |
Table S2. Basic characteristics of clinical feature: 'AGE'
| AGE | Mean (SD) | 59.72 (12) |
| Significant markers | N = 5 | |
| pos. correlated | 1 | |
| neg. correlated | 4 |
Table S3. Get Full Table List of 5 miRs significantly correlated to 'AGE' by Spearman correlation test
| SpearmanCorr | corrP | Q | |
|---|---|---|---|
| HSA-MIR-30B* | -0.2258 | 8.937e-08 | 7.3e-05 |
| HSA-MIR-30D* | -0.2229 | 1.305e-07 | 0.000106 |
| HSA-MIR-30B | -0.2046 | 1.338e-06 | 0.00109 |
| HUR_4 | 0.1982 | 2.857e-06 | 0.00233 |
| HSA-MIR-30D | -0.196 | 3.718e-06 | 0.00302 |
Figure S1. Get High-res Image As an example, this figure shows the association of HSA-MIR-30B* to 'AGE'. P value = 8.94e-08 with Spearman correlation analysis. The straight line presents the best linear regression.
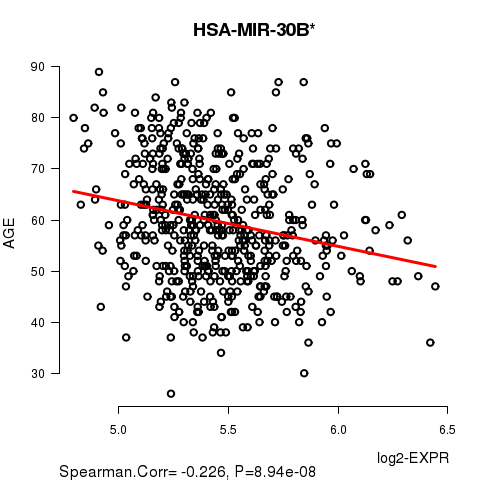
Table S4. Basic characteristics of clinical feature: 'PRIMARY.SITE.OF.DISEASE'
| PRIMARY.SITE.OF.DISEASE | Labels | N |
| OMENTUM | 2 | |
| OVARY | 556 | |
| PERITONEUM (OVARY) | 2 | |
| Significant markers | N = 14 |
Table S5. Get Full Table List of top 10 miRs differentially expressed by 'PRIMARY.SITE.OF.DISEASE'
| ANOVA_P | Q | |
|---|---|---|
| EBV-MIR-BART6-5P | 6.206e-15 | 5.07e-12 |
| HSA-MIR-96* | 7.377e-13 | 6.02e-10 |
| HSA-MIR-614 | 1.994e-12 | 1.63e-09 |
| KSHV-MIR-K12-9* | 2.263e-11 | 1.84e-08 |
| HSA-MIR-600 | 2.513e-11 | 2.04e-08 |
| HSA-MIR-26A-2* | 1.058e-10 | 8.59e-08 |
| EBV-MIR-BART9 | 2.718e-10 | 2.2e-07 |
| HSA-MIR-548C-3P | 6.115e-10 | 4.95e-07 |
| HSA-MIR-374A* | 4.45e-09 | 3.6e-06 |
| HCMV-MIR-UL36* | 1.391e-08 | 1.12e-05 |
Figure S2. Get High-res Image As an example, this figure shows the association of EBV-MIR-BART6-5P to 'PRIMARY.SITE.OF.DISEASE'. P value = 6.21e-15 with ANOVA analysis.
No miR related to 'KARNOFSKY.PERFORMANCE.SCORE'.
Table S6. Basic characteristics of clinical feature: 'KARNOFSKY.PERFORMANCE.SCORE'
| KARNOFSKY.PERFORMANCE.SCORE | Mean (SD) | 75.64 (13) |
| Score | N | |
| 40 | 2 | |
| 60 | 20 | |
| 80 | 49 | |
| 100 | 7 | |
| Significant markers | N = 0 |
Table S7. Basic characteristics of clinical feature: 'TUMOR.STAGE'
| TUMOR.STAGE | Mean (SD) | 3.05 (0.56) |
| N | ||
| Stage 1 | 16 | |
| Stage 2 | 25 | |
| Stage 3 | 430 | |
| Stage 4 | 85 | |
| Significant markers | N = 0 |
6 miRs related to 'RADIATIONS.RADIATION.REGIMENINDICATION'.
Table S8. Basic characteristics of clinical feature: 'RADIATIONS.RADIATION.REGIMENINDICATION'
| RADIATIONS.RADIATION.REGIMENINDICATION | Labels | N |
| NO | 3 | |
| YES | 557 | |
| Significant markers | N = 6 | |
| Higher in YES | 6 | |
| Higher in NO | 0 |
Table S9. Get Full Table List of 6 miRs differentially expressed by 'RADIATIONS.RADIATION.REGIMENINDICATION'
| T(pos if higher in 'YES') | ttestP | Q | AUC | |
|---|---|---|---|---|
| HSA-MIR-125B-1* | 12.1 | 1.84e-17 | 1.5e-14 | 0.7887 |
| HSA-MIR-338-5P | 12.55 | 1.637e-15 | 1.34e-12 | 0.8031 |
| EBV-MIR-BART17-5P | 8.01 | 4.928e-14 | 4.02e-11 | 0.6912 |
| HSA-MIR-589* | 13.09 | 1.558e-12 | 1.27e-09 | 0.766 |
| HSA-MIR-518D-5P | 6.97 | 5.384e-10 | 4.38e-07 | 0.681 |
| HSA-MIR-486-5P | 15.9 | 2.159e-08 | 1.75e-05 | 0.8259 |
Figure S3. Get High-res Image As an example, this figure shows the association of HSA-MIR-125B-1* to 'RADIATIONS.RADIATION.REGIMENINDICATION'. P value = 1.84e-17 with T-test analysis.
-
Expresson data file = OV-TP.mirna__h_mirna_8x15kv2__unc_edu__Level_3__unc_DWD_Batch_adjusted__data.data.txt
-
Clinical data file = OV-TP.clin.merged.picked.txt
-
Number of patients = 560
-
Number of miRs = 817
-
Number of clinical features = 6
For survival clinical features, Wald's test in univariate Cox regression analysis with proportional hazards model (Andersen and Gill 1982) was used to estimate the P values using the 'coxph' function in R. Kaplan-Meier survival curves were plot using the four quartile subgroups of patients based on expression levels
For continuous numerical clinical features, Spearman's rank correlation coefficients (Spearman 1904) and two-tailed P values were estimated using 'cor.test' function in R
For multi-class clinical features (ordinal or nominal), one-way analysis of variance (Howell 2002) was applied to compare the log2-expression levels between different clinical classes using 'anova' function in R
For two-class clinical features, two-tailed Student's t test with unequal variance (Lehmann and Romano 2005) was applied to compare the log2-expression levels between the two clinical classes using 't.test' function in R
For multiple hypothesis correction, Q value is the False Discovery Rate (FDR) analogue of the P value (Benjamini and Hochberg 1995), defined as the minimum FDR at which the test may be called significant. We used the 'Benjamini and Hochberg' method of 'p.adjust' function in R to convert P values into Q values.
This is an experimental feature. The full results of the analysis summarized in this report can be downloaded from the TCGA Data Coordination Center.