This pipeline computes the correlation between cancer subtypes identified by different molecular patterns and selected clinical features.
Testing the association between subtypes identified by 10 different clustering approaches and 9 clinical features across 166 patients, 15 significant findings detected with P value < 0.05.
-
CNMF clustering analysis on array-based mRNA expression data identified 3 subtypes that do not correlate to any clinical features.
-
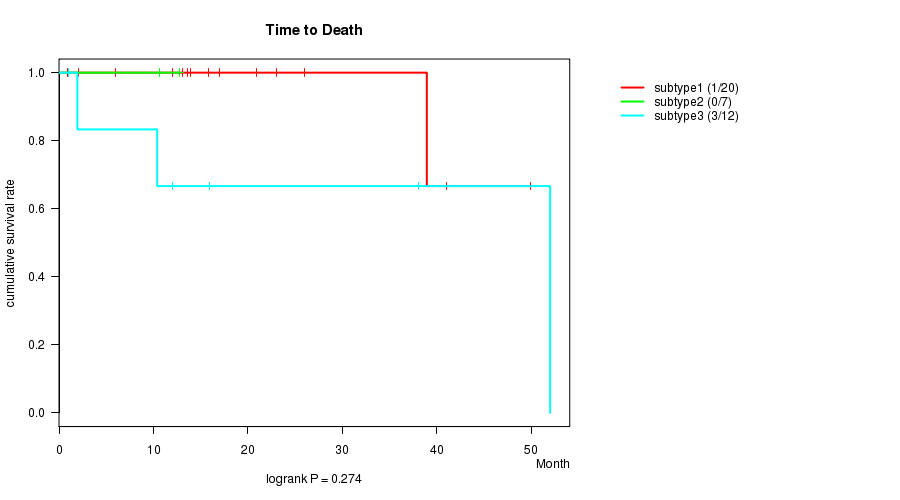
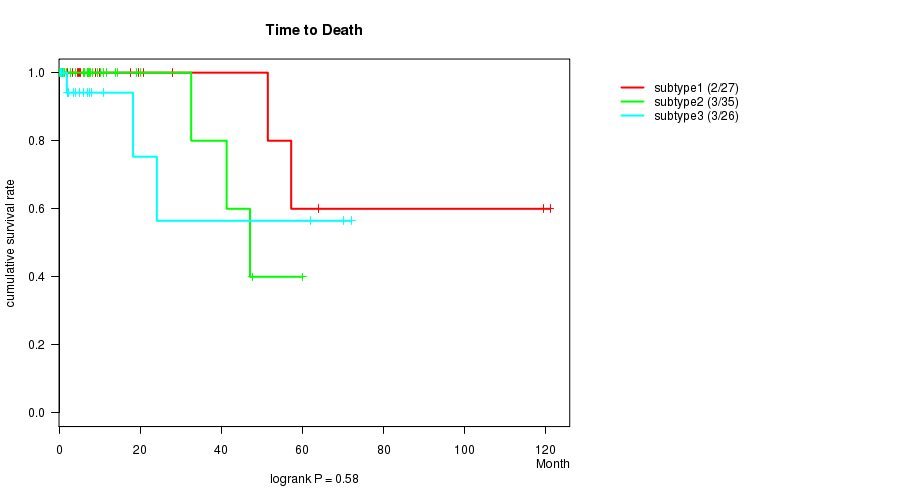
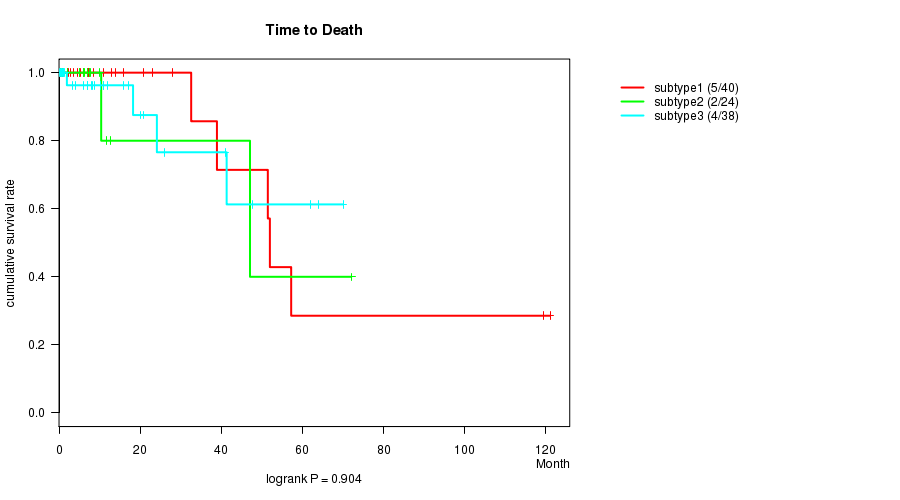
Consensus hierarchical clustering analysis on array-based mRNA expression data identified 3 subtypes that correlate to 'Time to Death'.
-
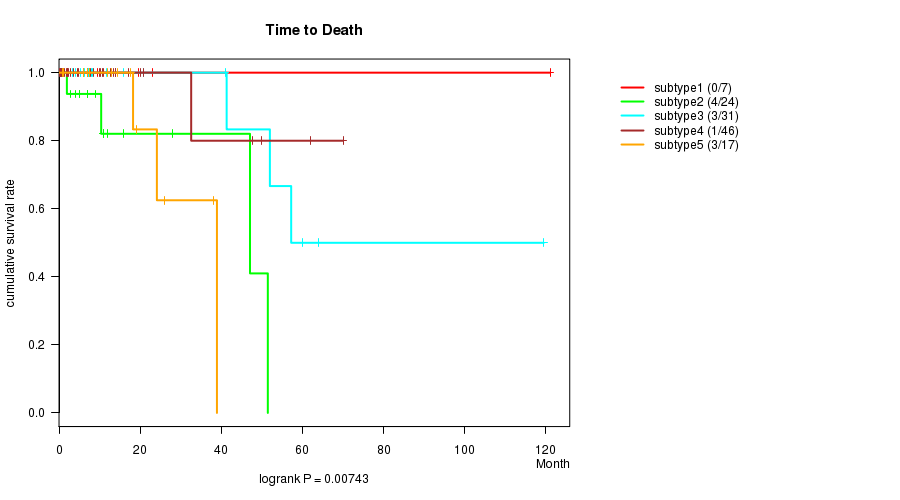
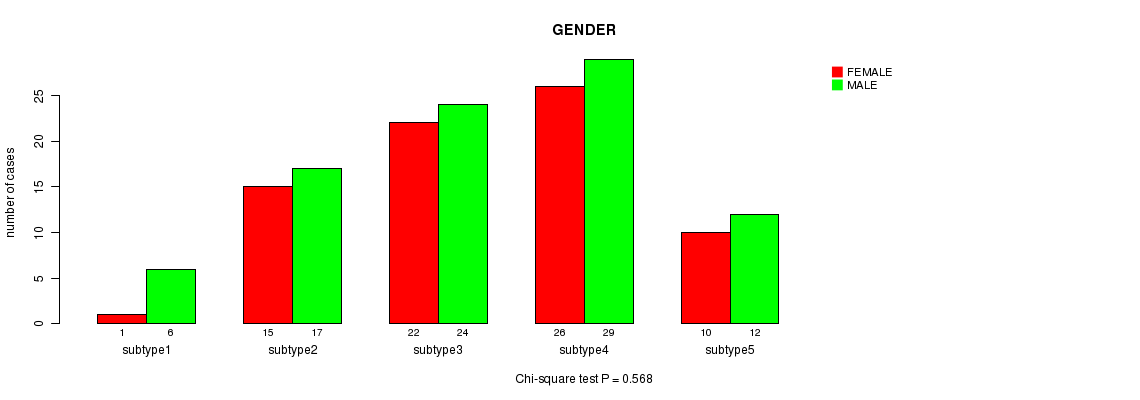
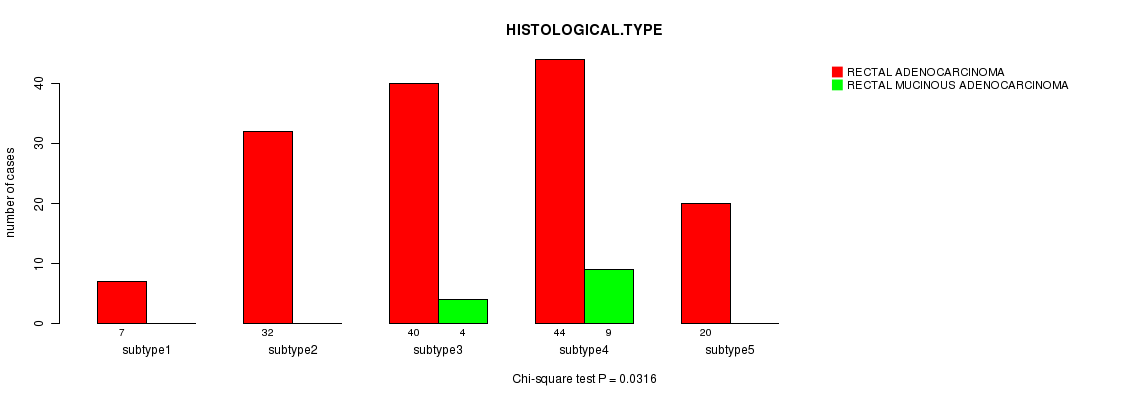
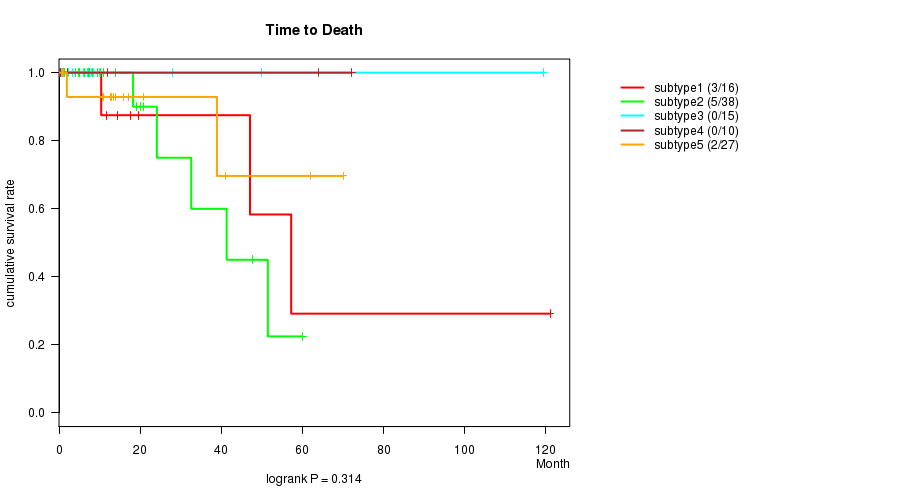
5 subtypes identified in current cancer cohort by 'CN CNMF'. These subtypes correlate to 'Time to Death' and 'HISTOLOGICAL.TYPE'.
-
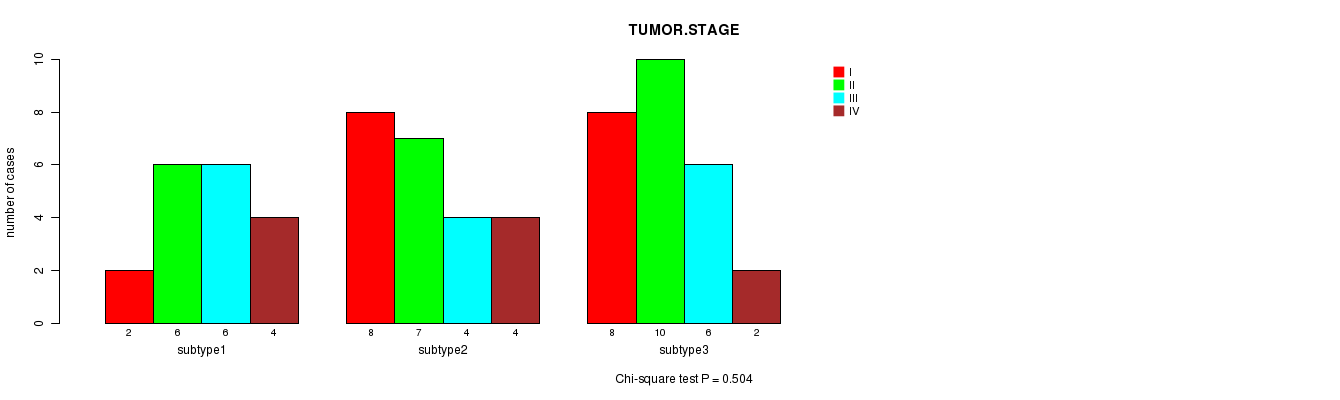
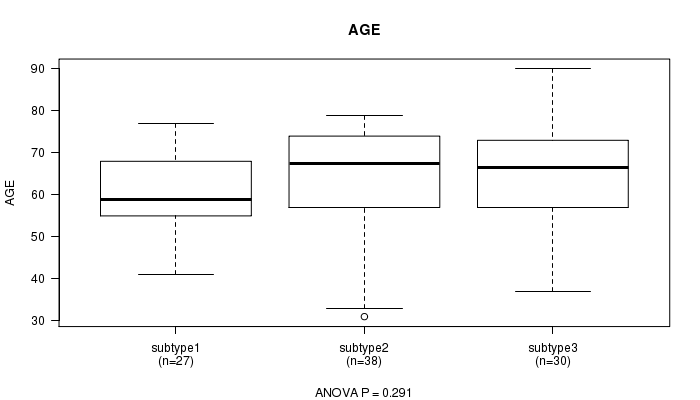
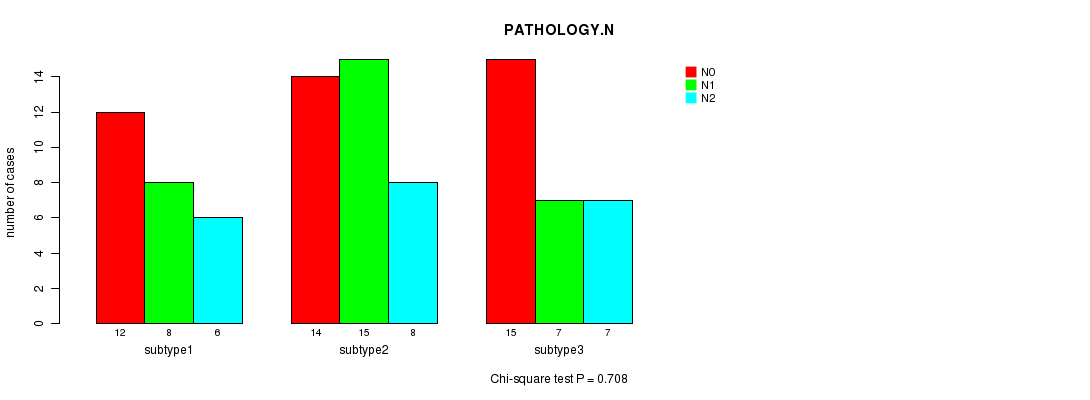
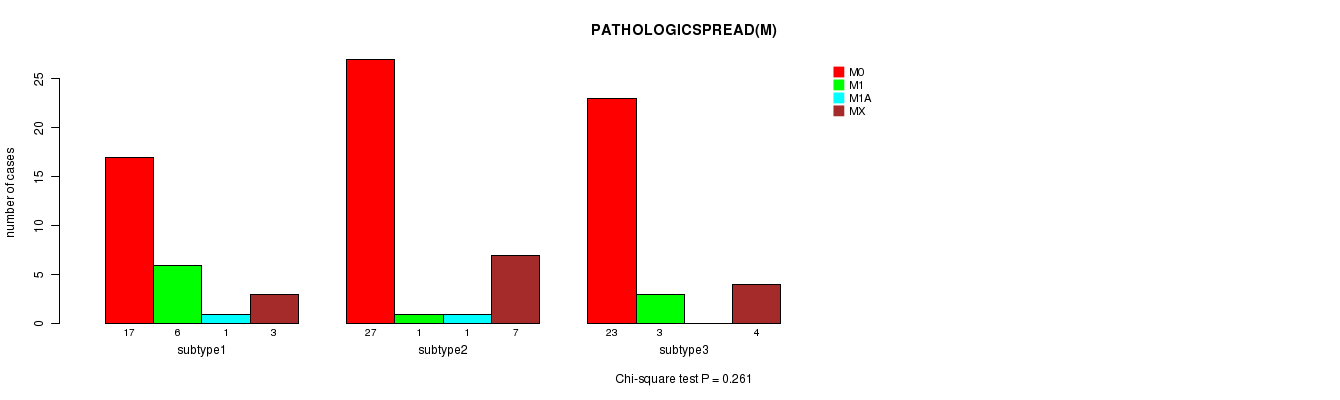
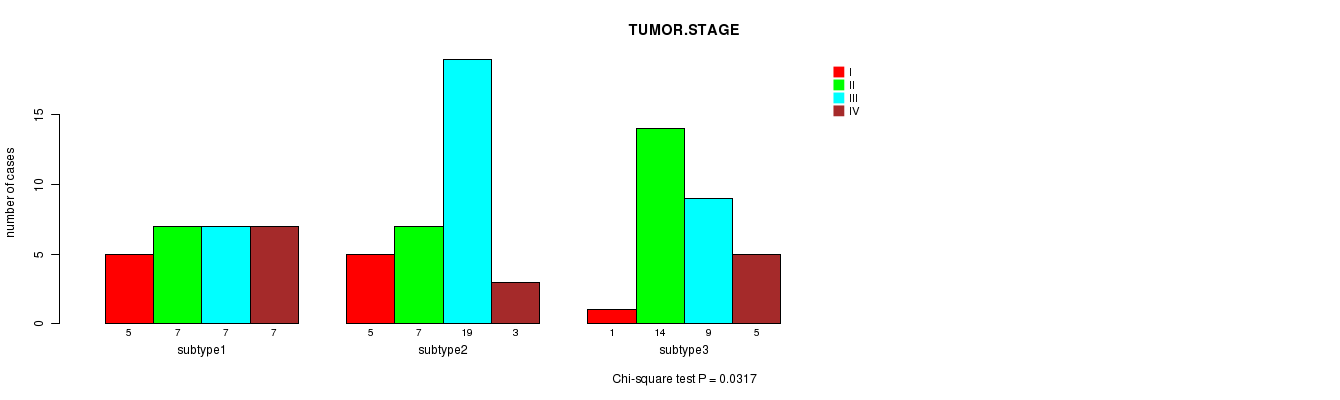
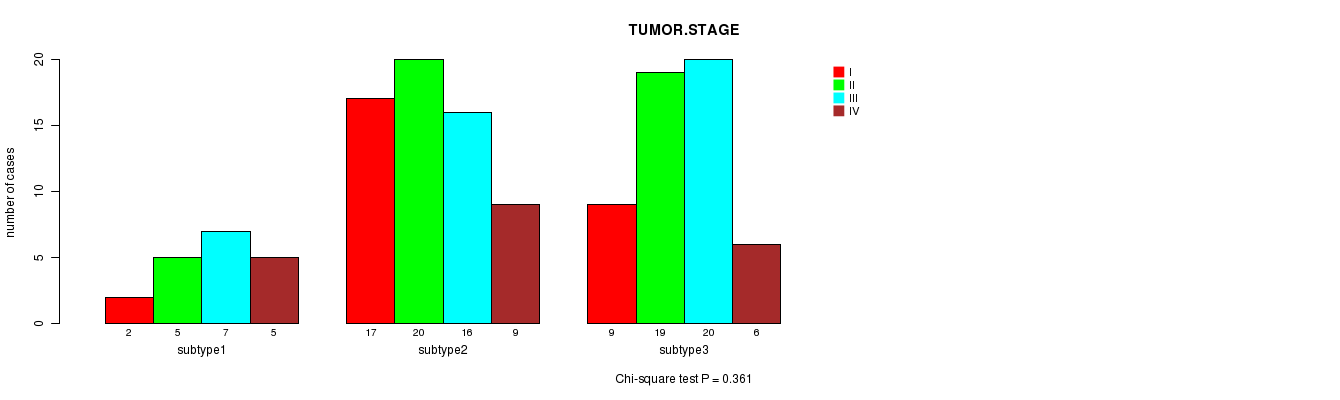
3 subtypes identified in current cancer cohort by 'METHLYATION CNMF'. These subtypes correlate to 'TUMOR.STAGE'.
-
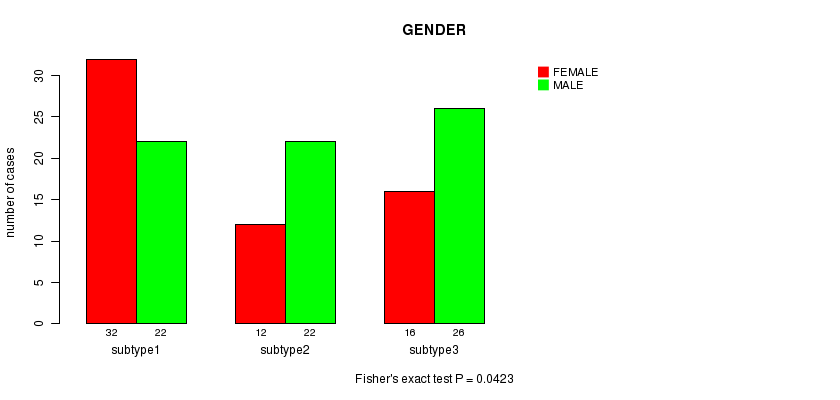
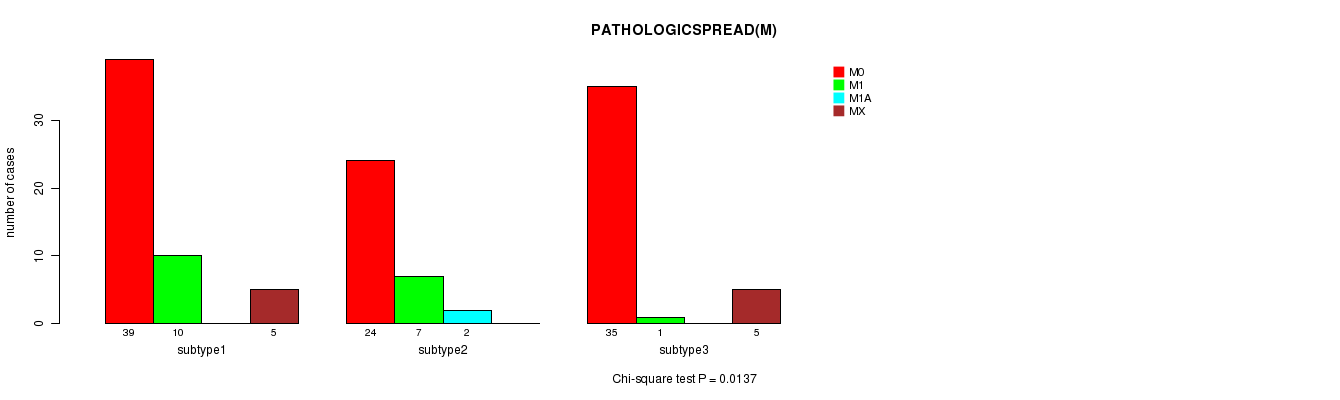
CNMF clustering analysis on RPPA data identified 3 subtypes that correlate to 'GENDER' and 'PATHOLOGICSPREAD(M)'.
-
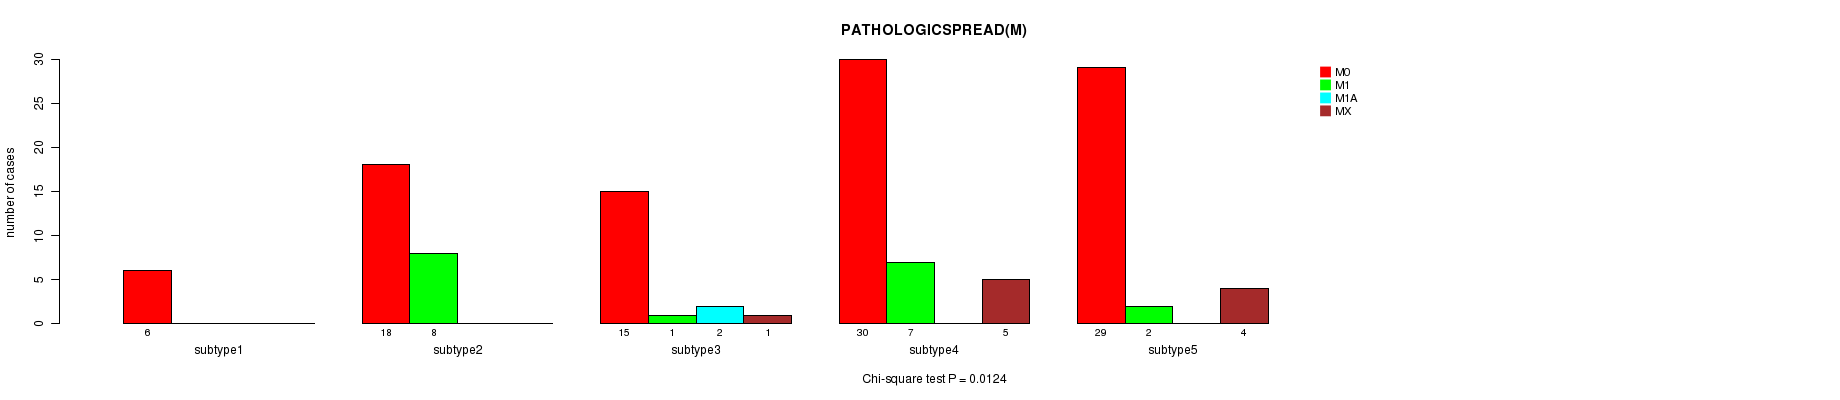
Consensus hierarchical clustering analysis on RPPA data identified 5 subtypes that correlate to 'Time to Death', 'AGE', and 'PATHOLOGICSPREAD(M)'.
-
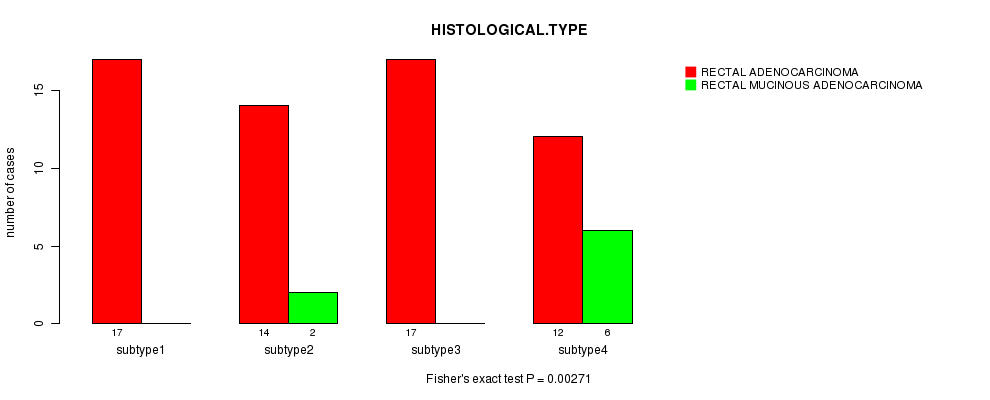
CNMF clustering analysis on sequencing-based mRNA expression data identified 4 subtypes that correlate to 'HISTOLOGICAL.TYPE'.
-
Consensus hierarchical clustering analysis on sequencing-based mRNA expression data identified 3 subtypes that correlate to 'HISTOLOGICAL.TYPE'.
-
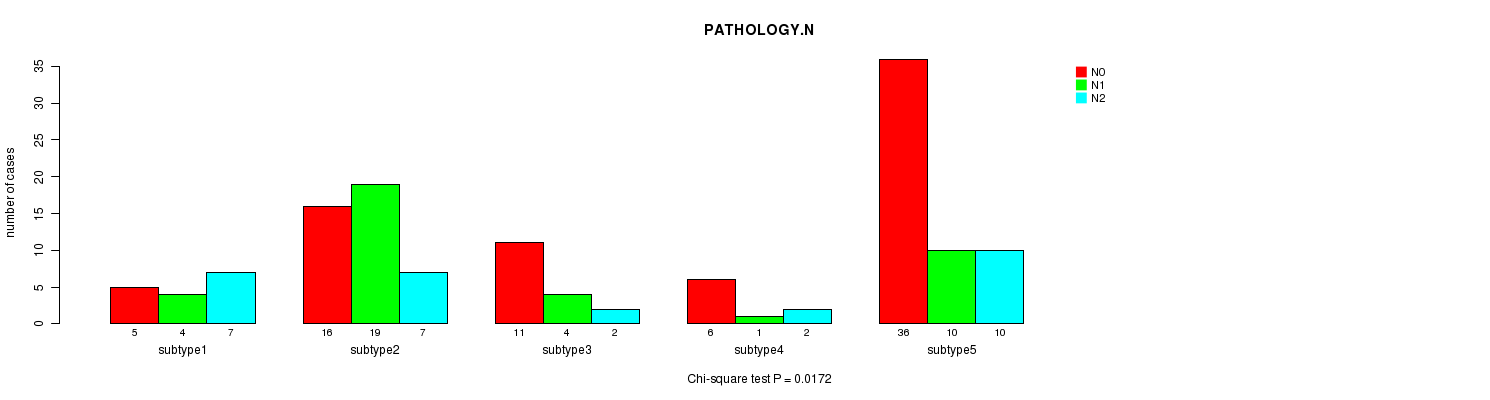
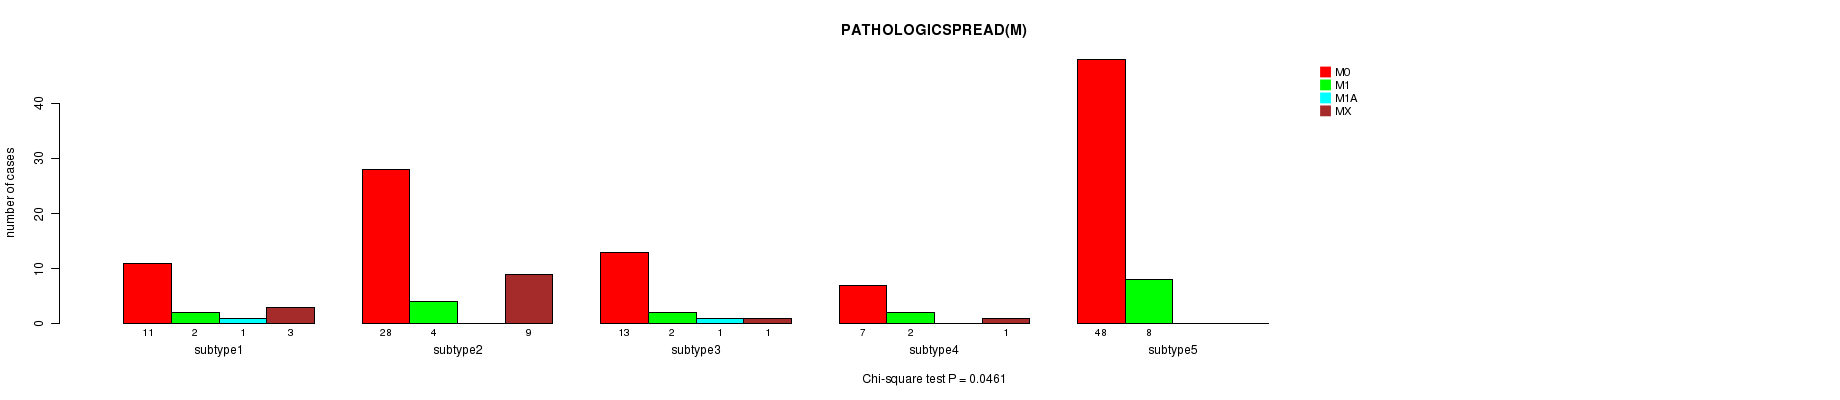
CNMF clustering analysis on sequencing-based miR expression data identified 5 subtypes that correlate to 'PATHOLOGY.N' and 'PATHOLOGICSPREAD(M)'.
-
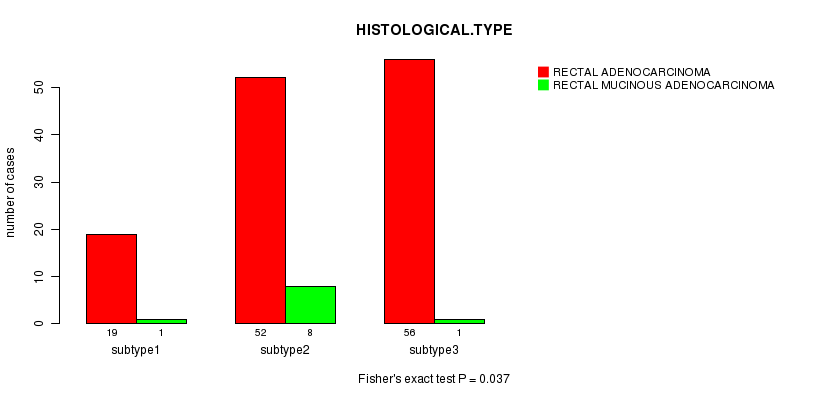
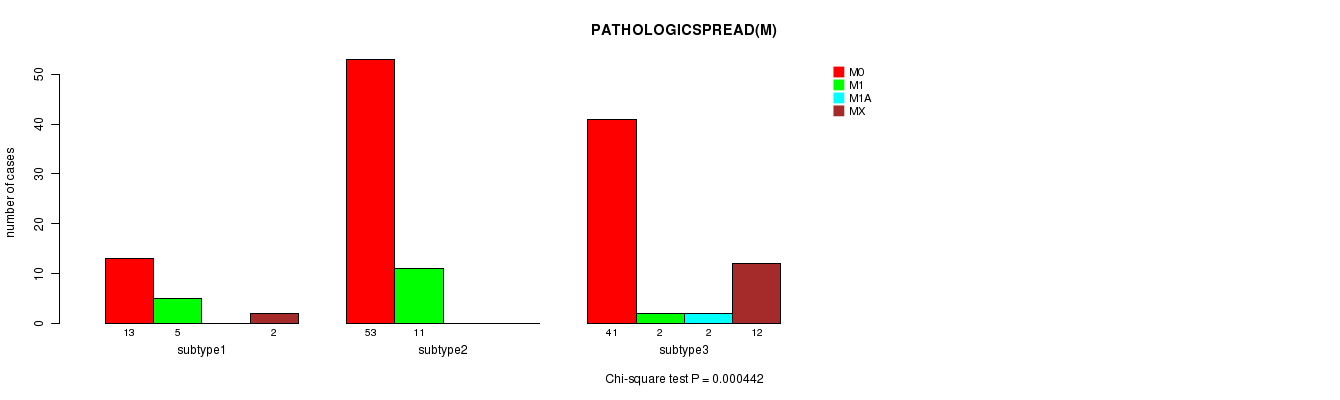
Consensus hierarchical clustering analysis on sequencing-based miR expression data identified 3 subtypes that correlate to 'HISTOLOGICAL.TYPE' and 'PATHOLOGICSPREAD(M)'.
Table 1. Get Full Table Overview of the association between subtypes identified by 10 different clustering approaches and 9 clinical features. Shown in the table are P values from statistical tests. Thresholded by P value < 0.05, 15 significant findings detected.
|
Clinical Features |
Time to Death |
AGE | GENDER |
HISTOLOGICAL TYPE |
PATHOLOGY T |
PATHOLOGY N |
PATHOLOGICSPREAD(M) |
TUMOR STAGE |
RADIATIONS RADIATION REGIMENINDICATION |
| Statistical Tests | logrank test | ANOVA | Fisher's exact test | Fisher's exact test | Chi-square test | Chi-square test | Chi-square test | Chi-square test | Fisher's exact test |
| mRNA CNMF subtypes | 0.274 | 0.499 | 0.953 | 0.365 | 0.0987 | 0.66 | 0.407 | 0.639 | 0.29 |
| mRNA cHierClus subtypes | 0.0075 | 0.394 | 0.865 | 0.692 | 0.245 | 0.574 | 0.212 | 0.504 | 1 |
| CN CNMF | 0.00743 | 0.373 | 0.568 | 0.0316 | 0.564 | 0.104 | 0.0929 | 0.477 | 0.238 |
| METHLYATION CNMF | 0.58 | 0.291 | 0.494 | 0.274 | 0.524 | 0.708 | 0.261 | 0.0317 | 0.857 |
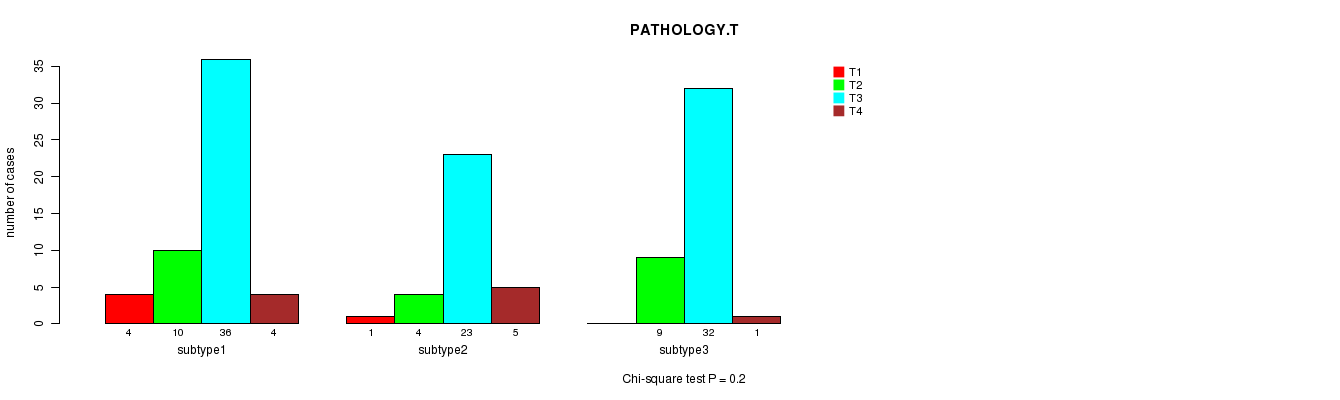
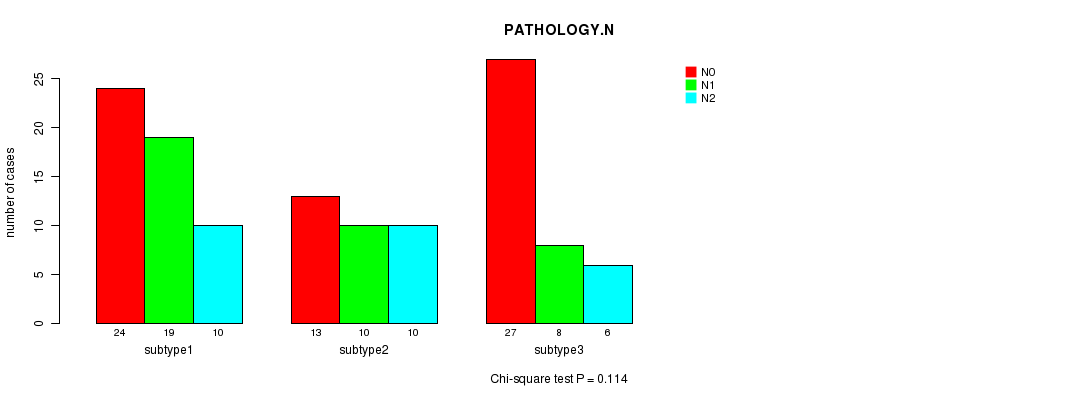
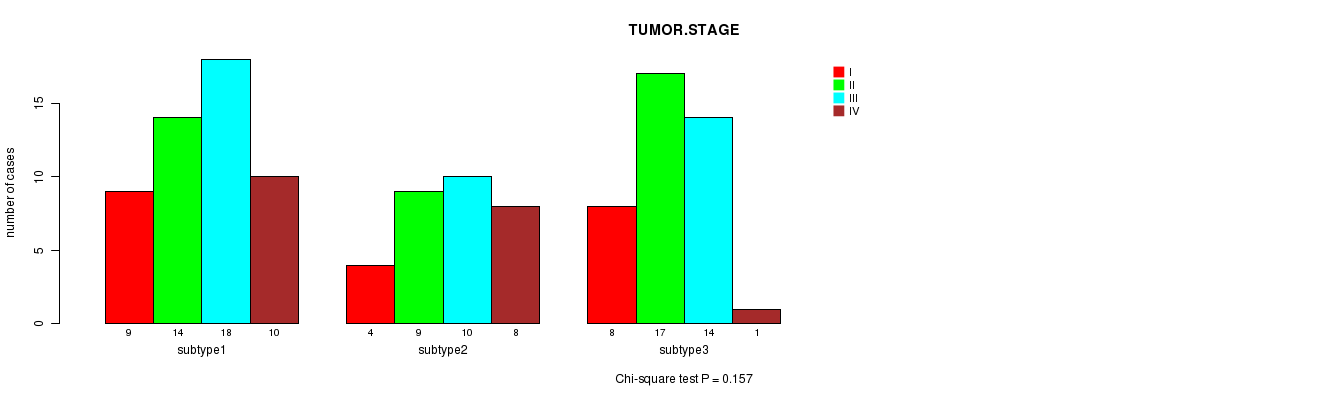
| RPPA CNMF subtypes | 0.904 | 0.513 | 0.0423 | 0.255 | 0.2 | 0.114 | 0.0137 | 0.157 | 1 |
| RPPA cHierClus subtypes | 0.0032 | 0.0282 | 0.378 | 0.157 | 0.402 | 0.0918 | 0.0124 | 0.218 | 0.785 |
| RNAseq CNMF subtypes | 0.66 | 0.478 | 0.586 | 0.00271 | 0.143 | 0.702 | 0.696 | 0.562 | 0.472 |
| RNAseq cHierClus subtypes | 0.382 | 0.283 | 0.87 | 2.93e-05 | 0.709 | 0.761 | 0.589 | 0.842 | 0.569 |
| MIRseq CNMF subtypes | 0.314 | 0.892 | 0.461 | 0.313 | 0.251 | 0.0172 | 0.0461 | 0.117 | 0.283 |
| MIRseq cHierClus subtypes | 0.774 | 0.582 | 0.973 | 0.037 | 0.726 | 0.244 | 0.000442 | 0.361 | 0.298 |
Table S1. Get Full Table Description of clustering approach #1: 'mRNA CNMF subtypes'
| Cluster Labels | 1 | 2 | 3 |
|---|---|---|---|
| Number of samples | 25 | 20 | 24 |
P value = 0.274 (logrank test)
Table S2. Clustering Approach #1: 'mRNA CNMF subtypes' versus Clinical Feature #1: 'Time to Death'
| nPatients | nDeath | Duration Range (Median), Month | |
|---|---|---|---|
| ALL | 39 | 4 | 0.9 - 52.0 (6.0) |
| subtype1 | 20 | 1 | 0.9 - 49.9 (13.3) |
| subtype2 | 7 | 0 | 1.0 - 12.7 (1.0) |
| subtype3 | 12 | 3 | 1.0 - 52.0 (1.5) |
Figure S1. Get High-res Image Clustering Approach #1: 'mRNA CNMF subtypes' versus Clinical Feature #1: 'Time to Death'
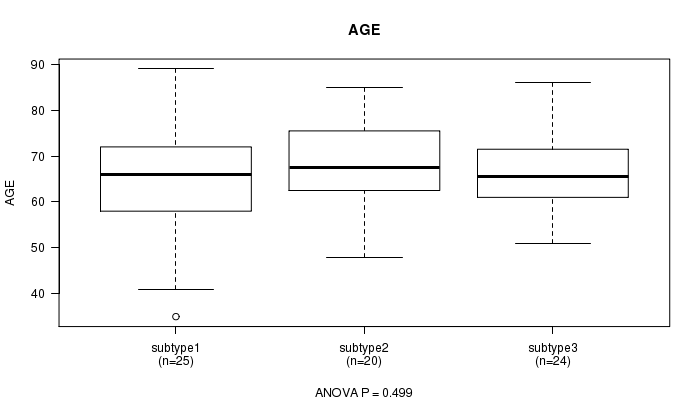
P value = 0.499 (ANOVA)
Table S3. Clustering Approach #1: 'mRNA CNMF subtypes' versus Clinical Feature #2: 'AGE'
| nPatients | Mean (Std.Dev) | |
|---|---|---|
| ALL | 69 | 66.6 (10.7) |
| subtype1 | 25 | 64.6 (12.3) |
| subtype2 | 20 | 67.9 (9.9) |
| subtype3 | 24 | 67.7 (9.5) |
Figure S2. Get High-res Image Clustering Approach #1: 'mRNA CNMF subtypes' versus Clinical Feature #2: 'AGE'
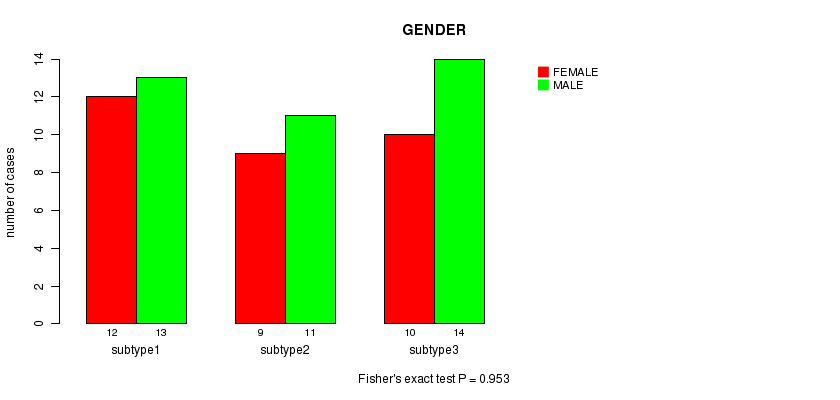
P value = 0.953 (Fisher's exact test)
Table S4. Clustering Approach #1: 'mRNA CNMF subtypes' versus Clinical Feature #3: 'GENDER'
| nPatients | FEMALE | MALE |
|---|---|---|
| ALL | 31 | 38 |
| subtype1 | 12 | 13 |
| subtype2 | 9 | 11 |
| subtype3 | 10 | 14 |
Figure S3. Get High-res Image Clustering Approach #1: 'mRNA CNMF subtypes' versus Clinical Feature #3: 'GENDER'
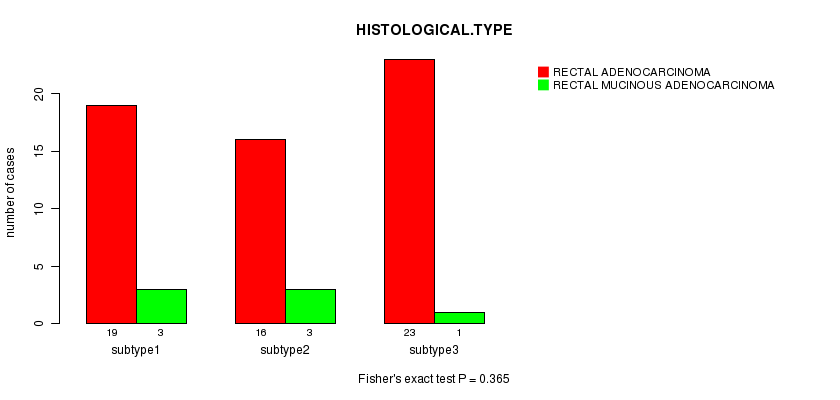
P value = 0.365 (Fisher's exact test)
Table S5. Clustering Approach #1: 'mRNA CNMF subtypes' versus Clinical Feature #4: 'HISTOLOGICAL.TYPE'
| nPatients | RECTAL ADENOCARCINOMA | RECTAL MUCINOUS ADENOCARCINOMA |
|---|---|---|
| ALL | 58 | 7 |
| subtype1 | 19 | 3 |
| subtype2 | 16 | 3 |
| subtype3 | 23 | 1 |
Figure S4. Get High-res Image Clustering Approach #1: 'mRNA CNMF subtypes' versus Clinical Feature #4: 'HISTOLOGICAL.TYPE'
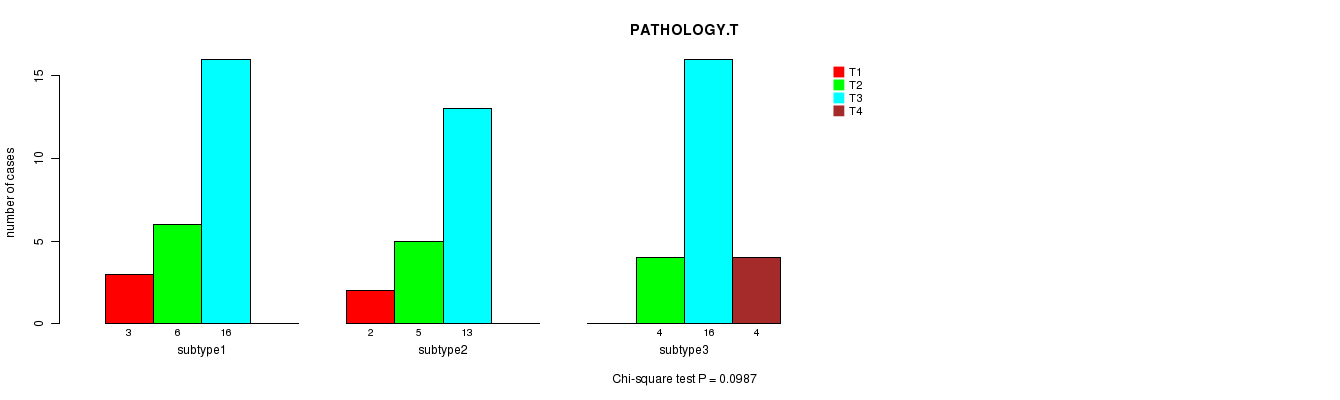
P value = 0.0987 (Chi-square test)
Table S6. Clustering Approach #1: 'mRNA CNMF subtypes' versus Clinical Feature #5: 'PATHOLOGY.T'
| nPatients | T1 | T2 | T3 | T4 |
|---|---|---|---|---|
| ALL | 5 | 15 | 45 | 4 |
| subtype1 | 3 | 6 | 16 | 0 |
| subtype2 | 2 | 5 | 13 | 0 |
| subtype3 | 0 | 4 | 16 | 4 |
Figure S5. Get High-res Image Clustering Approach #1: 'mRNA CNMF subtypes' versus Clinical Feature #5: 'PATHOLOGY.T'
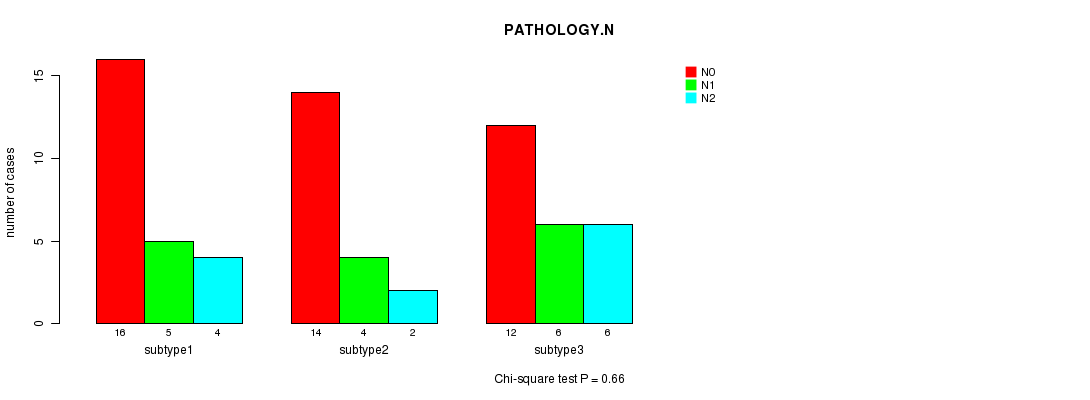
P value = 0.66 (Chi-square test)
Table S7. Clustering Approach #1: 'mRNA CNMF subtypes' versus Clinical Feature #6: 'PATHOLOGY.N'
| nPatients | N0 | N1 | N2 |
|---|---|---|---|
| ALL | 42 | 15 | 12 |
| subtype1 | 16 | 5 | 4 |
| subtype2 | 14 | 4 | 2 |
| subtype3 | 12 | 6 | 6 |
Figure S6. Get High-res Image Clustering Approach #1: 'mRNA CNMF subtypes' versus Clinical Feature #6: 'PATHOLOGY.N'
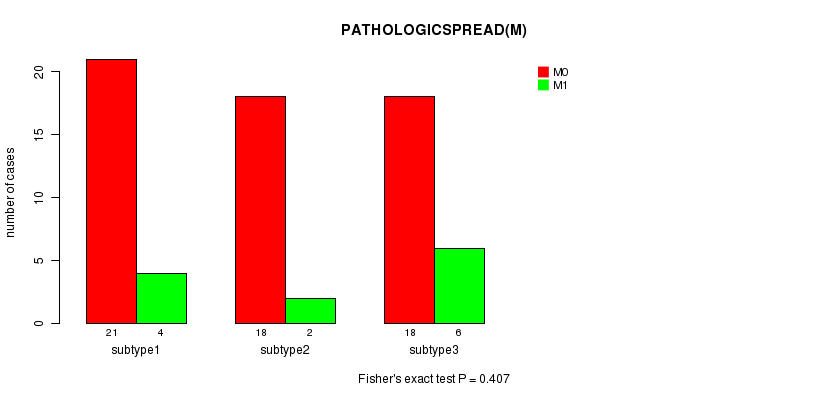
P value = 0.407 (Fisher's exact test)
Table S8. Clustering Approach #1: 'mRNA CNMF subtypes' versus Clinical Feature #7: 'PATHOLOGICSPREAD(M)'
| nPatients | M0 | M1 |
|---|---|---|
| ALL | 57 | 12 |
| subtype1 | 21 | 4 |
| subtype2 | 18 | 2 |
| subtype3 | 18 | 6 |
Figure S7. Get High-res Image Clustering Approach #1: 'mRNA CNMF subtypes' versus Clinical Feature #7: 'PATHOLOGICSPREAD(M)'
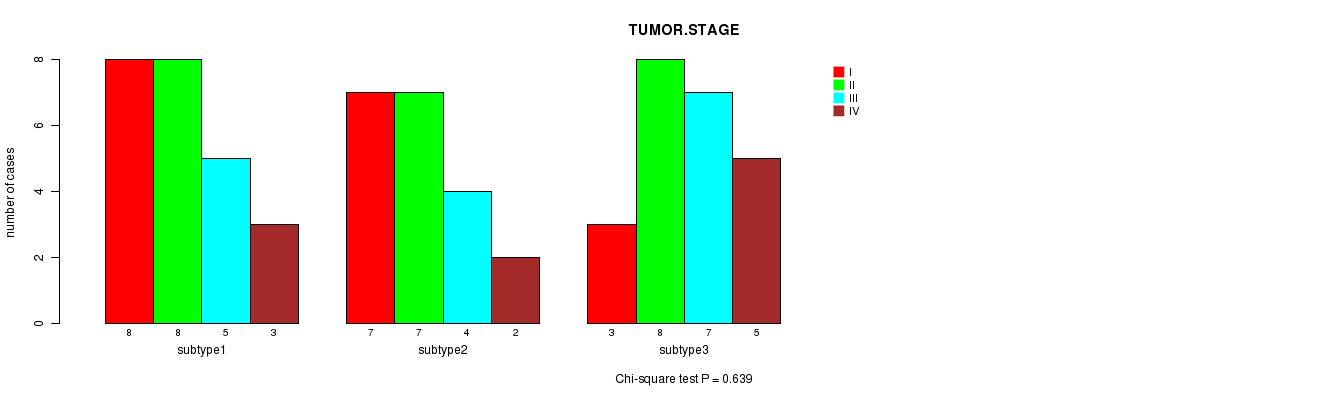
P value = 0.639 (Chi-square test)
Table S9. Clustering Approach #1: 'mRNA CNMF subtypes' versus Clinical Feature #8: 'TUMOR.STAGE'
| nPatients | I | II | III | IV |
|---|---|---|---|---|
| ALL | 18 | 23 | 16 | 10 |
| subtype1 | 8 | 8 | 5 | 3 |
| subtype2 | 7 | 7 | 4 | 2 |
| subtype3 | 3 | 8 | 7 | 5 |
Figure S8. Get High-res Image Clustering Approach #1: 'mRNA CNMF subtypes' versus Clinical Feature #8: 'TUMOR.STAGE'
P value = 0.29 (Fisher's exact test)
Table S10. Clustering Approach #1: 'mRNA CNMF subtypes' versus Clinical Feature #9: 'RADIATIONS.RADIATION.REGIMENINDICATION'
| nPatients | NO | YES |
|---|---|---|
| ALL | 1 | 68 |
| subtype1 | 0 | 25 |
| subtype2 | 1 | 19 |
| subtype3 | 0 | 24 |
Figure S9. Get High-res Image Clustering Approach #1: 'mRNA CNMF subtypes' versus Clinical Feature #9: 'RADIATIONS.RADIATION.REGIMENINDICATION'
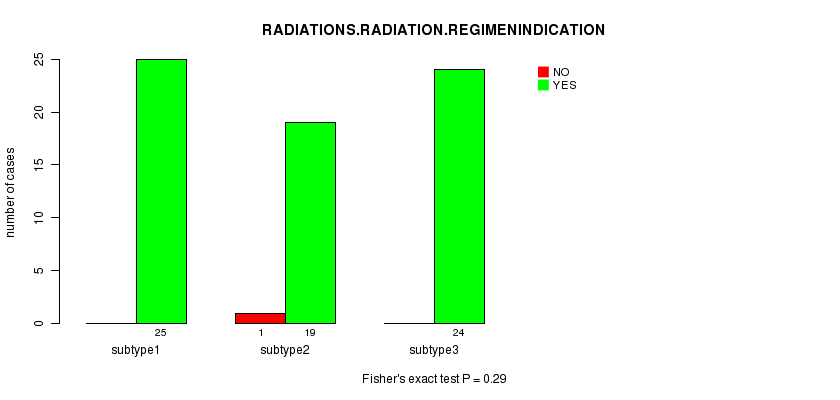
Table S11. Get Full Table Description of clustering approach #2: 'mRNA cHierClus subtypes'
| Cluster Labels | 1 | 2 | 3 |
|---|---|---|---|
| Number of samples | 19 | 24 | 26 |
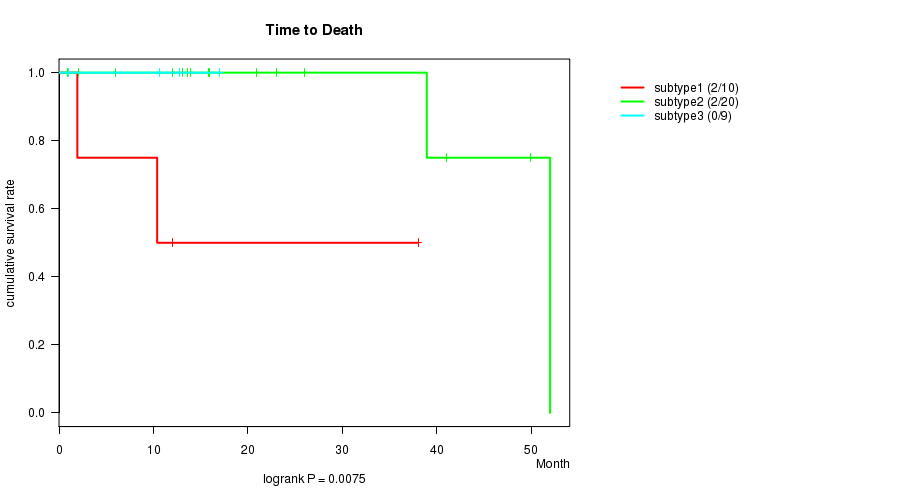
P value = 0.0075 (logrank test)
Table S12. Clustering Approach #2: 'mRNA cHierClus subtypes' versus Clinical Feature #1: 'Time to Death'
| nPatients | nDeath | Duration Range (Median), Month | |
|---|---|---|---|
| ALL | 39 | 4 | 0.9 - 52.0 (6.0) |
| subtype1 | 10 | 2 | 1.0 - 38.0 (1.0) |
| subtype2 | 20 | 2 | 0.9 - 52.0 (13.7) |
| subtype3 | 9 | 0 | 1.0 - 17.0 (1.0) |
Figure S10. Get High-res Image Clustering Approach #2: 'mRNA cHierClus subtypes' versus Clinical Feature #1: 'Time to Death'
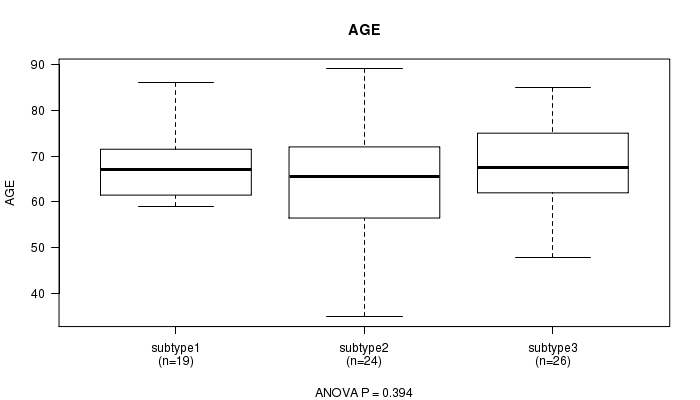
P value = 0.394 (ANOVA)
Table S13. Clustering Approach #2: 'mRNA cHierClus subtypes' versus Clinical Feature #2: 'AGE'
| nPatients | Mean (Std.Dev) | |
|---|---|---|
| ALL | 69 | 66.6 (10.7) |
| subtype1 | 19 | 68.4 (8.7) |
| subtype2 | 24 | 64.2 (12.8) |
| subtype3 | 26 | 67.5 (9.7) |
Figure S11. Get High-res Image Clustering Approach #2: 'mRNA cHierClus subtypes' versus Clinical Feature #2: 'AGE'
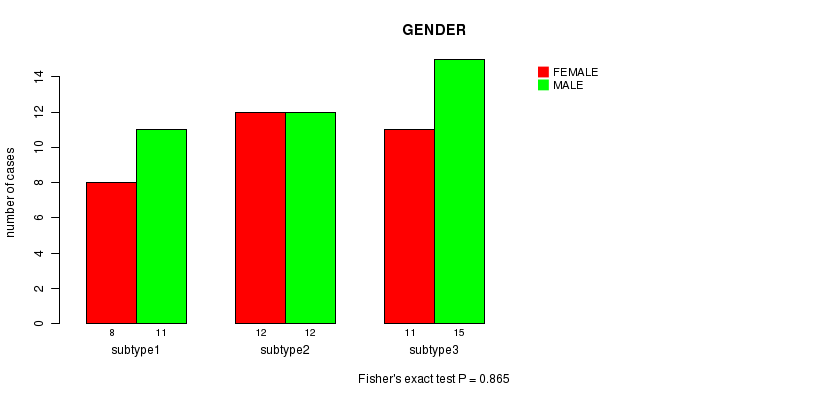
P value = 0.865 (Fisher's exact test)
Table S14. Clustering Approach #2: 'mRNA cHierClus subtypes' versus Clinical Feature #3: 'GENDER'
| nPatients | FEMALE | MALE |
|---|---|---|
| ALL | 31 | 38 |
| subtype1 | 8 | 11 |
| subtype2 | 12 | 12 |
| subtype3 | 11 | 15 |
Figure S12. Get High-res Image Clustering Approach #2: 'mRNA cHierClus subtypes' versus Clinical Feature #3: 'GENDER'
P value = 0.692 (Fisher's exact test)
Table S15. Clustering Approach #2: 'mRNA cHierClus subtypes' versus Clinical Feature #4: 'HISTOLOGICAL.TYPE'
| nPatients | RECTAL ADENOCARCINOMA | RECTAL MUCINOUS ADENOCARCINOMA |
|---|---|---|
| ALL | 58 | 7 |
| subtype1 | 18 | 1 |
| subtype2 | 19 | 3 |
| subtype3 | 21 | 3 |
Figure S13. Get High-res Image Clustering Approach #2: 'mRNA cHierClus subtypes' versus Clinical Feature #4: 'HISTOLOGICAL.TYPE'
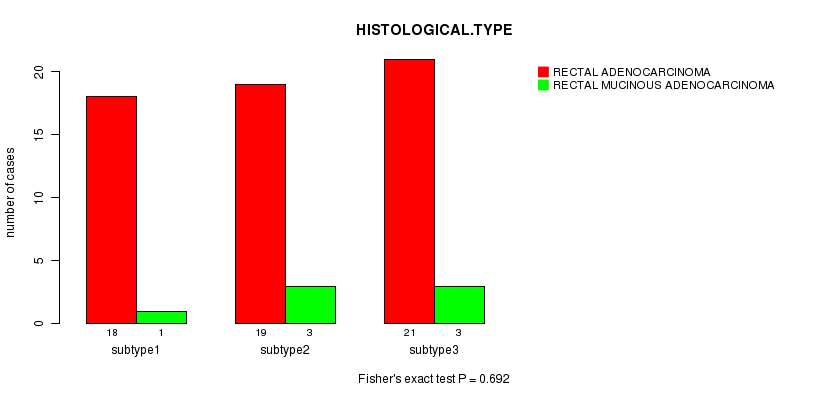
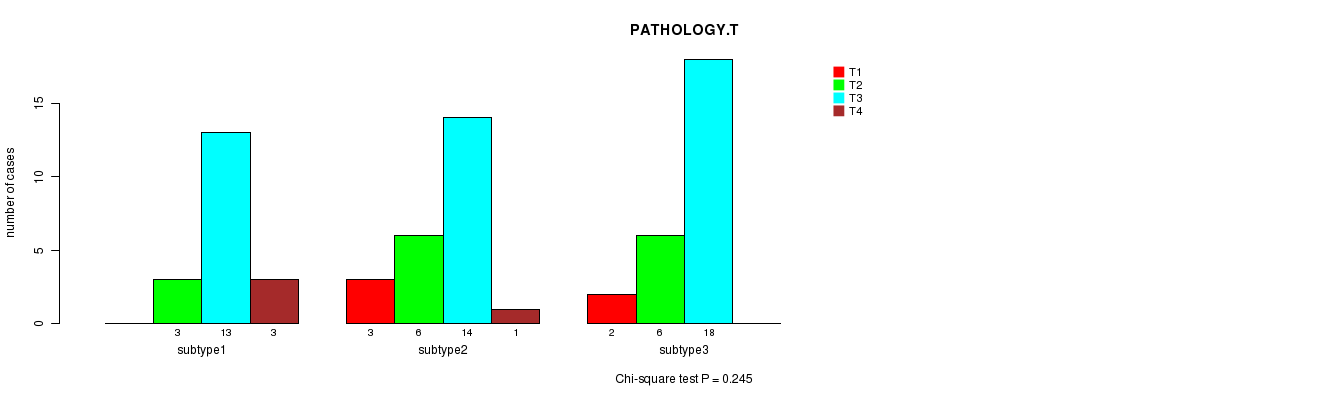
P value = 0.245 (Chi-square test)
Table S16. Clustering Approach #2: 'mRNA cHierClus subtypes' versus Clinical Feature #5: 'PATHOLOGY.T'
| nPatients | T1 | T2 | T3 | T4 |
|---|---|---|---|---|
| ALL | 5 | 15 | 45 | 4 |
| subtype1 | 0 | 3 | 13 | 3 |
| subtype2 | 3 | 6 | 14 | 1 |
| subtype3 | 2 | 6 | 18 | 0 |
Figure S14. Get High-res Image Clustering Approach #2: 'mRNA cHierClus subtypes' versus Clinical Feature #5: 'PATHOLOGY.T'
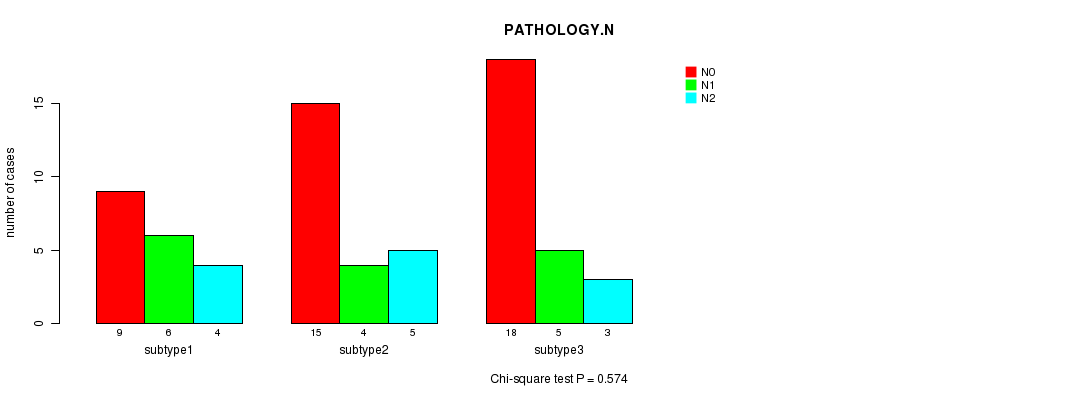
P value = 0.574 (Chi-square test)
Table S17. Clustering Approach #2: 'mRNA cHierClus subtypes' versus Clinical Feature #6: 'PATHOLOGY.N'
| nPatients | N0 | N1 | N2 |
|---|---|---|---|
| ALL | 42 | 15 | 12 |
| subtype1 | 9 | 6 | 4 |
| subtype2 | 15 | 4 | 5 |
| subtype3 | 18 | 5 | 3 |
Figure S15. Get High-res Image Clustering Approach #2: 'mRNA cHierClus subtypes' versus Clinical Feature #6: 'PATHOLOGY.N'
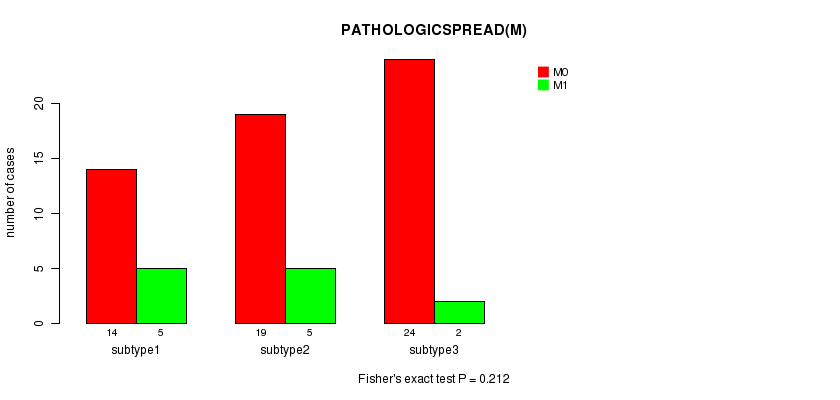
P value = 0.212 (Fisher's exact test)
Table S18. Clustering Approach #2: 'mRNA cHierClus subtypes' versus Clinical Feature #7: 'PATHOLOGICSPREAD(M)'
| nPatients | M0 | M1 |
|---|---|---|
| ALL | 57 | 12 |
| subtype1 | 14 | 5 |
| subtype2 | 19 | 5 |
| subtype3 | 24 | 2 |
Figure S16. Get High-res Image Clustering Approach #2: 'mRNA cHierClus subtypes' versus Clinical Feature #7: 'PATHOLOGICSPREAD(M)'
P value = 0.504 (Chi-square test)
Table S19. Clustering Approach #2: 'mRNA cHierClus subtypes' versus Clinical Feature #8: 'TUMOR.STAGE'
| nPatients | I | II | III | IV |
|---|---|---|---|---|
| ALL | 18 | 23 | 16 | 10 |
| subtype1 | 2 | 6 | 6 | 4 |
| subtype2 | 8 | 7 | 4 | 4 |
| subtype3 | 8 | 10 | 6 | 2 |
Figure S17. Get High-res Image Clustering Approach #2: 'mRNA cHierClus subtypes' versus Clinical Feature #8: 'TUMOR.STAGE'
P value = 1 (Fisher's exact test)
Table S20. Clustering Approach #2: 'mRNA cHierClus subtypes' versus Clinical Feature #9: 'RADIATIONS.RADIATION.REGIMENINDICATION'
| nPatients | NO | YES |
|---|---|---|
| ALL | 1 | 68 |
| subtype1 | 0 | 19 |
| subtype2 | 0 | 24 |
| subtype3 | 1 | 25 |
Figure S18. Get High-res Image Clustering Approach #2: 'mRNA cHierClus subtypes' versus Clinical Feature #9: 'RADIATIONS.RADIATION.REGIMENINDICATION'
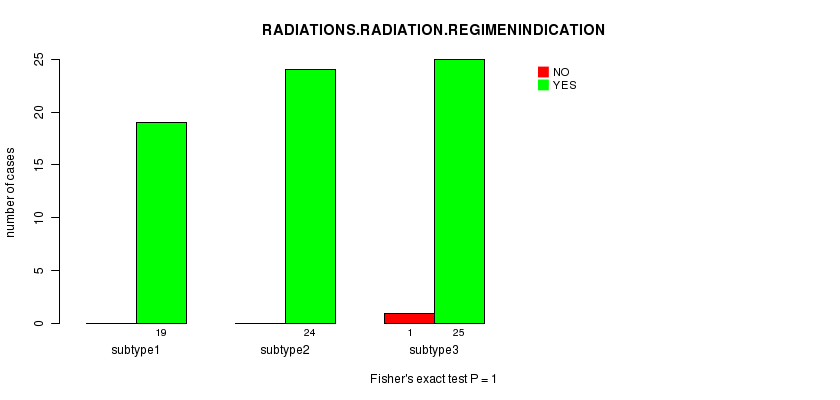
Table S21. Get Full Table Description of clustering approach #3: 'CN CNMF'
| Cluster Labels | 1 | 2 | 3 | 4 | 5 |
|---|---|---|---|---|---|
| Number of samples | 7 | 32 | 46 | 55 | 22 |
P value = 0.00743 (logrank test)
Table S22. Clustering Approach #3: 'CN CNMF' versus Clinical Feature #1: 'Time to Death'
| nPatients | nDeath | Duration Range (Median), Month | |
|---|---|---|---|
| ALL | 125 | 11 | 0.2 - 121.1 (6.3) |
| subtype1 | 7 | 0 | 0.4 - 121.1 (9.4) |
| subtype2 | 24 | 4 | 1.0 - 51.5 (5.0) |
| subtype3 | 31 | 3 | 0.5 - 119.5 (6.3) |
| subtype4 | 46 | 1 | 0.2 - 70.0 (4.7) |
| subtype5 | 17 | 3 | 0.8 - 38.9 (13.0) |
Figure S19. Get High-res Image Clustering Approach #3: 'CN CNMF' versus Clinical Feature #1: 'Time to Death'
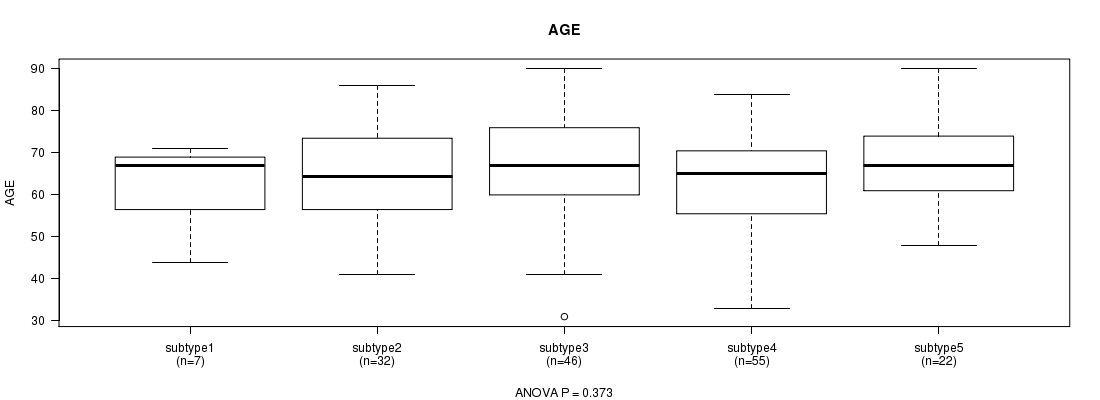
P value = 0.373 (ANOVA)
Table S23. Clustering Approach #3: 'CN CNMF' versus Clinical Feature #2: 'AGE'
| nPatients | Mean (Std.Dev) | |
|---|---|---|
| ALL | 162 | 64.7 (11.8) |
| subtype1 | 7 | 61.9 (9.9) |
| subtype2 | 32 | 64.4 (11.8) |
| subtype3 | 46 | 66.4 (12.5) |
| subtype4 | 55 | 62.7 (11.9) |
| subtype5 | 22 | 67.5 (10.3) |
Figure S20. Get High-res Image Clustering Approach #3: 'CN CNMF' versus Clinical Feature #2: 'AGE'
P value = 0.568 (Chi-square test)
Table S24. Clustering Approach #3: 'CN CNMF' versus Clinical Feature #3: 'GENDER'
| nPatients | FEMALE | MALE |
|---|---|---|
| ALL | 74 | 88 |
| subtype1 | 1 | 6 |
| subtype2 | 15 | 17 |
| subtype3 | 22 | 24 |
| subtype4 | 26 | 29 |
| subtype5 | 10 | 12 |
Figure S21. Get High-res Image Clustering Approach #3: 'CN CNMF' versus Clinical Feature #3: 'GENDER'
P value = 0.0316 (Chi-square test)
Table S25. Clustering Approach #3: 'CN CNMF' versus Clinical Feature #4: 'HISTOLOGICAL.TYPE'
| nPatients | RECTAL ADENOCARCINOMA | RECTAL MUCINOUS ADENOCARCINOMA |
|---|---|---|
| ALL | 143 | 13 |
| subtype1 | 7 | 0 |
| subtype2 | 32 | 0 |
| subtype3 | 40 | 4 |
| subtype4 | 44 | 9 |
| subtype5 | 20 | 0 |
Figure S22. Get High-res Image Clustering Approach #3: 'CN CNMF' versus Clinical Feature #4: 'HISTOLOGICAL.TYPE'
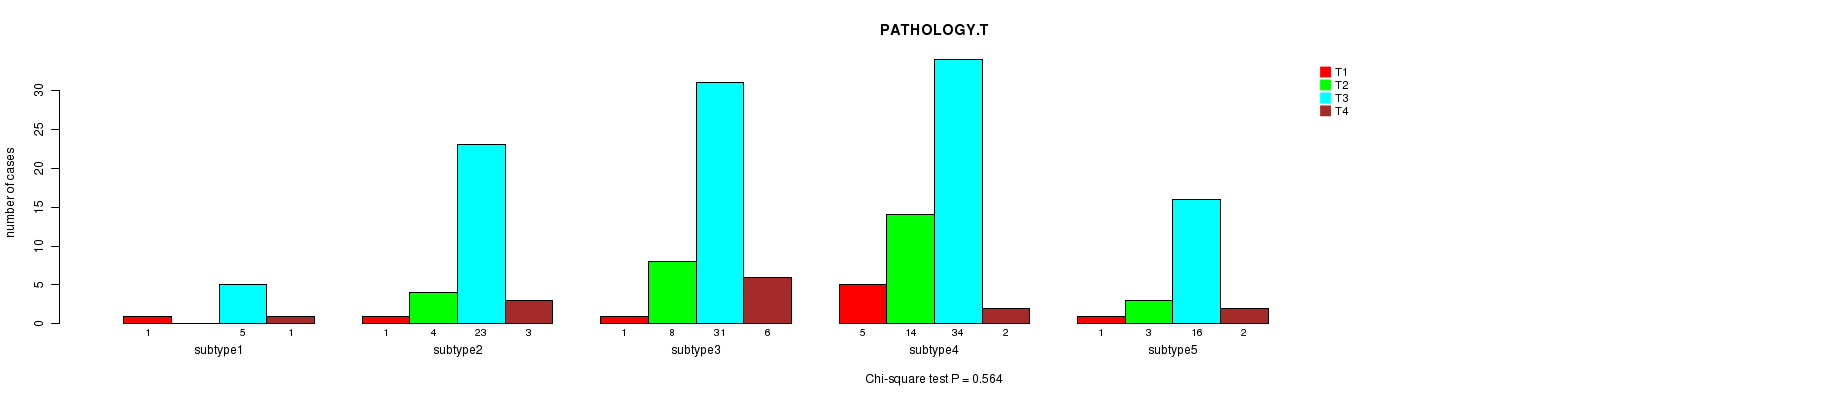
P value = 0.564 (Chi-square test)
Table S26. Clustering Approach #3: 'CN CNMF' versus Clinical Feature #5: 'PATHOLOGY.T'
| nPatients | T1 | T2 | T3 | T4 |
|---|---|---|---|---|
| ALL | 9 | 29 | 109 | 14 |
| subtype1 | 1 | 0 | 5 | 1 |
| subtype2 | 1 | 4 | 23 | 3 |
| subtype3 | 1 | 8 | 31 | 6 |
| subtype4 | 5 | 14 | 34 | 2 |
| subtype5 | 1 | 3 | 16 | 2 |
Figure S23. Get High-res Image Clustering Approach #3: 'CN CNMF' versus Clinical Feature #5: 'PATHOLOGY.T'
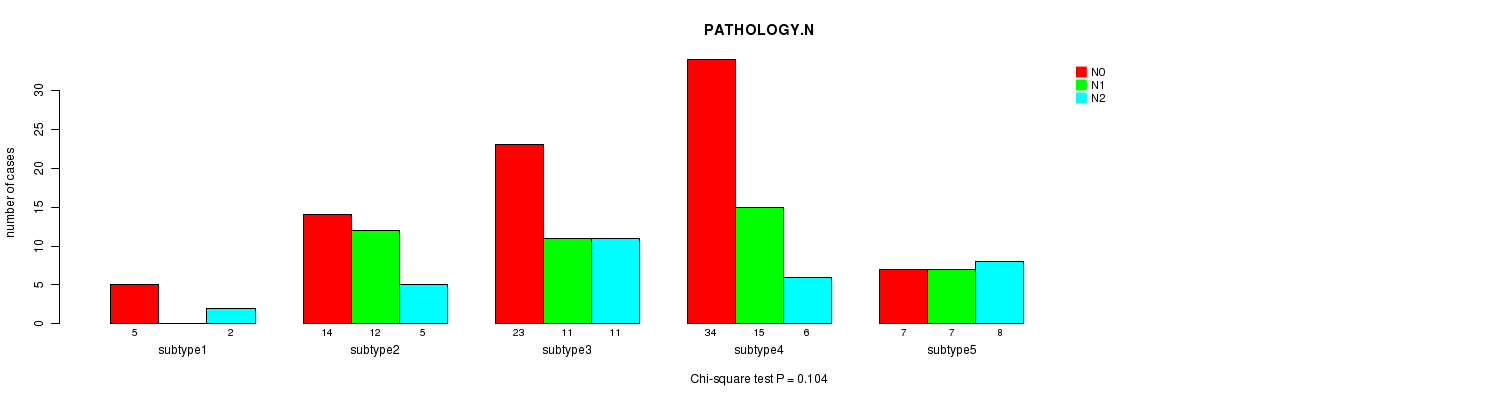
P value = 0.104 (Chi-square test)
Table S27. Clustering Approach #3: 'CN CNMF' versus Clinical Feature #6: 'PATHOLOGY.N'
| nPatients | N0 | N1 | N2 |
|---|---|---|---|
| ALL | 83 | 45 | 32 |
| subtype1 | 5 | 0 | 2 |
| subtype2 | 14 | 12 | 5 |
| subtype3 | 23 | 11 | 11 |
| subtype4 | 34 | 15 | 6 |
| subtype5 | 7 | 7 | 8 |
Figure S24. Get High-res Image Clustering Approach #3: 'CN CNMF' versus Clinical Feature #6: 'PATHOLOGY.N'
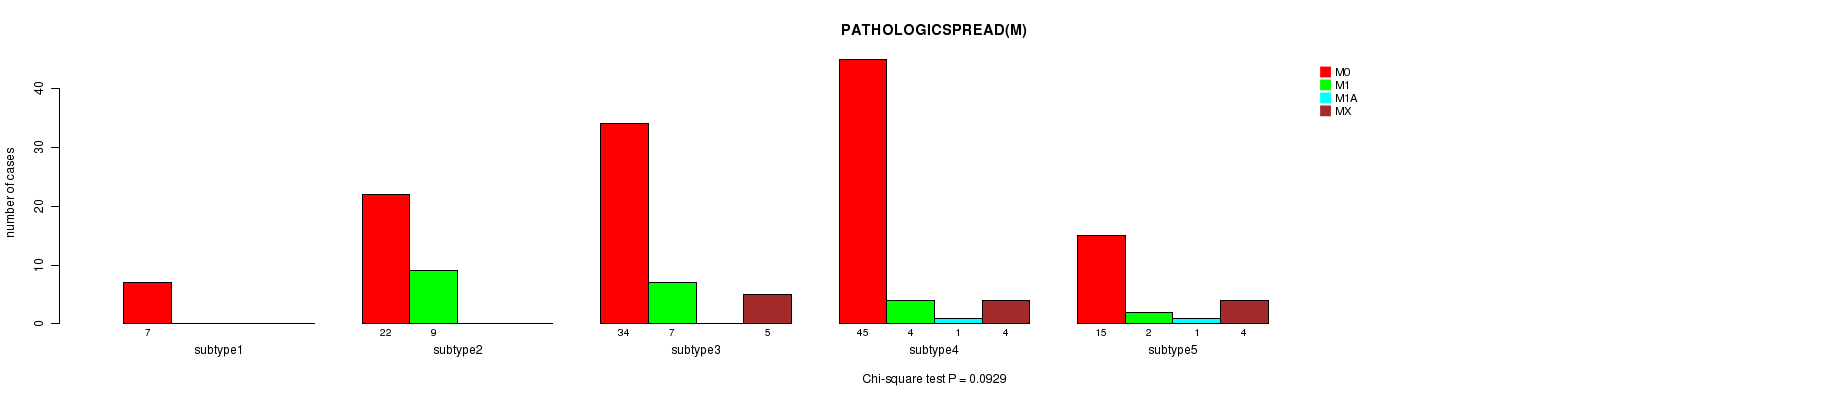
P value = 0.0929 (Chi-square test)
Table S28. Clustering Approach #3: 'CN CNMF' versus Clinical Feature #7: 'PATHOLOGICSPREAD(M)'
| nPatients | M0 | M1 | M1A | MX |
|---|---|---|---|---|
| ALL | 123 | 22 | 2 | 13 |
| subtype1 | 7 | 0 | 0 | 0 |
| subtype2 | 22 | 9 | 0 | 0 |
| subtype3 | 34 | 7 | 0 | 5 |
| subtype4 | 45 | 4 | 1 | 4 |
| subtype5 | 15 | 2 | 1 | 4 |
Figure S25. Get High-res Image Clustering Approach #3: 'CN CNMF' versus Clinical Feature #7: 'PATHOLOGICSPREAD(M)'
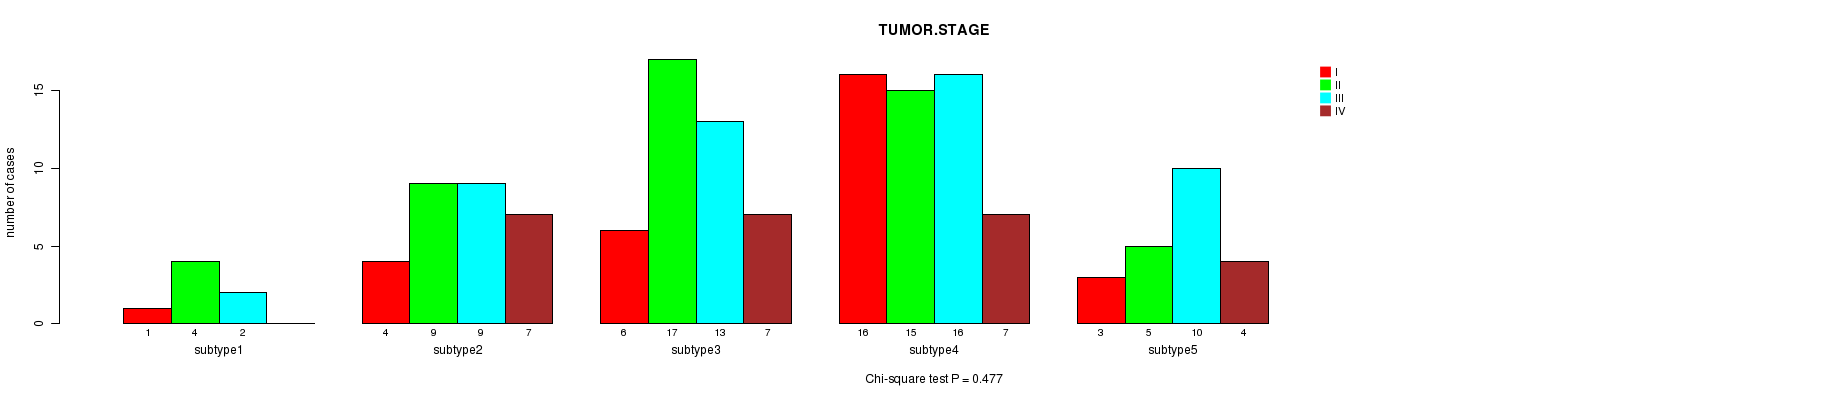
P value = 0.477 (Chi-square test)
Table S29. Clustering Approach #3: 'CN CNMF' versus Clinical Feature #8: 'TUMOR.STAGE'
| nPatients | I | II | III | IV |
|---|---|---|---|---|
| ALL | 30 | 50 | 50 | 25 |
| subtype1 | 1 | 4 | 2 | 0 |
| subtype2 | 4 | 9 | 9 | 7 |
| subtype3 | 6 | 17 | 13 | 7 |
| subtype4 | 16 | 15 | 16 | 7 |
| subtype5 | 3 | 5 | 10 | 4 |
Figure S26. Get High-res Image Clustering Approach #3: 'CN CNMF' versus Clinical Feature #8: 'TUMOR.STAGE'
P value = 0.238 (Chi-square test)
Table S30. Clustering Approach #3: 'CN CNMF' versus Clinical Feature #9: 'RADIATIONS.RADIATION.REGIMENINDICATION'
| nPatients | NO | YES |
|---|---|---|
| ALL | 6 | 156 |
| subtype1 | 1 | 6 |
| subtype2 | 0 | 32 |
| subtype3 | 1 | 45 |
| subtype4 | 2 | 53 |
| subtype5 | 2 | 20 |
Figure S27. Get High-res Image Clustering Approach #3: 'CN CNMF' versus Clinical Feature #9: 'RADIATIONS.RADIATION.REGIMENINDICATION'
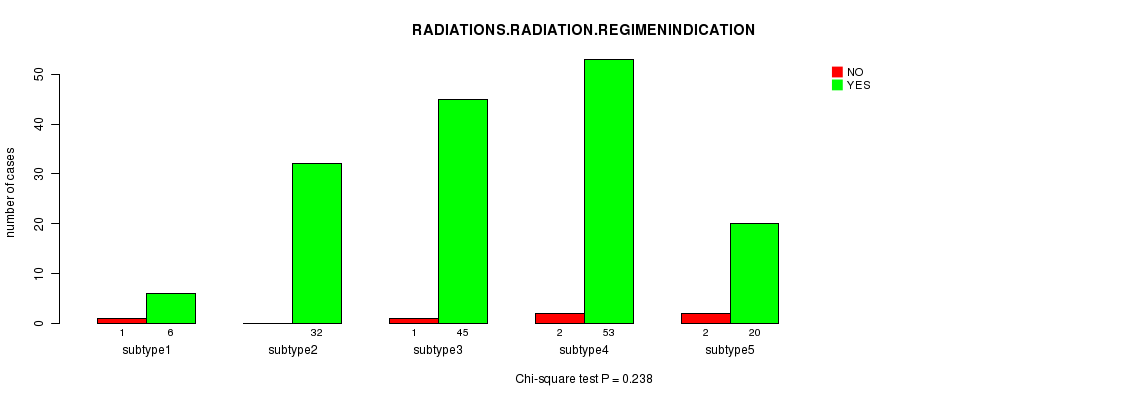
Table S31. Get Full Table Description of clustering approach #4: 'METHLYATION CNMF'
| Cluster Labels | 1 | 2 | 3 |
|---|---|---|---|
| Number of samples | 27 | 38 | 30 |
P value = 0.58 (logrank test)
Table S32. Clustering Approach #4: 'METHLYATION CNMF' versus Clinical Feature #1: 'Time to Death'
| nPatients | nDeath | Duration Range (Median), Month | |
|---|---|---|---|
| ALL | 88 | 8 | 0.2 - 121.1 (6.2) |
| subtype1 | 27 | 2 | 0.2 - 121.1 (6.9) |
| subtype2 | 35 | 3 | 0.2 - 60.0 (7.4) |
| subtype3 | 26 | 3 | 0.3 - 72.1 (3.0) |
Figure S28. Get High-res Image Clustering Approach #4: 'METHLYATION CNMF' versus Clinical Feature #1: 'Time to Death'
P value = 0.291 (ANOVA)
Table S33. Clustering Approach #4: 'METHLYATION CNMF' versus Clinical Feature #2: 'AGE'
| nPatients | Mean (Std.Dev) | |
|---|---|---|
| ALL | 95 | 63.3 (12.3) |
| subtype1 | 27 | 60.3 (9.4) |
| subtype2 | 38 | 63.9 (12.8) |
| subtype3 | 30 | 65.3 (13.6) |
Figure S29. Get High-res Image Clustering Approach #4: 'METHLYATION CNMF' versus Clinical Feature #2: 'AGE'
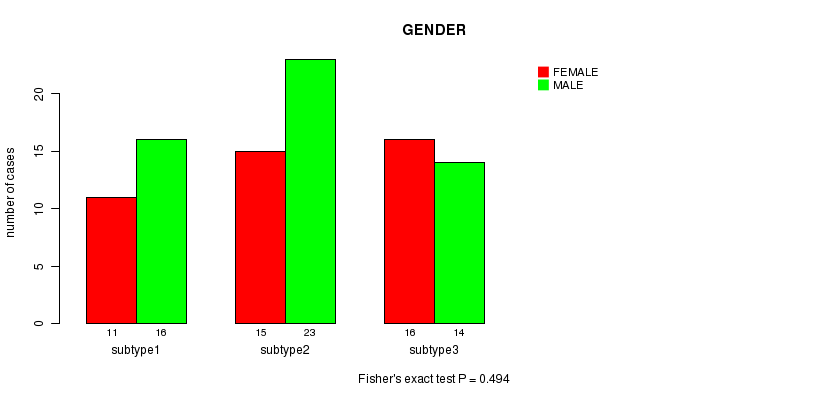
P value = 0.494 (Fisher's exact test)
Table S34. Clustering Approach #4: 'METHLYATION CNMF' versus Clinical Feature #3: 'GENDER'
| nPatients | FEMALE | MALE |
|---|---|---|
| ALL | 42 | 53 |
| subtype1 | 11 | 16 |
| subtype2 | 15 | 23 |
| subtype3 | 16 | 14 |
Figure S30. Get High-res Image Clustering Approach #4: 'METHLYATION CNMF' versus Clinical Feature #3: 'GENDER'
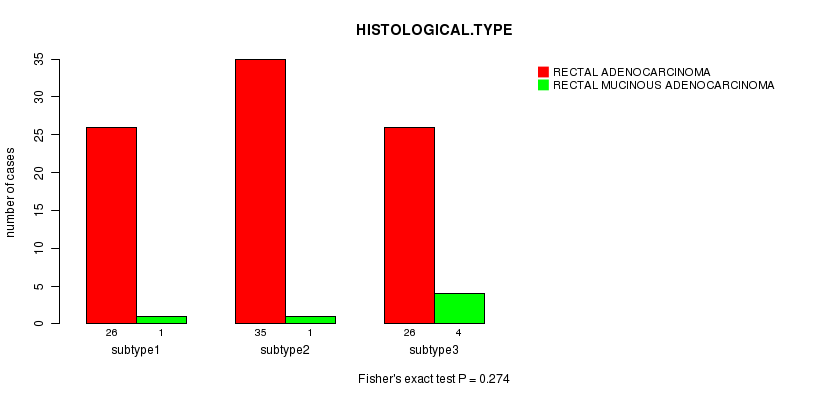
P value = 0.274 (Fisher's exact test)
Table S35. Clustering Approach #4: 'METHLYATION CNMF' versus Clinical Feature #4: 'HISTOLOGICAL.TYPE'
| nPatients | RECTAL ADENOCARCINOMA | RECTAL MUCINOUS ADENOCARCINOMA |
|---|---|---|
| ALL | 87 | 6 |
| subtype1 | 26 | 1 |
| subtype2 | 35 | 1 |
| subtype3 | 26 | 4 |
Figure S31. Get High-res Image Clustering Approach #4: 'METHLYATION CNMF' versus Clinical Feature #4: 'HISTOLOGICAL.TYPE'
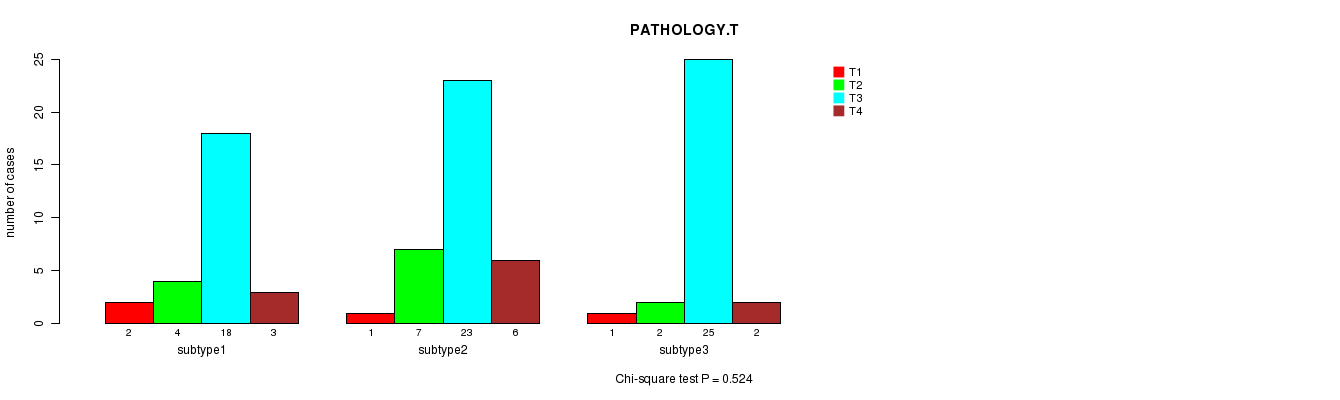
P value = 0.524 (Chi-square test)
Table S36. Clustering Approach #4: 'METHLYATION CNMF' versus Clinical Feature #5: 'PATHOLOGY.T'
| nPatients | T1 | T2 | T3 | T4 |
|---|---|---|---|---|
| ALL | 4 | 13 | 66 | 11 |
| subtype1 | 2 | 4 | 18 | 3 |
| subtype2 | 1 | 7 | 23 | 6 |
| subtype3 | 1 | 2 | 25 | 2 |
Figure S32. Get High-res Image Clustering Approach #4: 'METHLYATION CNMF' versus Clinical Feature #5: 'PATHOLOGY.T'
P value = 0.708 (Chi-square test)
Table S37. Clustering Approach #4: 'METHLYATION CNMF' versus Clinical Feature #6: 'PATHOLOGY.N'
| nPatients | N0 | N1 | N2 |
|---|---|---|---|
| ALL | 41 | 30 | 21 |
| subtype1 | 12 | 8 | 6 |
| subtype2 | 14 | 15 | 8 |
| subtype3 | 15 | 7 | 7 |
Figure S33. Get High-res Image Clustering Approach #4: 'METHLYATION CNMF' versus Clinical Feature #6: 'PATHOLOGY.N'
P value = 0.261 (Chi-square test)
Table S38. Clustering Approach #4: 'METHLYATION CNMF' versus Clinical Feature #7: 'PATHOLOGICSPREAD(M)'
| nPatients | M0 | M1 | M1A | MX |
|---|---|---|---|---|
| ALL | 67 | 10 | 2 | 14 |
| subtype1 | 17 | 6 | 1 | 3 |
| subtype2 | 27 | 1 | 1 | 7 |
| subtype3 | 23 | 3 | 0 | 4 |
Figure S34. Get High-res Image Clustering Approach #4: 'METHLYATION CNMF' versus Clinical Feature #7: 'PATHOLOGICSPREAD(M)'
P value = 0.0317 (Chi-square test)
Table S39. Clustering Approach #4: 'METHLYATION CNMF' versus Clinical Feature #8: 'TUMOR.STAGE'
| nPatients | I | II | III | IV |
|---|---|---|---|---|
| ALL | 11 | 28 | 35 | 15 |
| subtype1 | 5 | 7 | 7 | 7 |
| subtype2 | 5 | 7 | 19 | 3 |
| subtype3 | 1 | 14 | 9 | 5 |
Figure S35. Get High-res Image Clustering Approach #4: 'METHLYATION CNMF' versus Clinical Feature #8: 'TUMOR.STAGE'
P value = 0.857 (Fisher's exact test)
Table S40. Clustering Approach #4: 'METHLYATION CNMF' versus Clinical Feature #9: 'RADIATIONS.RADIATION.REGIMENINDICATION'
| nPatients | NO | YES |
|---|---|---|
| ALL | 5 | 90 |
| subtype1 | 2 | 25 |
| subtype2 | 2 | 36 |
| subtype3 | 1 | 29 |
Figure S36. Get High-res Image Clustering Approach #4: 'METHLYATION CNMF' versus Clinical Feature #9: 'RADIATIONS.RADIATION.REGIMENINDICATION'
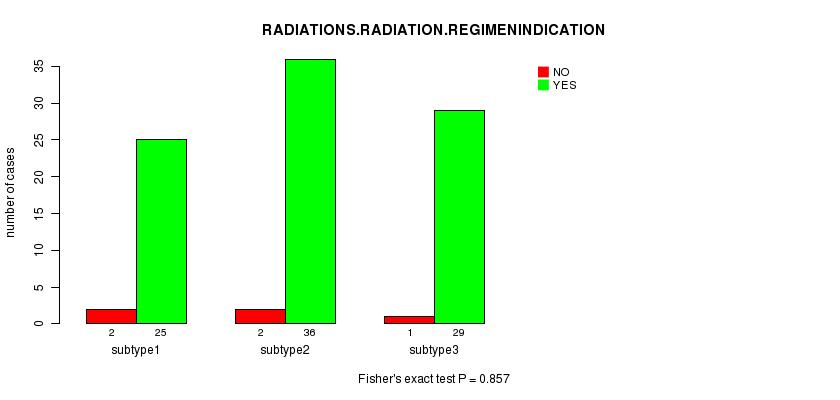
Table S41. Get Full Table Description of clustering approach #5: 'RPPA CNMF subtypes'
| Cluster Labels | 1 | 2 | 3 |
|---|---|---|---|
| Number of samples | 54 | 34 | 42 |
P value = 0.904 (logrank test)
Table S42. Clustering Approach #5: 'RPPA CNMF subtypes' versus Clinical Feature #1: 'Time to Death'
| nPatients | nDeath | Duration Range (Median), Month | |
|---|---|---|---|
| ALL | 102 | 11 | 0.2 - 121.1 (6.2) |
| subtype1 | 40 | 5 | 0.2 - 121.1 (5.6) |
| subtype2 | 24 | 2 | 0.3 - 72.1 (3.6) |
| subtype3 | 38 | 4 | 0.2 - 70.0 (8.1) |
Figure S37. Get High-res Image Clustering Approach #5: 'RPPA CNMF subtypes' versus Clinical Feature #1: 'Time to Death'
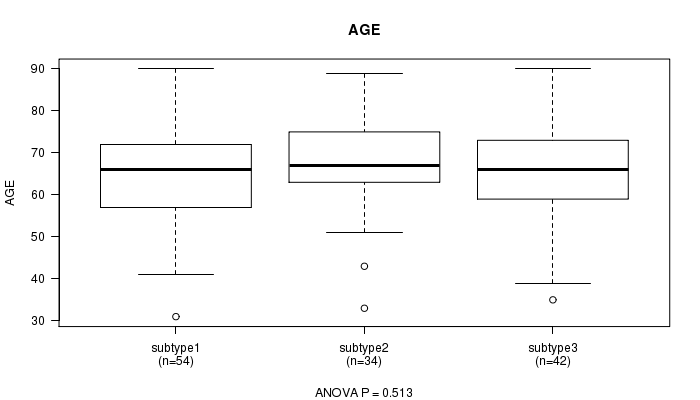
P value = 0.513 (ANOVA)
Table S43. Clustering Approach #5: 'RPPA CNMF subtypes' versus Clinical Feature #2: 'AGE'
| nPatients | Mean (Std.Dev) | |
|---|---|---|
| ALL | 130 | 65.6 (11.7) |
| subtype1 | 54 | 64.8 (12.3) |
| subtype2 | 34 | 67.6 (11.5) |
| subtype3 | 42 | 64.9 (11.2) |
Figure S38. Get High-res Image Clustering Approach #5: 'RPPA CNMF subtypes' versus Clinical Feature #2: 'AGE'
P value = 0.0423 (Fisher's exact test)
Table S44. Clustering Approach #5: 'RPPA CNMF subtypes' versus Clinical Feature #3: 'GENDER'
| nPatients | FEMALE | MALE |
|---|---|---|
| ALL | 60 | 70 |
| subtype1 | 32 | 22 |
| subtype2 | 12 | 22 |
| subtype3 | 16 | 26 |
Figure S39. Get High-res Image Clustering Approach #5: 'RPPA CNMF subtypes' versus Clinical Feature #3: 'GENDER'
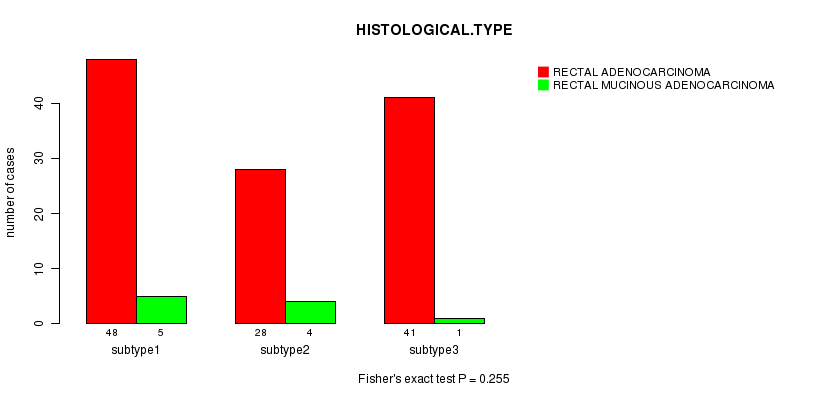
P value = 0.255 (Fisher's exact test)
Table S45. Clustering Approach #5: 'RPPA CNMF subtypes' versus Clinical Feature #4: 'HISTOLOGICAL.TYPE'
| nPatients | RECTAL ADENOCARCINOMA | RECTAL MUCINOUS ADENOCARCINOMA |
|---|---|---|
| ALL | 117 | 10 |
| subtype1 | 48 | 5 |
| subtype2 | 28 | 4 |
| subtype3 | 41 | 1 |
Figure S40. Get High-res Image Clustering Approach #5: 'RPPA CNMF subtypes' versus Clinical Feature #4: 'HISTOLOGICAL.TYPE'
P value = 0.2 (Chi-square test)
Table S46. Clustering Approach #5: 'RPPA CNMF subtypes' versus Clinical Feature #5: 'PATHOLOGY.T'
| nPatients | T1 | T2 | T3 | T4 |
|---|---|---|---|---|
| ALL | 5 | 23 | 91 | 10 |
| subtype1 | 4 | 10 | 36 | 4 |
| subtype2 | 1 | 4 | 23 | 5 |
| subtype3 | 0 | 9 | 32 | 1 |
Figure S41. Get High-res Image Clustering Approach #5: 'RPPA CNMF subtypes' versus Clinical Feature #5: 'PATHOLOGY.T'
P value = 0.114 (Chi-square test)
Table S47. Clustering Approach #5: 'RPPA CNMF subtypes' versus Clinical Feature #6: 'PATHOLOGY.N'
| nPatients | N0 | N1 | N2 |
|---|---|---|---|
| ALL | 64 | 37 | 26 |
| subtype1 | 24 | 19 | 10 |
| subtype2 | 13 | 10 | 10 |
| subtype3 | 27 | 8 | 6 |
Figure S42. Get High-res Image Clustering Approach #5: 'RPPA CNMF subtypes' versus Clinical Feature #6: 'PATHOLOGY.N'
P value = 0.0137 (Chi-square test)
Table S48. Clustering Approach #5: 'RPPA CNMF subtypes' versus Clinical Feature #7: 'PATHOLOGICSPREAD(M)'
| nPatients | M0 | M1 | M1A | MX |
|---|---|---|---|---|
| ALL | 98 | 18 | 2 | 10 |
| subtype1 | 39 | 10 | 0 | 5 |
| subtype2 | 24 | 7 | 2 | 0 |
| subtype3 | 35 | 1 | 0 | 5 |
Figure S43. Get High-res Image Clustering Approach #5: 'RPPA CNMF subtypes' versus Clinical Feature #7: 'PATHOLOGICSPREAD(M)'
P value = 0.157 (Chi-square test)
Table S49. Clustering Approach #5: 'RPPA CNMF subtypes' versus Clinical Feature #8: 'TUMOR.STAGE'
| nPatients | I | II | III | IV |
|---|---|---|---|---|
| ALL | 21 | 40 | 42 | 19 |
| subtype1 | 9 | 14 | 18 | 10 |
| subtype2 | 4 | 9 | 10 | 8 |
| subtype3 | 8 | 17 | 14 | 1 |
Figure S44. Get High-res Image Clustering Approach #5: 'RPPA CNMF subtypes' versus Clinical Feature #8: 'TUMOR.STAGE'
P value = 1 (Fisher's exact test)
Table S50. Clustering Approach #5: 'RPPA CNMF subtypes' versus Clinical Feature #9: 'RADIATIONS.RADIATION.REGIMENINDICATION'
| nPatients | NO | YES |
|---|---|---|
| ALL | 5 | 125 |
| subtype1 | 2 | 52 |
| subtype2 | 1 | 33 |
| subtype3 | 2 | 40 |
Figure S45. Get High-res Image Clustering Approach #5: 'RPPA CNMF subtypes' versus Clinical Feature #9: 'RADIATIONS.RADIATION.REGIMENINDICATION'
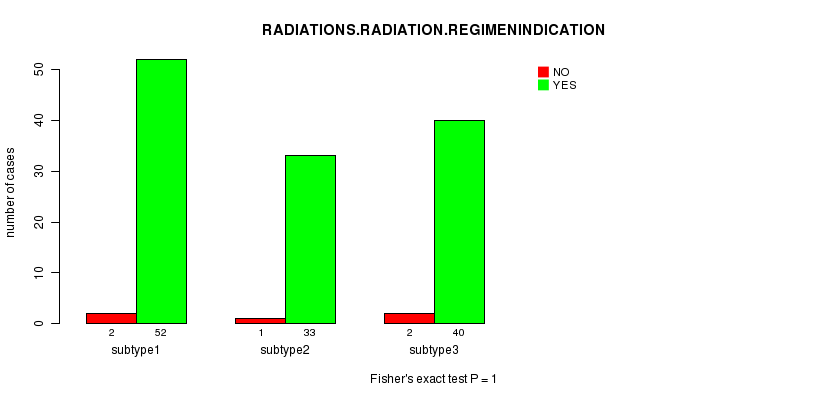
Table S51. Get Full Table Description of clustering approach #6: 'RPPA cHierClus subtypes'
| Cluster Labels | 1 | 2 | 3 | 4 | 5 |
|---|---|---|---|---|---|
| Number of samples | 6 | 26 | 20 | 42 | 36 |
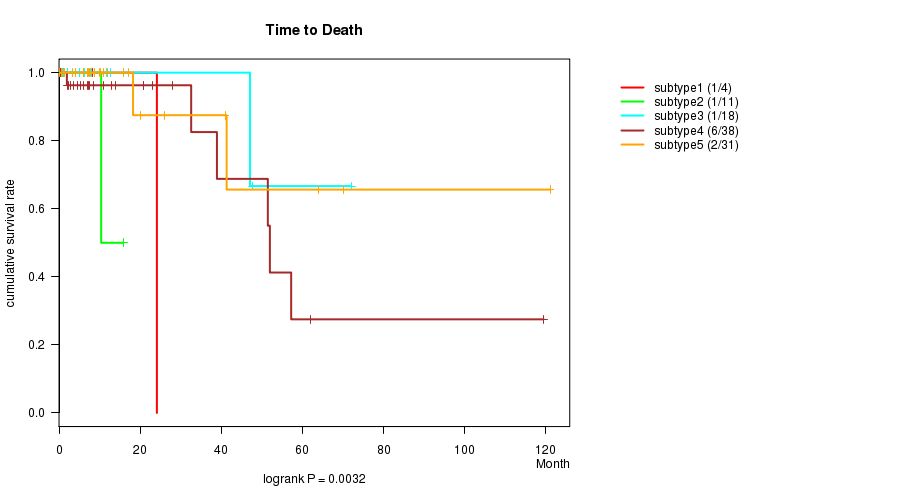
P value = 0.0032 (logrank test)
Table S52. Clustering Approach #6: 'RPPA cHierClus subtypes' versus Clinical Feature #1: 'Time to Death'
| nPatients | nDeath | Duration Range (Median), Month | |
|---|---|---|---|
| ALL | 102 | 11 | 0.2 - 121.1 (6.2) |
| subtype1 | 4 | 1 | 0.5 - 24.1 (5.2) |
| subtype2 | 11 | 1 | 0.9 - 15.8 (1.0) |
| subtype3 | 18 | 1 | 0.3 - 72.1 (5.5) |
| subtype4 | 38 | 6 | 0.2 - 119.5 (6.6) |
| subtype5 | 31 | 2 | 0.2 - 121.1 (8.0) |
Figure S46. Get High-res Image Clustering Approach #6: 'RPPA cHierClus subtypes' versus Clinical Feature #1: 'Time to Death'
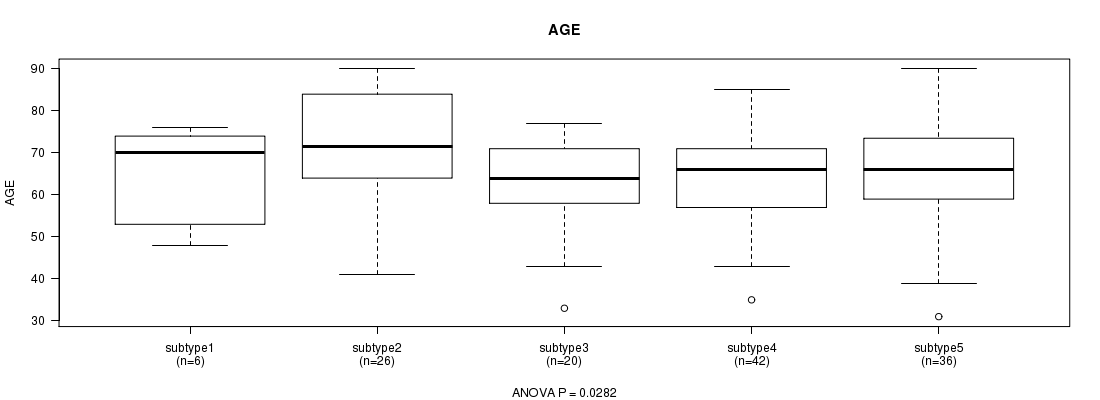
P value = 0.0282 (ANOVA)
Table S53. Clustering Approach #6: 'RPPA cHierClus subtypes' versus Clinical Feature #2: 'AGE'
| nPatients | Mean (Std.Dev) | |
|---|---|---|
| ALL | 130 | 65.6 (11.7) |
| subtype1 | 6 | 65.2 (11.9) |
| subtype2 | 26 | 72.0 (12.0) |
| subtype3 | 20 | 62.6 (11.0) |
| subtype4 | 42 | 63.4 (10.4) |
| subtype5 | 36 | 65.2 (12.2) |
Figure S47. Get High-res Image Clustering Approach #6: 'RPPA cHierClus subtypes' versus Clinical Feature #2: 'AGE'
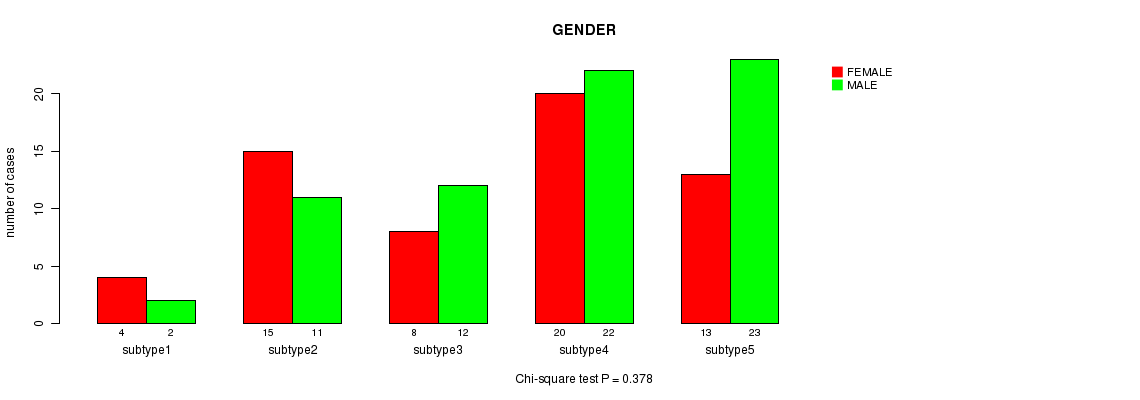
P value = 0.378 (Chi-square test)
Table S54. Clustering Approach #6: 'RPPA cHierClus subtypes' versus Clinical Feature #3: 'GENDER'
| nPatients | FEMALE | MALE |
|---|---|---|
| ALL | 60 | 70 |
| subtype1 | 4 | 2 |
| subtype2 | 15 | 11 |
| subtype3 | 8 | 12 |
| subtype4 | 20 | 22 |
| subtype5 | 13 | 23 |
Figure S48. Get High-res Image Clustering Approach #6: 'RPPA cHierClus subtypes' versus Clinical Feature #3: 'GENDER'
P value = 0.157 (Chi-square test)
Table S55. Clustering Approach #6: 'RPPA cHierClus subtypes' versus Clinical Feature #4: 'HISTOLOGICAL.TYPE'
| nPatients | RECTAL ADENOCARCINOMA | RECTAL MUCINOUS ADENOCARCINOMA |
|---|---|---|
| ALL | 117 | 10 |
| subtype1 | 5 | 1 |
| subtype2 | 23 | 1 |
| subtype3 | 17 | 3 |
| subtype4 | 36 | 5 |
| subtype5 | 36 | 0 |
Figure S49. Get High-res Image Clustering Approach #6: 'RPPA cHierClus subtypes' versus Clinical Feature #4: 'HISTOLOGICAL.TYPE'
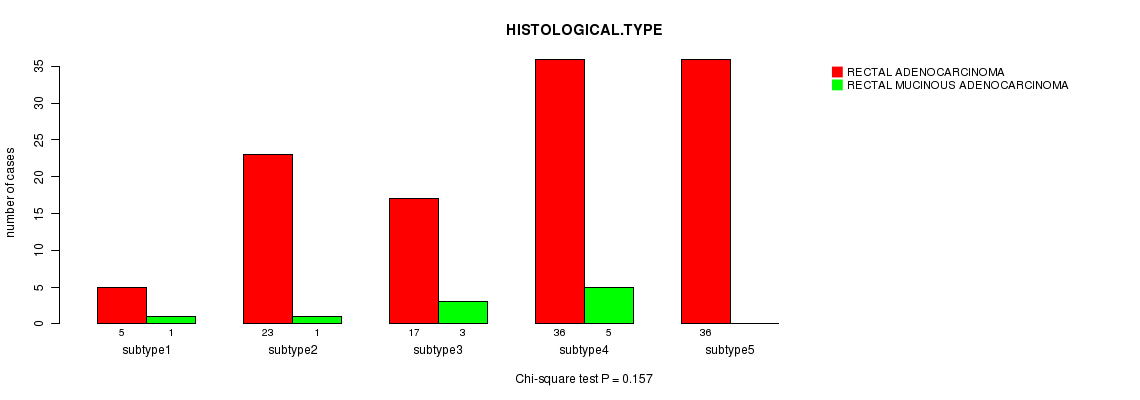
P value = 0.402 (Chi-square test)
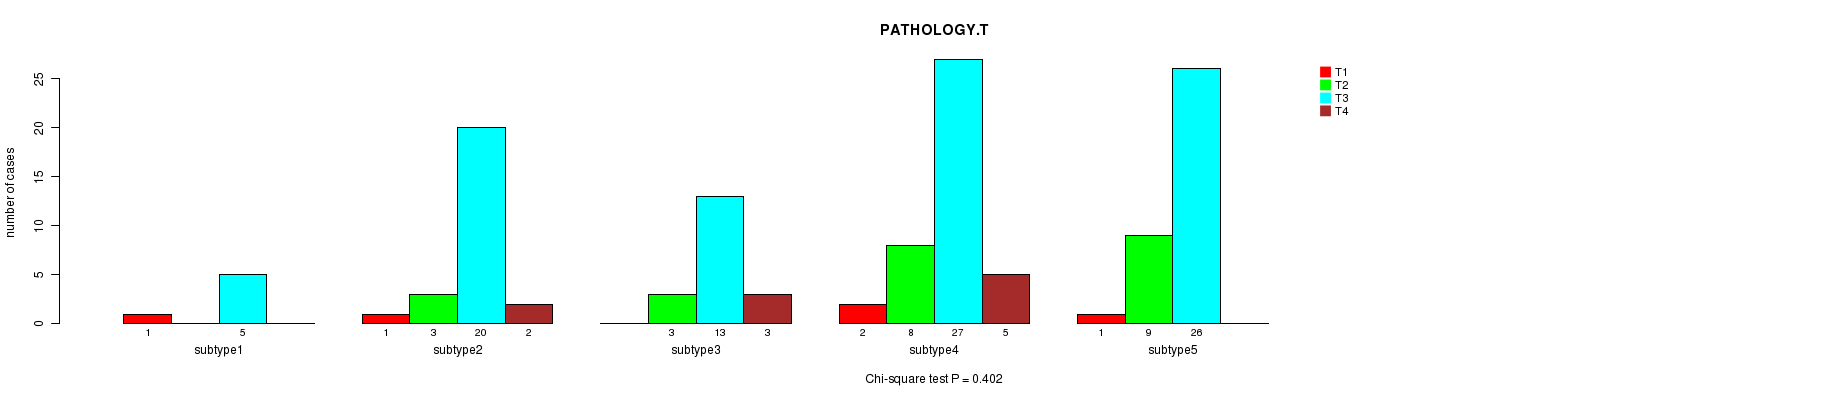
Table S56. Clustering Approach #6: 'RPPA cHierClus subtypes' versus Clinical Feature #5: 'PATHOLOGY.T'
| nPatients | T1 | T2 | T3 | T4 |
|---|---|---|---|---|
| ALL | 5 | 23 | 91 | 10 |
| subtype1 | 1 | 0 | 5 | 0 |
| subtype2 | 1 | 3 | 20 | 2 |
| subtype3 | 0 | 3 | 13 | 3 |
| subtype4 | 2 | 8 | 27 | 5 |
| subtype5 | 1 | 9 | 26 | 0 |
Figure S50. Get High-res Image Clustering Approach #6: 'RPPA cHierClus subtypes' versus Clinical Feature #5: 'PATHOLOGY.T'
P value = 0.0918 (Chi-square test)
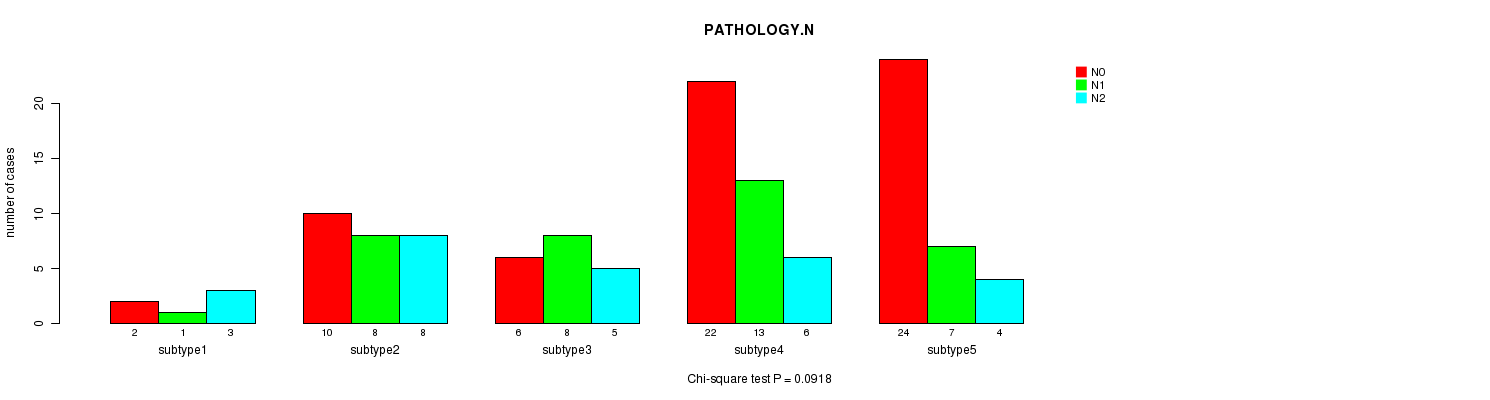
Table S57. Clustering Approach #6: 'RPPA cHierClus subtypes' versus Clinical Feature #6: 'PATHOLOGY.N'
| nPatients | N0 | N1 | N2 |
|---|---|---|---|
| ALL | 64 | 37 | 26 |
| subtype1 | 2 | 1 | 3 |
| subtype2 | 10 | 8 | 8 |
| subtype3 | 6 | 8 | 5 |
| subtype4 | 22 | 13 | 6 |
| subtype5 | 24 | 7 | 4 |
Figure S51. Get High-res Image Clustering Approach #6: 'RPPA cHierClus subtypes' versus Clinical Feature #6: 'PATHOLOGY.N'
P value = 0.0124 (Chi-square test)
Table S58. Clustering Approach #6: 'RPPA cHierClus subtypes' versus Clinical Feature #7: 'PATHOLOGICSPREAD(M)'
| nPatients | M0 | M1 | M1A | MX |
|---|---|---|---|---|
| ALL | 98 | 18 | 2 | 10 |
| subtype1 | 6 | 0 | 0 | 0 |
| subtype2 | 18 | 8 | 0 | 0 |
| subtype3 | 15 | 1 | 2 | 1 |
| subtype4 | 30 | 7 | 0 | 5 |
| subtype5 | 29 | 2 | 0 | 4 |
Figure S52. Get High-res Image Clustering Approach #6: 'RPPA cHierClus subtypes' versus Clinical Feature #7: 'PATHOLOGICSPREAD(M)'
P value = 0.218 (Chi-square test)
Table S59. Clustering Approach #6: 'RPPA cHierClus subtypes' versus Clinical Feature #8: 'TUMOR.STAGE'
| nPatients | I | II | III | IV |
|---|---|---|---|---|
| ALL | 21 | 40 | 42 | 19 |
| subtype1 | 1 | 1 | 4 | 0 |
| subtype2 | 4 | 6 | 8 | 6 |
| subtype3 | 2 | 3 | 10 | 3 |
| subtype4 | 6 | 15 | 11 | 8 |
| subtype5 | 8 | 15 | 9 | 2 |
Figure S53. Get High-res Image Clustering Approach #6: 'RPPA cHierClus subtypes' versus Clinical Feature #8: 'TUMOR.STAGE'
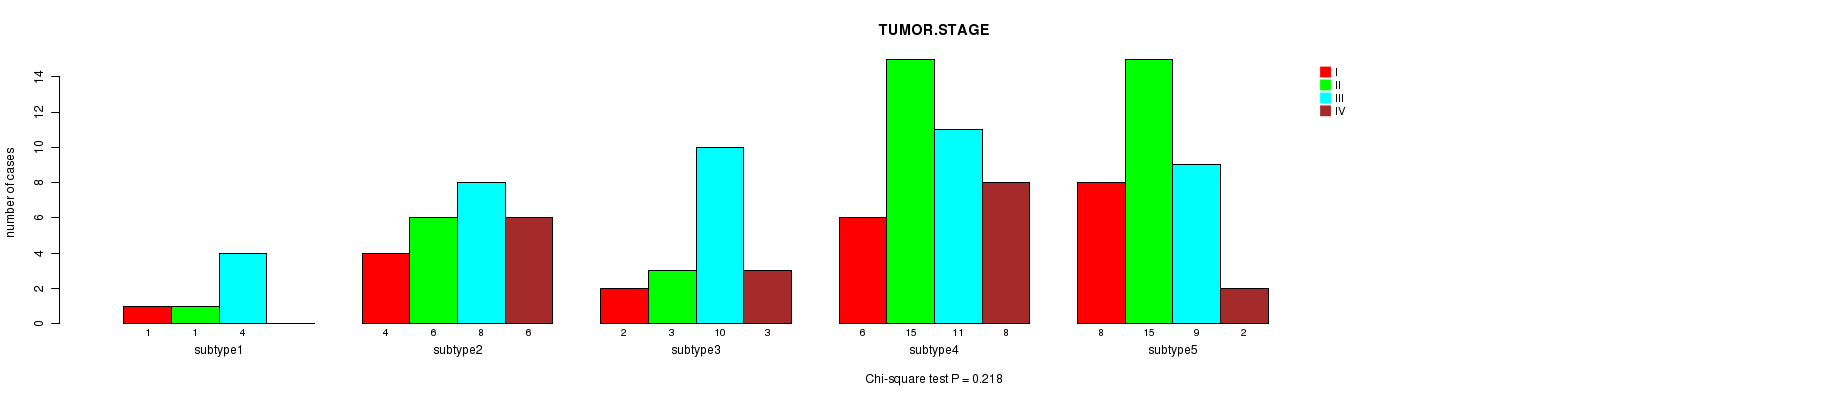
P value = 0.785 (Chi-square test)
Table S60. Clustering Approach #6: 'RPPA cHierClus subtypes' versus Clinical Feature #9: 'RADIATIONS.RADIATION.REGIMENINDICATION'
| nPatients | NO | YES |
|---|---|---|
| ALL | 5 | 125 |
| subtype1 | 0 | 6 |
| subtype2 | 0 | 26 |
| subtype3 | 1 | 19 |
| subtype4 | 2 | 40 |
| subtype5 | 2 | 34 |
Figure S54. Get High-res Image Clustering Approach #6: 'RPPA cHierClus subtypes' versus Clinical Feature #9: 'RADIATIONS.RADIATION.REGIMENINDICATION'
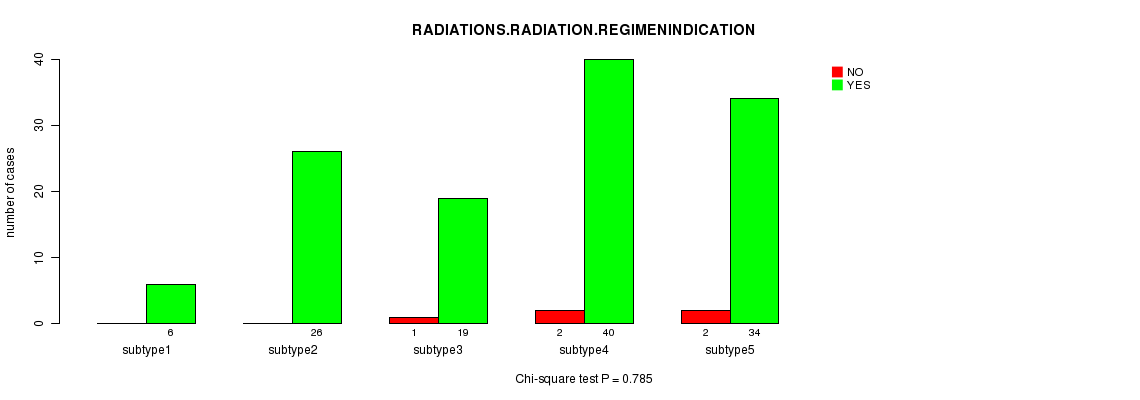
Table S61. Get Full Table Description of clustering approach #7: 'RNAseq CNMF subtypes'
| Cluster Labels | 1 | 2 | 3 | 4 |
|---|---|---|---|---|
| Number of samples | 18 | 17 | 17 | 20 |
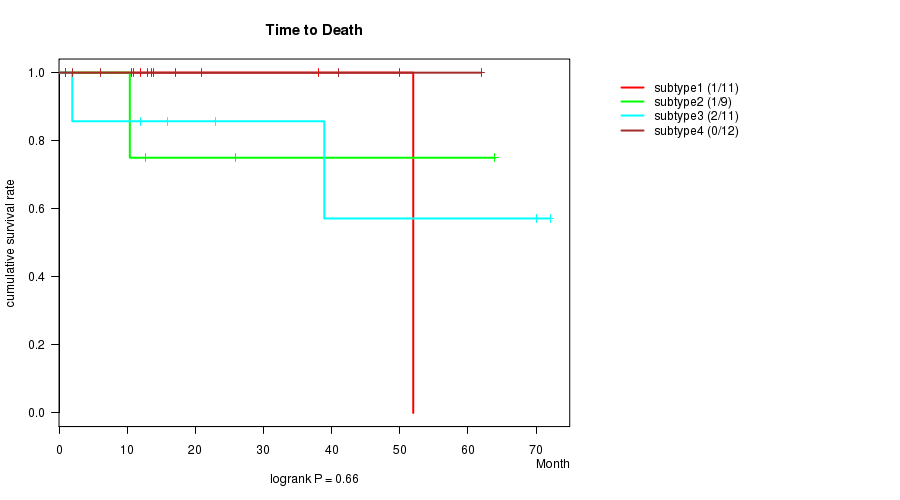
P value = 0.66 (logrank test)
Table S62. Clustering Approach #7: 'RNAseq CNMF subtypes' versus Clinical Feature #1: 'Time to Death'
| nPatients | nDeath | Duration Range (Median), Month | |
|---|---|---|---|
| ALL | 43 | 4 | 0.9 - 72.1 (10.6) |
| subtype1 | 11 | 1 | 1.0 - 52.0 (12.0) |
| subtype2 | 9 | 1 | 1.0 - 64.0 (1.0) |
| subtype3 | 11 | 2 | 0.9 - 72.1 (12.0) |
| subtype4 | 12 | 0 | 0.9 - 61.9 (8.5) |
Figure S55. Get High-res Image Clustering Approach #7: 'RNAseq CNMF subtypes' versus Clinical Feature #1: 'Time to Death'
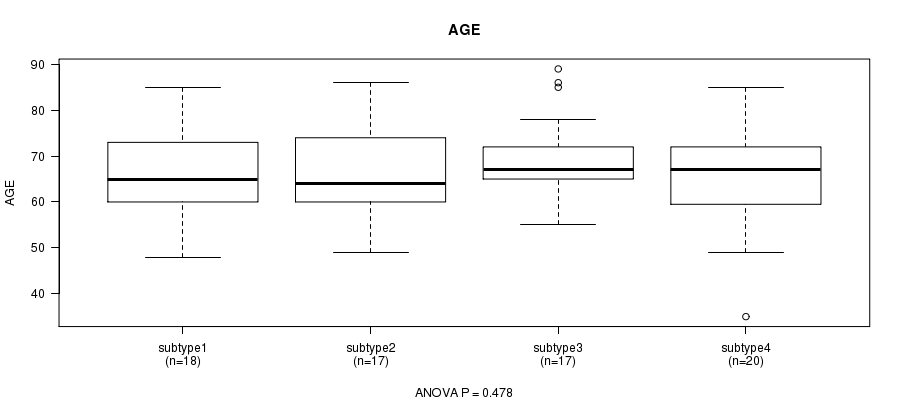
P value = 0.478 (ANOVA)
Table S63. Clustering Approach #7: 'RNAseq CNMF subtypes' versus Clinical Feature #2: 'AGE'
| nPatients | Mean (Std.Dev) | |
|---|---|---|
| ALL | 72 | 66.8 (10.2) |
| subtype1 | 18 | 66.4 (9.5) |
| subtype2 | 17 | 65.5 (10.6) |
| subtype3 | 17 | 70.1 (9.2) |
| subtype4 | 20 | 65.2 (11.4) |
Figure S56. Get High-res Image Clustering Approach #7: 'RNAseq CNMF subtypes' versus Clinical Feature #2: 'AGE'
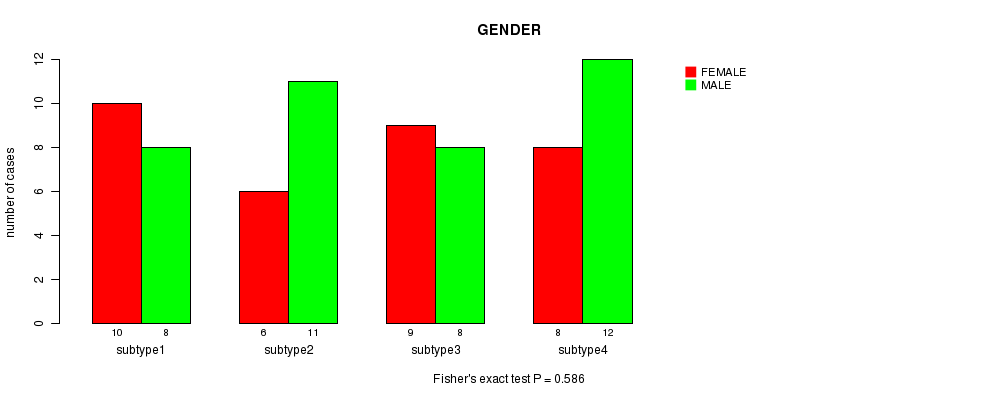
P value = 0.586 (Fisher's exact test)
Table S64. Clustering Approach #7: 'RNAseq CNMF subtypes' versus Clinical Feature #3: 'GENDER'
| nPatients | FEMALE | MALE |
|---|---|---|
| ALL | 33 | 39 |
| subtype1 | 10 | 8 |
| subtype2 | 6 | 11 |
| subtype3 | 9 | 8 |
| subtype4 | 8 | 12 |
Figure S57. Get High-res Image Clustering Approach #7: 'RNAseq CNMF subtypes' versus Clinical Feature #3: 'GENDER'
P value = 0.00271 (Fisher's exact test)
Table S65. Clustering Approach #7: 'RNAseq CNMF subtypes' versus Clinical Feature #4: 'HISTOLOGICAL.TYPE'
| nPatients | RECTAL ADENOCARCINOMA | RECTAL MUCINOUS ADENOCARCINOMA |
|---|---|---|
| ALL | 60 | 8 |
| subtype1 | 17 | 0 |
| subtype2 | 14 | 2 |
| subtype3 | 17 | 0 |
| subtype4 | 12 | 6 |
Figure S58. Get High-res Image Clustering Approach #7: 'RNAseq CNMF subtypes' versus Clinical Feature #4: 'HISTOLOGICAL.TYPE'
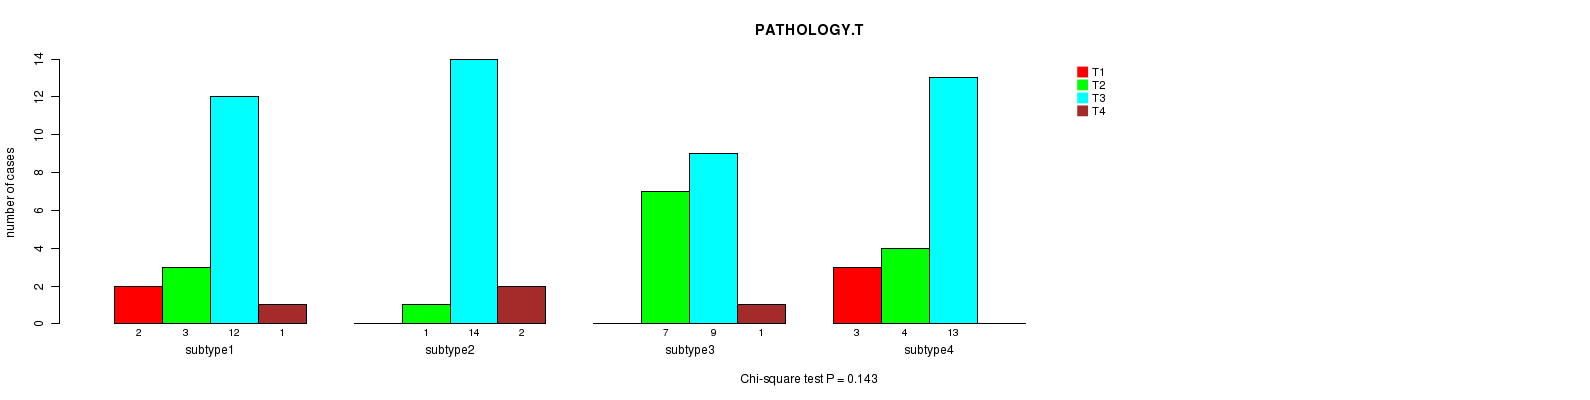
P value = 0.143 (Chi-square test)
Table S66. Clustering Approach #7: 'RNAseq CNMF subtypes' versus Clinical Feature #5: 'PATHOLOGY.T'
| nPatients | T1 | T2 | T3 | T4 |
|---|---|---|---|---|
| ALL | 5 | 15 | 48 | 4 |
| subtype1 | 2 | 3 | 12 | 1 |
| subtype2 | 0 | 1 | 14 | 2 |
| subtype3 | 0 | 7 | 9 | 1 |
| subtype4 | 3 | 4 | 13 | 0 |
Figure S59. Get High-res Image Clustering Approach #7: 'RNAseq CNMF subtypes' versus Clinical Feature #5: 'PATHOLOGY.T'
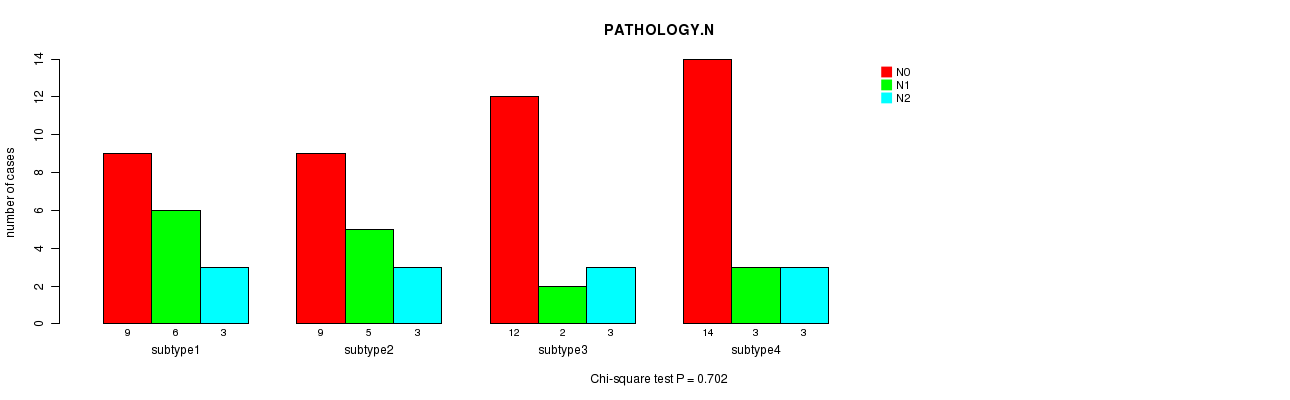
P value = 0.702 (Chi-square test)
Table S67. Clustering Approach #7: 'RNAseq CNMF subtypes' versus Clinical Feature #6: 'PATHOLOGY.N'
| nPatients | N0 | N1 | N2 |
|---|---|---|---|
| ALL | 44 | 16 | 12 |
| subtype1 | 9 | 6 | 3 |
| subtype2 | 9 | 5 | 3 |
| subtype3 | 12 | 2 | 3 |
| subtype4 | 14 | 3 | 3 |
Figure S60. Get High-res Image Clustering Approach #7: 'RNAseq CNMF subtypes' versus Clinical Feature #6: 'PATHOLOGY.N'
P value = 0.696 (Fisher's exact test)
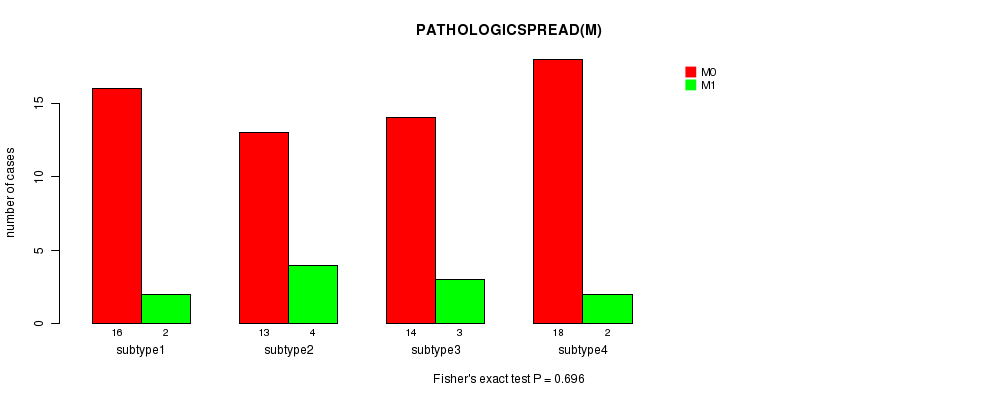
Table S68. Clustering Approach #7: 'RNAseq CNMF subtypes' versus Clinical Feature #7: 'PATHOLOGICSPREAD(M)'
| nPatients | M0 | M1 |
|---|---|---|
| ALL | 61 | 11 |
| subtype1 | 16 | 2 |
| subtype2 | 13 | 4 |
| subtype3 | 14 | 3 |
| subtype4 | 18 | 2 |
Figure S61. Get High-res Image Clustering Approach #7: 'RNAseq CNMF subtypes' versus Clinical Feature #7: 'PATHOLOGICSPREAD(M)'
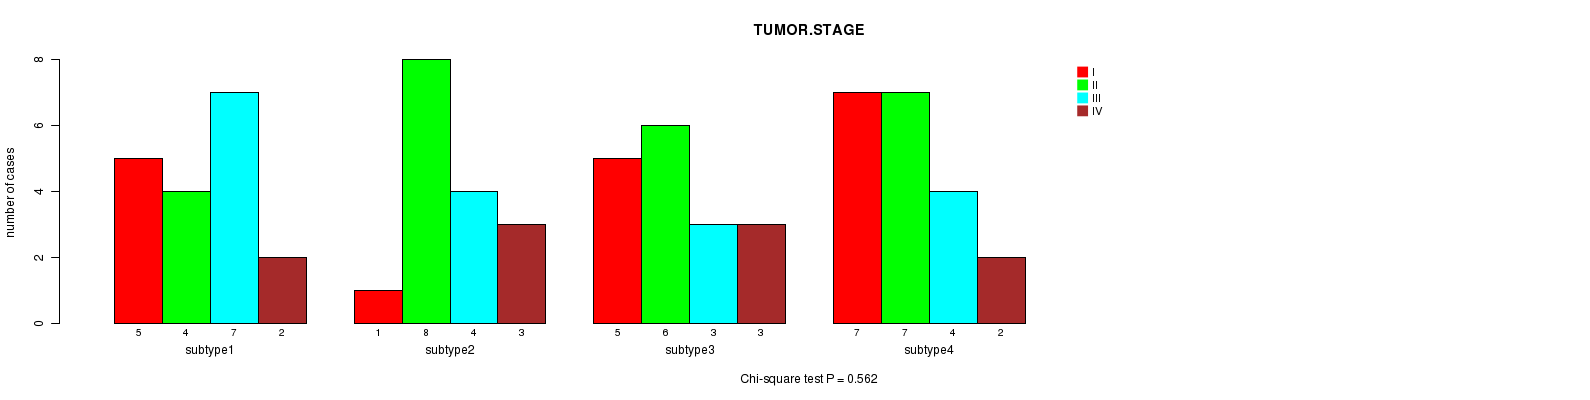
P value = 0.562 (Chi-square test)
Table S69. Clustering Approach #7: 'RNAseq CNMF subtypes' versus Clinical Feature #8: 'TUMOR.STAGE'
| nPatients | I | II | III | IV |
|---|---|---|---|---|
| ALL | 18 | 25 | 18 | 10 |
| subtype1 | 5 | 4 | 7 | 2 |
| subtype2 | 1 | 8 | 4 | 3 |
| subtype3 | 5 | 6 | 3 | 3 |
| subtype4 | 7 | 7 | 4 | 2 |
Figure S62. Get High-res Image Clustering Approach #7: 'RNAseq CNMF subtypes' versus Clinical Feature #8: 'TUMOR.STAGE'
P value = 0.472 (Fisher's exact test)
Table S70. Clustering Approach #7: 'RNAseq CNMF subtypes' versus Clinical Feature #9: 'RADIATIONS.RADIATION.REGIMENINDICATION'
| nPatients | NO | YES |
|---|---|---|
| ALL | 1 | 71 |
| subtype1 | 0 | 18 |
| subtype2 | 1 | 16 |
| subtype3 | 0 | 17 |
| subtype4 | 0 | 20 |
Figure S63. Get High-res Image Clustering Approach #7: 'RNAseq CNMF subtypes' versus Clinical Feature #9: 'RADIATIONS.RADIATION.REGIMENINDICATION'
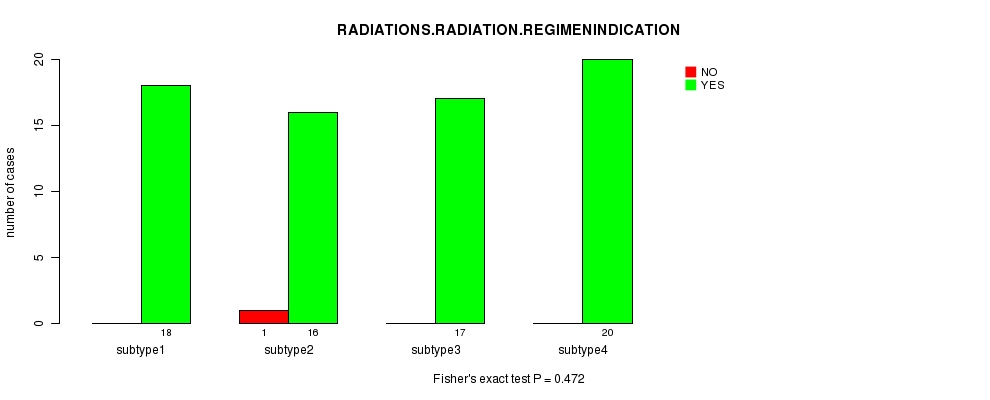
Table S71. Get Full Table Description of clustering approach #8: 'RNAseq cHierClus subtypes'
| Cluster Labels | 1 | 2 | 3 |
|---|---|---|---|
| Number of samples | 17 | 24 | 31 |
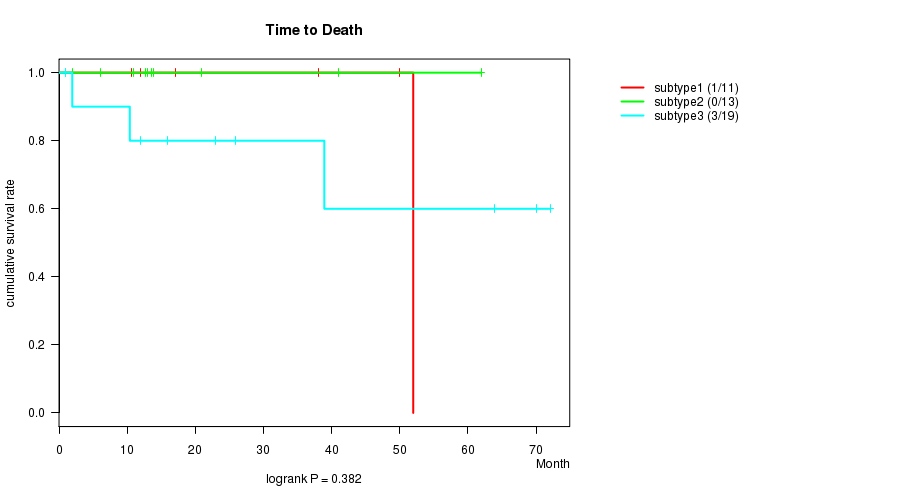
P value = 0.382 (logrank test)
Table S72. Clustering Approach #8: 'RNAseq cHierClus subtypes' versus Clinical Feature #1: 'Time to Death'
| nPatients | nDeath | Duration Range (Median), Month | |
|---|---|---|---|
| ALL | 43 | 4 | 0.9 - 72.1 (10.6) |
| subtype1 | 11 | 1 | 1.0 - 52.0 (10.6) |
| subtype2 | 13 | 0 | 0.9 - 61.9 (12.7) |
| subtype3 | 19 | 3 | 0.9 - 72.1 (1.9) |
Figure S64. Get High-res Image Clustering Approach #8: 'RNAseq cHierClus subtypes' versus Clinical Feature #1: 'Time to Death'
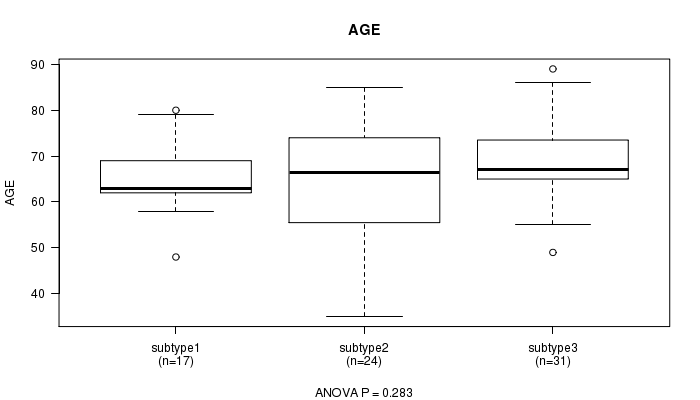
P value = 0.283 (ANOVA)
Table S73. Clustering Approach #8: 'RNAseq cHierClus subtypes' versus Clinical Feature #2: 'AGE'
| nPatients | Mean (Std.Dev) | |
|---|---|---|
| ALL | 72 | 66.8 (10.2) |
| subtype1 | 17 | 65.1 (8.0) |
| subtype2 | 24 | 65.0 (12.5) |
| subtype3 | 31 | 69.0 (9.3) |
Figure S65. Get High-res Image Clustering Approach #8: 'RNAseq cHierClus subtypes' versus Clinical Feature #2: 'AGE'
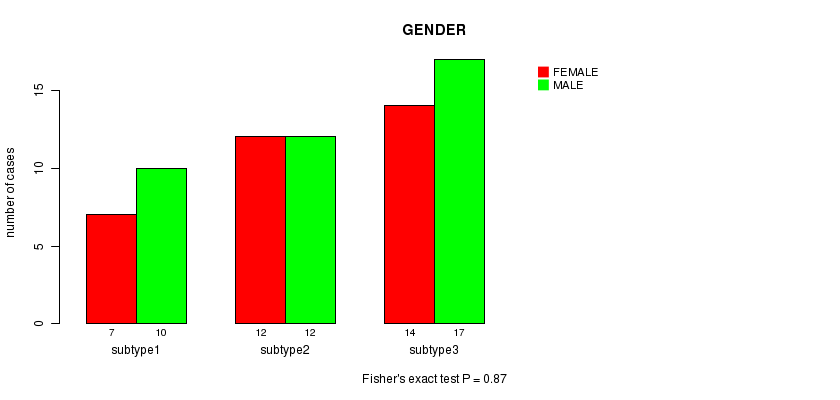
P value = 0.87 (Fisher's exact test)
Table S74. Clustering Approach #8: 'RNAseq cHierClus subtypes' versus Clinical Feature #3: 'GENDER'
| nPatients | FEMALE | MALE |
|---|---|---|
| ALL | 33 | 39 |
| subtype1 | 7 | 10 |
| subtype2 | 12 | 12 |
| subtype3 | 14 | 17 |
Figure S66. Get High-res Image Clustering Approach #8: 'RNAseq cHierClus subtypes' versus Clinical Feature #3: 'GENDER'
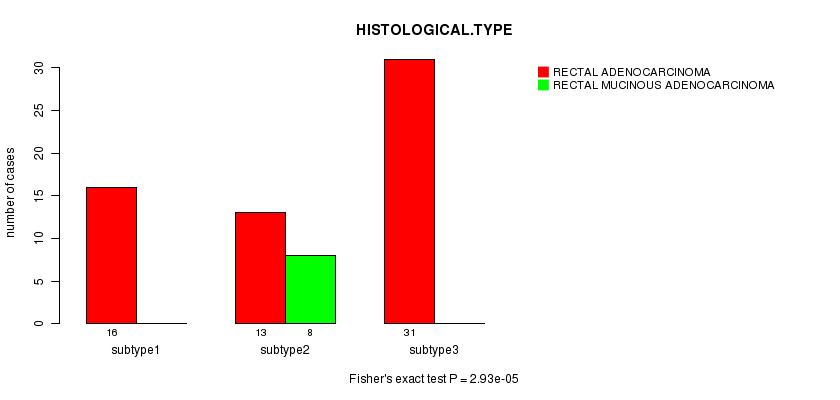
P value = 2.93e-05 (Fisher's exact test)
Table S75. Clustering Approach #8: 'RNAseq cHierClus subtypes' versus Clinical Feature #4: 'HISTOLOGICAL.TYPE'
| nPatients | RECTAL ADENOCARCINOMA | RECTAL MUCINOUS ADENOCARCINOMA |
|---|---|---|
| ALL | 60 | 8 |
| subtype1 | 16 | 0 |
| subtype2 | 13 | 8 |
| subtype3 | 31 | 0 |
Figure S67. Get High-res Image Clustering Approach #8: 'RNAseq cHierClus subtypes' versus Clinical Feature #4: 'HISTOLOGICAL.TYPE'
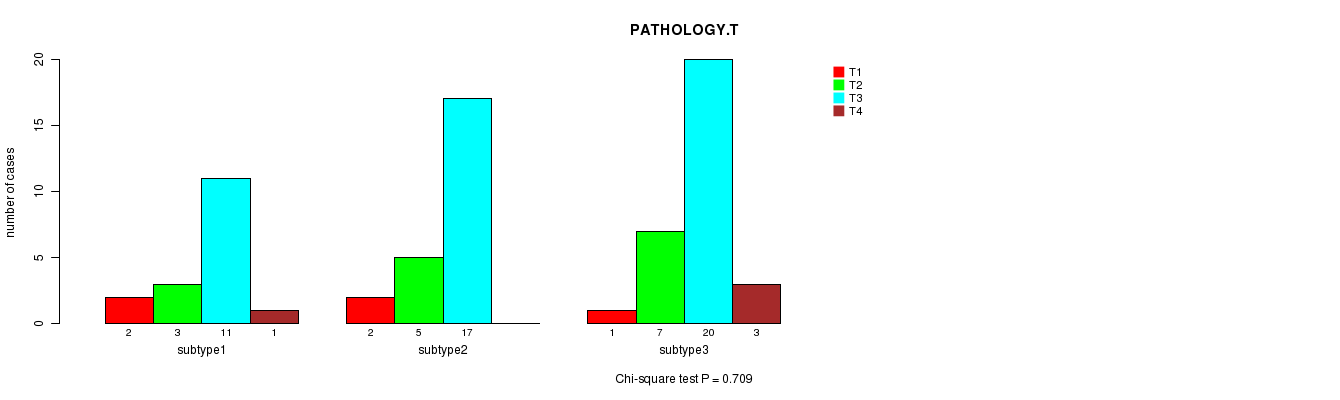
P value = 0.709 (Chi-square test)
Table S76. Clustering Approach #8: 'RNAseq cHierClus subtypes' versus Clinical Feature #5: 'PATHOLOGY.T'
| nPatients | T1 | T2 | T3 | T4 |
|---|---|---|---|---|
| ALL | 5 | 15 | 48 | 4 |
| subtype1 | 2 | 3 | 11 | 1 |
| subtype2 | 2 | 5 | 17 | 0 |
| subtype3 | 1 | 7 | 20 | 3 |
Figure S68. Get High-res Image Clustering Approach #8: 'RNAseq cHierClus subtypes' versus Clinical Feature #5: 'PATHOLOGY.T'
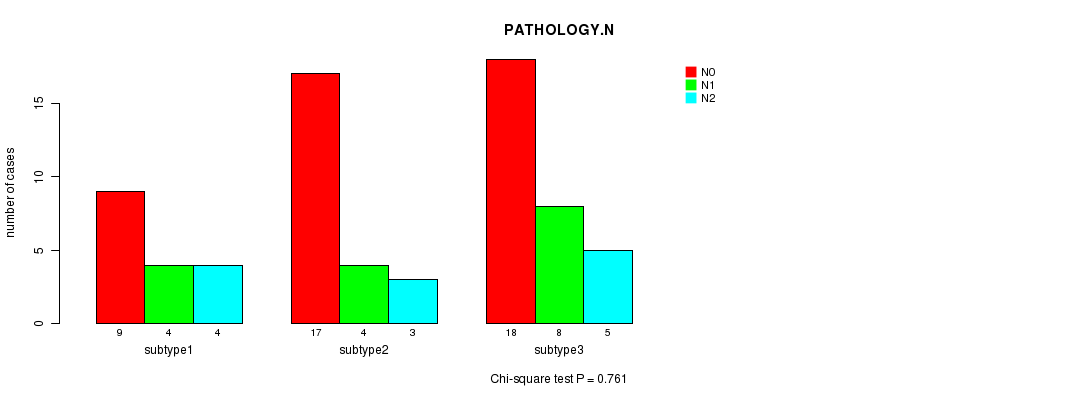
P value = 0.761 (Chi-square test)
Table S77. Clustering Approach #8: 'RNAseq cHierClus subtypes' versus Clinical Feature #6: 'PATHOLOGY.N'
| nPatients | N0 | N1 | N2 |
|---|---|---|---|
| ALL | 44 | 16 | 12 |
| subtype1 | 9 | 4 | 4 |
| subtype2 | 17 | 4 | 3 |
| subtype3 | 18 | 8 | 5 |
Figure S69. Get High-res Image Clustering Approach #8: 'RNAseq cHierClus subtypes' versus Clinical Feature #6: 'PATHOLOGY.N'
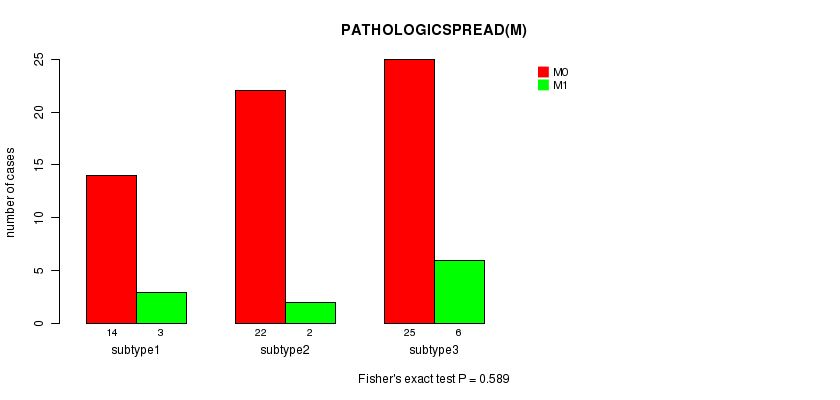
P value = 0.589 (Fisher's exact test)
Table S78. Clustering Approach #8: 'RNAseq cHierClus subtypes' versus Clinical Feature #7: 'PATHOLOGICSPREAD(M)'
| nPatients | M0 | M1 |
|---|---|---|
| ALL | 61 | 11 |
| subtype1 | 14 | 3 |
| subtype2 | 22 | 2 |
| subtype3 | 25 | 6 |
Figure S70. Get High-res Image Clustering Approach #8: 'RNAseq cHierClus subtypes' versus Clinical Feature #7: 'PATHOLOGICSPREAD(M)'
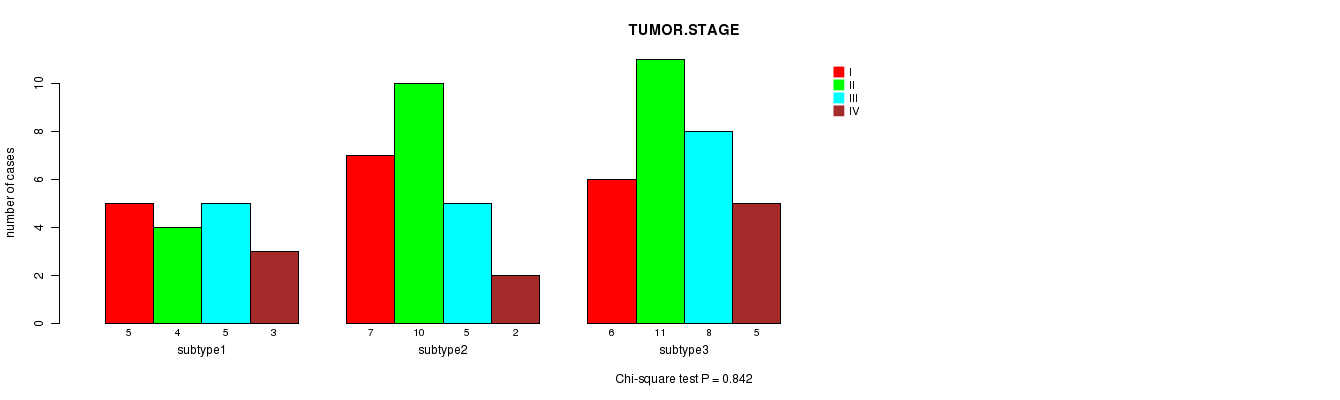
P value = 0.842 (Chi-square test)
Table S79. Clustering Approach #8: 'RNAseq cHierClus subtypes' versus Clinical Feature #8: 'TUMOR.STAGE'
| nPatients | I | II | III | IV |
|---|---|---|---|---|
| ALL | 18 | 25 | 18 | 10 |
| subtype1 | 5 | 4 | 5 | 3 |
| subtype2 | 7 | 10 | 5 | 2 |
| subtype3 | 6 | 11 | 8 | 5 |
Figure S71. Get High-res Image Clustering Approach #8: 'RNAseq cHierClus subtypes' versus Clinical Feature #8: 'TUMOR.STAGE'
P value = 0.569 (Fisher's exact test)
Table S80. Clustering Approach #8: 'RNAseq cHierClus subtypes' versus Clinical Feature #9: 'RADIATIONS.RADIATION.REGIMENINDICATION'
| nPatients | NO | YES |
|---|---|---|
| ALL | 1 | 71 |
| subtype1 | 0 | 17 |
| subtype2 | 1 | 23 |
| subtype3 | 0 | 31 |
Figure S72. Get High-res Image Clustering Approach #8: 'RNAseq cHierClus subtypes' versus Clinical Feature #9: 'RADIATIONS.RADIATION.REGIMENINDICATION'
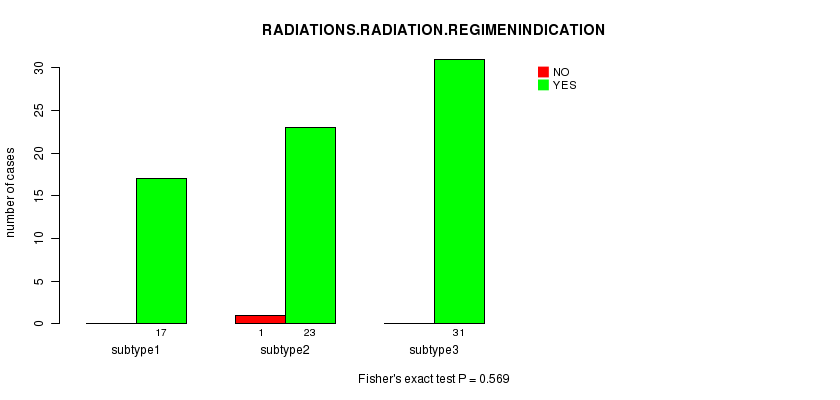
Table S81. Get Full Table Description of clustering approach #9: 'MIRseq CNMF subtypes'
| Cluster Labels | 1 | 2 | 3 | 4 | 5 |
|---|---|---|---|---|---|
| Number of samples | 18 | 42 | 17 | 10 | 56 |
P value = 0.314 (logrank test)
Table S82. Clustering Approach #9: 'MIRseq CNMF subtypes' versus Clinical Feature #1: 'Time to Death'
| nPatients | nDeath | Duration Range (Median), Month | |
|---|---|---|---|
| ALL | 106 | 10 | 0.2 - 121.1 (7.0) |
| subtype1 | 16 | 3 | 0.3 - 121.1 (8.7) |
| subtype2 | 38 | 5 | 0.5 - 60.0 (7.3) |
| subtype3 | 15 | 0 | 0.5 - 119.5 (6.0) |
| subtype4 | 10 | 0 | 0.2 - 72.1 (1.5) |
| subtype5 | 27 | 2 | 0.9 - 70.0 (1.9) |
Figure S73. Get High-res Image Clustering Approach #9: 'MIRseq CNMF subtypes' versus Clinical Feature #1: 'Time to Death'
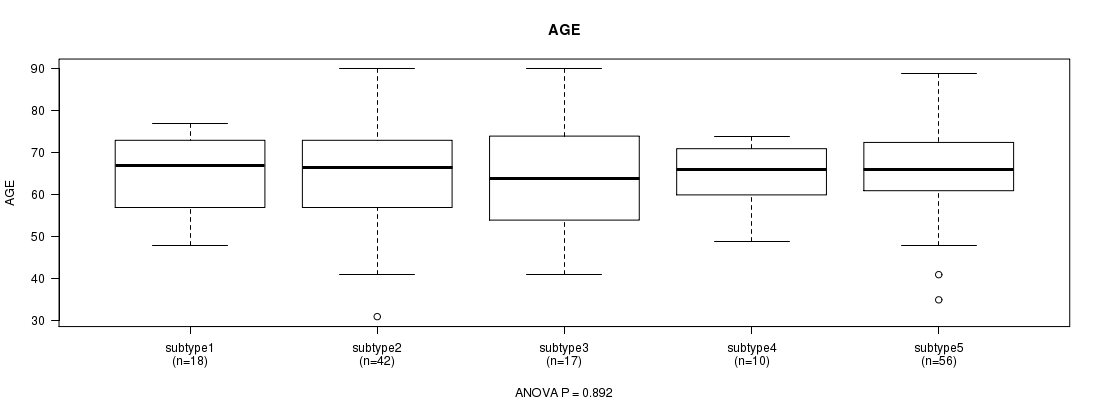
P value = 0.892 (ANOVA)
Table S83. Clustering Approach #9: 'MIRseq CNMF subtypes' versus Clinical Feature #2: 'AGE'
| nPatients | Mean (Std.Dev) | |
|---|---|---|
| ALL | 143 | 65.4 (11.5) |
| subtype1 | 18 | 65.2 (9.4) |
| subtype2 | 42 | 64.1 (12.6) |
| subtype3 | 17 | 65.3 (14.5) |
| subtype4 | 10 | 64.8 (7.4) |
| subtype5 | 56 | 66.6 (11.1) |
Figure S74. Get High-res Image Clustering Approach #9: 'MIRseq CNMF subtypes' versus Clinical Feature #2: 'AGE'
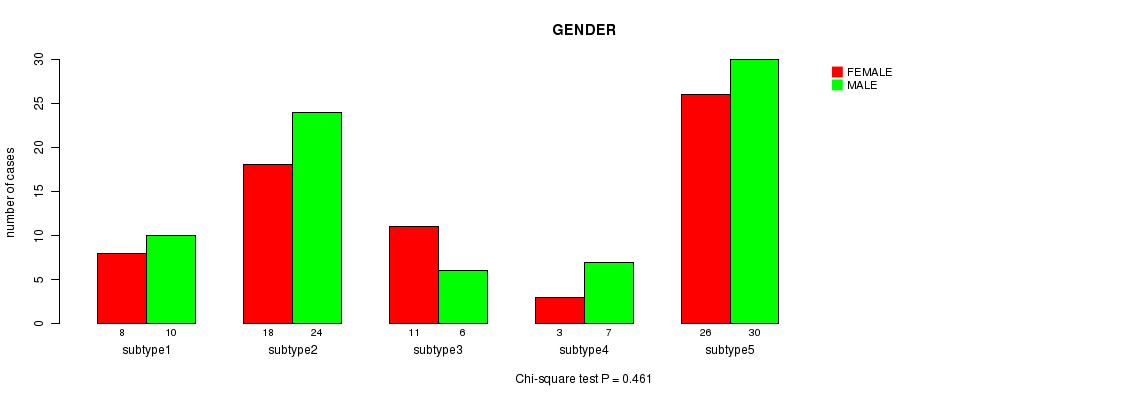
P value = 0.461 (Chi-square test)
Table S84. Clustering Approach #9: 'MIRseq CNMF subtypes' versus Clinical Feature #3: 'GENDER'
| nPatients | FEMALE | MALE |
|---|---|---|
| ALL | 66 | 77 |
| subtype1 | 8 | 10 |
| subtype2 | 18 | 24 |
| subtype3 | 11 | 6 |
| subtype4 | 3 | 7 |
| subtype5 | 26 | 30 |
Figure S75. Get High-res Image Clustering Approach #9: 'MIRseq CNMF subtypes' versus Clinical Feature #3: 'GENDER'
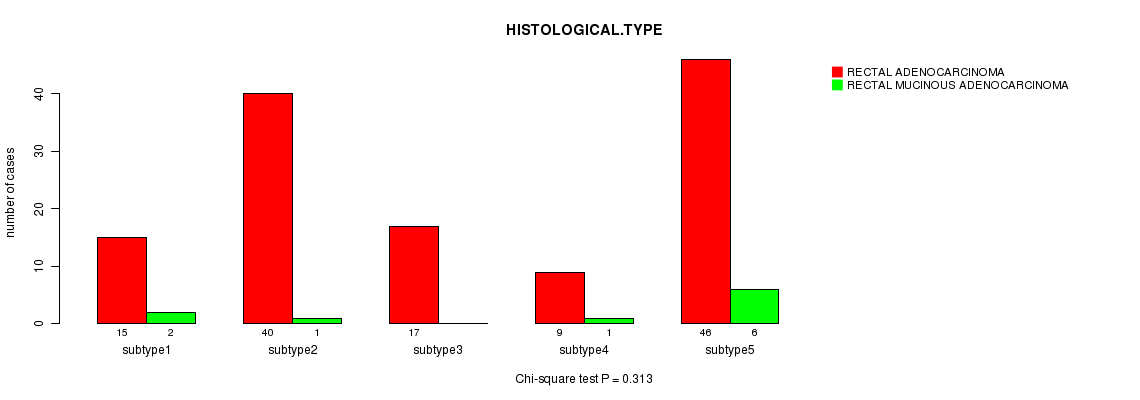
P value = 0.313 (Chi-square test)
Table S85. Clustering Approach #9: 'MIRseq CNMF subtypes' versus Clinical Feature #4: 'HISTOLOGICAL.TYPE'
| nPatients | RECTAL ADENOCARCINOMA | RECTAL MUCINOUS ADENOCARCINOMA |
|---|---|---|
| ALL | 127 | 10 |
| subtype1 | 15 | 2 |
| subtype2 | 40 | 1 |
| subtype3 | 17 | 0 |
| subtype4 | 9 | 1 |
| subtype5 | 46 | 6 |
Figure S76. Get High-res Image Clustering Approach #9: 'MIRseq CNMF subtypes' versus Clinical Feature #4: 'HISTOLOGICAL.TYPE'
P value = 0.251 (Chi-square test)
Table S86. Clustering Approach #9: 'MIRseq CNMF subtypes' versus Clinical Feature #5: 'PATHOLOGY.T'
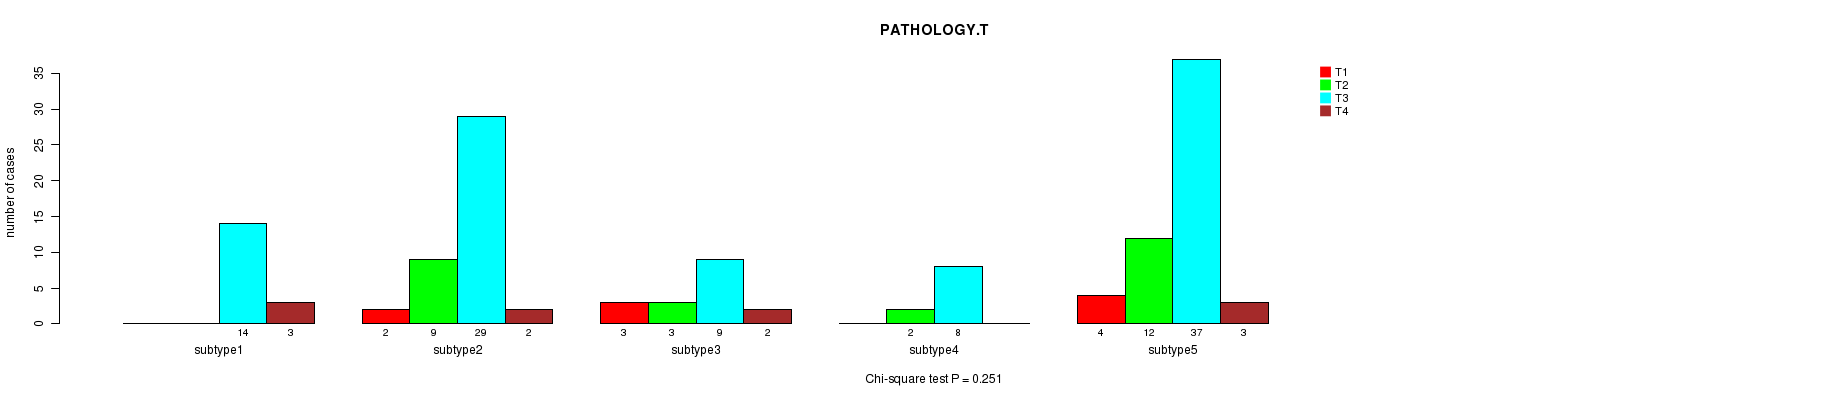
| nPatients | T1 | T2 | T3 | T4 |
|---|---|---|---|---|
| ALL | 9 | 26 | 97 | 10 |
| subtype1 | 0 | 0 | 14 | 3 |
| subtype2 | 2 | 9 | 29 | 2 |
| subtype3 | 3 | 3 | 9 | 2 |
| subtype4 | 0 | 2 | 8 | 0 |
| subtype5 | 4 | 12 | 37 | 3 |
Figure S77. Get High-res Image Clustering Approach #9: 'MIRseq CNMF subtypes' versus Clinical Feature #5: 'PATHOLOGY.T'
P value = 0.0172 (Chi-square test)
Table S87. Clustering Approach #9: 'MIRseq CNMF subtypes' versus Clinical Feature #6: 'PATHOLOGY.N'
| nPatients | N0 | N1 | N2 |
|---|---|---|---|
| ALL | 74 | 38 | 28 |
| subtype1 | 5 | 4 | 7 |
| subtype2 | 16 | 19 | 7 |
| subtype3 | 11 | 4 | 2 |
| subtype4 | 6 | 1 | 2 |
| subtype5 | 36 | 10 | 10 |
Figure S78. Get High-res Image Clustering Approach #9: 'MIRseq CNMF subtypes' versus Clinical Feature #6: 'PATHOLOGY.N'
P value = 0.0461 (Chi-square test)
Table S88. Clustering Approach #9: 'MIRseq CNMF subtypes' versus Clinical Feature #7: 'PATHOLOGICSPREAD(M)'
| nPatients | M0 | M1 | M1A | MX |
|---|---|---|---|---|
| ALL | 107 | 18 | 2 | 14 |
| subtype1 | 11 | 2 | 1 | 3 |
| subtype2 | 28 | 4 | 0 | 9 |
| subtype3 | 13 | 2 | 1 | 1 |
| subtype4 | 7 | 2 | 0 | 1 |
| subtype5 | 48 | 8 | 0 | 0 |
Figure S79. Get High-res Image Clustering Approach #9: 'MIRseq CNMF subtypes' versus Clinical Feature #7: 'PATHOLOGICSPREAD(M)'
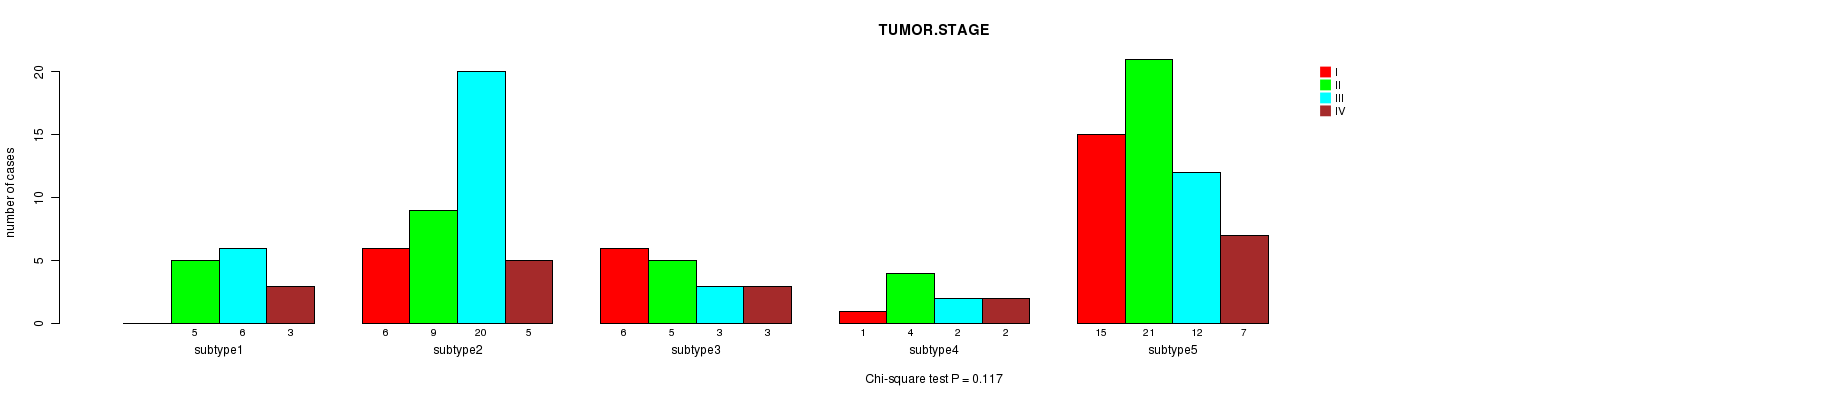
P value = 0.117 (Chi-square test)
Table S89. Clustering Approach #9: 'MIRseq CNMF subtypes' versus Clinical Feature #8: 'TUMOR.STAGE'
| nPatients | I | II | III | IV |
|---|---|---|---|---|
| ALL | 28 | 44 | 43 | 20 |
| subtype1 | 0 | 5 | 6 | 3 |
| subtype2 | 6 | 9 | 20 | 5 |
| subtype3 | 6 | 5 | 3 | 3 |
| subtype4 | 1 | 4 | 2 | 2 |
| subtype5 | 15 | 21 | 12 | 7 |
Figure S80. Get High-res Image Clustering Approach #9: 'MIRseq CNMF subtypes' versus Clinical Feature #8: 'TUMOR.STAGE'
P value = 0.283 (Chi-square test)
Table S90. Clustering Approach #9: 'MIRseq CNMF subtypes' versus Clinical Feature #9: 'RADIATIONS.RADIATION.REGIMENINDICATION'
| nPatients | NO | YES |
|---|---|---|
| ALL | 6 | 137 |
| subtype1 | 2 | 16 |
| subtype2 | 3 | 39 |
| subtype3 | 0 | 17 |
| subtype4 | 0 | 10 |
| subtype5 | 1 | 55 |
Figure S81. Get High-res Image Clustering Approach #9: 'MIRseq CNMF subtypes' versus Clinical Feature #9: 'RADIATIONS.RADIATION.REGIMENINDICATION'
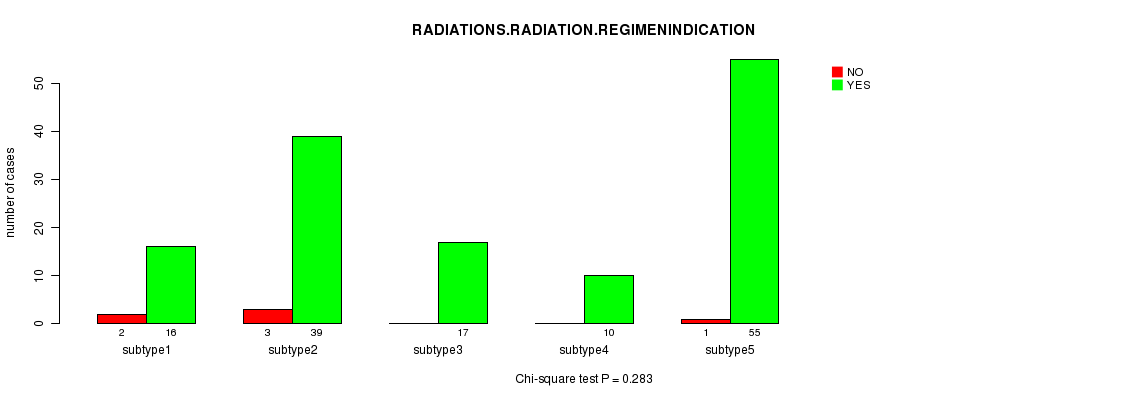
Table S91. Get Full Table Description of clustering approach #10: 'MIRseq cHierClus subtypes'
| Cluster Labels | 1 | 2 | 3 |
|---|---|---|---|
| Number of samples | 20 | 64 | 59 |
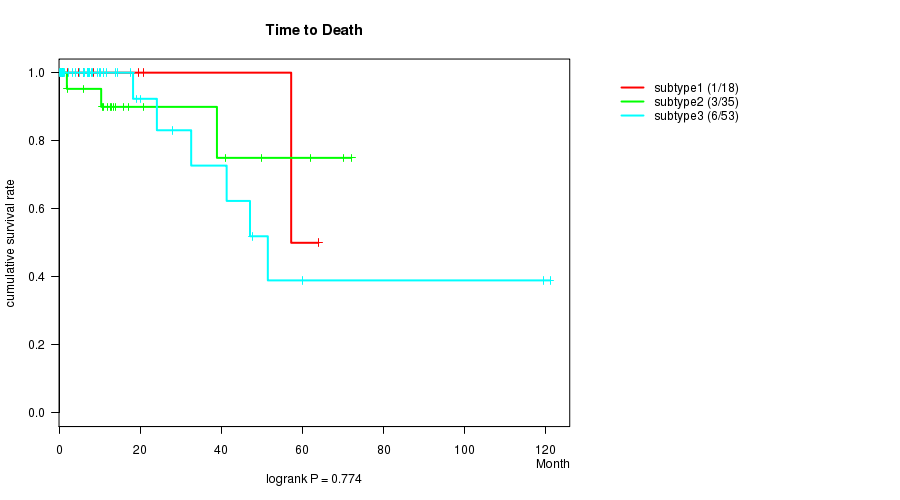
P value = 0.774 (logrank test)
Table S92. Clustering Approach #10: 'MIRseq cHierClus subtypes' versus Clinical Feature #1: 'Time to Death'
| nPatients | nDeath | Duration Range (Median), Month | |
|---|---|---|---|
| ALL | 106 | 10 | 0.2 - 121.1 (7.0) |
| subtype1 | 18 | 1 | 0.2 - 64.0 (3.4) |
| subtype2 | 35 | 3 | 0.9 - 72.1 (10.4) |
| subtype3 | 53 | 6 | 0.2 - 121.1 (7.4) |
Figure S82. Get High-res Image Clustering Approach #10: 'MIRseq cHierClus subtypes' versus Clinical Feature #1: 'Time to Death'
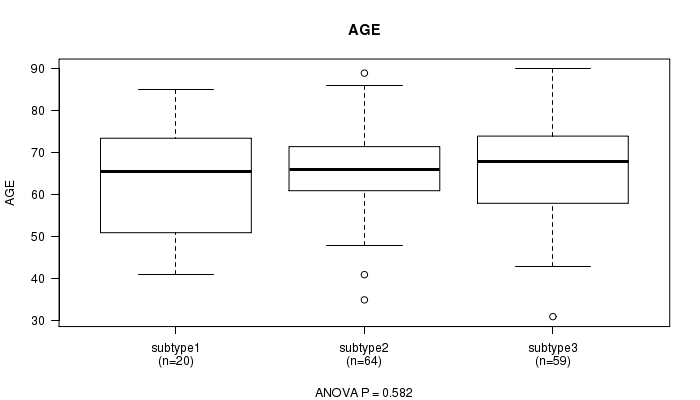
P value = 0.582 (ANOVA)
Table S93. Clustering Approach #10: 'MIRseq cHierClus subtypes' versus Clinical Feature #2: 'AGE'
| nPatients | Mean (Std.Dev) | |
|---|---|---|
| ALL | 143 | 65.4 (11.5) |
| subtype1 | 20 | 62.9 (13.5) |
| subtype2 | 64 | 65.8 (10.4) |
| subtype3 | 59 | 65.8 (12.0) |
Figure S83. Get High-res Image Clustering Approach #10: 'MIRseq cHierClus subtypes' versus Clinical Feature #2: 'AGE'
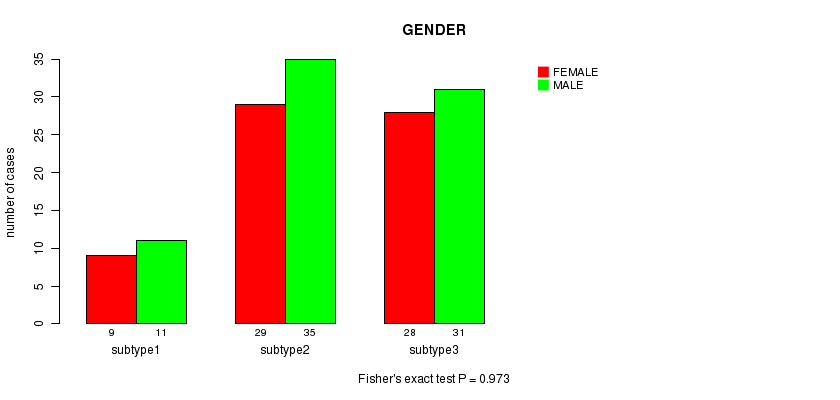
P value = 0.973 (Fisher's exact test)
Table S94. Clustering Approach #10: 'MIRseq cHierClus subtypes' versus Clinical Feature #3: 'GENDER'
| nPatients | FEMALE | MALE |
|---|---|---|
| ALL | 66 | 77 |
| subtype1 | 9 | 11 |
| subtype2 | 29 | 35 |
| subtype3 | 28 | 31 |
Figure S84. Get High-res Image Clustering Approach #10: 'MIRseq cHierClus subtypes' versus Clinical Feature #3: 'GENDER'
P value = 0.037 (Fisher's exact test)
Table S95. Clustering Approach #10: 'MIRseq cHierClus subtypes' versus Clinical Feature #4: 'HISTOLOGICAL.TYPE'
| nPatients | RECTAL ADENOCARCINOMA | RECTAL MUCINOUS ADENOCARCINOMA |
|---|---|---|
| ALL | 127 | 10 |
| subtype1 | 19 | 1 |
| subtype2 | 52 | 8 |
| subtype3 | 56 | 1 |
Figure S85. Get High-res Image Clustering Approach #10: 'MIRseq cHierClus subtypes' versus Clinical Feature #4: 'HISTOLOGICAL.TYPE'
P value = 0.726 (Chi-square test)
Table S96. Clustering Approach #10: 'MIRseq cHierClus subtypes' versus Clinical Feature #5: 'PATHOLOGY.T'
| nPatients | T1 | T2 | T3 | T4 |
|---|---|---|---|---|
| ALL | 9 | 26 | 97 | 10 |
| subtype1 | 1 | 2 | 16 | 1 |
| subtype2 | 5 | 14 | 42 | 3 |
| subtype3 | 3 | 10 | 39 | 6 |
Figure S86. Get High-res Image Clustering Approach #10: 'MIRseq cHierClus subtypes' versus Clinical Feature #5: 'PATHOLOGY.T'
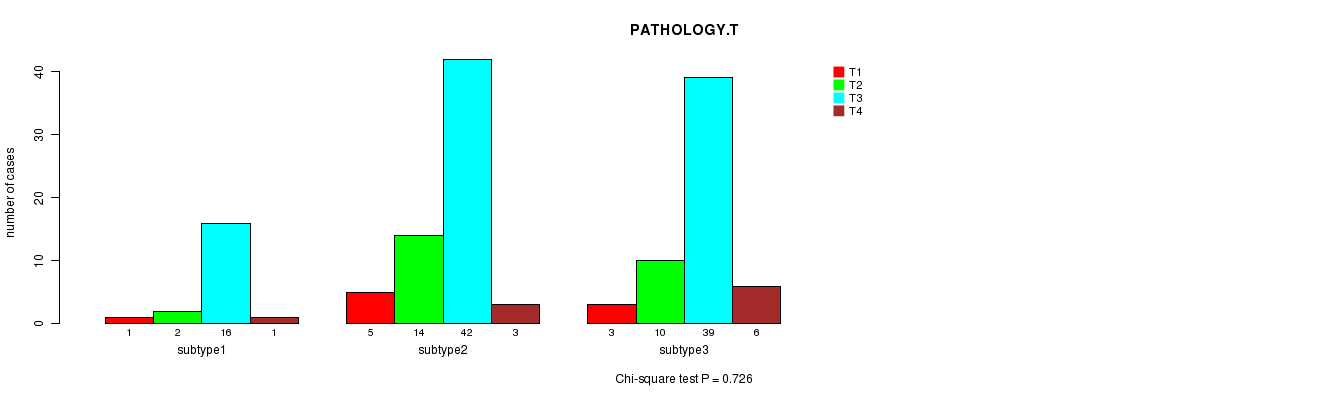
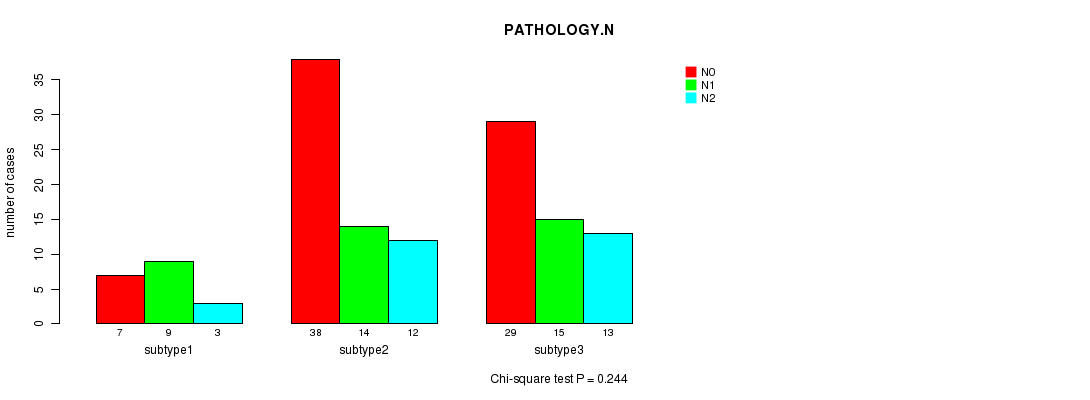
P value = 0.244 (Chi-square test)
Table S97. Clustering Approach #10: 'MIRseq cHierClus subtypes' versus Clinical Feature #6: 'PATHOLOGY.N'
| nPatients | N0 | N1 | N2 |
|---|---|---|---|
| ALL | 74 | 38 | 28 |
| subtype1 | 7 | 9 | 3 |
| subtype2 | 38 | 14 | 12 |
| subtype3 | 29 | 15 | 13 |
Figure S87. Get High-res Image Clustering Approach #10: 'MIRseq cHierClus subtypes' versus Clinical Feature #6: 'PATHOLOGY.N'
P value = 0.000442 (Chi-square test)
Table S98. Clustering Approach #10: 'MIRseq cHierClus subtypes' versus Clinical Feature #7: 'PATHOLOGICSPREAD(M)'
| nPatients | M0 | M1 | M1A | MX |
|---|---|---|---|---|
| ALL | 107 | 18 | 2 | 14 |
| subtype1 | 13 | 5 | 0 | 2 |
| subtype2 | 53 | 11 | 0 | 0 |
| subtype3 | 41 | 2 | 2 | 12 |
Figure S88. Get High-res Image Clustering Approach #10: 'MIRseq cHierClus subtypes' versus Clinical Feature #7: 'PATHOLOGICSPREAD(M)'
P value = 0.361 (Chi-square test)
Table S99. Clustering Approach #10: 'MIRseq cHierClus subtypes' versus Clinical Feature #8: 'TUMOR.STAGE'
| nPatients | I | II | III | IV |
|---|---|---|---|---|
| ALL | 28 | 44 | 43 | 20 |
| subtype1 | 2 | 5 | 7 | 5 |
| subtype2 | 17 | 20 | 16 | 9 |
| subtype3 | 9 | 19 | 20 | 6 |
Figure S89. Get High-res Image Clustering Approach #10: 'MIRseq cHierClus subtypes' versus Clinical Feature #8: 'TUMOR.STAGE'
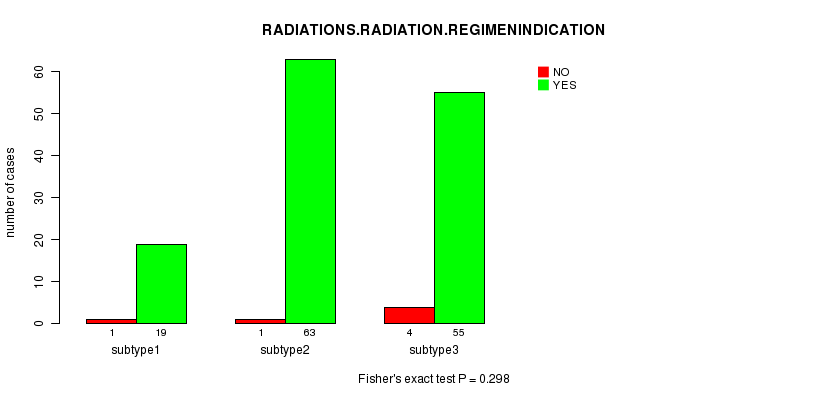
P value = 0.298 (Fisher's exact test)
Table S100. Clustering Approach #10: 'MIRseq cHierClus subtypes' versus Clinical Feature #9: 'RADIATIONS.RADIATION.REGIMENINDICATION'
| nPatients | NO | YES |
|---|---|---|
| ALL | 6 | 137 |
| subtype1 | 1 | 19 |
| subtype2 | 1 | 63 |
| subtype3 | 4 | 55 |
Figure S90. Get High-res Image Clustering Approach #10: 'MIRseq cHierClus subtypes' versus Clinical Feature #9: 'RADIATIONS.RADIATION.REGIMENINDICATION'
-
Cluster data file = READ-TP.mergedcluster.txt
-
Clinical data file = READ-TP.clin.merged.picked.txt
-
Number of patients = 166
-
Number of clustering approaches = 10
-
Number of selected clinical features = 9
-
Exclude small clusters that include fewer than K patients, K = 3
consensus non-negative matrix factorization clustering approach (Brunet et al. 2004)
Resampling-based clustering method (Monti et al. 2003)
For survival clinical features, the Kaplan-Meier survival curves of tumors with and without gene mutations were plotted and the statistical significance P values were estimated by logrank test (Bland and Altman 2004) using the 'survdiff' function in R
For continuous numerical clinical features, one-way analysis of variance (Howell 2002) was applied to compare the clinical values between tumor subtypes using 'anova' function in R
For binary clinical features, two-tailed Fisher's exact tests (Fisher 1922) were used to estimate the P values using the 'fisher.test' function in R
For multi-class clinical features (nominal or ordinal), Chi-square tests (Greenwood and Nikulin 1996) were used to estimate the P values using the 'chisq.test' function in R
This is an experimental feature. The full results of the analysis summarized in this report can be downloaded from the TCGA Data Coordination Center.