This pipeline computes the correlation between cancer subtypes identified by different molecular patterns and selected clinical features.
Testing the association between subtypes identified by 6 different clustering approaches and 9 clinical features across 162 patients, 6 significant findings detected with P value < 0.05.
-
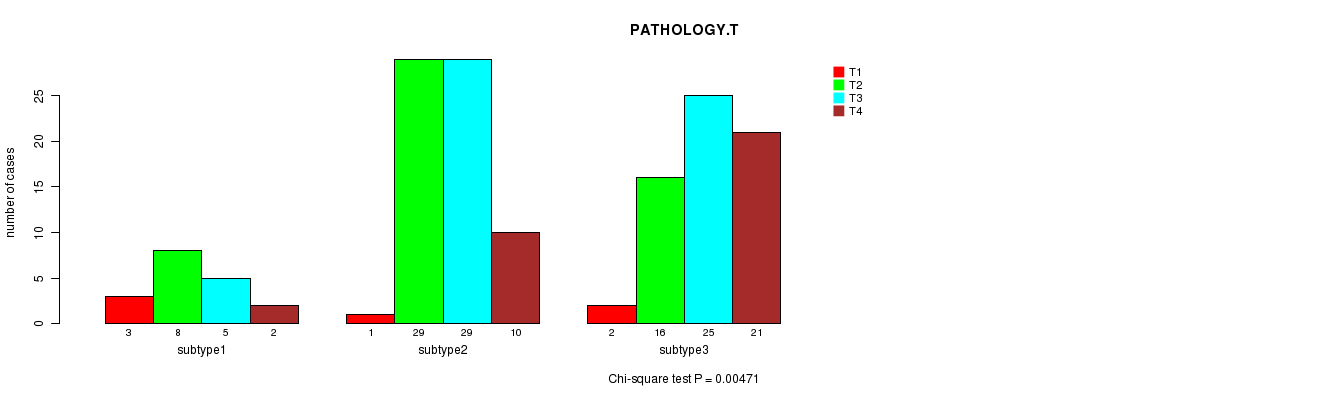
3 subtypes identified in current cancer cohort by 'CN CNMF'. These subtypes correlate to 'GENDER' and 'PATHOLOGY.T'.
-
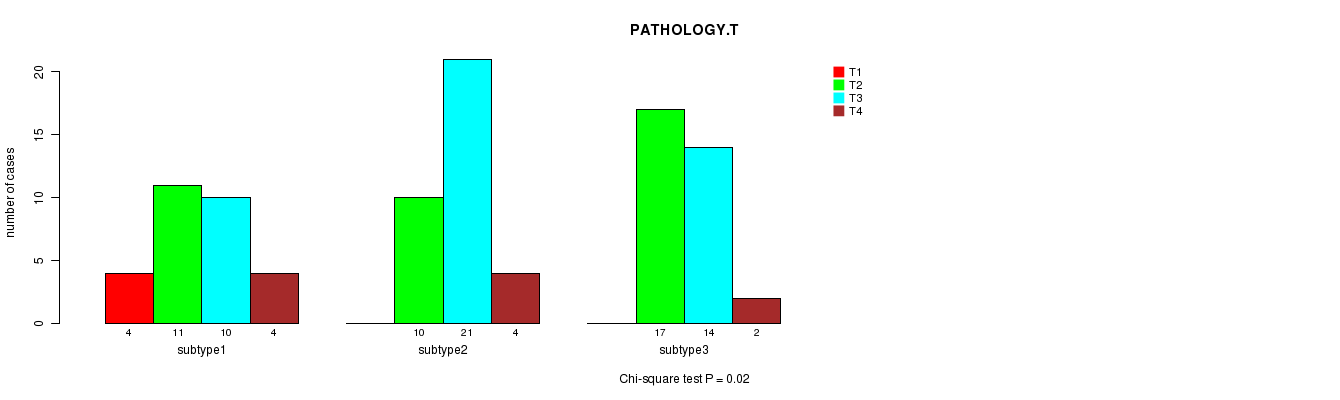
3 subtypes identified in current cancer cohort by 'METHLYATION CNMF'. These subtypes correlate to 'PATHOLOGY.T'.
-
CNMF clustering analysis on sequencing-based mRNA expression data identified 2 subtypes that do not correlate to any clinical features.
-
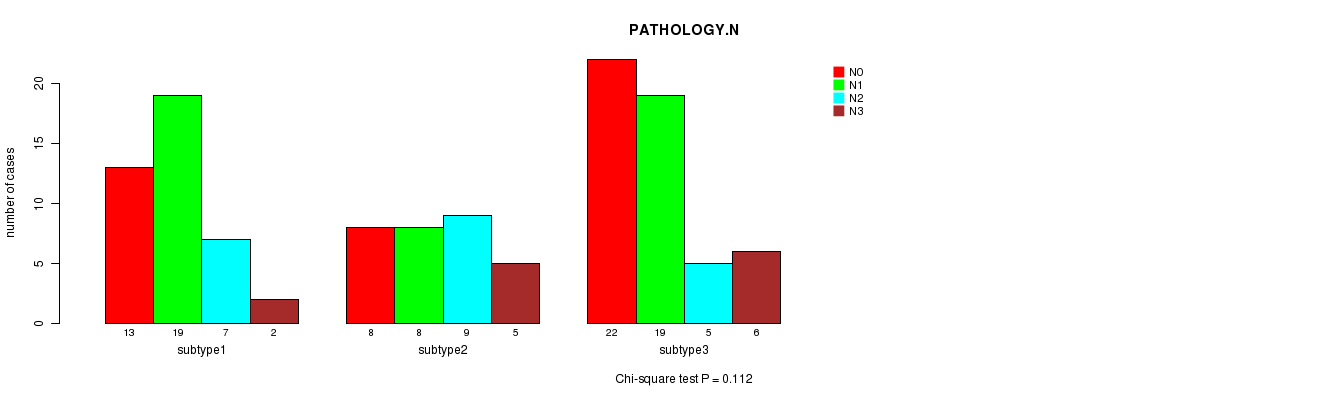
Consensus hierarchical clustering analysis on sequencing-based mRNA expression data identified 3 subtypes that correlate to 'PATHOLOGY.N' and 'TUMOR.STAGE'.
-
CNMF clustering analysis on sequencing-based miR expression data identified 3 subtypes that do not correlate to any clinical features.
-
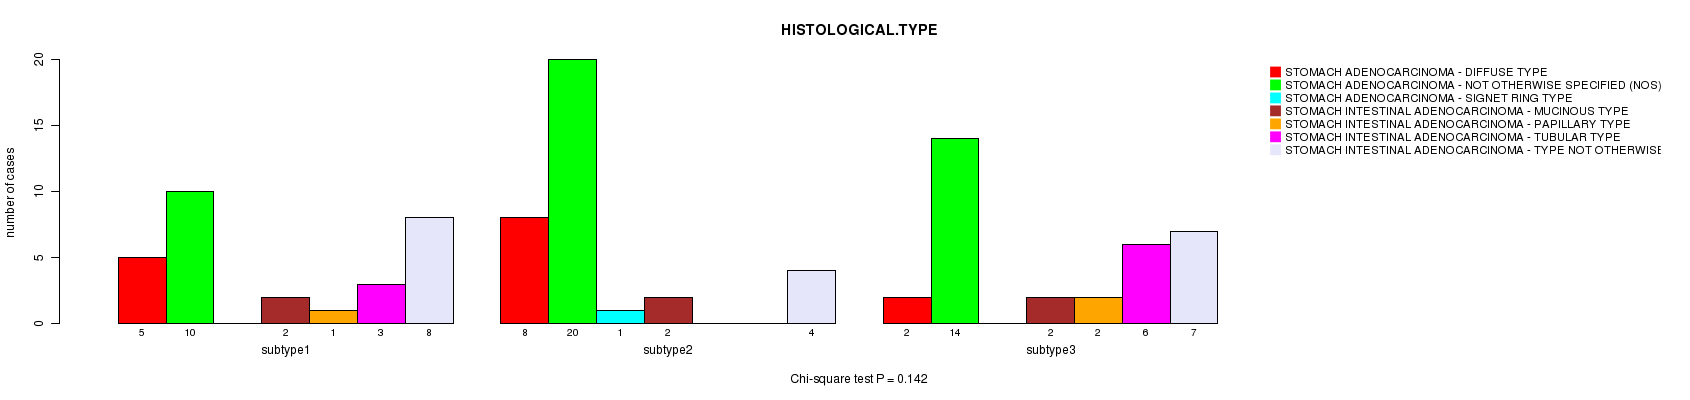
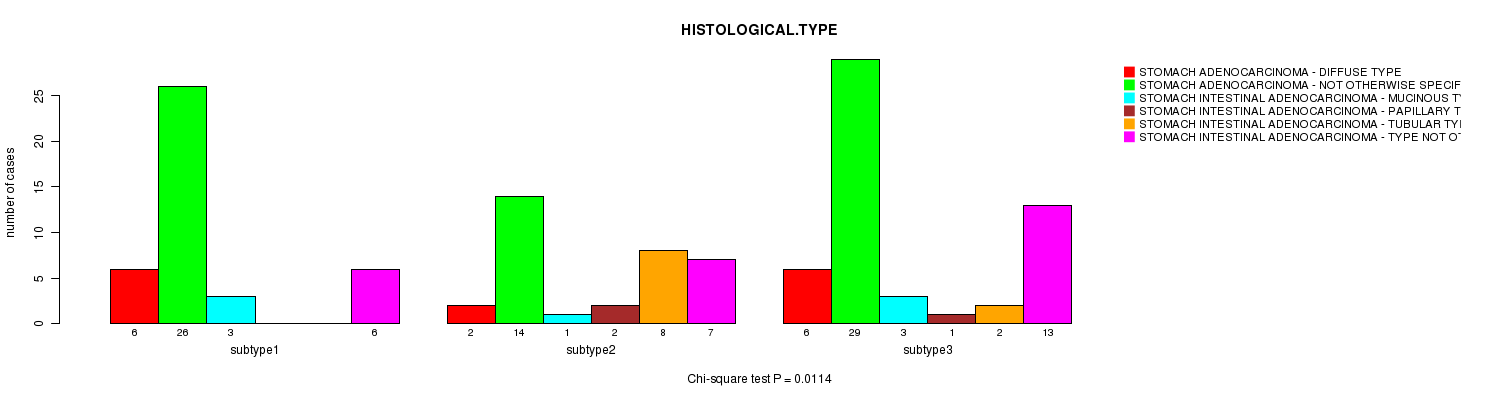
Consensus hierarchical clustering analysis on sequencing-based miR expression data identified 3 subtypes that correlate to 'HISTOLOGICAL.TYPE'.
Table 1. Get Full Table Overview of the association between subtypes identified by 6 different clustering approaches and 9 clinical features. Shown in the table are P values from statistical tests. Thresholded by P value < 0.05, 6 significant findings detected.
|
Clinical Features |
Statistical Tests |
CN CNMF |
METHLYATION CNMF |
RNAseq CNMF subtypes |
RNAseq cHierClus subtypes |
MIRseq CNMF subtypes |
MIRseq cHierClus subtypes |
| Time to Death | logrank test | 0.142 | 0.694 | 0.667 | 0.8 | 0.223 | 0.895 |
| AGE | ANOVA | 0.129 | 0.141 | 0.143 | 0.447 | 0.119 | 0.599 |
| GENDER | Fisher's exact test | 0.0167 | 0.927 | 0.547 | 0.917 | 0.693 | 0.62 |
| HISTOLOGICAL TYPE | Chi-square test | 0.319 | 0.142 | 0.0766 | 0.407 | 0.109 | 0.0114 |
| PATHOLOGY T | Chi-square test | 0.00471 | 0.02 | 0.242 | 0.425 | 0.181 | 0.265 |
| PATHOLOGY N | Chi-square test | 0.765 | 0.658 | 0.174 | 0.0334 | 0.755 | 0.112 |
| PATHOLOGICSPREAD(M) | Chi-square test | 0.186 | 0.361 | 0.327 | 0.474 | 0.48 | 0.691 |
| TUMOR STAGE | Chi-square test | 0.527 | 0.176 | 0.0535 | 0.00304 | 0.246 | 0.295 |
| RADIATIONS RADIATION REGIMENINDICATION | Fisher's exact test | 1 | 0.521 | 0.0701 | 0.213 |
Table S1. Get Full Table Description of clustering approach #1: 'CN CNMF'
| Cluster Labels | 1 | 2 | 3 |
|---|---|---|---|
| Number of samples | 21 | 73 | 67 |
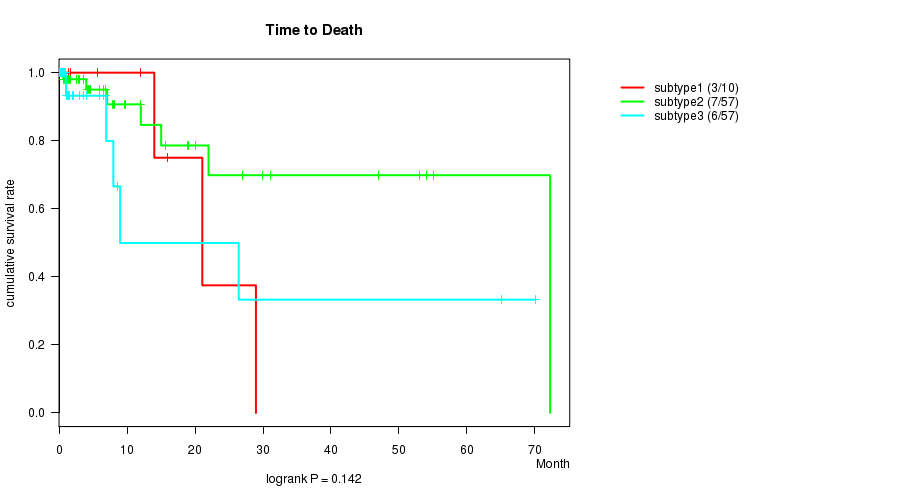
P value = 0.142 (logrank test)
Table S2. Clustering Approach #1: 'CN CNMF' versus Clinical Feature #1: 'Time to Death'
| nPatients | nDeath | Duration Range (Median), Month | |
|---|---|---|---|
| ALL | 124 | 16 | 0.1 - 72.2 (1.5) |
| subtype1 | 10 | 3 | 0.9 - 29.0 (8.8) |
| subtype2 | 57 | 7 | 0.1 - 72.2 (4.3) |
| subtype3 | 57 | 6 | 0.1 - 70.1 (1.0) |
Figure S1. Get High-res Image Clustering Approach #1: 'CN CNMF' versus Clinical Feature #1: 'Time to Death'
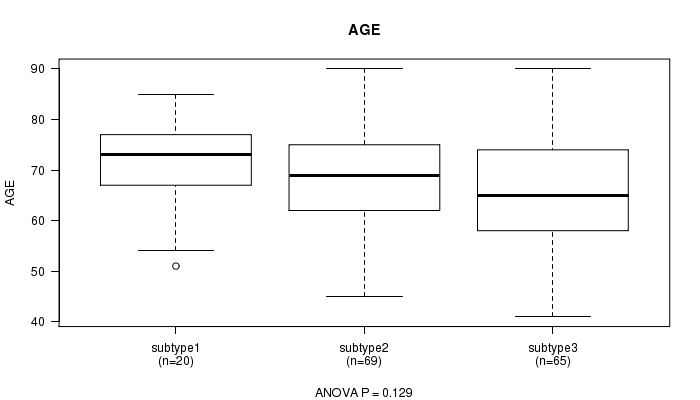
P value = 0.129 (ANOVA)
Table S3. Clustering Approach #1: 'CN CNMF' versus Clinical Feature #2: 'AGE'
| nPatients | Mean (Std.Dev) | |
|---|---|---|
| ALL | 154 | 67.7 (10.6) |
| subtype1 | 20 | 71.5 (9.1) |
| subtype2 | 69 | 68.2 (9.9) |
| subtype3 | 65 | 66.1 (11.5) |
Figure S2. Get High-res Image Clustering Approach #1: 'CN CNMF' versus Clinical Feature #2: 'AGE'
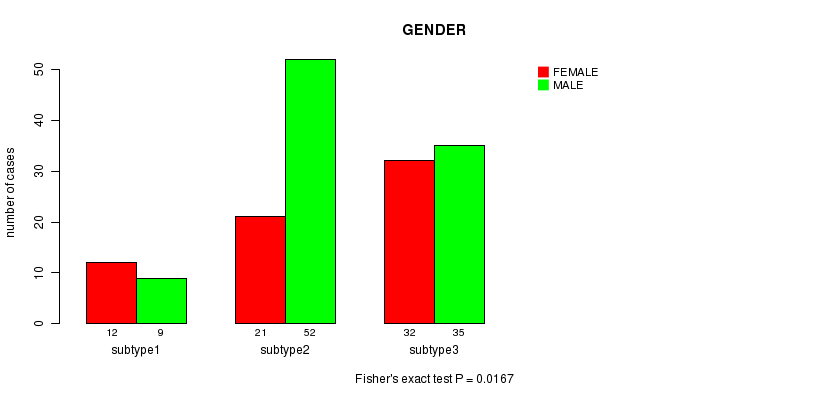
P value = 0.0167 (Fisher's exact test)
Table S4. Clustering Approach #1: 'CN CNMF' versus Clinical Feature #3: 'GENDER'
| nPatients | FEMALE | MALE |
|---|---|---|
| ALL | 65 | 96 |
| subtype1 | 12 | 9 |
| subtype2 | 21 | 52 |
| subtype3 | 32 | 35 |
Figure S3. Get High-res Image Clustering Approach #1: 'CN CNMF' versus Clinical Feature #3: 'GENDER'
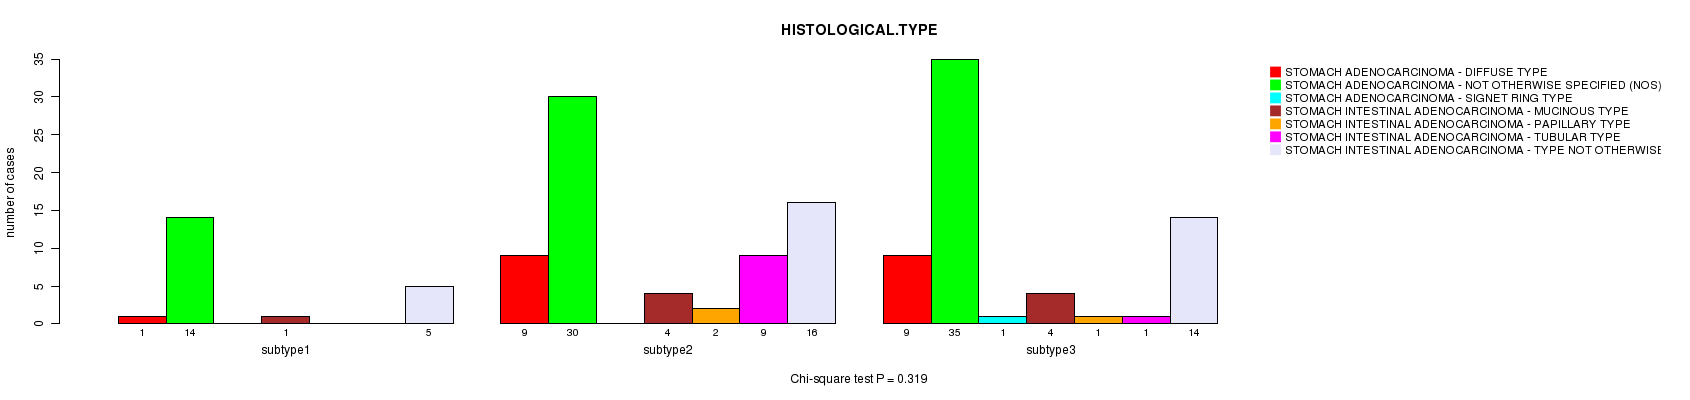
P value = 0.319 (Chi-square test)
Table S5. Clustering Approach #1: 'CN CNMF' versus Clinical Feature #4: 'HISTOLOGICAL.TYPE'
| nPatients | STOMACH ADENOCARCINOMA - DIFFUSE TYPE | STOMACH ADENOCARCINOMA - NOT OTHERWISE SPECIFIED (NOS) | STOMACH ADENOCARCINOMA - SIGNET RING TYPE | STOMACH INTESTINAL ADENOCARCINOMA - MUCINOUS TYPE | STOMACH INTESTINAL ADENOCARCINOMA - PAPILLARY TYPE | STOMACH INTESTINAL ADENOCARCINOMA - TUBULAR TYPE | STOMACH INTESTINAL ADENOCARCINOMA - TYPE NOT OTHERWISE SPECIFIED (NOS) |
|---|---|---|---|---|---|---|---|
| ALL | 19 | 79 | 1 | 9 | 3 | 10 | 35 |
| subtype1 | 1 | 14 | 0 | 1 | 0 | 0 | 5 |
| subtype2 | 9 | 30 | 0 | 4 | 2 | 9 | 16 |
| subtype3 | 9 | 35 | 1 | 4 | 1 | 1 | 14 |
Figure S4. Get High-res Image Clustering Approach #1: 'CN CNMF' versus Clinical Feature #4: 'HISTOLOGICAL.TYPE'
P value = 0.00471 (Chi-square test)
Table S6. Clustering Approach #1: 'CN CNMF' versus Clinical Feature #5: 'PATHOLOGY.T'
| nPatients | T1 | T2 | T3 | T4 |
|---|---|---|---|---|
| ALL | 6 | 53 | 59 | 33 |
| subtype1 | 3 | 8 | 5 | 2 |
| subtype2 | 1 | 29 | 29 | 10 |
| subtype3 | 2 | 16 | 25 | 21 |
Figure S5. Get High-res Image Clustering Approach #1: 'CN CNMF' versus Clinical Feature #5: 'PATHOLOGY.T'
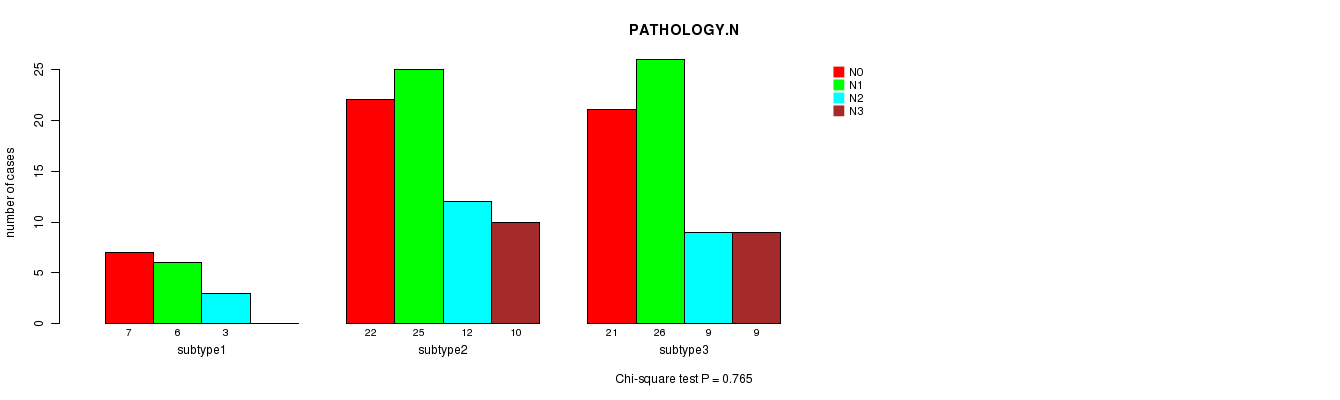
P value = 0.765 (Chi-square test)
Table S7. Clustering Approach #1: 'CN CNMF' versus Clinical Feature #6: 'PATHOLOGY.N'
| nPatients | N0 | N1 | N2 | N3 |
|---|---|---|---|---|
| ALL | 50 | 57 | 24 | 19 |
| subtype1 | 7 | 6 | 3 | 0 |
| subtype2 | 22 | 25 | 12 | 10 |
| subtype3 | 21 | 26 | 9 | 9 |
Figure S6. Get High-res Image Clustering Approach #1: 'CN CNMF' versus Clinical Feature #6: 'PATHOLOGY.N'
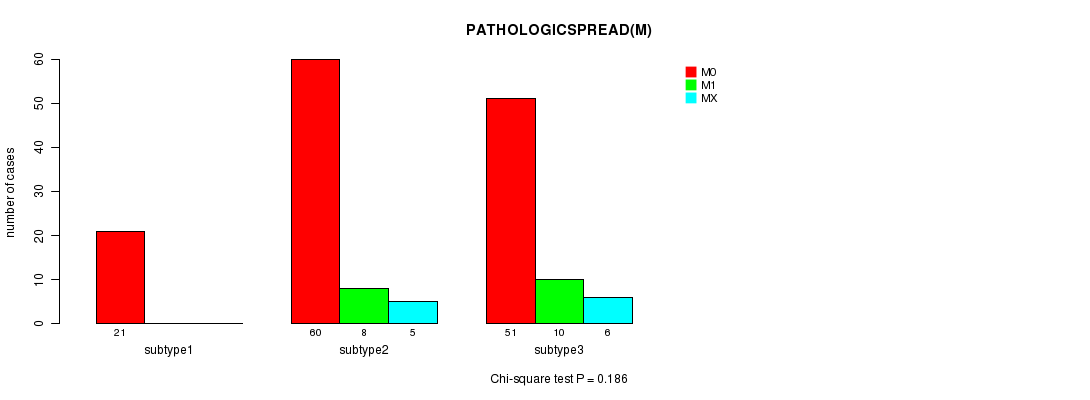
P value = 0.186 (Chi-square test)
Table S8. Clustering Approach #1: 'CN CNMF' versus Clinical Feature #7: 'PATHOLOGICSPREAD(M)'
| nPatients | M0 | M1 | MX |
|---|---|---|---|
| ALL | 132 | 18 | 11 |
| subtype1 | 21 | 0 | 0 |
| subtype2 | 60 | 8 | 5 |
| subtype3 | 51 | 10 | 6 |
Figure S7. Get High-res Image Clustering Approach #1: 'CN CNMF' versus Clinical Feature #7: 'PATHOLOGICSPREAD(M)'
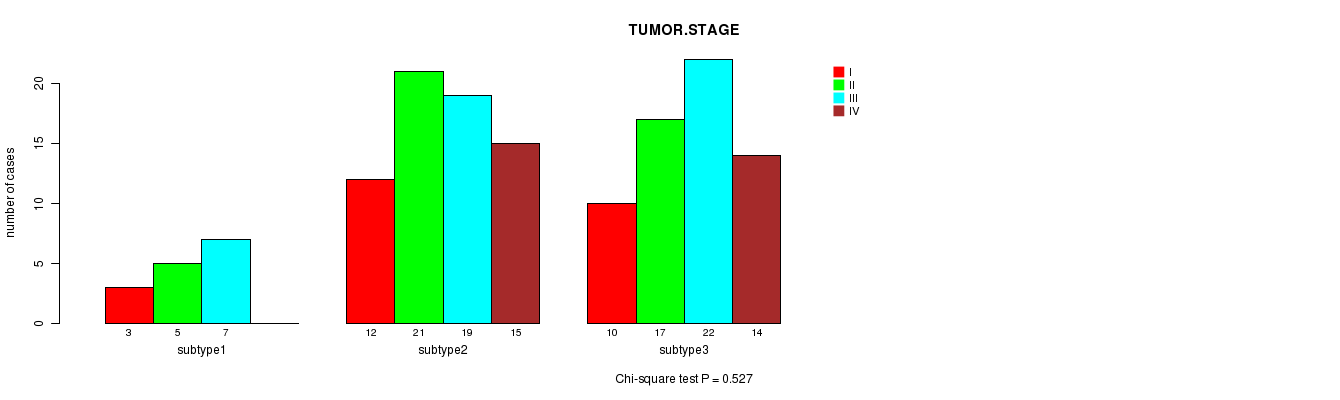
P value = 0.527 (Chi-square test)
Table S9. Clustering Approach #1: 'CN CNMF' versus Clinical Feature #8: 'TUMOR.STAGE'
| nPatients | I | II | III | IV |
|---|---|---|---|---|
| ALL | 25 | 43 | 48 | 29 |
| subtype1 | 3 | 5 | 7 | 0 |
| subtype2 | 12 | 21 | 19 | 15 |
| subtype3 | 10 | 17 | 22 | 14 |
Figure S8. Get High-res Image Clustering Approach #1: 'CN CNMF' versus Clinical Feature #8: 'TUMOR.STAGE'
P value = 1 (Fisher's exact test)
Table S10. Clustering Approach #1: 'CN CNMF' versus Clinical Feature #9: 'RADIATIONS.RADIATION.REGIMENINDICATION'
| nPatients | NO | YES |
|---|---|---|
| ALL | 5 | 156 |
| subtype1 | 0 | 21 |
| subtype2 | 3 | 70 |
| subtype3 | 2 | 65 |
Figure S9. Get High-res Image Clustering Approach #1: 'CN CNMF' versus Clinical Feature #9: 'RADIATIONS.RADIATION.REGIMENINDICATION'
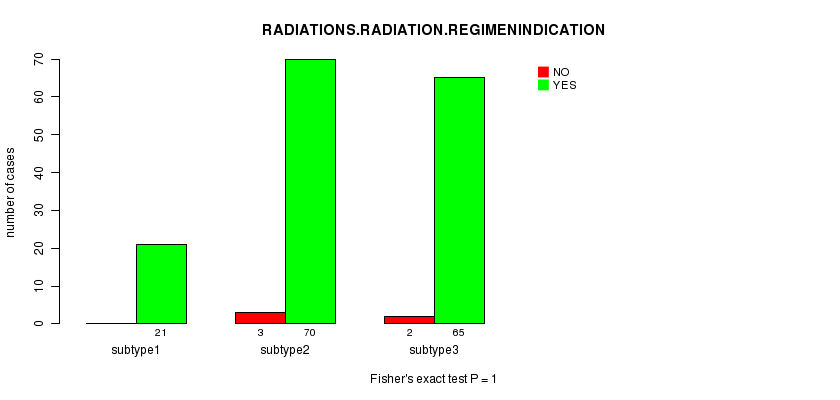
Table S11. Get Full Table Description of clustering approach #2: 'METHLYATION CNMF'
| Cluster Labels | 1 | 2 | 3 |
|---|---|---|---|
| Number of samples | 29 | 35 | 33 |
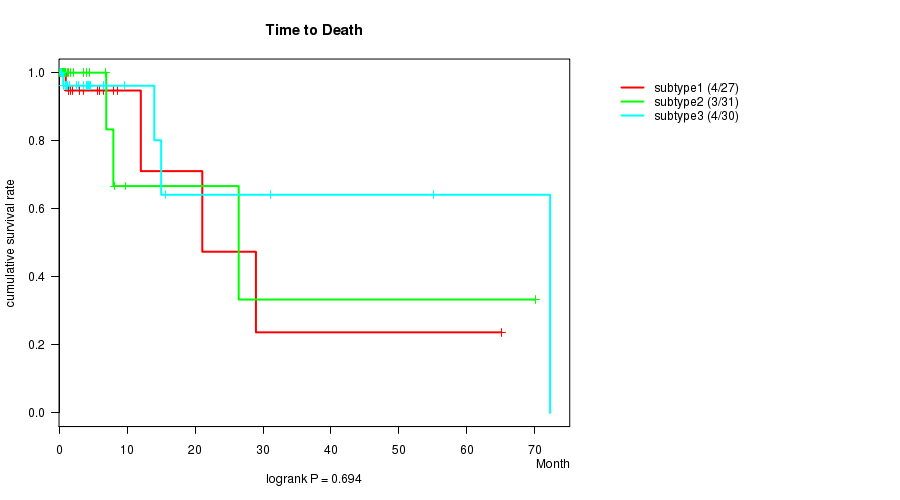
P value = 0.694 (logrank test)
Table S12. Clustering Approach #2: 'METHLYATION CNMF' versus Clinical Feature #1: 'Time to Death'
| nPatients | nDeath | Duration Range (Median), Month | |
|---|---|---|---|
| ALL | 88 | 11 | 0.1 - 72.2 (1.6) |
| subtype1 | 27 | 4 | 0.1 - 65.1 (1.7) |
| subtype2 | 31 | 3 | 0.1 - 70.1 (1.2) |
| subtype3 | 30 | 4 | 0.2 - 72.2 (3.3) |
Figure S10. Get High-res Image Clustering Approach #2: 'METHLYATION CNMF' versus Clinical Feature #1: 'Time to Death'
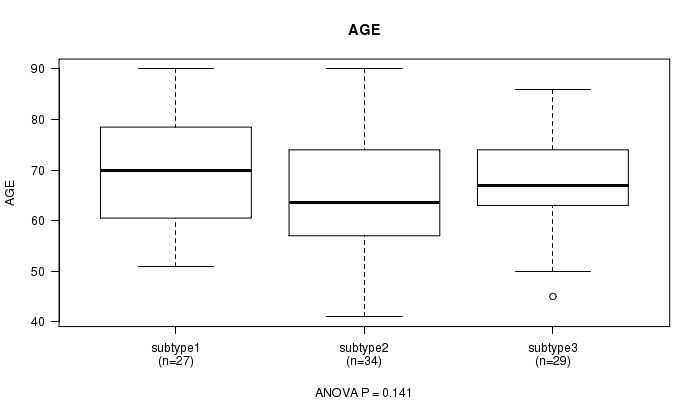
P value = 0.141 (ANOVA)
Table S13. Clustering Approach #2: 'METHLYATION CNMF' versus Clinical Feature #2: 'AGE'
| nPatients | Mean (Std.Dev) | |
|---|---|---|
| ALL | 90 | 67.3 (10.9) |
| subtype1 | 27 | 70.0 (10.9) |
| subtype2 | 34 | 64.5 (11.6) |
| subtype3 | 29 | 68.0 (9.5) |
Figure S11. Get High-res Image Clustering Approach #2: 'METHLYATION CNMF' versus Clinical Feature #2: 'AGE'
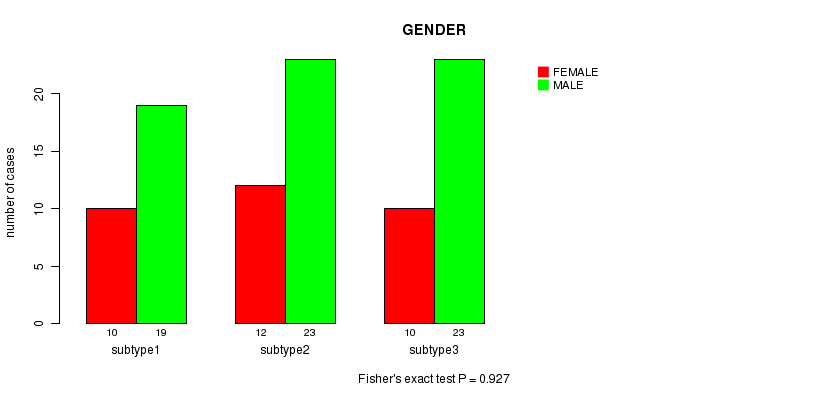
P value = 0.927 (Fisher's exact test)
Table S14. Clustering Approach #2: 'METHLYATION CNMF' versus Clinical Feature #3: 'GENDER'
| nPatients | FEMALE | MALE |
|---|---|---|
| ALL | 32 | 65 |
| subtype1 | 10 | 19 |
| subtype2 | 12 | 23 |
| subtype3 | 10 | 23 |
Figure S12. Get High-res Image Clustering Approach #2: 'METHLYATION CNMF' versus Clinical Feature #3: 'GENDER'
P value = 0.142 (Chi-square test)
Table S15. Clustering Approach #2: 'METHLYATION CNMF' versus Clinical Feature #4: 'HISTOLOGICAL.TYPE'
| nPatients | STOMACH ADENOCARCINOMA - DIFFUSE TYPE | STOMACH ADENOCARCINOMA - NOT OTHERWISE SPECIFIED (NOS) | STOMACH ADENOCARCINOMA - SIGNET RING TYPE | STOMACH INTESTINAL ADENOCARCINOMA - MUCINOUS TYPE | STOMACH INTESTINAL ADENOCARCINOMA - PAPILLARY TYPE | STOMACH INTESTINAL ADENOCARCINOMA - TUBULAR TYPE | STOMACH INTESTINAL ADENOCARCINOMA - TYPE NOT OTHERWISE SPECIFIED (NOS) |
|---|---|---|---|---|---|---|---|
| ALL | 15 | 44 | 1 | 6 | 3 | 9 | 19 |
| subtype1 | 5 | 10 | 0 | 2 | 1 | 3 | 8 |
| subtype2 | 8 | 20 | 1 | 2 | 0 | 0 | 4 |
| subtype3 | 2 | 14 | 0 | 2 | 2 | 6 | 7 |
Figure S13. Get High-res Image Clustering Approach #2: 'METHLYATION CNMF' versus Clinical Feature #4: 'HISTOLOGICAL.TYPE'
P value = 0.02 (Chi-square test)
Table S16. Clustering Approach #2: 'METHLYATION CNMF' versus Clinical Feature #5: 'PATHOLOGY.T'
| nPatients | T1 | T2 | T3 | T4 |
|---|---|---|---|---|
| ALL | 4 | 38 | 45 | 10 |
| subtype1 | 4 | 11 | 10 | 4 |
| subtype2 | 0 | 10 | 21 | 4 |
| subtype3 | 0 | 17 | 14 | 2 |
Figure S14. Get High-res Image Clustering Approach #2: 'METHLYATION CNMF' versus Clinical Feature #5: 'PATHOLOGY.T'
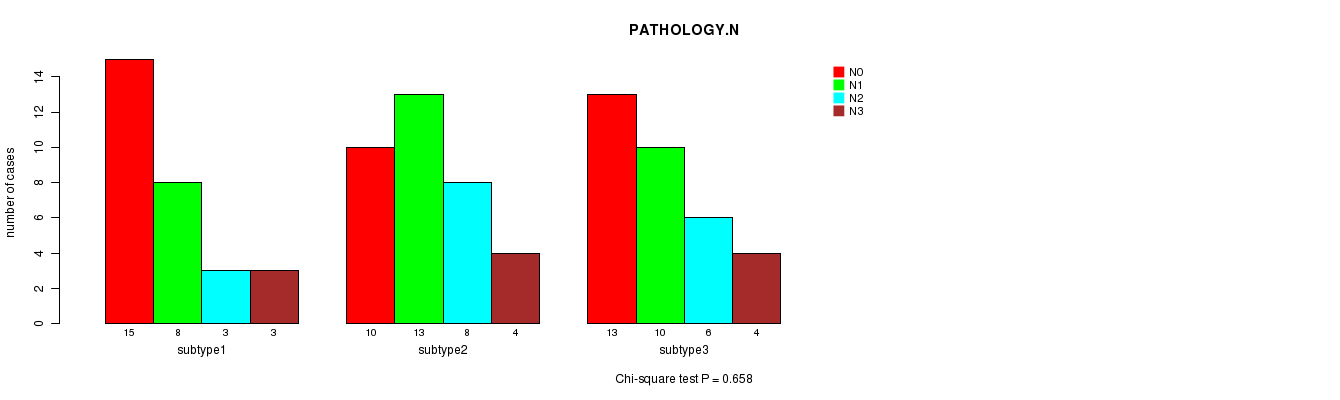
P value = 0.658 (Chi-square test)
Table S17. Clustering Approach #2: 'METHLYATION CNMF' versus Clinical Feature #6: 'PATHOLOGY.N'
| nPatients | N0 | N1 | N2 | N3 |
|---|---|---|---|---|
| ALL | 38 | 31 | 17 | 11 |
| subtype1 | 15 | 8 | 3 | 3 |
| subtype2 | 10 | 13 | 8 | 4 |
| subtype3 | 13 | 10 | 6 | 4 |
Figure S15. Get High-res Image Clustering Approach #2: 'METHLYATION CNMF' versus Clinical Feature #6: 'PATHOLOGY.N'
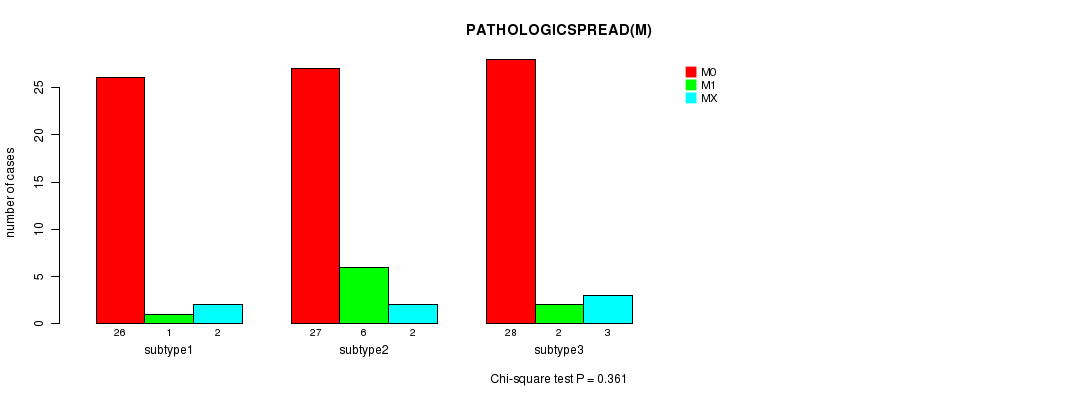
P value = 0.361 (Chi-square test)
Table S18. Clustering Approach #2: 'METHLYATION CNMF' versus Clinical Feature #7: 'PATHOLOGICSPREAD(M)'
| nPatients | M0 | M1 | MX |
|---|---|---|---|
| ALL | 81 | 9 | 7 |
| subtype1 | 26 | 1 | 2 |
| subtype2 | 27 | 6 | 2 |
| subtype3 | 28 | 2 | 3 |
Figure S16. Get High-res Image Clustering Approach #2: 'METHLYATION CNMF' versus Clinical Feature #7: 'PATHOLOGICSPREAD(M)'
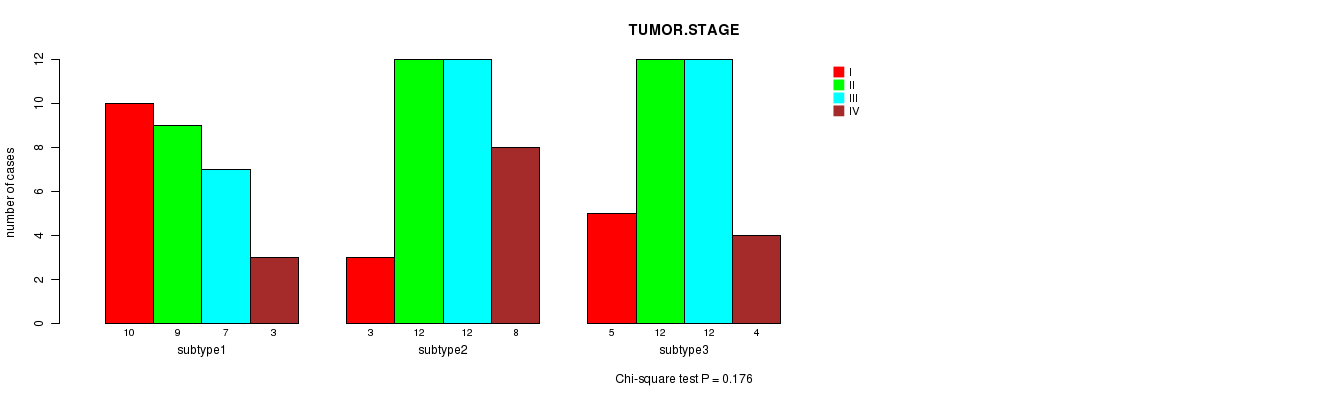
P value = 0.176 (Chi-square test)
Table S19. Clustering Approach #2: 'METHLYATION CNMF' versus Clinical Feature #8: 'TUMOR.STAGE'
| nPatients | I | II | III | IV |
|---|---|---|---|---|
| ALL | 18 | 33 | 31 | 15 |
| subtype1 | 10 | 9 | 7 | 3 |
| subtype2 | 3 | 12 | 12 | 8 |
| subtype3 | 5 | 12 | 12 | 4 |
Figure S17. Get High-res Image Clustering Approach #2: 'METHLYATION CNMF' versus Clinical Feature #8: 'TUMOR.STAGE'
P value = 0.521 (Fisher's exact test)
Table S20. Clustering Approach #2: 'METHLYATION CNMF' versus Clinical Feature #9: 'RADIATIONS.RADIATION.REGIMENINDICATION'
| nPatients | NO | YES |
|---|---|---|
| ALL | 5 | 92 |
| subtype1 | 1 | 28 |
| subtype2 | 1 | 34 |
| subtype3 | 3 | 30 |
Figure S18. Get High-res Image Clustering Approach #2: 'METHLYATION CNMF' versus Clinical Feature #9: 'RADIATIONS.RADIATION.REGIMENINDICATION'
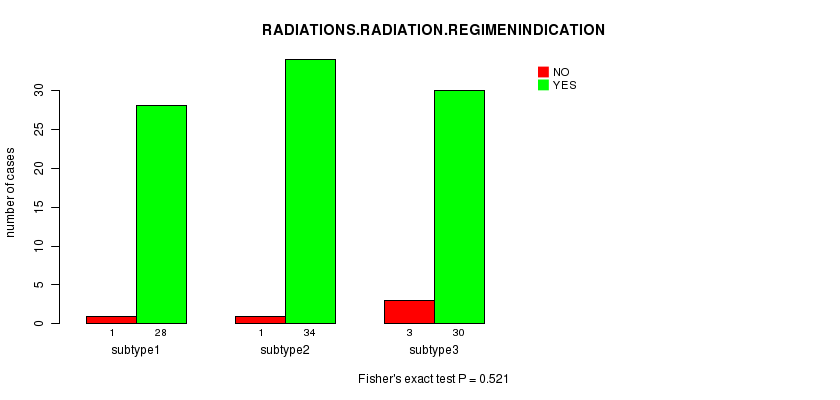
Table S21. Get Full Table Description of clustering approach #3: 'RNAseq CNMF subtypes'
| Cluster Labels | 1 | 2 |
|---|---|---|
| Number of samples | 22 | 21 |
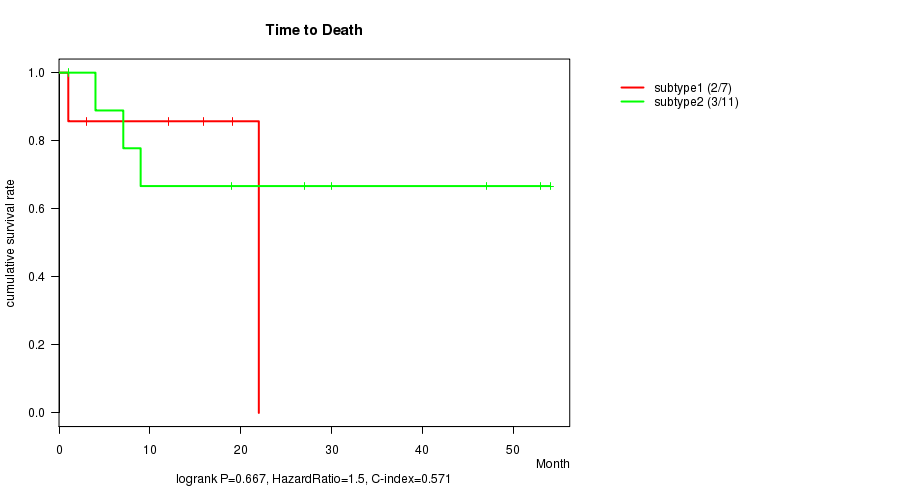
P value = 0.667 (logrank test)
Table S22. Clustering Approach #3: 'RNAseq CNMF subtypes' versus Clinical Feature #1: 'Time to Death'
| nPatients | nDeath | Duration Range (Median), Month | |
|---|---|---|---|
| ALL | 18 | 5 | 1.0 - 54.0 (14.0) |
| subtype1 | 7 | 2 | 1.0 - 22.0 (12.0) |
| subtype2 | 11 | 3 | 1.0 - 54.0 (18.9) |
Figure S19. Get High-res Image Clustering Approach #3: 'RNAseq CNMF subtypes' versus Clinical Feature #1: 'Time to Death'
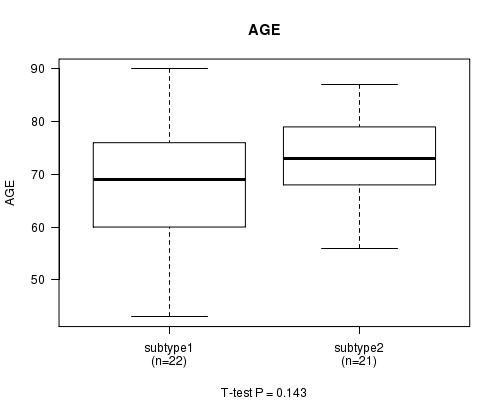
P value = 0.143 (t-test)
Table S23. Clustering Approach #3: 'RNAseq CNMF subtypes' versus Clinical Feature #2: 'AGE'
| nPatients | Mean (Std.Dev) | |
|---|---|---|
| ALL | 43 | 70.4 (10.5) |
| subtype1 | 22 | 68.1 (11.6) |
| subtype2 | 21 | 72.8 (8.8) |
Figure S20. Get High-res Image Clustering Approach #3: 'RNAseq CNMF subtypes' versus Clinical Feature #2: 'AGE'
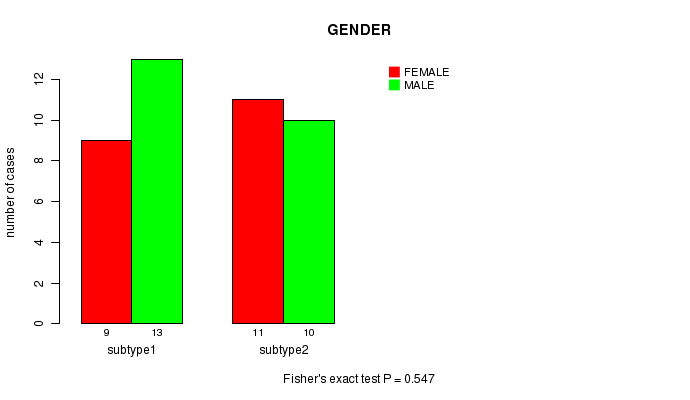
P value = 0.547 (Fisher's exact test)
Table S24. Clustering Approach #3: 'RNAseq CNMF subtypes' versus Clinical Feature #3: 'GENDER'
| nPatients | FEMALE | MALE |
|---|---|---|
| ALL | 20 | 23 |
| subtype1 | 9 | 13 |
| subtype2 | 11 | 10 |
Figure S21. Get High-res Image Clustering Approach #3: 'RNAseq CNMF subtypes' versus Clinical Feature #3: 'GENDER'
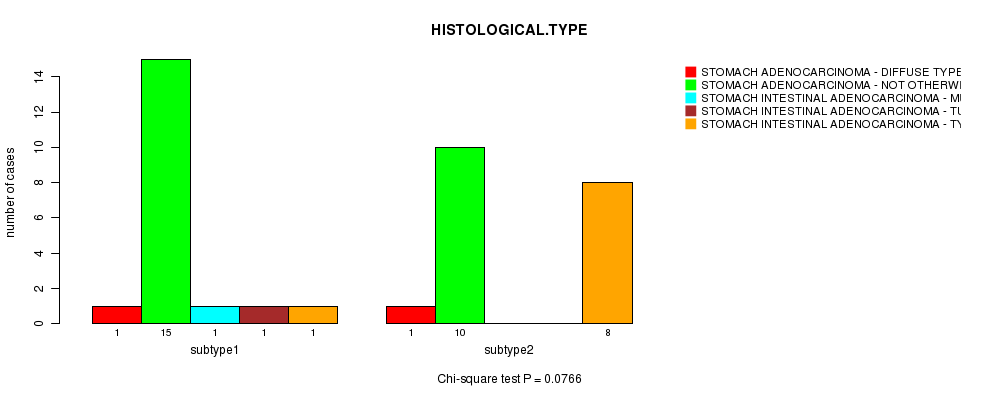
P value = 0.0766 (Chi-square test)
Table S25. Clustering Approach #3: 'RNAseq CNMF subtypes' versus Clinical Feature #4: 'HISTOLOGICAL.TYPE'
| nPatients | STOMACH ADENOCARCINOMA - DIFFUSE TYPE | STOMACH ADENOCARCINOMA - NOT OTHERWISE SPECIFIED (NOS) | STOMACH INTESTINAL ADENOCARCINOMA - MUCINOUS TYPE | STOMACH INTESTINAL ADENOCARCINOMA - TUBULAR TYPE | STOMACH INTESTINAL ADENOCARCINOMA - TYPE NOT OTHERWISE SPECIFIED (NOS) |
|---|---|---|---|---|---|
| ALL | 2 | 25 | 1 | 1 | 9 |
| subtype1 | 1 | 15 | 1 | 1 | 1 |
| subtype2 | 1 | 10 | 0 | 0 | 8 |
Figure S22. Get High-res Image Clustering Approach #3: 'RNAseq CNMF subtypes' versus Clinical Feature #4: 'HISTOLOGICAL.TYPE'
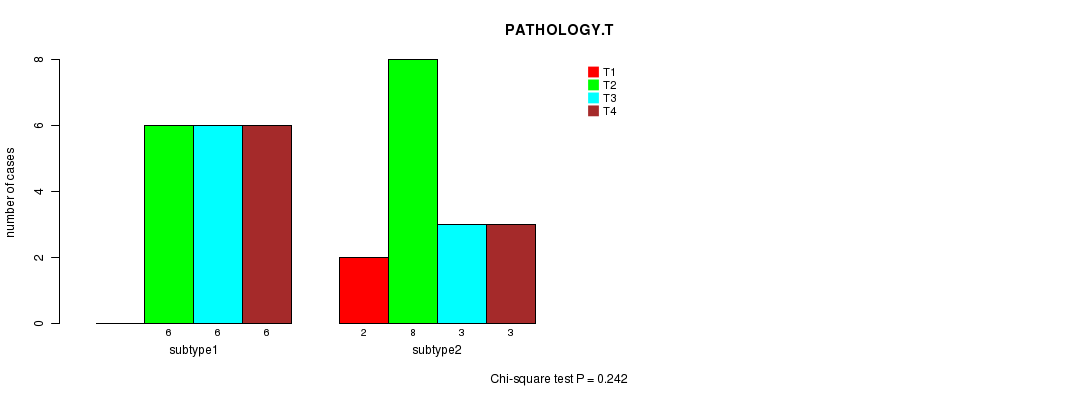
P value = 0.242 (Chi-square test)
Table S26. Clustering Approach #3: 'RNAseq CNMF subtypes' versus Clinical Feature #5: 'PATHOLOGY.T'
| nPatients | T1 | T2 | T3 | T4 |
|---|---|---|---|---|
| ALL | 2 | 14 | 9 | 9 |
| subtype1 | 0 | 6 | 6 | 6 |
| subtype2 | 2 | 8 | 3 | 3 |
Figure S23. Get High-res Image Clustering Approach #3: 'RNAseq CNMF subtypes' versus Clinical Feature #5: 'PATHOLOGY.T'
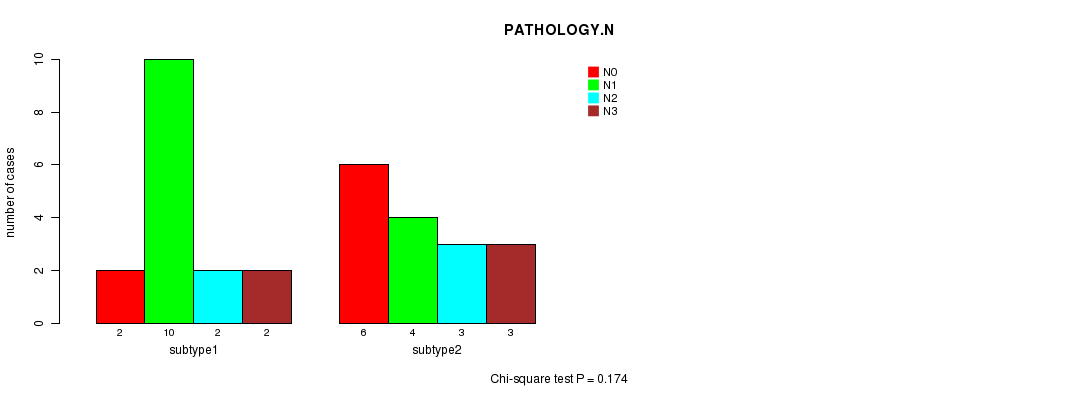
P value = 0.174 (Chi-square test)
Table S27. Clustering Approach #3: 'RNAseq CNMF subtypes' versus Clinical Feature #6: 'PATHOLOGY.N'
| nPatients | N0 | N1 | N2 | N3 |
|---|---|---|---|---|
| ALL | 8 | 14 | 5 | 5 |
| subtype1 | 2 | 10 | 2 | 2 |
| subtype2 | 6 | 4 | 3 | 3 |
Figure S24. Get High-res Image Clustering Approach #3: 'RNAseq CNMF subtypes' versus Clinical Feature #6: 'PATHOLOGY.N'
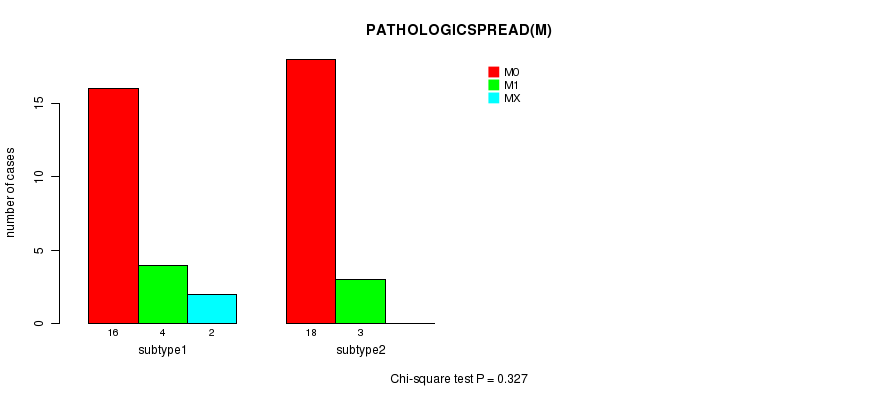
P value = 0.327 (Chi-square test)
Table S28. Clustering Approach #3: 'RNAseq CNMF subtypes' versus Clinical Feature #7: 'PATHOLOGICSPREAD(M)'
| nPatients | M0 | M1 | MX |
|---|---|---|---|
| ALL | 34 | 7 | 2 |
| subtype1 | 16 | 4 | 2 |
| subtype2 | 18 | 3 | 0 |
Figure S25. Get High-res Image Clustering Approach #3: 'RNAseq CNMF subtypes' versus Clinical Feature #7: 'PATHOLOGICSPREAD(M)'
P value = 0.0535 (Chi-square test)
Table S29. Clustering Approach #3: 'RNAseq CNMF subtypes' versus Clinical Feature #8: 'TUMOR.STAGE'
| nPatients | I | II | III | IV |
|---|---|---|---|---|
| ALL | 7 | 4 | 6 | 11 |
| subtype1 | 1 | 4 | 3 | 6 |
| subtype2 | 6 | 0 | 3 | 5 |
Figure S26. Get High-res Image Clustering Approach #3: 'RNAseq CNMF subtypes' versus Clinical Feature #8: 'TUMOR.STAGE'
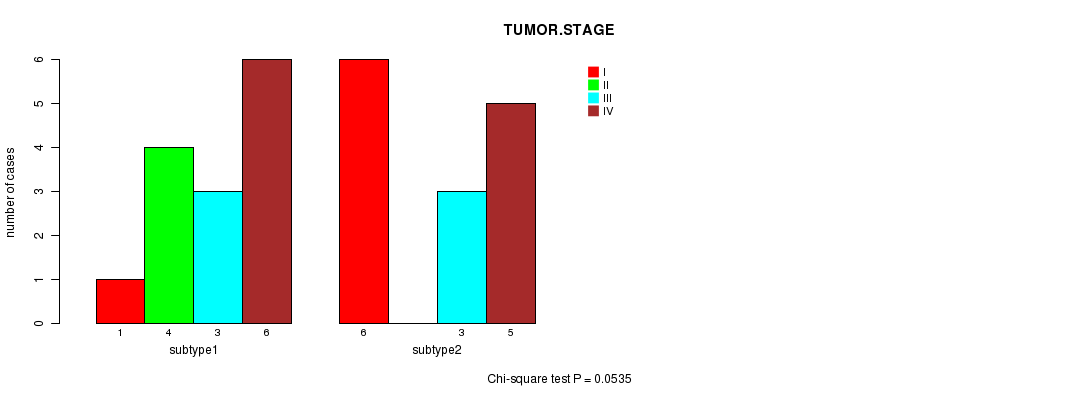
Table S30. Get Full Table Description of clustering approach #4: 'RNAseq cHierClus subtypes'
| Cluster Labels | 1 | 2 | 3 |
|---|---|---|---|
| Number of samples | 15 | 7 | 21 |
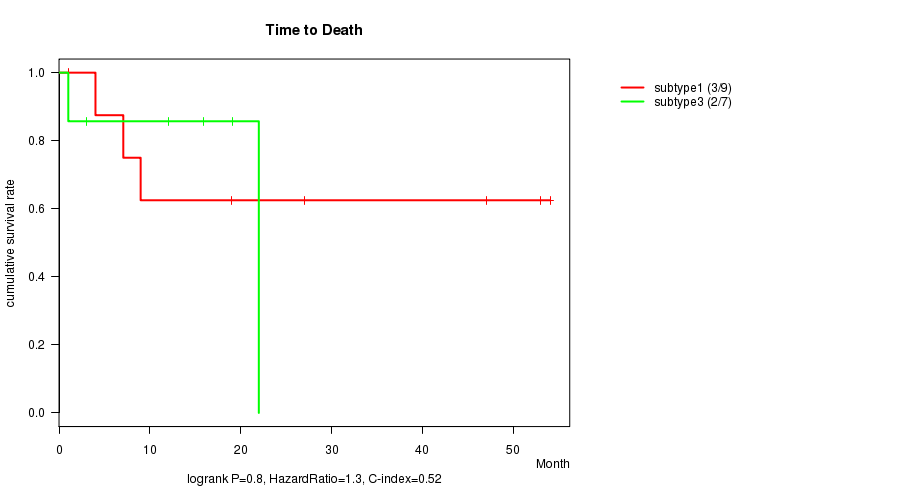
P value = 0.8 (logrank test)
Table S31. Clustering Approach #4: 'RNAseq cHierClus subtypes' versus Clinical Feature #1: 'Time to Death'
| nPatients | nDeath | Duration Range (Median), Month | |
|---|---|---|---|
| ALL | 18 | 5 | 1.0 - 54.0 (14.0) |
| subtype1 | 9 | 3 | 1.0 - 54.0 (18.9) |
| subtype2 | 2 | 0 | 1.0 - 30.0 (15.5) |
| subtype3 | 7 | 2 | 1.0 - 22.0 (12.0) |
Figure S27. Get High-res Image Clustering Approach #4: 'RNAseq cHierClus subtypes' versus Clinical Feature #1: 'Time to Death'
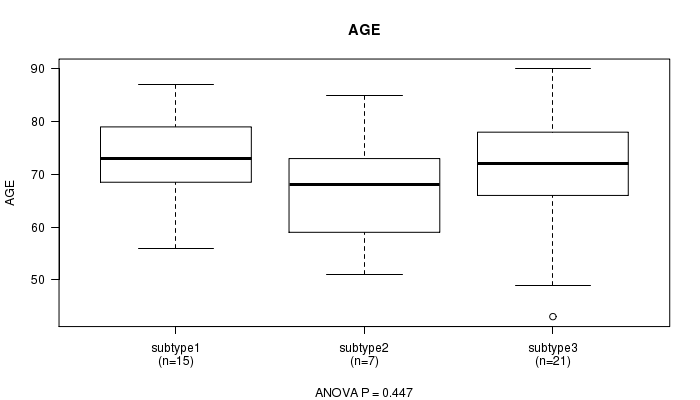
P value = 0.447 (ANOVA)
Table S32. Clustering Approach #4: 'RNAseq cHierClus subtypes' versus Clinical Feature #2: 'AGE'
| nPatients | Mean (Std.Dev) | |
|---|---|---|
| ALL | 43 | 70.4 (10.5) |
| subtype1 | 15 | 72.8 (8.9) |
| subtype2 | 7 | 66.9 (11.4) |
| subtype3 | 21 | 69.8 (11.2) |
Figure S28. Get High-res Image Clustering Approach #4: 'RNAseq cHierClus subtypes' versus Clinical Feature #2: 'AGE'
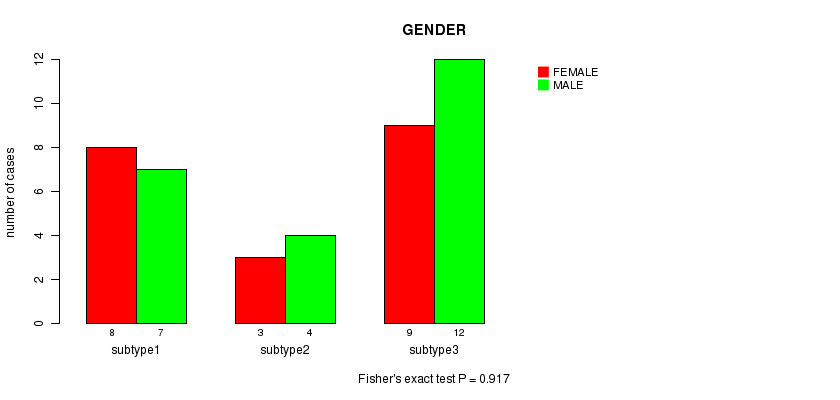
P value = 0.917 (Fisher's exact test)
Table S33. Clustering Approach #4: 'RNAseq cHierClus subtypes' versus Clinical Feature #3: 'GENDER'
| nPatients | FEMALE | MALE |
|---|---|---|
| ALL | 20 | 23 |
| subtype1 | 8 | 7 |
| subtype2 | 3 | 4 |
| subtype3 | 9 | 12 |
Figure S29. Get High-res Image Clustering Approach #4: 'RNAseq cHierClus subtypes' versus Clinical Feature #3: 'GENDER'
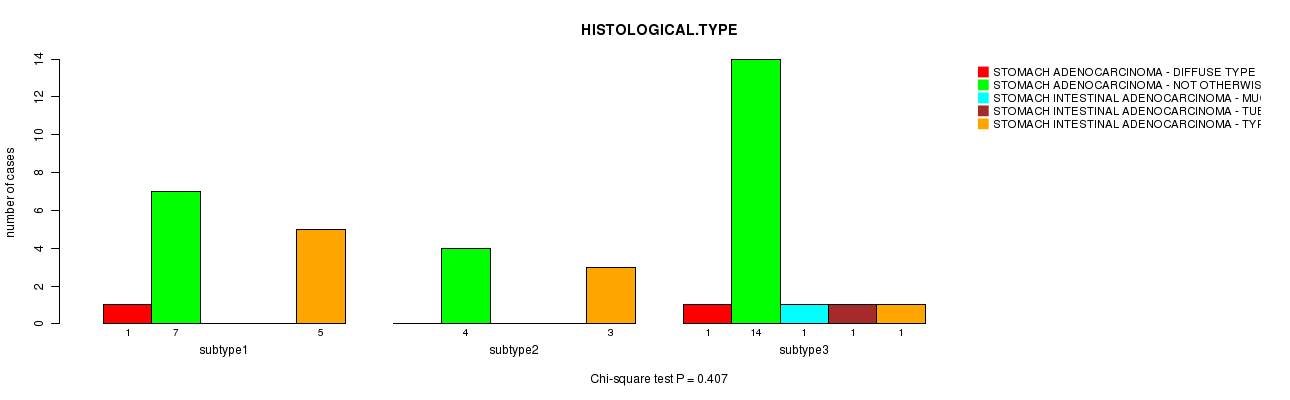
P value = 0.407 (Chi-square test)
Table S34. Clustering Approach #4: 'RNAseq cHierClus subtypes' versus Clinical Feature #4: 'HISTOLOGICAL.TYPE'
| nPatients | STOMACH ADENOCARCINOMA - DIFFUSE TYPE | STOMACH ADENOCARCINOMA - NOT OTHERWISE SPECIFIED (NOS) | STOMACH INTESTINAL ADENOCARCINOMA - MUCINOUS TYPE | STOMACH INTESTINAL ADENOCARCINOMA - TUBULAR TYPE | STOMACH INTESTINAL ADENOCARCINOMA - TYPE NOT OTHERWISE SPECIFIED (NOS) |
|---|---|---|---|---|---|
| ALL | 2 | 25 | 1 | 1 | 9 |
| subtype1 | 1 | 7 | 0 | 0 | 5 |
| subtype2 | 0 | 4 | 0 | 0 | 3 |
| subtype3 | 1 | 14 | 1 | 1 | 1 |
Figure S30. Get High-res Image Clustering Approach #4: 'RNAseq cHierClus subtypes' versus Clinical Feature #4: 'HISTOLOGICAL.TYPE'
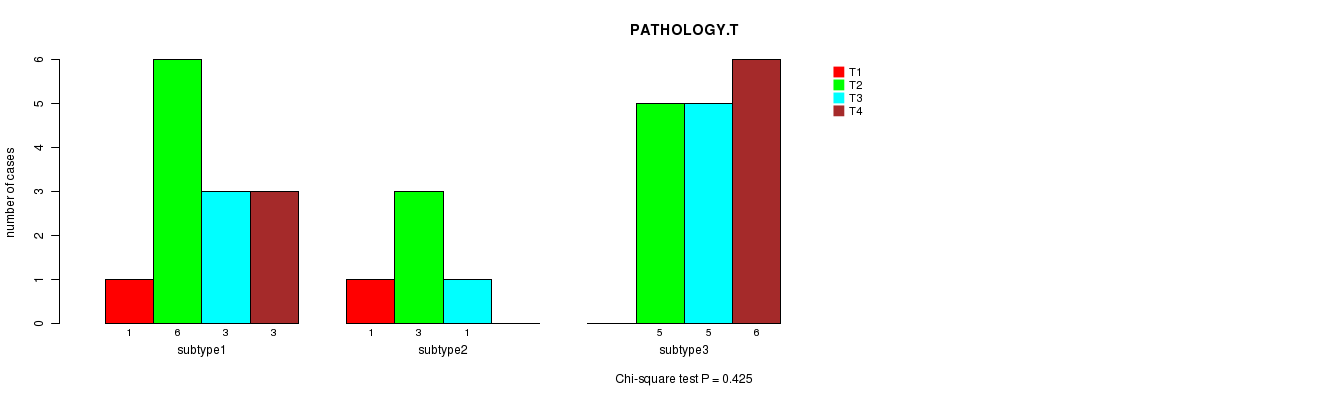
P value = 0.425 (Chi-square test)
Table S35. Clustering Approach #4: 'RNAseq cHierClus subtypes' versus Clinical Feature #5: 'PATHOLOGY.T'
| nPatients | T1 | T2 | T3 | T4 |
|---|---|---|---|---|
| ALL | 2 | 14 | 9 | 9 |
| subtype1 | 1 | 6 | 3 | 3 |
| subtype2 | 1 | 3 | 1 | 0 |
| subtype3 | 0 | 5 | 5 | 6 |
Figure S31. Get High-res Image Clustering Approach #4: 'RNAseq cHierClus subtypes' versus Clinical Feature #5: 'PATHOLOGY.T'
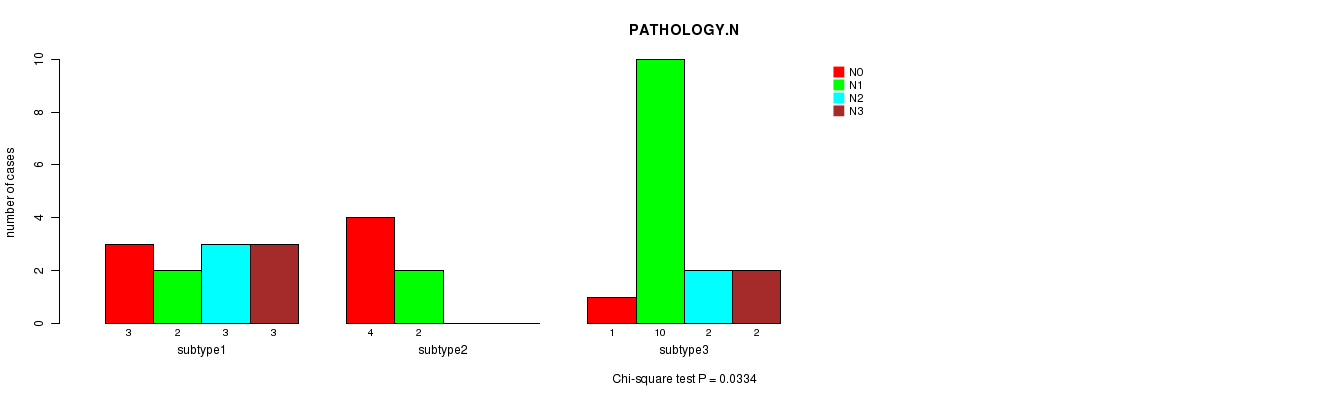
P value = 0.0334 (Chi-square test)
Table S36. Clustering Approach #4: 'RNAseq cHierClus subtypes' versus Clinical Feature #6: 'PATHOLOGY.N'
| nPatients | N0 | N1 | N2 | N3 |
|---|---|---|---|---|
| ALL | 8 | 14 | 5 | 5 |
| subtype1 | 3 | 2 | 3 | 3 |
| subtype2 | 4 | 2 | 0 | 0 |
| subtype3 | 1 | 10 | 2 | 2 |
Figure S32. Get High-res Image Clustering Approach #4: 'RNAseq cHierClus subtypes' versus Clinical Feature #6: 'PATHOLOGY.N'
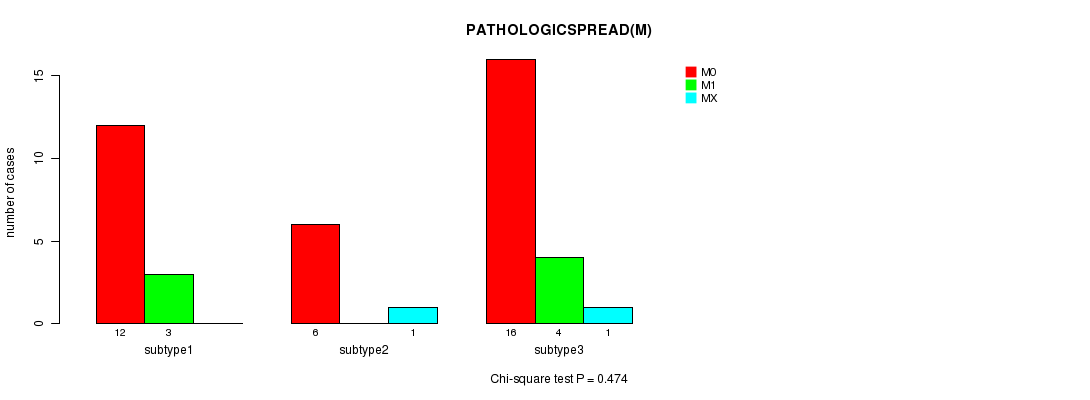
P value = 0.474 (Chi-square test)
Table S37. Clustering Approach #4: 'RNAseq cHierClus subtypes' versus Clinical Feature #7: 'PATHOLOGICSPREAD(M)'
| nPatients | M0 | M1 | MX |
|---|---|---|---|
| ALL | 34 | 7 | 2 |
| subtype1 | 12 | 3 | 0 |
| subtype2 | 6 | 0 | 1 |
| subtype3 | 16 | 4 | 1 |
Figure S33. Get High-res Image Clustering Approach #4: 'RNAseq cHierClus subtypes' versus Clinical Feature #7: 'PATHOLOGICSPREAD(M)'
P value = 0.00304 (Chi-square test)
Table S38. Clustering Approach #4: 'RNAseq cHierClus subtypes' versus Clinical Feature #8: 'TUMOR.STAGE'
| nPatients | I | II | III | IV |
|---|---|---|---|---|
| ALL | 7 | 4 | 6 | 11 |
| subtype1 | 3 | 0 | 3 | 5 |
| subtype2 | 4 | 0 | 0 | 0 |
| subtype3 | 0 | 4 | 3 | 6 |
Figure S34. Get High-res Image Clustering Approach #4: 'RNAseq cHierClus subtypes' versus Clinical Feature #8: 'TUMOR.STAGE'
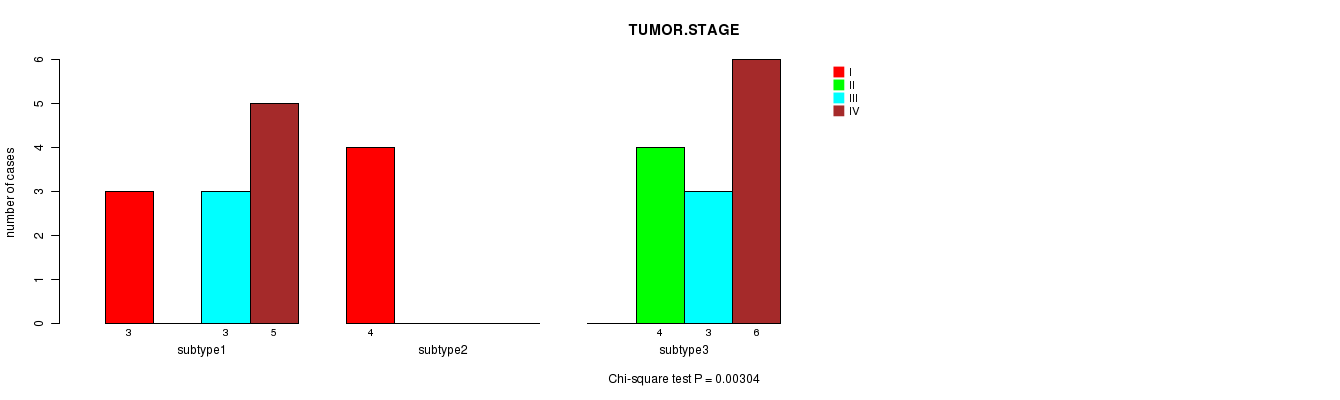
Table S39. Get Full Table Description of clustering approach #5: 'MIRseq CNMF subtypes'
| Cluster Labels | 1 | 2 | 3 |
|---|---|---|---|
| Number of samples | 51 | 34 | 49 |
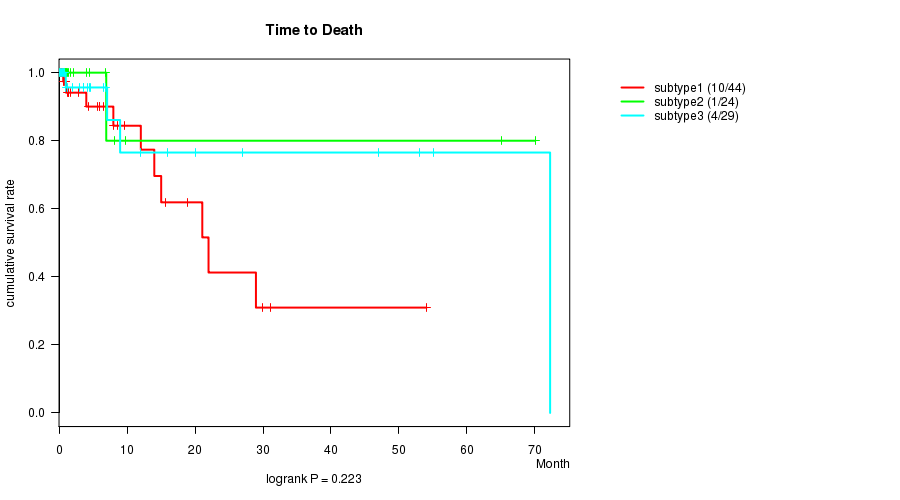
P value = 0.223 (logrank test)
Table S40. Clustering Approach #5: 'MIRseq CNMF subtypes' versus Clinical Feature #1: 'Time to Death'
| nPatients | nDeath | Duration Range (Median), Month | |
|---|---|---|---|
| ALL | 97 | 15 | 0.1 - 72.2 (3.0) |
| subtype1 | 44 | 10 | 0.1 - 54.0 (4.0) |
| subtype2 | 24 | 1 | 0.1 - 70.1 (1.2) |
| subtype3 | 29 | 4 | 0.1 - 72.2 (4.1) |
Figure S35. Get High-res Image Clustering Approach #5: 'MIRseq CNMF subtypes' versus Clinical Feature #1: 'Time to Death'
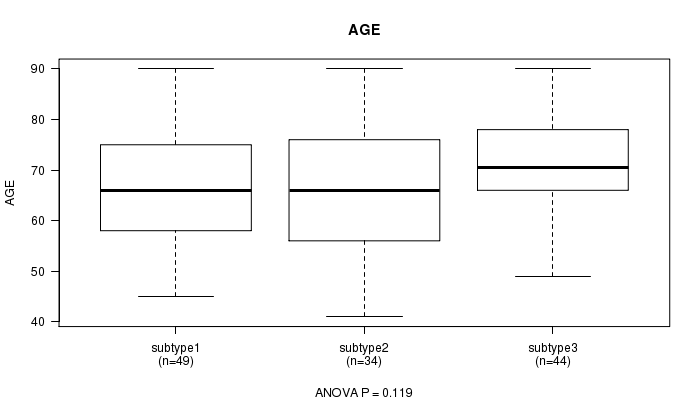
P value = 0.119 (ANOVA)
Table S41. Clustering Approach #5: 'MIRseq CNMF subtypes' versus Clinical Feature #2: 'AGE'
| nPatients | Mean (Std.Dev) | |
|---|---|---|
| ALL | 127 | 68.0 (10.9) |
| subtype1 | 49 | 66.8 (10.7) |
| subtype2 | 34 | 66.3 (12.9) |
| subtype3 | 44 | 70.8 (9.1) |
Figure S36. Get High-res Image Clustering Approach #5: 'MIRseq CNMF subtypes' versus Clinical Feature #2: 'AGE'
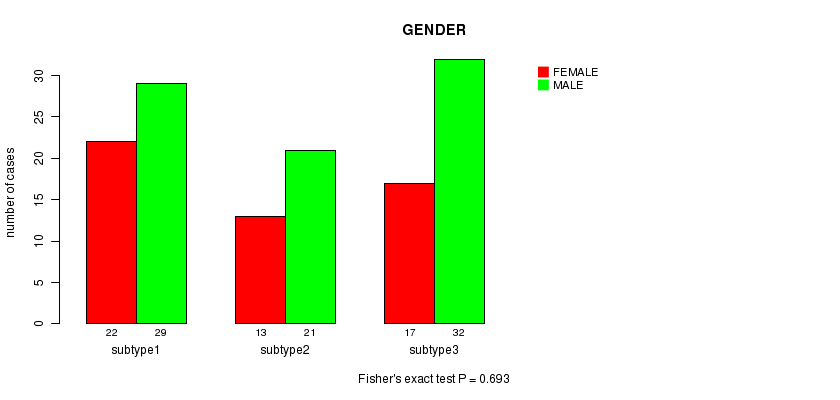
P value = 0.693 (Fisher's exact test)
Table S42. Clustering Approach #5: 'MIRseq CNMF subtypes' versus Clinical Feature #3: 'GENDER'
| nPatients | FEMALE | MALE |
|---|---|---|
| ALL | 52 | 82 |
| subtype1 | 22 | 29 |
| subtype2 | 13 | 21 |
| subtype3 | 17 | 32 |
Figure S37. Get High-res Image Clustering Approach #5: 'MIRseq CNMF subtypes' versus Clinical Feature #3: 'GENDER'
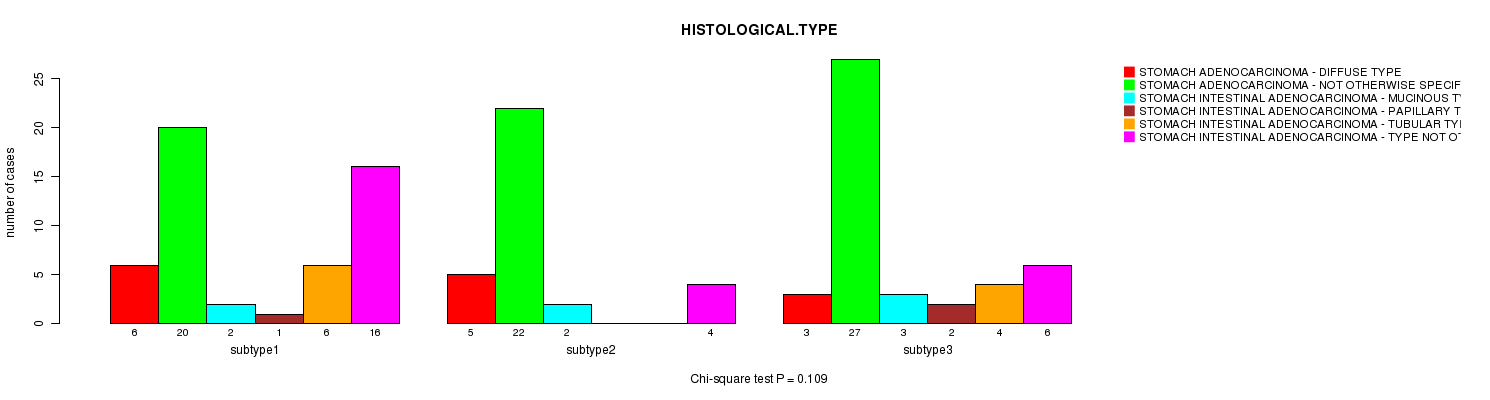
P value = 0.109 (Chi-square test)
Table S43. Clustering Approach #5: 'MIRseq CNMF subtypes' versus Clinical Feature #4: 'HISTOLOGICAL.TYPE'
| nPatients | STOMACH ADENOCARCINOMA - DIFFUSE TYPE | STOMACH ADENOCARCINOMA - NOT OTHERWISE SPECIFIED (NOS) | STOMACH INTESTINAL ADENOCARCINOMA - MUCINOUS TYPE | STOMACH INTESTINAL ADENOCARCINOMA - PAPILLARY TYPE | STOMACH INTESTINAL ADENOCARCINOMA - TUBULAR TYPE | STOMACH INTESTINAL ADENOCARCINOMA - TYPE NOT OTHERWISE SPECIFIED (NOS) |
|---|---|---|---|---|---|---|
| ALL | 14 | 69 | 7 | 3 | 10 | 26 |
| subtype1 | 6 | 20 | 2 | 1 | 6 | 16 |
| subtype2 | 5 | 22 | 2 | 0 | 0 | 4 |
| subtype3 | 3 | 27 | 3 | 2 | 4 | 6 |
Figure S38. Get High-res Image Clustering Approach #5: 'MIRseq CNMF subtypes' versus Clinical Feature #4: 'HISTOLOGICAL.TYPE'
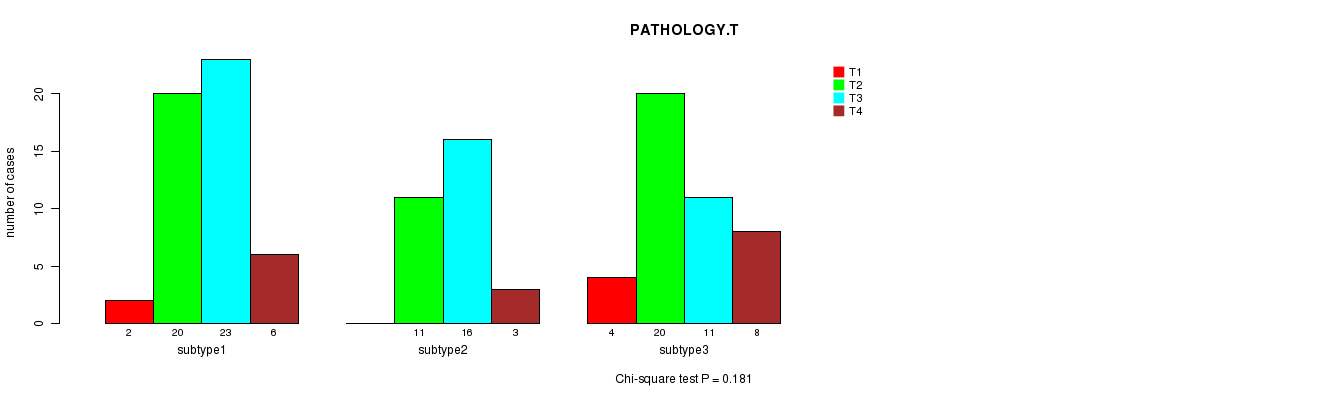
P value = 0.181 (Chi-square test)
Table S44. Clustering Approach #5: 'MIRseq CNMF subtypes' versus Clinical Feature #5: 'PATHOLOGY.T'
| nPatients | T1 | T2 | T3 | T4 |
|---|---|---|---|---|
| ALL | 6 | 51 | 50 | 17 |
| subtype1 | 2 | 20 | 23 | 6 |
| subtype2 | 0 | 11 | 16 | 3 |
| subtype3 | 4 | 20 | 11 | 8 |
Figure S39. Get High-res Image Clustering Approach #5: 'MIRseq CNMF subtypes' versus Clinical Feature #5: 'PATHOLOGY.T'
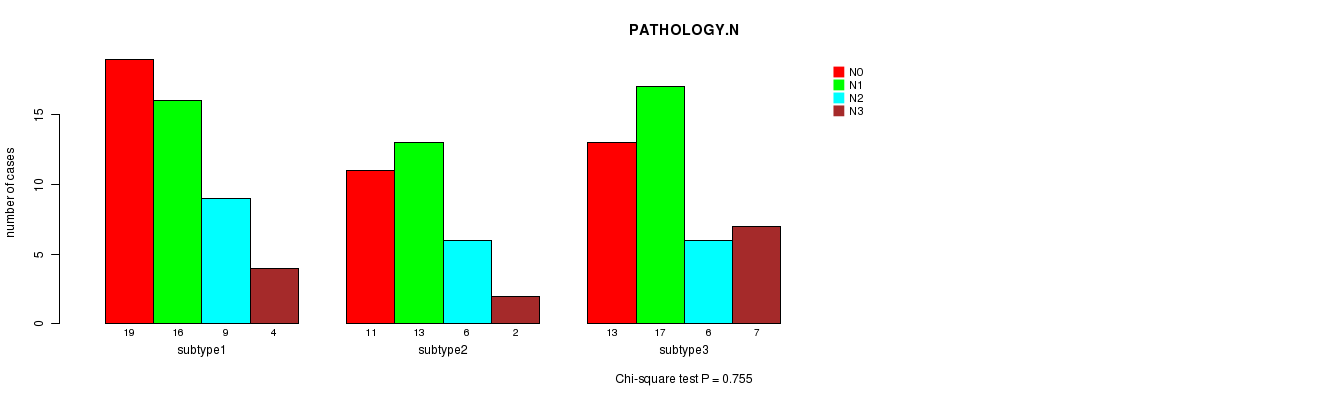
P value = 0.755 (Chi-square test)
Table S45. Clustering Approach #5: 'MIRseq CNMF subtypes' versus Clinical Feature #6: 'PATHOLOGY.N'
| nPatients | N0 | N1 | N2 | N3 |
|---|---|---|---|---|
| ALL | 43 | 46 | 21 | 13 |
| subtype1 | 19 | 16 | 9 | 4 |
| subtype2 | 11 | 13 | 6 | 2 |
| subtype3 | 13 | 17 | 6 | 7 |
Figure S40. Get High-res Image Clustering Approach #5: 'MIRseq CNMF subtypes' versus Clinical Feature #6: 'PATHOLOGY.N'
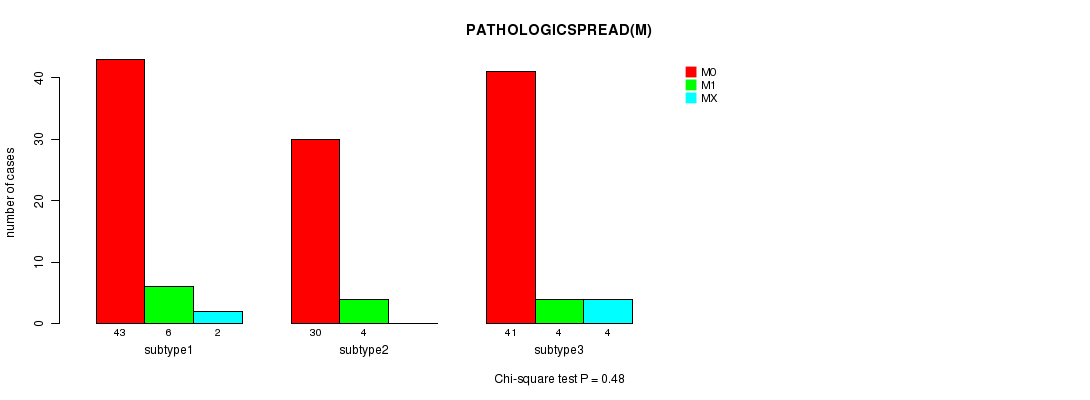
P value = 0.48 (Chi-square test)
Table S46. Clustering Approach #5: 'MIRseq CNMF subtypes' versus Clinical Feature #7: 'PATHOLOGICSPREAD(M)'
| nPatients | M0 | M1 | MX |
|---|---|---|---|
| ALL | 114 | 14 | 6 |
| subtype1 | 43 | 6 | 2 |
| subtype2 | 30 | 4 | 0 |
| subtype3 | 41 | 4 | 4 |
Figure S41. Get High-res Image Clustering Approach #5: 'MIRseq CNMF subtypes' versus Clinical Feature #7: 'PATHOLOGICSPREAD(M)'
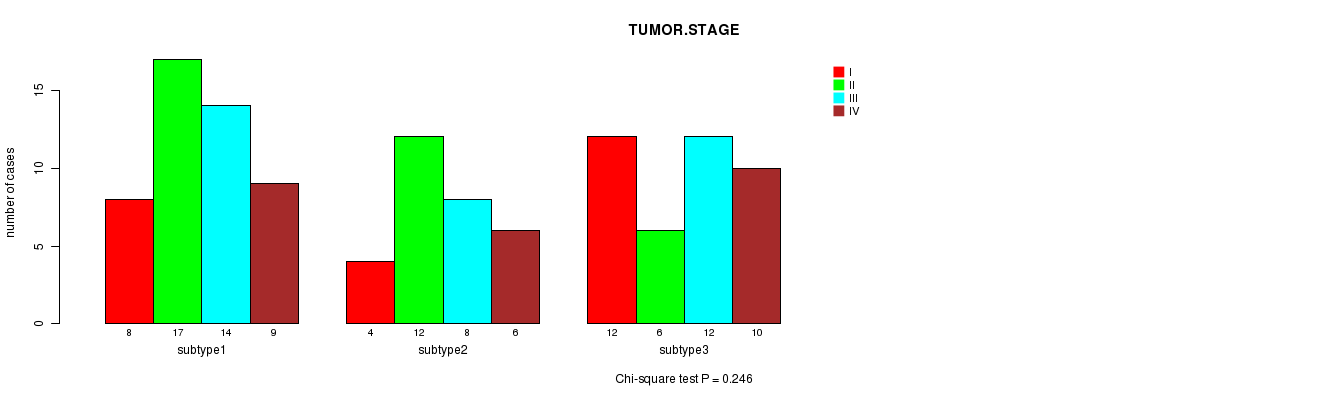
P value = 0.246 (Chi-square test)
Table S47. Clustering Approach #5: 'MIRseq CNMF subtypes' versus Clinical Feature #8: 'TUMOR.STAGE'
| nPatients | I | II | III | IV |
|---|---|---|---|---|
| ALL | 24 | 35 | 34 | 25 |
| subtype1 | 8 | 17 | 14 | 9 |
| subtype2 | 4 | 12 | 8 | 6 |
| subtype3 | 12 | 6 | 12 | 10 |
Figure S42. Get High-res Image Clustering Approach #5: 'MIRseq CNMF subtypes' versus Clinical Feature #8: 'TUMOR.STAGE'
P value = 0.0701 (Fisher's exact test)
Table S48. Clustering Approach #5: 'MIRseq CNMF subtypes' versus Clinical Feature #9: 'RADIATIONS.RADIATION.REGIMENINDICATION'
| nPatients | NO | YES |
|---|---|---|
| ALL | 5 | 129 |
| subtype1 | 0 | 51 |
| subtype2 | 1 | 33 |
| subtype3 | 4 | 45 |
Figure S43. Get High-res Image Clustering Approach #5: 'MIRseq CNMF subtypes' versus Clinical Feature #9: 'RADIATIONS.RADIATION.REGIMENINDICATION'
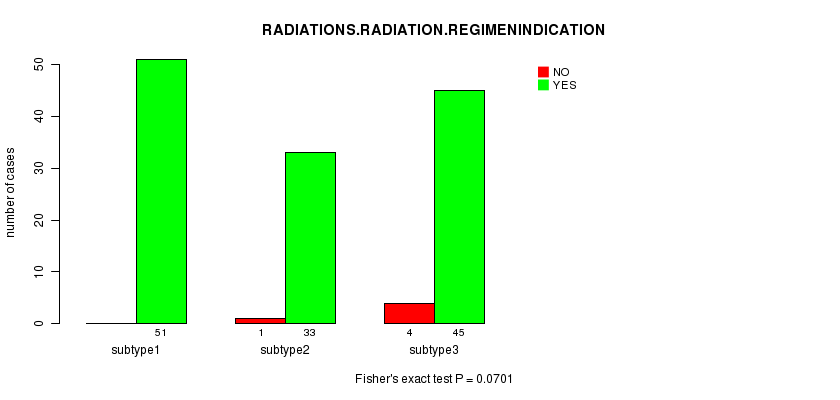
Table S49. Get Full Table Description of clustering approach #6: 'MIRseq cHierClus subtypes'
| Cluster Labels | 1 | 2 | 3 |
|---|---|---|---|
| Number of samples | 43 | 34 | 57 |
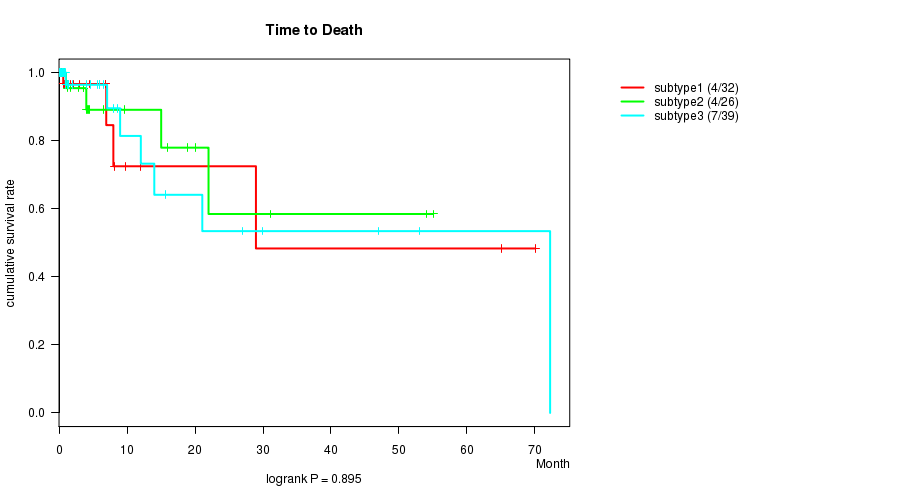
P value = 0.895 (logrank test)
Table S50. Clustering Approach #6: 'MIRseq cHierClus subtypes' versus Clinical Feature #1: 'Time to Death'
| nPatients | nDeath | Duration Range (Median), Month | |
|---|---|---|---|
| ALL | 97 | 15 | 0.1 - 72.2 (3.0) |
| subtype1 | 32 | 4 | 0.1 - 70.1 (1.2) |
| subtype2 | 26 | 4 | 0.3 - 55.0 (4.1) |
| subtype3 | 39 | 7 | 0.1 - 72.2 (4.0) |
Figure S44. Get High-res Image Clustering Approach #6: 'MIRseq cHierClus subtypes' versus Clinical Feature #1: 'Time to Death'
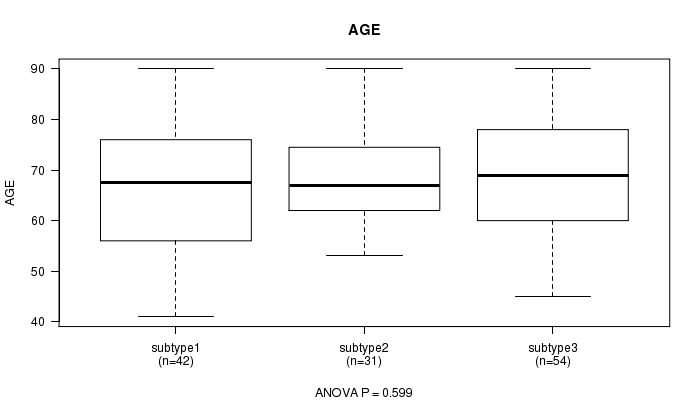
P value = 0.599 (ANOVA)
Table S51. Clustering Approach #6: 'MIRseq cHierClus subtypes' versus Clinical Feature #2: 'AGE'
| nPatients | Mean (Std.Dev) | |
|---|---|---|
| ALL | 127 | 68.0 (10.9) |
| subtype1 | 42 | 66.7 (12.9) |
| subtype2 | 31 | 68.3 (9.4) |
| subtype3 | 54 | 68.9 (10.2) |
Figure S45. Get High-res Image Clustering Approach #6: 'MIRseq cHierClus subtypes' versus Clinical Feature #2: 'AGE'
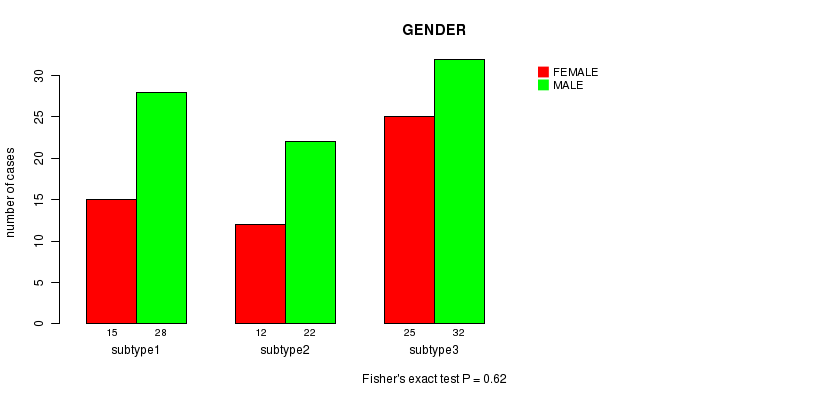
P value = 0.62 (Fisher's exact test)
Table S52. Clustering Approach #6: 'MIRseq cHierClus subtypes' versus Clinical Feature #3: 'GENDER'
| nPatients | FEMALE | MALE |
|---|---|---|
| ALL | 52 | 82 |
| subtype1 | 15 | 28 |
| subtype2 | 12 | 22 |
| subtype3 | 25 | 32 |
Figure S46. Get High-res Image Clustering Approach #6: 'MIRseq cHierClus subtypes' versus Clinical Feature #3: 'GENDER'
P value = 0.0114 (Chi-square test)
Table S53. Clustering Approach #6: 'MIRseq cHierClus subtypes' versus Clinical Feature #4: 'HISTOLOGICAL.TYPE'
| nPatients | STOMACH ADENOCARCINOMA - DIFFUSE TYPE | STOMACH ADENOCARCINOMA - NOT OTHERWISE SPECIFIED (NOS) | STOMACH INTESTINAL ADENOCARCINOMA - MUCINOUS TYPE | STOMACH INTESTINAL ADENOCARCINOMA - PAPILLARY TYPE | STOMACH INTESTINAL ADENOCARCINOMA - TUBULAR TYPE | STOMACH INTESTINAL ADENOCARCINOMA - TYPE NOT OTHERWISE SPECIFIED (NOS) |
|---|---|---|---|---|---|---|
| ALL | 14 | 69 | 7 | 3 | 10 | 26 |
| subtype1 | 6 | 26 | 3 | 0 | 0 | 6 |
| subtype2 | 2 | 14 | 1 | 2 | 8 | 7 |
| subtype3 | 6 | 29 | 3 | 1 | 2 | 13 |
Figure S47. Get High-res Image Clustering Approach #6: 'MIRseq cHierClus subtypes' versus Clinical Feature #4: 'HISTOLOGICAL.TYPE'
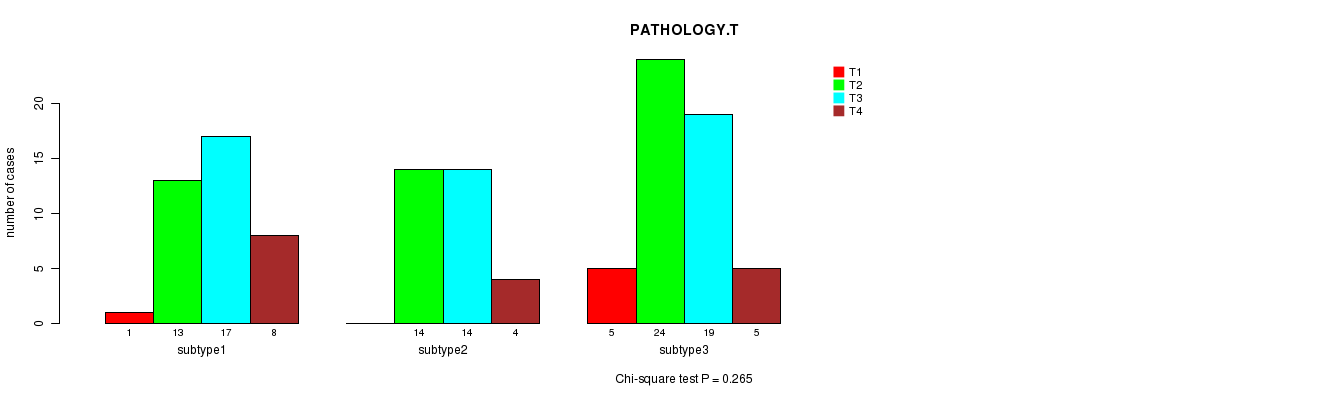
P value = 0.265 (Chi-square test)
Table S54. Clustering Approach #6: 'MIRseq cHierClus subtypes' versus Clinical Feature #5: 'PATHOLOGY.T'
| nPatients | T1 | T2 | T3 | T4 |
|---|---|---|---|---|
| ALL | 6 | 51 | 50 | 17 |
| subtype1 | 1 | 13 | 17 | 8 |
| subtype2 | 0 | 14 | 14 | 4 |
| subtype3 | 5 | 24 | 19 | 5 |
Figure S48. Get High-res Image Clustering Approach #6: 'MIRseq cHierClus subtypes' versus Clinical Feature #5: 'PATHOLOGY.T'
P value = 0.112 (Chi-square test)
Table S55. Clustering Approach #6: 'MIRseq cHierClus subtypes' versus Clinical Feature #6: 'PATHOLOGY.N'
| nPatients | N0 | N1 | N2 | N3 |
|---|---|---|---|---|
| ALL | 43 | 46 | 21 | 13 |
| subtype1 | 13 | 19 | 7 | 2 |
| subtype2 | 8 | 8 | 9 | 5 |
| subtype3 | 22 | 19 | 5 | 6 |
Figure S49. Get High-res Image Clustering Approach #6: 'MIRseq cHierClus subtypes' versus Clinical Feature #6: 'PATHOLOGY.N'
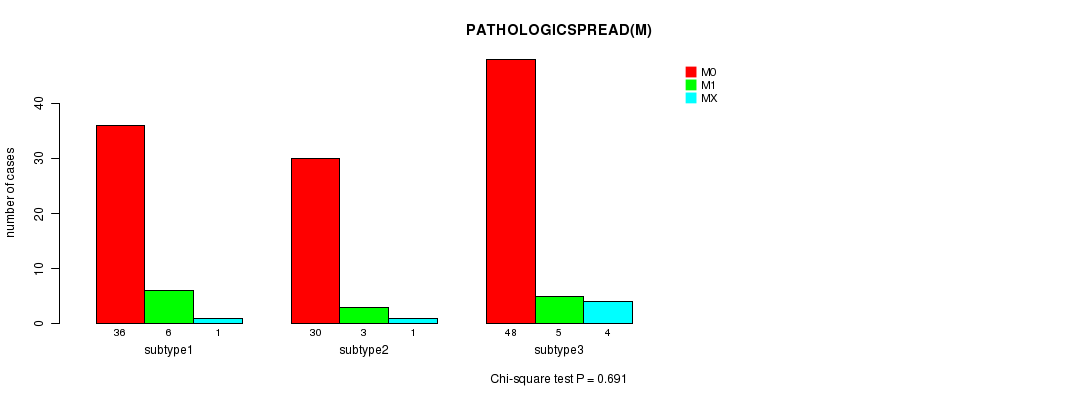
P value = 0.691 (Chi-square test)
Table S56. Clustering Approach #6: 'MIRseq cHierClus subtypes' versus Clinical Feature #7: 'PATHOLOGICSPREAD(M)'
| nPatients | M0 | M1 | MX |
|---|---|---|---|
| ALL | 114 | 14 | 6 |
| subtype1 | 36 | 6 | 1 |
| subtype2 | 30 | 3 | 1 |
| subtype3 | 48 | 5 | 4 |
Figure S50. Get High-res Image Clustering Approach #6: 'MIRseq cHierClus subtypes' versus Clinical Feature #7: 'PATHOLOGICSPREAD(M)'
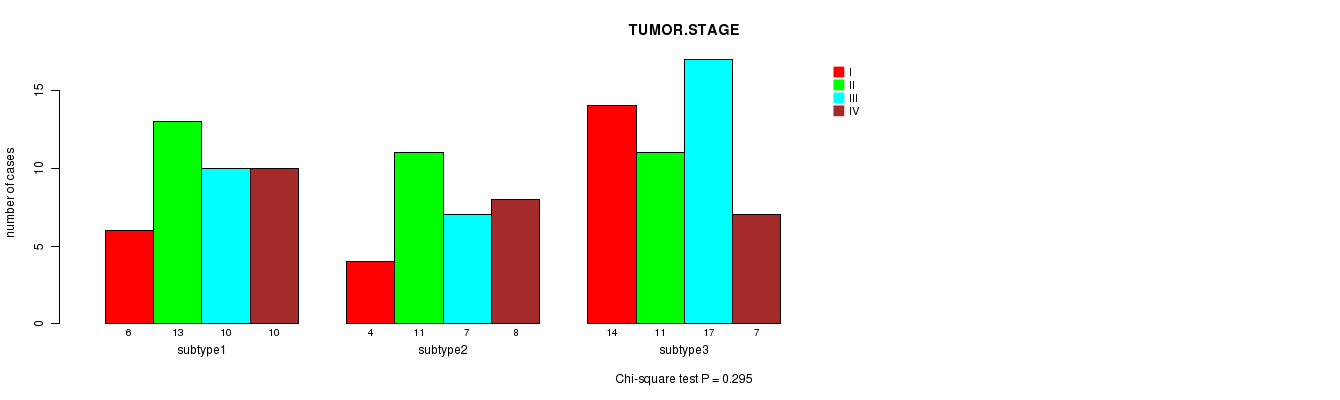
P value = 0.295 (Chi-square test)
Table S57. Clustering Approach #6: 'MIRseq cHierClus subtypes' versus Clinical Feature #8: 'TUMOR.STAGE'
| nPatients | I | II | III | IV |
|---|---|---|---|---|
| ALL | 24 | 35 | 34 | 25 |
| subtype1 | 6 | 13 | 10 | 10 |
| subtype2 | 4 | 11 | 7 | 8 |
| subtype3 | 14 | 11 | 17 | 7 |
Figure S51. Get High-res Image Clustering Approach #6: 'MIRseq cHierClus subtypes' versus Clinical Feature #8: 'TUMOR.STAGE'
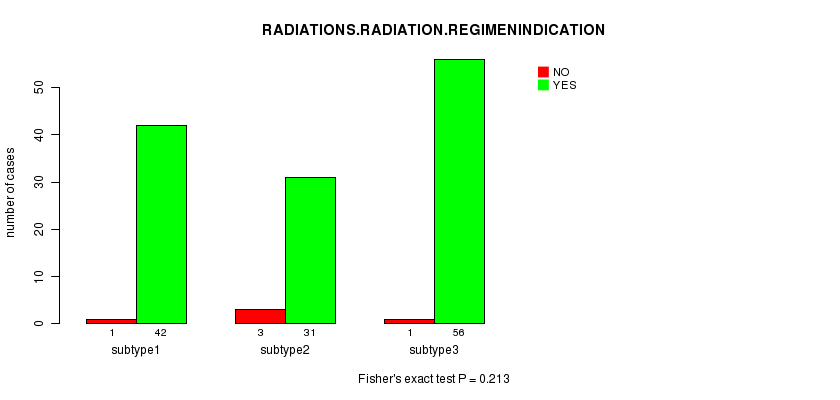
P value = 0.213 (Fisher's exact test)
Table S58. Clustering Approach #6: 'MIRseq cHierClus subtypes' versus Clinical Feature #9: 'RADIATIONS.RADIATION.REGIMENINDICATION'
| nPatients | NO | YES |
|---|---|---|
| ALL | 5 | 129 |
| subtype1 | 1 | 42 |
| subtype2 | 3 | 31 |
| subtype3 | 1 | 56 |
Figure S52. Get High-res Image Clustering Approach #6: 'MIRseq cHierClus subtypes' versus Clinical Feature #9: 'RADIATIONS.RADIATION.REGIMENINDICATION'
-
Cluster data file = STAD-TP.mergedcluster.txt
-
Clinical data file = STAD-TP.clin.merged.picked.txt
-
Number of patients = 162
-
Number of clustering approaches = 6
-
Number of selected clinical features = 9
-
Exclude small clusters that include fewer than K patients, K = 3
consensus non-negative matrix factorization clustering approach (Brunet et al. 2004)
Resampling-based clustering method (Monti et al. 2003)
For survival clinical features, the Kaplan-Meier survival curves of tumors with and without gene mutations were plotted and the statistical significance P values were estimated by logrank test (Bland and Altman 2004) using the 'survdiff' function in R
For continuous numerical clinical features, one-way analysis of variance (Howell 2002) was applied to compare the clinical values between tumor subtypes using 'anova' function in R
For binary clinical features, two-tailed Fisher's exact tests (Fisher 1922) were used to estimate the P values using the 'fisher.test' function in R
For multi-class clinical features (nominal or ordinal), Chi-square tests (Greenwood and Nikulin 1996) were used to estimate the P values using the 'chisq.test' function in R
For continuous numerical clinical features, two-tailed Student's t test with unequal variance (Lehmann and Romano 2005) was applied to compare the clinical values between two tumor subtypes using 't.test' function in R
This is an experimental feature. The full results of the analysis summarized in this report can be downloaded from the TCGA Data Coordination Center.