This pipeline uses various statistical tests to identify miRs whose expression levels correlated to selected clinical features.
Testing the association between 564 genes and 4 clinical features across 436 samples, statistically thresholded by Q value < 0.05, 4 clinical features related to at least one genes.
-
4 genes correlated to 'Time to Death'.
-
HSA-LET-7G , HSA-MIR-628 , HSA-MIR-30E , HSA-LET-7B
-
58 genes correlated to 'AGE'.
-
HSA-MIR-424 , HSA-MIR-1247 , HSA-MIR-337 , HSA-MIR-493 , HSA-MIR-199A-1 , ...
-
66 genes correlated to 'HISTOLOGICAL.TYPE'.
-
HSA-MIR-9-1 , HSA-MIR-9-2 , HSA-MIR-34A , HSA-MIR-934 , HSA-MIR-375 , ...
-
6 genes correlated to 'RADIATIONS.RADIATION.REGIMENINDICATION'.
-
HSA-MIR-128-2 , HSA-MIR-3613 , HSA-MIR-128-1 , HSA-MIR-628 , HSA-MIR-181D , ...
Complete statistical result table is provided in Supplement Table 1
Table 1. Get Full Table This table shows the clinical features, statistical methods used, and the number of genes that are significantly associated with each clinical feature at Q value < 0.05.
| Clinical feature | Statistical test | Significant genes | Associated with | Associated with | ||
|---|---|---|---|---|---|---|
| Time to Death | Cox regression test | N=4 | shorter survival | N=0 | longer survival | N=4 |
| AGE | Spearman correlation test | N=58 | older | N=5 | younger | N=53 |
| HISTOLOGICAL TYPE | ANOVA test | N=66 | ||||
| RADIATIONS RADIATION REGIMENINDICATION | t test | N=6 | yes | N=4 | no | N=2 |
Table S1. Basic characteristics of clinical feature: 'Time to Death'
| Time to Death | Duration (Months) | 0-187.1 (median=15.7) |
| censored | N = 392 | |
| death | N = 39 | |
| Significant markers | N = 4 | |
| associated with shorter survival | 0 | |
| associated with longer survival | 4 |
Table S2. Get Full Table List of 4 genes significantly associated with 'Time to Death' by Cox regression test
| HazardRatio | Wald_P | Q | C_index | |
|---|---|---|---|---|
| HSA-LET-7G | 0.45 | 8.702e-06 | 0.0049 | 0.287 |
| HSA-MIR-628 | 0.62 | 1.319e-05 | 0.0074 | 0.284 |
| HSA-MIR-30E | 0.31 | 2.002e-05 | 0.011 | 0.301 |
| HSA-LET-7B | 0.54 | 3.271e-05 | 0.018 | 0.258 |
Figure S1. Get High-res Image As an example, this figure shows the association of HSA-LET-7G to 'Time to Death'. four curves present the cumulative survival rates of 4 quartile subsets of patients. P value = 8.7e-06 with univariate Cox regression analysis using continuous log-2 expression values.
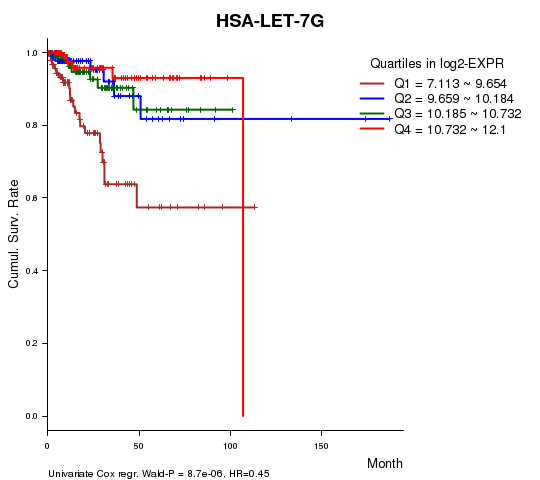
Table S3. Basic characteristics of clinical feature: 'AGE'
| AGE | Mean (SD) | 63.38 (11) |
| Significant markers | N = 58 | |
| pos. correlated | 5 | |
| neg. correlated | 53 |
Table S4. Get Full Table List of top 10 genes significantly correlated to 'AGE' by Spearman correlation test
| SpearmanCorr | corrP | Q | |
|---|---|---|---|
| HSA-MIR-424 | -0.3214 | 6.591e-12 | 3.72e-09 |
| HSA-MIR-1247 | -0.2874 | 1.158e-09 | 6.52e-07 |
| HSA-MIR-337 | -0.275 | 5.495e-09 | 3.09e-06 |
| HSA-MIR-493 | -0.2754 | 6.075e-09 | 3.41e-06 |
| HSA-MIR-199A-1 | -0.2726 | 7.48e-09 | 4.19e-06 |
| HSA-MIR-409 | -0.2702 | 1.025e-08 | 5.73e-06 |
| HSA-MIR-199A-2 | -0.2687 | 1.242e-08 | 6.93e-06 |
| HSA-MIR-214 | -0.263 | 2.685e-08 | 1.5e-05 |
| HSA-MIR-34A | -0.2621 | 2.905e-08 | 1.62e-05 |
| HSA-MIR-199B | -0.2614 | 3.169e-08 | 1.76e-05 |
Figure S2. Get High-res Image As an example, this figure shows the association of HSA-MIR-424 to 'AGE'. P value = 6.59e-12 with Spearman correlation analysis. The straight line presents the best linear regression.
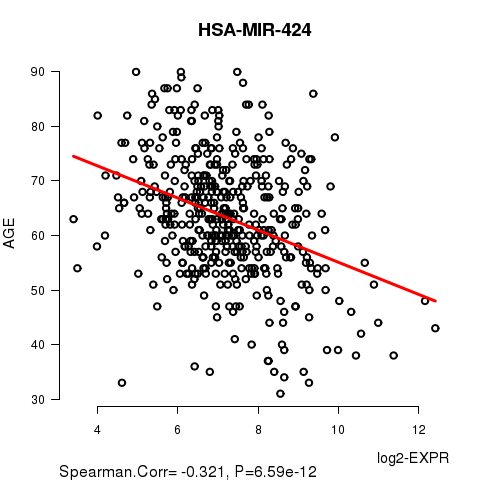
Table S5. Basic characteristics of clinical feature: 'HISTOLOGICAL.TYPE'
| HISTOLOGICAL.TYPE | Labels | N |
| ENDOMETRIOID ENDOMETRIAL ADENOCARCINOMA | 324 | |
| ENDOMETRIOID ENDOMETRIAL ADENOCARCINOMA (GRADE 1 OR 2) | 3 | |
| ENDOMETRIOID ENDOMETRIAL ADENOCARCINOMA (GRADE 1) | 9 | |
| ENDOMETRIOID ENDOMETRIAL ADENOCARCINOMA (GRADE 2) | 2 | |
| ENDOMETRIOID ENDOMETRIAL ADENOCARCINOMA (GRADE 3) | 7 | |
| MIXED SEROUS AND ENDOMETRIOID | 18 | |
| SEROUS ENDOMETRIAL ADENOCARCINOMA | 73 | |
| Significant markers | N = 66 |
Table S6. Get Full Table List of top 10 genes differentially expressed by 'HISTOLOGICAL.TYPE'
| ANOVA_P | Q | |
|---|---|---|
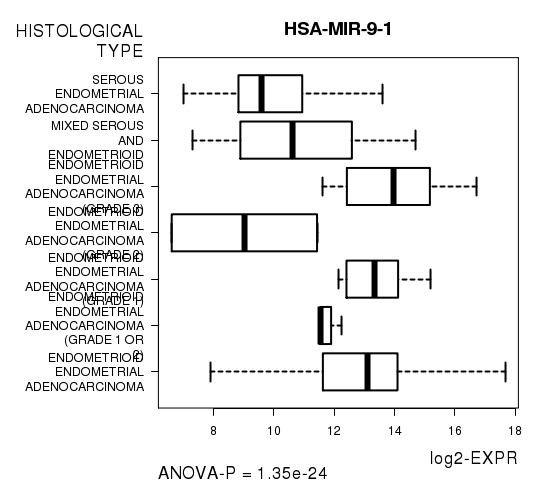
| HSA-MIR-9-1 | 1.354e-24 | 7.64e-22 |
| HSA-MIR-9-2 | 1.704e-24 | 9.59e-22 |
| HSA-MIR-34A | 3.726e-20 | 2.09e-17 |
| HSA-MIR-934 | 1.668e-19 | 9.36e-17 |
| HSA-MIR-375 | 1.812e-16 | 1.01e-13 |
| HSA-MIR-195 | 2.595e-16 | 1.45e-13 |
| HSA-MIR-497 | 4.478e-16 | 2.5e-13 |
| HSA-MIR-548V | 8.926e-15 | 4.97e-12 |
| HSA-MIR-190B | 1.642e-13 | 9.13e-11 |
| HSA-MIR-452 | 2.503e-13 | 1.39e-10 |
Figure S3. Get High-res Image As an example, this figure shows the association of HSA-MIR-9-1 to 'HISTOLOGICAL.TYPE'. P value = 1.35e-24 with ANOVA analysis.
6 genes related to 'RADIATIONS.RADIATION.REGIMENINDICATION'.
Table S7. Basic characteristics of clinical feature: 'RADIATIONS.RADIATION.REGIMENINDICATION'
| RADIATIONS.RADIATION.REGIMENINDICATION | Labels | N |
| NO | 127 | |
| YES | 309 | |
| Significant markers | N = 6 | |
| Higher in YES | 4 | |
| Higher in NO | 2 |
Table S8. Get Full Table List of 6 genes differentially expressed by 'RADIATIONS.RADIATION.REGIMENINDICATION'
| T(pos if higher in 'YES') | ttestP | Q | AUC | |
|---|---|---|---|---|
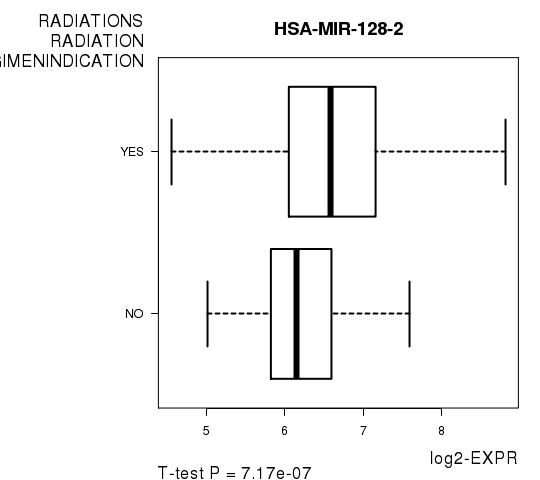
| HSA-MIR-128-2 | 5.06 | 7.171e-07 | 0.000404 | 0.6392 |
| HSA-MIR-3613 | -4.95 | 1.287e-06 | 0.000725 | 0.6521 |
| HSA-MIR-128-1 | 4.82 | 2.273e-06 | 0.00128 | 0.6378 |
| HSA-MIR-628 | -4.25 | 2.974e-05 | 0.0167 | 0.6167 |
| HSA-MIR-181D | 4.17 | 4.149e-05 | 0.0232 | 0.6229 |
| HSA-MIR-660 | 4 | 8.255e-05 | 0.0461 | 0.6123 |
Figure S4. Get High-res Image As an example, this figure shows the association of HSA-MIR-128-2 to 'RADIATIONS.RADIATION.REGIMENINDICATION'. P value = 7.17e-07 with T-test analysis.
-
Expresson data file = UCEC-TP.miRseq_RPKM_log2.txt
-
Clinical data file = UCEC-TP.clin.merged.picked.txt
-
Number of patients = 436
-
Number of genes = 564
-
Number of clinical features = 4
For survival clinical features, Wald's test in univariate Cox regression analysis with proportional hazards model (Andersen and Gill 1982) was used to estimate the P values using the 'coxph' function in R. Kaplan-Meier survival curves were plot using the four quartile subgroups of patients based on expression levels
For continuous numerical clinical features, Spearman's rank correlation coefficients (Spearman 1904) and two-tailed P values were estimated using 'cor.test' function in R
For multi-class clinical features (ordinal or nominal), one-way analysis of variance (Howell 2002) was applied to compare the log2-expression levels between different clinical classes using 'anova' function in R
For two-class clinical features, two-tailed Student's t test with unequal variance (Lehmann and Romano 2005) was applied to compare the log2-expression levels between the two clinical classes using 't.test' function in R
For multiple hypothesis correction, Q value is the False Discovery Rate (FDR) analogue of the P value (Benjamini and Hochberg 1995), defined as the minimum FDR at which the test may be called significant. We used the 'Benjamini and Hochberg' method of 'p.adjust' function in R to convert P values into Q values.
This is an experimental feature. The full results of the analysis summarized in this report can be downloaded from the TCGA Data Coordination Center.