(primary solid tumor cohort)
This pipeline computes the correlation between significant arm-level copy number variations (cnvs) and selected clinical features.
Testing the association between copy number variation 73 arm-level results and 7 clinical features across 114 patients, 5 significant findings detected with Q value < 0.25.
-
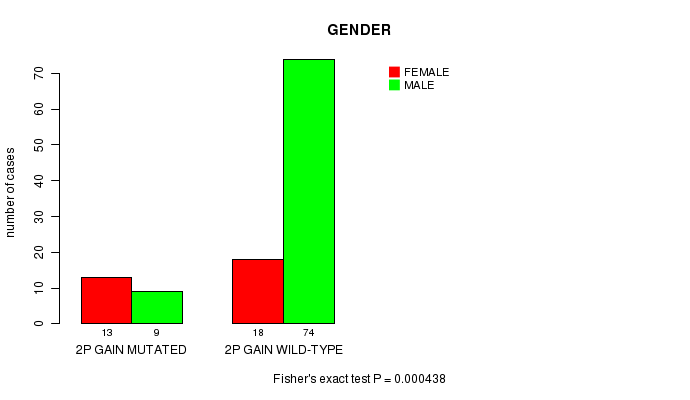
2p gain cnv correlated to 'GENDER'.
-
6p loss cnv correlated to 'KARNOFSKY.PERFORMANCE.SCORE'.
-
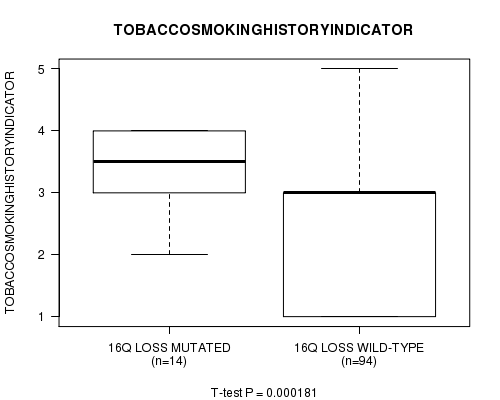
16q loss cnv correlated to 'TOBACCOSMOKINGHISTORYINDICATOR'.
-
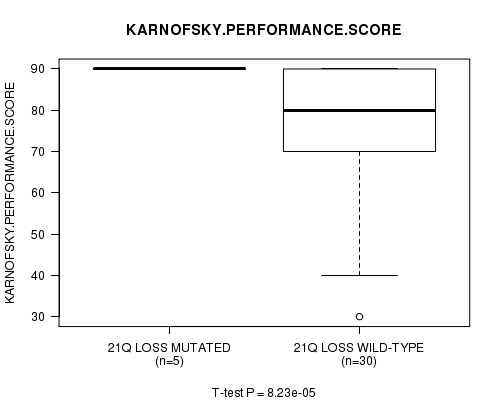
21q loss cnv correlated to 'AGE' and 'KARNOFSKY.PERFORMANCE.SCORE'.
Table 1. Get Full Table Overview of the association between significant copy number variation of 73 arm-level results and 7 clinical features. Shown in the table are P values (Q values). Thresholded by Q value < 0.25, 5 significant findings detected.
|
Clinical Features |
Time to Death |
AGE | GENDER |
KARNOFSKY PERFORMANCE SCORE |
NUMBERPACKYEARSSMOKED | STOPPEDSMOKINGYEAR | TOBACCOSMOKINGHISTORYINDICATOR | ||
| nCNV (%) | nWild-Type | logrank test | t-test | Fisher's exact test | t-test | t-test | t-test | t-test | |
| 21q loss | 11 (10%) | 103 |
0.603 (1.00) |
0.000289 (0.14) |
1 (1.00) |
8.23e-05 (0.0402) |
0.787 (1.00) |
0.182 (1.00) |
0.743 (1.00) |
| 2p gain | 22 (19%) | 92 |
0.358 (1.00) |
0.91 (1.00) |
0.000438 (0.212) |
0.228 (1.00) |
0.679 (1.00) |
0.00891 (1.00) |
0.596 (1.00) |
| 6p loss | 15 (13%) | 99 |
0.986 (1.00) |
0.49 (1.00) |
0.547 (1.00) |
8.85e-05 (0.0431) |
0.681 (1.00) |
0.937 (1.00) |
0.538 (1.00) |
| 16q loss | 14 (12%) | 100 |
0.802 (1.00) |
0.253 (1.00) |
0.344 (1.00) |
0.167 (1.00) |
0.728 (1.00) |
0.175 (1.00) |
0.000181 (0.0878) |
| 1p gain | 13 (11%) | 101 |
0.134 (1.00) |
0.16 (1.00) |
1 (1.00) |
0.214 (1.00) |
0.685 (1.00) |
0.534 (1.00) |
0.281 (1.00) |
| 1q gain | 24 (21%) | 90 |
0.0241 (1.00) |
0.0129 (1.00) |
0.801 (1.00) |
0.228 (1.00) |
0.708 (1.00) |
0.211 (1.00) |
0.0602 (1.00) |
| 2q gain | 9 (8%) | 105 |
0.562 (1.00) |
0.535 (1.00) |
0.702 (1.00) |
0.228 (1.00) |
0.465 (1.00) |
0.00189 (0.909) |
0.409 (1.00) |
| 3p gain | 25 (22%) | 89 |
0.406 (1.00) |
0.348 (1.00) |
0.311 (1.00) |
0.954 (1.00) |
0.646 (1.00) |
0.653 (1.00) |
0.898 (1.00) |
| 3q gain | 33 (29%) | 81 |
0.123 (1.00) |
0.208 (1.00) |
0.171 (1.00) |
0.752 (1.00) |
0.644 (1.00) |
0.264 (1.00) |
0.939 (1.00) |
| 4p gain | 8 (7%) | 106 |
0.0663 (1.00) |
0.839 (1.00) |
0.444 (1.00) |
0.239 (1.00) |
0.95 (1.00) |
0.673 (1.00) |
|
| 4q gain | 3 (3%) | 111 |
0.289 (1.00) |
0.506 (1.00) |
1 (1.00) |
0.215 (1.00) |
0.941 (1.00) |
||
| 5p gain | 34 (30%) | 80 |
0.665 (1.00) |
0.298 (1.00) |
0.363 (1.00) |
0.107 (1.00) |
0.609 (1.00) |
0.452 (1.00) |
0.494 (1.00) |
| 5q gain | 16 (14%) | 98 |
0.286 (1.00) |
0.421 (1.00) |
0.228 (1.00) |
0.282 (1.00) |
0.721 (1.00) |
0.74 (1.00) |
0.634 (1.00) |
| 6p gain | 7 (6%) | 107 |
0.0847 (1.00) |
0.589 (1.00) |
1 (1.00) |
0.462 (1.00) |
0.742 (1.00) |
0.457 (1.00) |
0.421 (1.00) |
| 6q gain | 4 (4%) | 110 |
0.0893 (1.00) |
0.97 (1.00) |
0.573 (1.00) |
0.917 (1.00) |
0.988 (1.00) |
0.0765 (1.00) |
|
| 7p gain | 35 (31%) | 79 |
0.387 (1.00) |
0.561 (1.00) |
0.503 (1.00) |
0.16 (1.00) |
0.768 (1.00) |
0.81 (1.00) |
0.173 (1.00) |
| 7q gain | 35 (31%) | 79 |
0.718 (1.00) |
0.643 (1.00) |
0.0664 (1.00) |
0.242 (1.00) |
0.233 (1.00) |
0.849 (1.00) |
0.38 (1.00) |
| 8p gain | 14 (12%) | 100 |
0.994 (1.00) |
0.189 (1.00) |
0.755 (1.00) |
0.853 (1.00) |
0.13 (1.00) |
0.0497 (1.00) |
0.152 (1.00) |
| 8q gain | 33 (29%) | 81 |
0.554 (1.00) |
0.37 (1.00) |
1 (1.00) |
0.342 (1.00) |
0.281 (1.00) |
0.463 (1.00) |
0.774 (1.00) |
| 9p gain | 13 (11%) | 101 |
0.0226 (1.00) |
0.0252 (1.00) |
0.111 (1.00) |
0.809 (1.00) |
0.065 (1.00) |
0.704 (1.00) |
0.113 (1.00) |
| 9q gain | 11 (10%) | 103 |
0.0616 (1.00) |
0.266 (1.00) |
0.487 (1.00) |
0.802 (1.00) |
0.0692 (1.00) |
0.257 (1.00) |
0.71 (1.00) |
| 10p gain | 24 (21%) | 90 |
0.39 (1.00) |
0.934 (1.00) |
1 (1.00) |
0.83 (1.00) |
0.53 (1.00) |
0.303 (1.00) |
0.652 (1.00) |
| 10q gain | 7 (6%) | 107 |
0.453 (1.00) |
0.114 (1.00) |
1 (1.00) |
0.571 (1.00) |
0.364 (1.00) |
0.807 (1.00) |
|
| 11p gain | 6 (5%) | 108 |
0.0881 (1.00) |
0.113 (1.00) |
0.187 (1.00) |
0.0762 (1.00) |
0.506 (1.00) |
0.0695 (1.00) |
0.23 (1.00) |
| 11q gain | 7 (6%) | 107 |
0.389 (1.00) |
0.31 (1.00) |
0.187 (1.00) |
0.817 (1.00) |
0.837 (1.00) |
0.437 (1.00) |
0.535 (1.00) |
| 12p gain | 22 (19%) | 92 |
0.806 (1.00) |
0.804 (1.00) |
0.791 (1.00) |
0.491 (1.00) |
0.734 (1.00) |
0.514 (1.00) |
0.561 (1.00) |
| 12q gain | 17 (15%) | 97 |
0.268 (1.00) |
0.48 (1.00) |
0.149 (1.00) |
0.361 (1.00) |
0.82 (1.00) |
0.423 (1.00) |
0.973 (1.00) |
| 13q gain | 19 (17%) | 95 |
0.366 (1.00) |
0.738 (1.00) |
1 (1.00) |
0.575 (1.00) |
0.255 (1.00) |
0.88 (1.00) |
0.647 (1.00) |
| 14q gain | 10 (9%) | 104 |
0.6 (1.00) |
0.81 (1.00) |
0.456 (1.00) |
0.497 (1.00) |
0.254 (1.00) |
0.527 (1.00) |
0.383 (1.00) |
| 15q gain | 4 (4%) | 110 |
0.111 (1.00) |
0.817 (1.00) |
1 (1.00) |
0.466 (1.00) |
|||
| 16p gain | 9 (8%) | 105 |
0.00107 (0.518) |
0.388 (1.00) |
0.252 (1.00) |
0.638 (1.00) |
0.2 (1.00) |
0.304 (1.00) |
|
| 16q gain | 11 (10%) | 103 |
0.0252 (1.00) |
0.272 (1.00) |
0.0671 (1.00) |
0.495 (1.00) |
0.37 (1.00) |
0.848 (1.00) |
0.269 (1.00) |
| 17p gain | 8 (7%) | 106 |
0.506 (1.00) |
0.982 (1.00) |
0.681 (1.00) |
0.813 (1.00) |
0.618 (1.00) |
0.973 (1.00) |
|
| 17q gain | 19 (17%) | 95 |
0.603 (1.00) |
0.532 (1.00) |
0.778 (1.00) |
0.0871 (1.00) |
0.482 (1.00) |
0.47 (1.00) |
0.277 (1.00) |
| 18p gain | 21 (18%) | 93 |
0.743 (1.00) |
0.778 (1.00) |
0.588 (1.00) |
0.431 (1.00) |
0.246 (1.00) |
0.316 (1.00) |
0.0822 (1.00) |
| 18q gain | 7 (6%) | 107 |
0.0485 (1.00) |
0.807 (1.00) |
1 (1.00) |
0.628 (1.00) |
0.525 (1.00) |
0.23 (1.00) |
|
| 19p gain | 13 (11%) | 101 |
0.828 (1.00) |
0.904 (1.00) |
1 (1.00) |
0.117 (1.00) |
0.498 (1.00) |
0.551 (1.00) |
0.571 (1.00) |
| 19q gain | 26 (23%) | 88 |
0.18 (1.00) |
0.889 (1.00) |
0.329 (1.00) |
0.179 (1.00) |
0.182 (1.00) |
0.479 (1.00) |
0.449 (1.00) |
| 20p gain | 47 (41%) | 67 |
0.66 (1.00) |
0.916 (1.00) |
0.395 (1.00) |
0.674 (1.00) |
0.111 (1.00) |
0.174 (1.00) |
0.831 (1.00) |
| 20q gain | 48 (42%) | 66 |
0.47 (1.00) |
0.361 (1.00) |
0.677 (1.00) |
0.705 (1.00) |
0.0458 (1.00) |
0.163 (1.00) |
0.11 (1.00) |
| 21q gain | 22 (19%) | 92 |
0.287 (1.00) |
0.268 (1.00) |
1 (1.00) |
0.849 (1.00) |
0.442 (1.00) |
0.673 (1.00) |
0.851 (1.00) |
| 22q gain | 11 (10%) | 103 |
0.0625 (1.00) |
0.556 (1.00) |
0.724 (1.00) |
0.562 (1.00) |
0.34 (1.00) |
0.205 (1.00) |
0.00924 (1.00) |
| Xq gain | 6 (5%) | 108 |
0.607 (1.00) |
0.678 (1.00) |
0.663 (1.00) |
0.377 (1.00) |
0.488 (1.00) |
||
| 2p loss | 7 (6%) | 107 |
0.643 (1.00) |
0.666 (1.00) |
0.672 (1.00) |
0.827 (1.00) |
0.191 (1.00) |
0.903 (1.00) |
0.596 (1.00) |
| 2q loss | 15 (13%) | 99 |
0.0373 (1.00) |
0.626 (1.00) |
0.756 (1.00) |
0.549 (1.00) |
0.168 (1.00) |
0.934 (1.00) |
0.99 (1.00) |
| 3p loss | 9 (8%) | 105 |
0.962 (1.00) |
0.671 (1.00) |
0.252 (1.00) |
0.366 (1.00) |
0.77 (1.00) |
0.0635 (1.00) |
|
| 4p loss | 22 (19%) | 92 |
0.576 (1.00) |
0.811 (1.00) |
1 (1.00) |
0.0813 (1.00) |
0.591 (1.00) |
0.608 (1.00) |
0.791 (1.00) |
| 4q loss | 21 (18%) | 93 |
0.786 (1.00) |
0.881 (1.00) |
0.792 (1.00) |
0.0813 (1.00) |
0.856 (1.00) |
0.409 (1.00) |
0.835 (1.00) |
| 5p loss | 12 (11%) | 102 |
0.318 (1.00) |
0.305 (1.00) |
0.303 (1.00) |
0.0871 (1.00) |
0.858 (1.00) |
0.212 (1.00) |
0.118 (1.00) |
| 5q loss | 26 (23%) | 88 |
0.568 (1.00) |
0.375 (1.00) |
1 (1.00) |
0.811 (1.00) |
0.0918 (1.00) |
0.574 (1.00) |
0.261 (1.00) |
| 6q loss | 26 (23%) | 88 |
0.318 (1.00) |
0.838 (1.00) |
0.625 (1.00) |
0.21 (1.00) |
0.138 (1.00) |
0.202 (1.00) |
0.0661 (1.00) |
| 8p loss | 39 (34%) | 75 |
0.0745 (1.00) |
0.96 (1.00) |
0.515 (1.00) |
0.248 (1.00) |
0.477 (1.00) |
0.276 (1.00) |
0.82 (1.00) |
| 8q loss | 4 (4%) | 110 |
0.551 (1.00) |
0.136 (1.00) |
0.298 (1.00) |
0.86 (1.00) |
0.664 (1.00) |
0.868 (1.00) |
|
| 9p loss | 36 (32%) | 78 |
0.776 (1.00) |
0.527 (1.00) |
0.26 (1.00) |
0.809 (1.00) |
0.287 (1.00) |
0.352 (1.00) |
0.14 (1.00) |
| 9q loss | 34 (30%) | 80 |
0.64 (1.00) |
0.896 (1.00) |
0.17 (1.00) |
0.726 (1.00) |
0.187 (1.00) |
0.524 (1.00) |
0.41 (1.00) |
| 10p loss | 18 (16%) | 96 |
0.525 (1.00) |
0.957 (1.00) |
0.776 (1.00) |
0.0164 (1.00) |
0.541 (1.00) |
0.525 (1.00) |
0.00369 (1.00) |
| 10q loss | 24 (21%) | 90 |
0.505 (1.00) |
0.0518 (1.00) |
0.801 (1.00) |
0.192 (1.00) |
0.503 (1.00) |
0.825 (1.00) |
0.0536 (1.00) |
| 11p loss | 39 (34%) | 75 |
0.437 (1.00) |
0.155 (1.00) |
0.658 (1.00) |
0.04 (1.00) |
0.695 (1.00) |
0.84 (1.00) |
0.732 (1.00) |
| 11q loss | 29 (25%) | 85 |
0.83 (1.00) |
0.613 (1.00) |
0.81 (1.00) |
0.747 (1.00) |
0.253 (1.00) |
0.57 (1.00) |
0.499 (1.00) |
| 12p loss | 5 (4%) | 109 |
0.986 (1.00) |
0.309 (1.00) |
0.321 (1.00) |
0.905 (1.00) |
0.195 (1.00) |
||
| 12q loss | 8 (7%) | 106 |
0.126 (1.00) |
0.778 (1.00) |
0.444 (1.00) |
0.545 (1.00) |
0.824 (1.00) |
0.877 (1.00) |
0.97 (1.00) |
| 13q loss | 16 (14%) | 98 |
0.799 (1.00) |
0.695 (1.00) |
0.228 (1.00) |
0.0137 (1.00) |
0.666 (1.00) |
0.658 (1.00) |
0.00728 (1.00) |
| 14q loss | 19 (17%) | 95 |
0.216 (1.00) |
0.479 (1.00) |
0.271 (1.00) |
0.725 (1.00) |
0.0781 (1.00) |
0.0562 (1.00) |
0.789 (1.00) |
| 15q loss | 14 (12%) | 100 |
0.196 (1.00) |
0.893 (1.00) |
0.523 (1.00) |
0.761 (1.00) |
0.703 (1.00) |
0.936 (1.00) |
0.271 (1.00) |
| 16p loss | 13 (11%) | 101 |
0.39 (1.00) |
0.162 (1.00) |
0.111 (1.00) |
0.0815 (1.00) |
0.641 (1.00) |
0.733 (1.00) |
0.00886 (1.00) |
| 17p loss | 35 (31%) | 79 |
0.232 (1.00) |
0.773 (1.00) |
0.823 (1.00) |
0.76 (1.00) |
0.232 (1.00) |
0.936 (1.00) |
0.565 (1.00) |
| 17q loss | 5 (4%) | 109 |
0.812 (1.00) |
0.417 (1.00) |
1 (1.00) |
0.725 (1.00) |
0.611 (1.00) |
0.885 (1.00) |
|
| 18p loss | 18 (16%) | 96 |
0.114 (1.00) |
0.0547 (1.00) |
0.568 (1.00) |
0.31 (1.00) |
0.499 (1.00) |
0.379 (1.00) |
0.797 (1.00) |
| 18q loss | 33 (29%) | 81 |
0.0173 (1.00) |
0.043 (1.00) |
0.171 (1.00) |
0.637 (1.00) |
0.554 (1.00) |
0.233 (1.00) |
0.242 (1.00) |
| 19p loss | 7 (6%) | 107 |
0.938 (1.00) |
0.672 (1.00) |
1 (1.00) |
0.332 (1.00) |
0.184 (1.00) |
0.499 (1.00) |
|
| 19q loss | 4 (4%) | 110 |
0.339 (1.00) |
0.777 (1.00) |
0.573 (1.00) |
0.373 (1.00) |
|||
| 20p loss | 4 (4%) | 110 |
0.897 (1.00) |
0.24 (1.00) |
1 (1.00) |
0.0395 (1.00) |
0.107 (1.00) |
0.679 (1.00) |
|
| 22q loss | 23 (20%) | 91 |
0.192 (1.00) |
0.601 (1.00) |
0.794 (1.00) |
0.162 (1.00) |
0.63 (1.00) |
0.998 (1.00) |
0.084 (1.00) |
P value = 0.000438 (Fisher's exact test), Q value = 0.21
Table S1. Gene #3: '2p gain mutation analysis' versus Clinical Feature #3: 'GENDER'
| nPatients | FEMALE | MALE |
|---|---|---|
| ALL | 31 | 83 |
| 2P GAIN MUTATED | 13 | 9 |
| 2P GAIN WILD-TYPE | 18 | 74 |
Figure S1. Get High-res Image Gene #3: '2p gain mutation analysis' versus Clinical Feature #3: 'GENDER'
P value = 8.85e-05 (t-test), Q value = 0.043
Table S2. Gene #48: '6p loss mutation analysis' versus Clinical Feature #4: 'KARNOFSKY.PERFORMANCE.SCORE'
| nPatients | Mean (Std.Dev) | |
|---|---|---|
| ALL | 35 | 77.7 (16.6) |
| 6P LOSS MUTATED | 4 | 90.0 (0.0) |
| 6P LOSS WILD-TYPE | 31 | 76.1 (17.1) |
Figure S2. Get High-res Image Gene #48: '6p loss mutation analysis' versus Clinical Feature #4: 'KARNOFSKY.PERFORMANCE.SCORE'

P value = 0.000181 (t-test), Q value = 0.088
Table S3. Gene #64: '16q loss mutation analysis' versus Clinical Feature #7: 'TOBACCOSMOKINGHISTORYINDICATOR'
| nPatients | Mean (Std.Dev) | |
|---|---|---|
| ALL | 108 | 2.6 (1.1) |
| 16Q LOSS MUTATED | 14 | 3.4 (0.6) |
| 16Q LOSS WILD-TYPE | 94 | 2.5 (1.2) |
Figure S3. Get High-res Image Gene #64: '16q loss mutation analysis' versus Clinical Feature #7: 'TOBACCOSMOKINGHISTORYINDICATOR'
P value = 0.000289 (t-test), Q value = 0.14
Table S4. Gene #72: '21q loss mutation analysis' versus Clinical Feature #2: 'AGE'
| nPatients | Mean (Std.Dev) | |
|---|---|---|
| ALL | 113 | 67.2 (11.1) |
| 21Q LOSS MUTATED | 11 | 58.5 (6.2) |
| 21Q LOSS WILD-TYPE | 102 | 68.2 (11.1) |
Figure S4. Get High-res Image Gene #72: '21q loss mutation analysis' versus Clinical Feature #2: 'AGE'

P value = 8.23e-05 (t-test), Q value = 0.04
Table S5. Gene #72: '21q loss mutation analysis' versus Clinical Feature #4: 'KARNOFSKY.PERFORMANCE.SCORE'
| nPatients | Mean (Std.Dev) | |
|---|---|---|
| ALL | 35 | 77.7 (16.6) |
| 21Q LOSS MUTATED | 5 | 90.0 (0.0) |
| 21Q LOSS WILD-TYPE | 30 | 75.7 (17.2) |
Figure S5. Get High-res Image Gene #72: '21q loss mutation analysis' versus Clinical Feature #4: 'KARNOFSKY.PERFORMANCE.SCORE'
-
Mutation data file = broad_values_by_arm.mutsig.cluster.txt
-
Clinical data file = BLCA-TP.clin.merged.picked.txt
-
Number of patients = 114
-
Number of significantly arm-level cnvs = 73
-
Number of selected clinical features = 7
-
Exclude genes that fewer than K tumors have mutations, K = 3
For survival clinical features, the Kaplan-Meier survival curves of tumors with and without gene mutations were plotted and the statistical significance P values were estimated by logrank test (Bland and Altman 2004) using the 'survdiff' function in R
For continuous numerical clinical features, two-tailed Student's t test with unequal variance (Lehmann and Romano 2005) was applied to compare the clinical values between tumors with and without gene mutations using 't.test' function in R
For binary or multi-class clinical features (nominal or ordinal), two-tailed Fisher's exact tests (Fisher 1922) were used to estimate the P values using the 'fisher.test' function in R
For multiple hypothesis correction, Q value is the False Discovery Rate (FDR) analogue of the P value (Benjamini and Hochberg 1995), defined as the minimum FDR at which the test may be called significant. We used the 'Benjamini and Hochberg' method of 'p.adjust' function in R to convert P values into Q values.
This is an experimental feature. The full results of the analysis summarized in this report can be downloaded from the TCGA Data Coordination Center.