(primary solid tumor cohort)
This pipeline computes the correlation between significantly recurrent gene mutations and selected clinical features.
Testing the association between mutation status of 7 genes and 6 clinical features across 28 patients, one significant finding detected with Q value < 0.25.
-
KDM6A mutation correlated to 'STOPPEDSMOKINGYEAR'.
Table 1. Get Full Table Overview of the association between mutation status of 7 genes and 6 clinical features. Shown in the table are P values (Q values). Thresholded by Q value < 0.25, one significant finding detected.
|
Clinical Features |
Time to Death |
AGE | GENDER | NUMBERPACKYEARSSMOKED | STOPPEDSMOKINGYEAR | TOBACCOSMOKINGHISTORYINDICATOR | ||
| nMutated (%) | nWild-Type | logrank test | t-test | Fisher's exact test | t-test | t-test | t-test | |
| KDM6A | 6 (21%) | 22 |
0.675 (1.00) |
0.503 (1.00) |
0.634 (1.00) |
0.00162 (0.0535) |
0.428 (1.00) |
|
| TP53 | 11 (39%) | 17 |
0.825 (1.00) |
0.529 (1.00) |
1 (1.00) |
0.543 (1.00) |
0.395 (1.00) |
0.78 (1.00) |
| FBXW7 | 5 (18%) | 23 |
0.894 (1.00) |
0.233 (1.00) |
1 (1.00) |
0.324 (1.00) |
0.31 (1.00) |
|
| GPS2 | 3 (11%) | 25 |
0.803 (1.00) |
0.115 (1.00) |
1 (1.00) |
0.671 (1.00) |
||
| NFE2L2 | 4 (14%) | 24 |
0.647 (1.00) |
0.839 (1.00) |
0.0103 (0.328) |
0.112 (1.00) |
||
| HCN1 | 4 (14%) | 24 |
0.295 (1.00) |
0.637 (1.00) |
0.601 (1.00) |
0.0795 (1.00) |
0.815 (1.00) |
|
| ARID1A | 6 (21%) | 22 |
0.534 (1.00) |
0.788 (1.00) |
1 (1.00) |
0.557 (1.00) |
P value = 0.00162 (t-test), Q value = 0.054
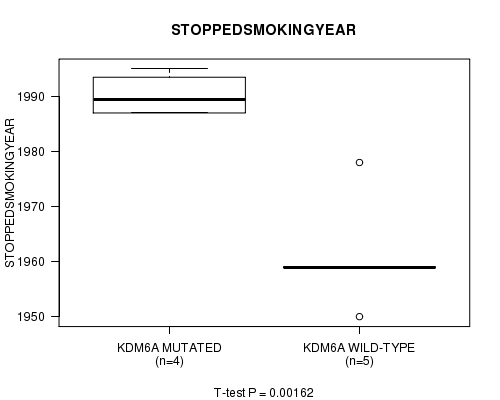
Table S1. Gene #2: 'KDM6A MUTATION STATUS' versus Clinical Feature #5: 'STOPPEDSMOKINGYEAR'
| nPatients | Mean (Std.Dev) | |
|---|---|---|
| ALL | 9 | 1974.0 (17.2) |
| KDM6A MUTATED | 4 | 1990.2 (3.9) |
| KDM6A WILD-TYPE | 5 | 1961.0 (10.3) |
Figure S1. Get High-res Image Gene #2: 'KDM6A MUTATION STATUS' versus Clinical Feature #5: 'STOPPEDSMOKINGYEAR'
-
Mutation data file = BLCA-TP.mutsig.cluster.txt
-
Clinical data file = BLCA-TP.clin.merged.picked.txt
-
Number of patients = 28
-
Number of significantly mutated genes = 7
-
Number of selected clinical features = 6
-
Exclude genes that fewer than K tumors have mutations, K = 3
For survival clinical features, the Kaplan-Meier survival curves of tumors with and without gene mutations were plotted and the statistical significance P values were estimated by logrank test (Bland and Altman 2004) using the 'survdiff' function in R
For continuous numerical clinical features, two-tailed Student's t test with unequal variance (Lehmann and Romano 2005) was applied to compare the clinical values between tumors with and without gene mutations using 't.test' function in R
For binary or multi-class clinical features (nominal or ordinal), two-tailed Fisher's exact tests (Fisher 1922) were used to estimate the P values using the 'fisher.test' function in R
For multiple hypothesis correction, Q value is the False Discovery Rate (FDR) analogue of the P value (Benjamini and Hochberg 1995), defined as the minimum FDR at which the test may be called significant. We used the 'Benjamini and Hochberg' method of 'p.adjust' function in R to convert P values into Q values.
This is an experimental feature. The full results of the analysis summarized in this report can be downloaded from the TCGA Data Coordination Center.