(primary solid tumor cohort)
This pipeline uses various statistical tests to identify mRNAs whose expression levels correlated to selected clinical features.
Testing the association between 17814 genes and 4 clinical features across 527 samples, statistically thresholded by Q value < 0.05, 4 clinical features related to at least one genes.
-
2 genes correlated to 'Time to Death'.
-
RPS26 , PPP1R14D
-
427 genes correlated to 'AGE'.
-
ESR1 , CNTNAP3 , KRT17 , MAGED4B , KLK6 , ...
-
6 genes correlated to 'GENDER'.
-
PI3 , TMEM16C , CACNG1 , RP13-36C9.6 , MAPK4 , ...
-
3 genes correlated to 'RADIATIONS.RADIATION.REGIMENINDICATION'.
-
OR13C4 , TMEM92 , CYP3A5
Complete statistical result table is provided in Supplement Table 1
Table 1. Get Full Table This table shows the clinical features, statistical methods used, and the number of genes that are significantly associated with each clinical feature at Q value < 0.05.
| Clinical feature | Statistical test | Significant genes | Associated with | Associated with | ||
|---|---|---|---|---|---|---|
| Time to Death | Cox regression test | N=2 | shorter survival | N=2 | longer survival | N=0 |
| AGE | Spearman correlation test | N=427 | older | N=205 | younger | N=222 |
| GENDER | t test | N=6 | male | N=1 | female | N=5 |
| RADIATIONS RADIATION REGIMENINDICATION | t test | N=3 | yes | N=3 | no | N=0 |
Table S1. Basic characteristics of clinical feature: 'Time to Death'
| Time to Death | Duration (Months) | 0.1-223.4 (median=24.2) |
| censored | N = 430 | |
| death | N = 65 | |
| Significant markers | N = 2 | |
| associated with shorter survival | 2 | |
| associated with longer survival | 0 |
Table S2. Get Full Table List of 2 genes significantly associated with 'Time to Death' by Cox regression test
| HazardRatio | Wald_P | Q | C_index | |
|---|---|---|---|---|
| RPS26 | 2.7 | 9.679e-08 | 0.0017 | 0.682 |
| PPP1R14D | 2.3 | 2.923e-07 | 0.0052 | 0.592 |
Figure S1. Get High-res Image As an example, this figure shows the association of RPS26 to 'Time to Death'. four curves present the cumulative survival rates of 4 quartile subsets of patients. P value = 9.68e-08 with univariate Cox regression analysis using continuous log-2 expression values.

Table S3. Basic characteristics of clinical feature: 'AGE'
| AGE | Mean (SD) | 57.88 (13) |
| Significant markers | N = 427 | |
| pos. correlated | 205 | |
| neg. correlated | 222 |
Table S4. Get Full Table List of top 10 genes significantly correlated to 'AGE' by Spearman correlation test
| SpearmanCorr | corrP | Q | |
|---|---|---|---|
| ESR1 | 0.4215 | 4.056e-24 | 7.22e-20 |
| CNTNAP3 | -0.3002 | 1.939e-12 | 3.45e-08 |
| KRT17 | -0.2978 | 2.98e-12 | 5.31e-08 |
| MAGED4B | -0.2961 | 4.005e-12 | 7.13e-08 |
| KLK6 | -0.293 | 6.874e-12 | 1.22e-07 |
| FOXD2 | 0.2923 | 7.731e-12 | 1.38e-07 |
| NUDT16 | 0.2903 | 1.079e-11 | 1.92e-07 |
| PPP1R14C | -0.2899 | 1.158e-11 | 2.06e-07 |
| MGC102966 | -0.2878 | 1.652e-11 | 2.94e-07 |
| SYT8 | -0.2875 | 1.736e-11 | 3.09e-07 |
Figure S2. Get High-res Image As an example, this figure shows the association of ESR1 to 'AGE'. P value = 4.06e-24 with Spearman correlation analysis. The straight line presents the best linear regression.
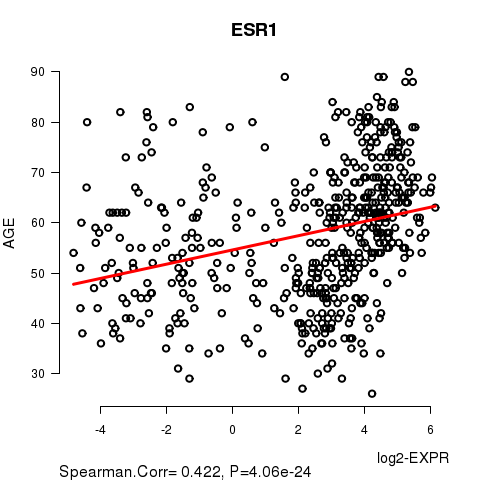
Table S5. Basic characteristics of clinical feature: 'GENDER'
| GENDER | Labels | N |
| FEMALE | 521 | |
| MALE | 6 | |
| Significant markers | N = 6 | |
| Higher in MALE | 1 | |
| Higher in FEMALE | 5 |
Table S6. Get Full Table List of 6 genes differentially expressed by 'GENDER'
| T(pos if higher in 'MALE') | ttestP | Q | AUC | |
|---|---|---|---|---|
| PI3 | -9.27 | 5.072e-11 | 9.03e-07 | 0.7086 |
| TMEM16C | -14.25 | 1.281e-10 | 2.28e-06 | 0.9258 |
| CACNG1 | 18.37 | 1.822e-08 | 0.000325 | 0.961 |
| RP13-36C9.6 | -6.21 | 9.464e-07 | 0.0169 | 0.6638 |
| MAPK4 | -9.12 | 1.385e-06 | 0.0247 | 0.802 |
| PLA2G3 | -10.63 | 1.726e-06 | 0.0307 | 0.8305 |
Figure S3. Get High-res Image As an example, this figure shows the association of PI3 to 'GENDER'. P value = 5.07e-11 with T-test analysis.

3 genes related to 'RADIATIONS.RADIATION.REGIMENINDICATION'.
Table S7. Basic characteristics of clinical feature: 'RADIATIONS.RADIATION.REGIMENINDICATION'
| RADIATIONS.RADIATION.REGIMENINDICATION | Labels | N |
| NO | 147 | |
| YES | 380 | |
| Significant markers | N = 3 | |
| Higher in YES | 3 | |
| Higher in NO | 0 |
Table S8. Get Full Table List of 3 genes differentially expressed by 'RADIATIONS.RADIATION.REGIMENINDICATION'
| T(pos if higher in 'YES') | ttestP | Q | AUC | |
|---|---|---|---|---|
| OR13C4 | 5.07 | 7.753e-07 | 0.0138 | 0.6285 |
| TMEM92 | 4.79 | 2.397e-06 | 0.0427 | 0.6062 |
| CYP3A5 | 4.76 | 2.605e-06 | 0.0464 | 0.5828 |
Figure S4. Get High-res Image As an example, this figure shows the association of OR13C4 to 'RADIATIONS.RADIATION.REGIMENINDICATION'. P value = 7.75e-07 with T-test analysis.

-
Expresson data file = BRCA-TP.medianexp.txt
-
Clinical data file = BRCA-TP.clin.merged.picked.txt
-
Number of patients = 527
-
Number of genes = 17814
-
Number of clinical features = 4
For survival clinical features, Wald's test in univariate Cox regression analysis with proportional hazards model (Andersen and Gill 1982) was used to estimate the P values using the 'coxph' function in R. Kaplan-Meier survival curves were plot using the four quartile subgroups of patients based on expression levels
For continuous numerical clinical features, Spearman's rank correlation coefficients (Spearman 1904) and two-tailed P values were estimated using 'cor.test' function in R
For two-class clinical features, two-tailed Student's t test with unequal variance (Lehmann and Romano 2005) was applied to compare the log2-expression levels between the two clinical classes using 't.test' function in R
For multiple hypothesis correction, Q value is the False Discovery Rate (FDR) analogue of the P value (Benjamini and Hochberg 1995), defined as the minimum FDR at which the test may be called significant. We used the 'Benjamini and Hochberg' method of 'p.adjust' function in R to convert P values into Q values.
This is an experimental feature. The full results of the analysis summarized in this report can be downloaded from the TCGA Data Coordination Center.