(primary solid tumor cohort)
This pipeline uses various statistical tests to identify genes whose promoter methylation levels correlated to selected clinical features.
Testing the association between 17318 genes and 4 clinical features across 527 samples, statistically thresholded by Q value < 0.05, 4 clinical features related to at least one genes.
-
1 gene correlated to 'Time to Death'.
-
CDC73
-
131 genes correlated to 'AGE'.
-
KIF15 , MEX3C , LGALS8 , EGR2 , C10ORF35 , ...
-
191 genes correlated to 'GENDER'.
-
ALDOC , ZNF486 , CRIP1 , DNAJC15 , NMNAT3 , ...
-
224 genes correlated to 'RADIATIONS.RADIATION.REGIMENINDICATION'.
-
CCDC86 , PRR7 , TUBA4B , CCDC85B , HS1BP3 , ...
Complete statistical result table is provided in Supplement Table 1
Table 1. Get Full Table This table shows the clinical features, statistical methods used, and the number of genes that are significantly associated with each clinical feature at Q value < 0.05.
| Clinical feature | Statistical test | Significant genes | Associated with | Associated with | ||
|---|---|---|---|---|---|---|
| Time to Death | Cox regression test | N=1 | shorter survival | N=0 | longer survival | N=1 |
| AGE | Spearman correlation test | N=131 | older | N=119 | younger | N=12 |
| GENDER | t test | N=191 | male | N=42 | female | N=149 |
| RADIATIONS RADIATION REGIMENINDICATION | t test | N=224 | yes | N=165 | no | N=59 |
Table S1. Basic characteristics of clinical feature: 'Time to Death'
| Time to Death | Duration (Months) | 0-223.4 (median=18.1) |
| censored | N = 441 | |
| death | N = 58 | |
| Significant markers | N = 1 | |
| associated with shorter survival | 0 | |
| associated with longer survival | 1 |
Table S2. Get Full Table List of one gene significantly associated with 'Time to Death' by Cox regression test
| HazardRatio | Wald_P | Q | C_index | |
|---|---|---|---|---|
| CDC73 | 0 | 1.411e-06 | 0.024 | 0.355 |
Figure S1. Get High-res Image As an example, this figure shows the association of CDC73 to 'Time to Death'. four curves present the cumulative survival rates of 4 quartile subsets of patients. P value = 1.41e-06 with univariate Cox regression analysis using continuous log-2 expression values.

Table S3. Basic characteristics of clinical feature: 'AGE'
| AGE | Mean (SD) | 57.6 (13) |
| Significant markers | N = 131 | |
| pos. correlated | 119 | |
| neg. correlated | 12 |
Table S4. Get Full Table List of top 10 genes significantly correlated to 'AGE' by Spearman correlation test
| SpearmanCorr | corrP | Q | |
|---|---|---|---|
| KIF15 | 0.3161 | 1.139e-13 | 1.97e-09 |
| MEX3C | 0.2858 | 2.412e-11 | 4.18e-07 |
| LGALS8 | -0.2843 | 3.097e-11 | 5.36e-07 |
| EGR2 | 0.2835 | 3.52e-11 | 6.09e-07 |
| C10ORF35 | 0.2816 | 4.795e-11 | 8.3e-07 |
| RPL13A | 0.2785 | 7.92e-11 | 1.37e-06 |
| FASN | 0.2741 | 1.625e-10 | 2.81e-06 |
| RPL27A | 0.2665 | 5.321e-10 | 9.21e-06 |
| RPL7A | 0.2637 | 8.18e-10 | 1.42e-05 |
| CACNA2D1 | 0.2624 | 9.868e-10 | 1.71e-05 |
Figure S2. Get High-res Image As an example, this figure shows the association of KIF15 to 'AGE'. P value = 1.14e-13 with Spearman correlation analysis. The straight line presents the best linear regression.

Table S5. Basic characteristics of clinical feature: 'GENDER'
| GENDER | Labels | N |
| FEMALE | 521 | |
| MALE | 6 | |
| Significant markers | N = 191 | |
| Higher in MALE | 42 | |
| Higher in FEMALE | 149 |
Table S6. Get Full Table List of top 10 genes differentially expressed by 'GENDER'
| T(pos if higher in 'MALE') | ttestP | Q | AUC | |
|---|---|---|---|---|
| ALDOC | -25.53 | 1.209e-92 | 2.09e-88 | 0.8669 |
| ZNF486 | -18.31 | 4.367e-58 | 7.56e-54 | 0.818 |
| CRIP1 | -16.85 | 3.091e-51 | 5.35e-47 | 0.872 |
| DNAJC15 | -13.79 | 8.918e-36 | 1.54e-31 | 0.7335 |
| NMNAT3 | -13.17 | 6.929e-34 | 1.2e-29 | 0.6916 |
| LOC400043 | -13.08 | 5.536e-31 | 9.58e-27 | 0.6022 |
| RND2 | -13.18 | 1.514e-28 | 2.62e-24 | 0.7927 |
| EML1 | -11.41 | 7.128e-27 | 1.23e-22 | 0.6081 |
| SPC25 | -12.19 | 2.831e-26 | 4.9e-22 | 0.7521 |
| HSPC157 | -12.91 | 7.833e-25 | 1.36e-20 | 0.6312 |
Figure S3. Get High-res Image As an example, this figure shows the association of ALDOC to 'GENDER'. P value = 1.21e-92 with T-test analysis.

224 genes related to 'RADIATIONS.RADIATION.REGIMENINDICATION'.
Table S7. Basic characteristics of clinical feature: 'RADIATIONS.RADIATION.REGIMENINDICATION'
| RADIATIONS.RADIATION.REGIMENINDICATION | Labels | N |
| NO | 130 | |
| YES | 397 | |
| Significant markers | N = 224 | |
| Higher in YES | 165 | |
| Higher in NO | 59 |
Table S8. Get Full Table List of top 10 genes differentially expressed by 'RADIATIONS.RADIATION.REGIMENINDICATION'
| T(pos if higher in 'YES') | ttestP | Q | AUC | |
|---|---|---|---|---|
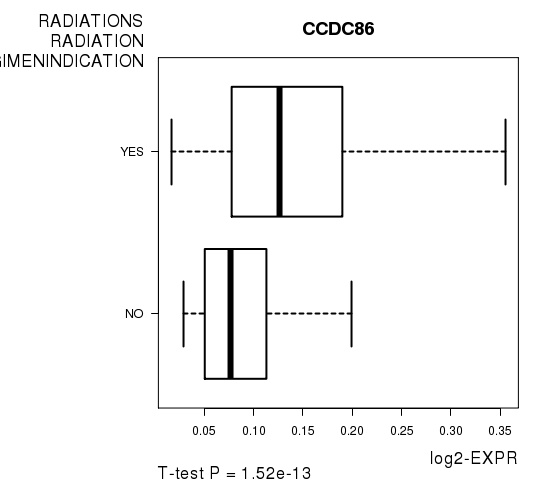
| CCDC86 | 7.77 | 1.517e-13 | 2.63e-09 | 0.7058 |
| PRR7 | 7.25 | 3.485e-12 | 6.04e-08 | 0.6855 |
| TUBA4B | 7.14 | 4.371e-12 | 7.57e-08 | 0.6624 |
| CCDC85B | 7.19 | 5.453e-12 | 9.44e-08 | 0.6828 |
| HS1BP3 | 7.04 | 1.148e-11 | 1.99e-07 | 0.682 |
| TFAP4 | 6.96 | 1.633e-11 | 2.83e-07 | 0.6602 |
| ERP29 | 6.84 | 2.699e-11 | 4.67e-07 | 0.7015 |
| MAP1LC3B2 | -6.99 | 2.976e-11 | 5.15e-07 | 0.6877 |
| DDX54 | 6.91 | 3.021e-11 | 5.23e-07 | 0.6728 |
| NDUFB4 | 6.91 | 3.406e-11 | 5.9e-07 | 0.6827 |
Figure S4. Get High-res Image As an example, this figure shows the association of CCDC86 to 'RADIATIONS.RADIATION.REGIMENINDICATION'. P value = 1.52e-13 with T-test analysis.
-
Expresson data file = BRCA-TP.meth.for_correlation.filtered_data.txt
-
Clinical data file = BRCA-TP.clin.merged.picked.txt
-
Number of patients = 527
-
Number of genes = 17318
-
Number of clinical features = 4
For survival clinical features, Wald's test in univariate Cox regression analysis with proportional hazards model (Andersen and Gill 1982) was used to estimate the P values using the 'coxph' function in R. Kaplan-Meier survival curves were plot using the four quartile subgroups of patients based on expression levels
For continuous numerical clinical features, Spearman's rank correlation coefficients (Spearman 1904) and two-tailed P values were estimated using 'cor.test' function in R
For two-class clinical features, two-tailed Student's t test with unequal variance (Lehmann and Romano 2005) was applied to compare the log2-expression levels between the two clinical classes using 't.test' function in R
For multiple hypothesis correction, Q value is the False Discovery Rate (FDR) analogue of the P value (Benjamini and Hochberg 1995), defined as the minimum FDR at which the test may be called significant. We used the 'Benjamini and Hochberg' method of 'p.adjust' function in R to convert P values into Q values.
This is an experimental feature. The full results of the analysis summarized in this report can be downloaded from the TCGA Data Coordination Center.