(primary solid tumor cohort)
This report serves to describe the mutational landscape and properties of a given individual set, as well as rank genes and genesets according to mutational significance. MutSig v2.0 was used to generate the results found in this report.
-
Working with individual set: BRCA-TP
-
Number of patients in set: 507
The input for this pipeline is a set of individuals with the following files associated for each:
-
An annotated .maf file describing the mutations called for the respective individual, and their properties.
-
A .wig file that contains information about the coverage of the sample.
-
MAF used for this analysis:BRCA-TP.final_analysis_set.maf
-
Significantly mutated genes (q ≤ 0.1): 39
-
Mutations seen in COSMIC: 500
-
Significantly mutated genes in COSMIC territory: 16
-
Genes with clustered mutations (≤ 3 aa apart): 269
-
Significantly mutated genesets: 117
-
Significantly mutated genesets: (excluding sig. mutated genes):0
-
Read 507 MAFs of type "WashU"
-
Total number of mutations in input MAFs: 33982
-
After removing 41 mutations outside chr1-24: 33941
-
After removing 190 blacklisted mutations: 33751
-
After removing 1624 noncoding mutations: 32127
-
After collapsing adjacent/redundant mutations: 31850
-
Number of mutations before filtering: 31850
-
After removing 1508 mutations outside gene set: 30342
-
After removing 148 mutations outside category set: 30194
Table 1. Get Full Table Table representing breakdown of mutations by type.
| type | count |
|---|---|
| Frame_Shift_Del | 953 |
| Frame_Shift_Ins | 308 |
| In_Frame_Del | 370 |
| In_Frame_Ins | 69 |
| Missense_Mutation | 19234 |
| Nonsense_Mutation | 1397 |
| Nonstop_Mutation | 34 |
| Silent | 7245 |
| Splice_Site | 584 |
| Total | 30194 |
Table 2. Get Full Table A breakdown of mutation rates per category discovered for this individual set.
| category | n | N | rate | rate_per_mb | relative_rate | exp_ns_s_ratio |
|---|---|---|---|---|---|---|
| *CpG->T | 3898 | 836685876 | 4.7e-06 | 4.7 | 3.2 | 2.1 |
| *Cp(A/C/T)->T | 4289 | 7060503801 | 6.1e-07 | 0.61 | 0.41 | 1.7 |
| C->(G/A) | 6945 | 7897189677 | 8.8e-07 | 0.88 | 0.6 | 4.8 |
| A->mut | 4096 | 7654859394 | 5.4e-07 | 0.54 | 0.36 | 3.9 |
| indel+null | 3662 | 15552049071 | 2.4e-07 | 0.24 | 0.16 | NaN |
| double_null | 59 | 15552049071 | 3.8e-09 | 0.0038 | 0.0026 | NaN |
| Total | 22949 | 15552049071 | 1.5e-06 | 1.5 | 1 | 3.5 |
The x axis represents the samples. The y axis represents the exons, one row per exon, and they are sorted by average coverage across samples. For exons with exactly the same average coverage, they are sorted next by the %GC of the exon. (The secondary sort is especially useful for the zero-coverage exons at the bottom).
Figure 1.
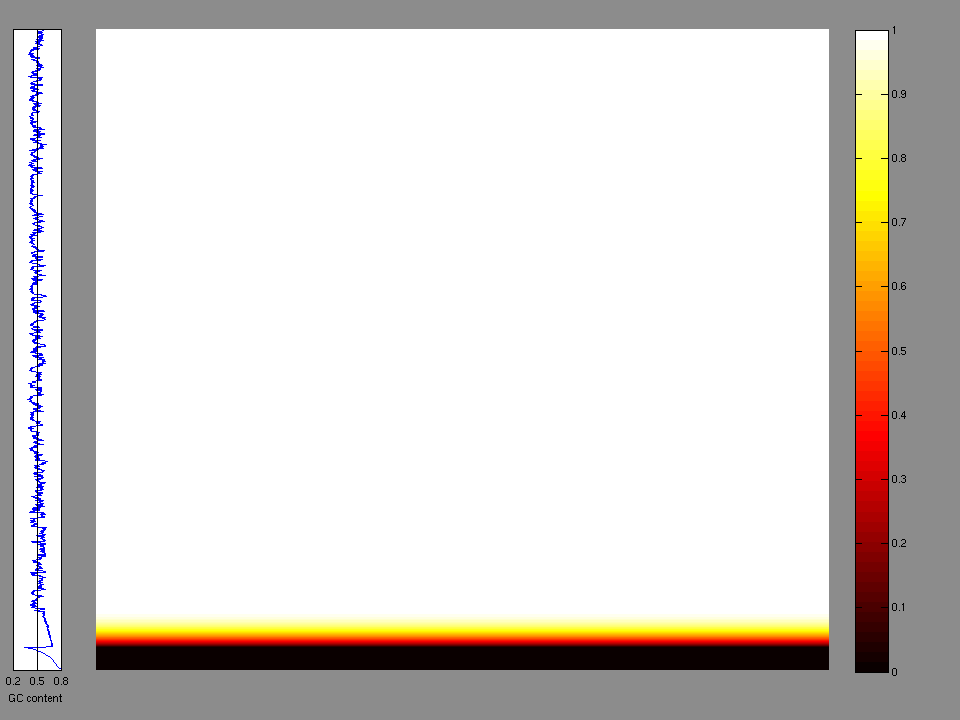
Figure 2. Patients counts and rates file used to generate this plot: BRCA-TP.patients.counts_and_rates.txt
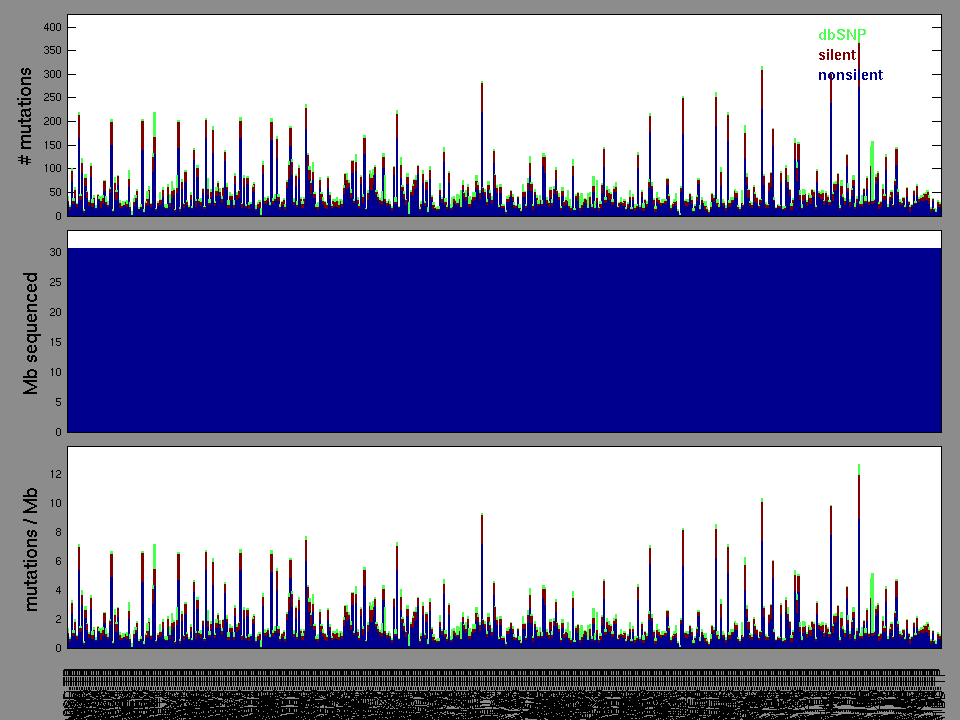
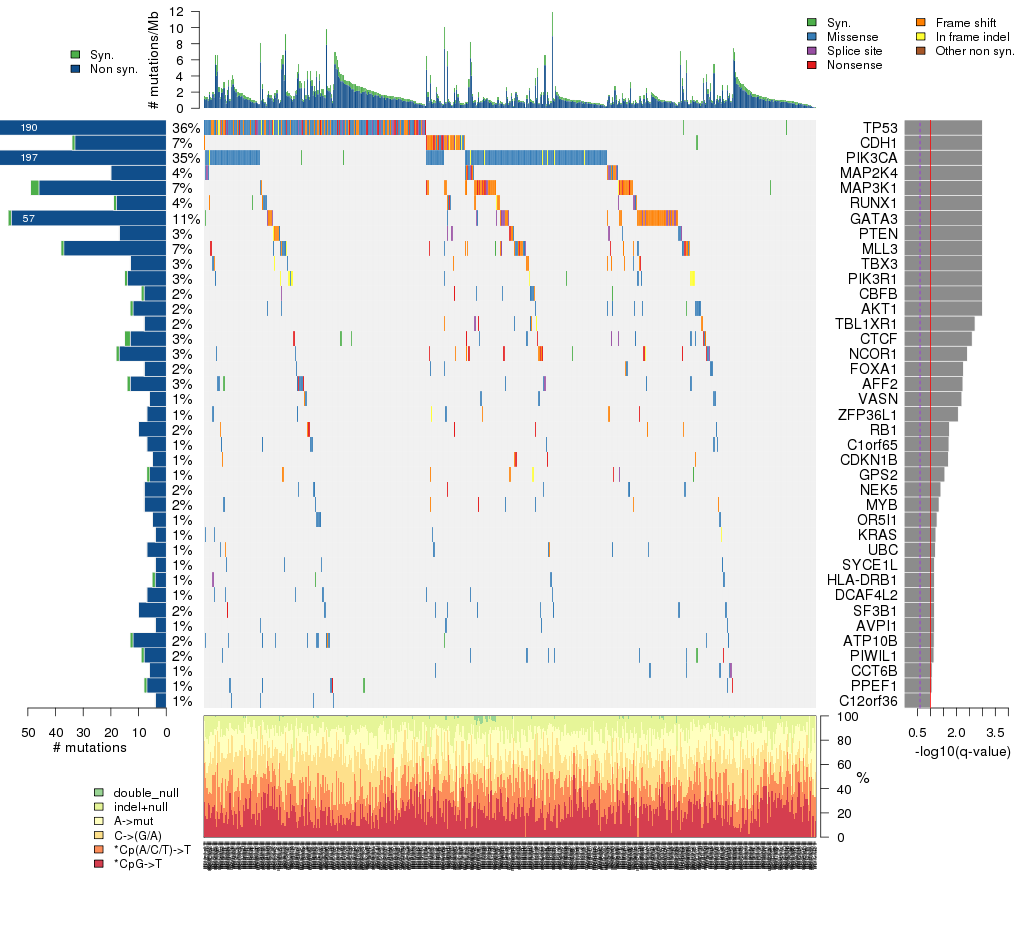
Figure 3. Get High-res Image The matrix in the center of the figure represents individual mutations in patient samples, color-coded by type of mutation, for the significantly mutated genes. The rate of synonymous and non-synonymous mutations is displayed at the top of the matrix. The barplot on the left of the matrix shows the number of mutations in each gene. The percentages represent the fraction of tumors with at least one mutation in the specified gene. The barplot to the right of the matrix displays the q-values for the most significantly mutated genes. The purple boxplots below the matrix (only displayed if required columns are present in the provided MAF) represent the distributions of allelic fractions observed in each sample. The plot at the bottom represents the base substitution distribution of individual samples, using the same categories that were used to calculate significance.
Column Descriptions:
-
N = number of sequenced bases in this gene across the individual set
-
n = number of (nonsilent) mutations in this gene across the individual set
-
npat = number of patients (individuals) with at least one nonsilent mutation
-
nsite = number of unique sites having a non-silent mutation
-
nsil = number of silent mutations in this gene across the individual set
-
n1 = number of nonsilent mutations of type: *CpG->T
-
n2 = number of nonsilent mutations of type: *Cp(A/C/T)->T
-
n3 = number of nonsilent mutations of type: C->(G/A)
-
n4 = number of nonsilent mutations of type: A->mut
-
n5 = number of nonsilent mutations of type: indel+null
-
n6 = number of nonsilent mutations of type: double_null
-
p_classic = p-value for the observed amount of nonsilent mutations being elevated in this gene
-
p_ns_s = p-value for the observed nonsilent/silent ratio being elevated in this gene
-
p_cons = p-value for enrichment of mutations at evolutionarily most-conserved sites in gene
-
p_joint = p-value for clustering + conservation
-
p = p-value (overall)
-
q = q-value, False Discovery Rate (Benjamini-Hochberg procedure)
Table 3. Get Full Table A Ranked List of Significantly Mutated Genes. Number of significant genes found: 39. Number of genes displayed: 35. Click on a gene name to display its stick figure depicting the distribution of mutations and mutation types across the chosen gene (this feature may not be available for all significant genes).
| rank | gene | description | N | n | npat | nsite | nsil | n1 | n2 | n3 | n4 | n5 | n6 | p_classic | p_ns_s | p_cons | p_joint | p | q |
|---|---|---|---|---|---|---|---|---|---|---|---|---|---|---|---|---|---|---|---|
| 1 | TP53 | tumor protein p53 | 649467 | 187 | 184 | 113 | 3 | 29 | 23 | 23 | 39 | 73 | 0 | <1.00e-15 | 3.33e-15 | NaN | NaN | <1.00e-15 | <9.14e-12 |
| 2 | CDH1 | cadherin 1, type 1, E-cadherin (epithelial) | 1347099 | 33 | 33 | 30 | 1 | 0 | 3 | 1 | 0 | 29 | 0 | <1.00e-15 | 0.0312 | NaN | NaN | <1.00e-15 | <9.14e-12 |
| 3 | PIK3CA | phosphoinositide-3-kinase, catalytic, alpha polypeptide | 1666509 | 194 | 178 | 32 | 3 | 3 | 70 | 8 | 105 | 8 | 0 | 1.78e-15 | <1.00e-15 | NaN | NaN | 1.78e-15 | 1.01e-11 |
| 4 | MAP2K4 | mitogen-activated protein kinase kinase 4 | 570375 | 20 | 20 | 19 | 0 | 3 | 2 | 2 | 1 | 12 | 0 | 2.22e-15 | 0.0346 | NaN | NaN | 2.22e-15 | 1.01e-11 |
| 5 | MAP3K1 | mitogen-activated protein kinase kinase kinase 1 | 2095431 | 46 | 38 | 45 | 3 | 0 | 0 | 2 | 5 | 24 | 15 | 3.44e-15 | 0.271 | NaN | NaN | 3.44e-15 | 1.13e-11 |
| 6 | RUNX1 | runt-related transcription factor 1 (acute myeloid leukemia 1; aml1 oncogene) | 630708 | 18 | 18 | 17 | 1 | 0 | 2 | 1 | 3 | 12 | 0 | 4.22e-15 | 0.225 | NaN | NaN | 4.22e-15 | 1.13e-11 |
| 7 | GATA3 | GATA binding protein 3 | 574431 | 56 | 54 | 34 | 1 | 0 | 1 | 0 | 3 | 51 | 1 | 4.33e-15 | 0.519 | NaN | NaN | 4.33e-15 | 1.13e-11 |
| 8 | PTEN | phosphatase and tensin homolog (mutated in multiple advanced cancers 1) | 632736 | 17 | 17 | 16 | 0 | 1 | 0 | 2 | 2 | 11 | 1 | 1.01e-14 | 0.181 | NaN | NaN | 1.01e-14 | 2.31e-11 |
| 9 | MLL3 | myeloid/lymphoid or mixed-lineage leukemia 3 | 7571538 | 37 | 36 | 37 | 1 | 0 | 8 | 3 | 3 | 23 | 0 | 5.28e-13 | 0.0486 | NaN | NaN | 5.28e-13 | 1.07e-09 |
| 10 | TBX3 | T-box 3 (ulnar mammary syndrome) | 709800 | 13 | 13 | 13 | 0 | 0 | 2 | 1 | 0 | 10 | 0 | 1.90e-11 | 0.176 | NaN | NaN | 1.90e-11 | 3.48e-08 |
| 11 | PIK3R1 | phosphoinositide-3-kinase, regulatory subunit 1 (alpha) | 1196520 | 14 | 14 | 13 | 1 | 0 | 2 | 2 | 1 | 9 | 0 | 6.84e-11 | 0.610 | NaN | NaN | 6.84e-11 | 1.14e-07 |
| 12 | CBFB | core-binding factor, beta subunit | 246909 | 8 | 8 | 8 | 1 | 0 | 4 | 0 | 1 | 3 | 0 | 1.13e-10 | 0.339 | NaN | NaN | 1.13e-10 | 1.72e-07 |
| 13 | AKT1 | v-akt murine thymoma viral oncogene homolog 1 | 757965 | 12 | 12 | 2 | 1 | 0 | 11 | 0 | 1 | 0 | 0 | 3.12e-10 | 0.00521 | NaN | NaN | 3.12e-10 | 4.39e-07 |
| 14 | TBL1XR1 | transducin (beta)-like 1 X-linked receptor 1 | 811707 | 8 | 8 | 7 | 0 | 0 | 0 | 1 | 1 | 4 | 2 | 7.10e-07 | 0.445 | NaN | NaN | 7.10e-07 | 0.000928 |
| 15 | CTCF | CCCTC-binding factor (zinc finger protein) | 1127568 | 13 | 13 | 11 | 2 | 1 | 1 | 2 | 2 | 7 | 0 | 1.21e-06 | 0.494 | NaN | NaN | 1.21e-06 | 0.00147 |
| 16 | NCOR1 | nuclear receptor co-repressor 1 | 3804021 | 17 | 17 | 17 | 1 | 0 | 1 | 1 | 1 | 13 | 1 | 2.45e-06 | 0.128 | NaN | NaN | 2.45e-06 | 0.00280 |
| 17 | FOXA1 | forkhead box A1 | 603330 | 8 | 8 | 7 | 0 | 1 | 3 | 2 | 1 | 1 | 0 | 4.03e-06 | 0.0502 | NaN | NaN | 4.03e-06 | 0.00434 |
| 18 | AFF2 | AF4/FMR2 family, member 2 | 2066025 | 13 | 13 | 13 | 1 | 2 | 1 | 6 | 1 | 3 | 0 | 4.60e-06 | 0.235 | NaN | NaN | 4.60e-06 | 0.00468 |
| 19 | VASN | vasorin | 348309 | 6 | 6 | 3 | 0 | 0 | 0 | 1 | 4 | 1 | 0 | 5.49e-06 | 0.384 | NaN | NaN | 5.49e-06 | 0.00528 |
| 20 | ZFP36L1 | zinc finger protein 36, C3H type-like 1 | 519675 | 7 | 7 | 7 | 0 | 0 | 1 | 1 | 1 | 4 | 0 | 8.17e-06 | 0.305 | NaN | NaN | 8.17e-06 | 0.00747 |
| 21 | RB1 | retinoblastoma 1 (including osteosarcoma) | 1394250 | 10 | 9 | 10 | 0 | 0 | 0 | 0 | 2 | 8 | 0 | 2.02e-05 | 0.302 | NaN | NaN | 2.02e-05 | 0.0176 |
| 22 | C1orf65 | chromosome 1 open reading frame 65 | 581529 | 7 | 7 | 5 | 0 | 1 | 4 | 1 | 1 | 0 | 0 | 2.22e-05 | 0.0373 | NaN | NaN | 2.22e-05 | 0.0185 |
| 23 | CDKN1B | cyclin-dependent kinase inhibitor 1B (p27, Kip1) | 272259 | 5 | 5 | 4 | 0 | 0 | 0 | 0 | 0 | 5 | 0 | 2.44e-05 | 0.673 | NaN | NaN | 2.44e-05 | 0.0194 |
| 24 | GPS2 | G protein pathway suppressor 2 | 518661 | 6 | 6 | 6 | 1 | 0 | 0 | 0 | 0 | 6 | 0 | 3.59e-05 | 0.921 | NaN | NaN | 3.59e-05 | 0.0273 |
| 25 | NEK5 | NIMA (never in mitosis gene a)-related kinase 5 | 1078896 | 8 | 8 | 8 | 0 | 1 | 0 | 4 | 2 | 1 | 0 | 5.36e-05 | 0.184 | NaN | NaN | 5.36e-05 | 0.0392 |
| 26 | MYB | v-myb myeloblastosis viral oncogene homolog (avian) | 1177761 | 8 | 8 | 8 | 0 | 1 | 1 | 1 | 1 | 4 | 0 | 6.49e-05 | 0.214 | NaN | NaN | 6.49e-05 | 0.0456 |
| 27 | OR5I1 | olfactory receptor, family 5, subfamily I, member 1 | 480636 | 5 | 5 | 5 | 0 | 1 | 2 | 1 | 1 | 0 | 0 | 8.10e-05 | 0.139 | NaN | NaN | 8.10e-05 | 0.0549 |
| 28 | KRAS | v-Ki-ras2 Kirsten rat sarcoma viral oncogene homolog | 358449 | 4 | 4 | 3 | 0 | 0 | 0 | 3 | 0 | 1 | 0 | 9.56e-05 | 0.773 | NaN | NaN | 9.56e-05 | 0.0624 |
| 29 | UBC | ubiquitin C | 978003 | 7 | 7 | 7 | 0 | 1 | 0 | 3 | 1 | 2 | 0 | 9.99e-05 | 0.276 | NaN | NaN | 9.99e-05 | 0.0630 |
| 30 | SYCE1L | synaptonemal complex central element protein 1-like | 238797 | 4 | 4 | 3 | 0 | 1 | 0 | 2 | 1 | 0 | 0 | 0.000116 | 0.361 | NaN | NaN | 0.000116 | 0.0687 |
| 31 | HLA-DRB1 | major histocompatibility complex, class II, DR beta 1 | 265161 | 4 | 4 | 4 | 1 | 0 | 0 | 1 | 2 | 1 | 0 | 0.000119 | 0.592 | NaN | NaN | 0.000119 | 0.0687 |
| 32 | DCAF4L2 | DDB1 and CUL4 associated factor 4-like 2 | 604344 | 7 | 7 | 7 | 0 | 4 | 2 | 1 | 0 | 0 | 0 | 0.000122 | 0.0583 | NaN | NaN | 0.000122 | 0.0687 |
| 33 | SF3B1 | splicing factor 3b, subunit 1, 155kDa | 2047773 | 10 | 10 | 6 | 0 | 0 | 1 | 0 | 8 | 1 | 0 | 0.000124 | 0.0496 | NaN | NaN | 0.000124 | 0.0687 |
| 34 | AVPI1 | arginine vasopressin-induced 1 | 186069 | 4 | 4 | 3 | 0 | 1 | 0 | 3 | 0 | 0 | 0 | 0.000129 | 0.434 | NaN | NaN | 0.000129 | 0.0695 |
| 35 | ATP10B | ATPase, class V, type 10B | 2268318 | 12 | 12 | 12 | 1 | 3 | 2 | 4 | 2 | 1 | 0 | 0.000136 | 0.122 | NaN | NaN | 0.000136 | 0.0711 |
In this analysis, COSMIC is used as a filter to increase power by restricting the territory of each gene. Cosmic version: v48.
Table 4. Get Full Table Significantly mutated genes (COSMIC territory only). To access the database please go to: COSMIC. Number of significant genes found: 16. Number of genes displayed: 10
| rank | gene | description | n | cos | n_cos | N_cos | cos_ev | p | q |
|---|---|---|---|---|---|---|---|---|---|
| 1 | PIK3CA | phosphoinositide-3-kinase, catalytic, alpha polypeptide | 194 | 220 | 184 | 111540 | 113646 | 0 | 0 |
| 2 | TP53 | tumor protein p53 | 187 | 356 | 180 | 180492 | 37514 | 0 | 0 |
| 3 | PIK3R1 | phosphoinositide-3-kinase, regulatory subunit 1 (alpha) | 14 | 33 | 7 | 16731 | 8 | 1.7e-13 | 1.9e-10 |
| 4 | GATA3 | GATA binding protein 3 | 56 | 34 | 21 | 17238 | 155 | 1.7e-13 | 1.9e-10 |
| 5 | RUNX1 | runt-related transcription factor 1 (acute myeloid leukemia 1; aml1 oncogene) | 18 | 178 | 14 | 90246 | 54 | 7.9e-13 | 6.2e-10 |
| 6 | CDH1 | cadherin 1, type 1, E-cadherin (epithelial) | 33 | 185 | 15 | 93795 | 27 | 8.2e-13 | 6.2e-10 |
| 7 | ERBB2 | v-erb-b2 erythroblastic leukemia viral oncogene homolog 2, neuro/glioblastoma derived oncogene homolog (avian) | 8 | 42 | 6 | 21294 | 44 | 1.5e-12 | 9.7e-10 |
| 8 | PTEN | phosphatase and tensin homolog (mutated in multiple advanced cancers 1) | 17 | 767 | 17 | 388869 | 712 | 2.2e-12 | 1.2e-09 |
| 9 | PTPN22 | protein tyrosine phosphatase, non-receptor type 22 (lymphoid) | 8 | 5 | 2 | 2535 | 2 | 7e-06 | 0.0035 |
| 10 | FGFR2 | fibroblast growth factor receptor 2 (bacteria-expressed kinase, keratinocyte growth factor receptor, craniofacial dysostosis 1, Crouzon syndrome, Pfeiffer syndrome, Jackson-Weiss syndrome) | 4 | 51 | 3 | 25857 | 15 | 9e-06 | 0.0039 |
Note:
n - number of (nonsilent) mutations in this gene across the individual set.
cos = number of unique mutated sites in this gene in COSMIC
n_cos = overlap between n and cos.
N_cos = number of individuals times cos.
cos_ev = total evidence: number of reports in COSMIC for mutations seen in this gene.
p = p-value for seeing the observed amount of overlap in this gene)
q = q-value, False Discovery Rate (Benjamini-Hochberg procedure)
Table 5. Get Full Table Genes with Clustered Mutations
| num | gene | desc | n | mindist | nmuts0 | nmuts3 | nmuts12 | npairs0 | npairs3 | npairs12 |
|---|---|---|---|---|---|---|---|---|---|---|
| 6931 | PIK3CA | phosphoinositide-3-kinase, catalytic, alpha polypeptide | 194 | 0 | 4345 | 5558 | 5984 | 4345 | 5558 | 5984 |
| 9396 | TP53 | tumor protein p53 | 187 | 0 | 237 | 643 | 1330 | 237 | 643 | 1330 |
| 311 | AKT1 | v-akt murine thymoma viral oncogene homolog 1 | 12 | 0 | 55 | 55 | 55 | 55 | 55 | 55 |
| 8154 | SF3B1 | splicing factor 3b, subunit 1, 155kDa | 10 | 0 | 10 | 10 | 10 | 10 | 10 | 10 |
| 6273 | OBSCN | obscurin, cytoskeletal calmodulin and titin-interacting RhoGEF | 27 | 0 | 7 | 7 | 8 | 7 | 7 | 8 |
| 9852 | VASN | vasorin | 6 | 0 | 6 | 6 | 6 | 6 | 6 | 6 |
| 1752 | CDH1 | cadherin 1, type 1, E-cadherin (epithelial) | 33 | 0 | 5 | 5 | 6 | 5 | 5 | 6 |
| 2269 | CTCF | CCCTC-binding factor (zinc finger protein) | 13 | 0 | 3 | 7 | 7 | 3 | 7 | 7 |
| 3001 | ERBB2 | v-erb-b2 erythroblastic leukemia viral oncogene homolog 2, neuro/glioblastoma derived oncogene homolog (avian) | 8 | 0 | 3 | 3 | 4 | 3 | 3 | 4 |
| 8761 | SSPO | SCO-spondin homolog (Bos taurus) | 15 | 0 | 3 | 3 | 4 | 3 | 3 | 4 |
Note:
n - number of mutations in this gene in the individual set.
mindist - distance (in aa) between closest pair of mutations in this gene
npairs3 - how many pairs of mutations are within 3 aa of each other.
npairs12 - how many pairs of mutations are within 12 aa of each other.
Table 6. Get Full Table A Ranked List of Significantly Mutated Genesets. (Source: MSigDB GSEA Cannonical Pathway Set).Number of significant genesets found: 117. Number of genesets displayed: 10
| rank | geneset | description | genes | N_genes | mut_tally | N | n | npat | nsite | nsil | n1 | n2 | n3 | n4 | n5 | n6 | p_ns_s | p | q |
|---|---|---|---|---|---|---|---|---|---|---|---|---|---|---|---|---|---|---|---|
| 1 | HSA04620_TOLL_LIKE_RECEPTOR_SIGNALING_PATHWAY | Genes involved in Toll-like receptor signaling pathway | AKT1, AKT2, AKT3, CASP8, CCL3, CCL4, CCL5, CD14, CD40, CD80, CD86, CHUK, CXCL10, CXCL11, CXCL9, FADD, FOS, IFNA1, IFNA10, IFNA13, IFNA14, IFNA16, IFNA17, IFNA2, IFNA21, IFNA4, IFNA5, IFNA6, IFNA7, IFNA8, IFNAR1, IFNAR2, IFNB1, IKBKB, IKBKE, IKBKG, IL12A, IL12B, IL1B, IL6, IL8, IRAK1, IRAK4, IRF3, IRF5, IRF7, JUN, LBP, LY96, MAP2K1, MAP2K2, MAP2K3, MAP2K4, MAP2K6, MAP2K7, MAP3K7, MAP3K7IP1, MAP3K7IP2, MAP3K8, MAPK1, MAPK10, MAPK11, MAPK12, MAPK13, MAPK14, MAPK3, MAPK8, MAPK9, MYD88, NFKB1, NFKB2, NFKBIA, PIK3CA, PIK3CB, PIK3CD, PIK3CG, PIK3R1, PIK3R2, PIK3R3, PIK3R5, RAC1, RELA, RIPK1, SPP1, STAT1, TBK1, TICAM1, TICAM2, TIRAP, TLR1, TLR2, TLR3, TLR4, TLR5, TLR6, TLR7, TLR8, TLR9, TNF, TOLLIP, TRAF3, TRAF6 | 99 | AKT1(12), AKT2(1), AKT3(3), CASP8(3), CD14(1), CD40(1), CD86(2), IFNA1(1), IFNA10(1), IFNA13(1), IFNA14(2), IFNA16(1), IFNA2(2), IFNA4(1), IFNA7(1), IFNAR1(1), IFNAR2(1), IFNB1(1), IKBKB(3), IKBKE(1), IL12A(1), IL12B(1), IL6(2), IRAK1(1), IRAK4(2), IRF3(2), JUN(1), LBP(1), MAP2K1(1), MAP2K2(1), MAP2K3(1), MAP2K4(20), MAP2K7(1), MAP3K7(1), MAP3K8(2), MAPK1(1), MAPK10(1), MAPK14(1), MAPK3(1), MAPK8(2), NFKB1(1), NFKB2(3), NFKBIA(1), PIK3CA(194), PIK3CB(4), PIK3CG(2), PIK3R1(14), PIK3R3(1), RELA(1), RIPK1(3), SPP1(2), STAT1(1), TBK1(1), TICAM1(2), TIRAP(2), TLR1(1), TLR2(1), TLR3(1), TLR4(8), TLR5(1), TLR7(5), TLR8(3), TLR9(1), TRAF3(1), TRAF6(2) | 67859415 | 340 | 267 | 165 | 40 | 20 | 108 | 32 | 126 | 53 | 1 | 1.50e-13 | <1.00e-15 | <1.81e-14 |
| 2 | ST_JNK_MAPK_PATHWAY | JNKs are MAP kinases regulated by several levels of kinases (MAPKK, MAPKKK) and phosphorylate transcription factors and regulatory proteins. | AKT1, ATF2, CDC42, DLD, DUSP10, DUSP4, DUSP8, GAB1, GADD45A, GCK, IL1R1, JUN, MAP2K4, MAP2K5, MAP2K7, MAP3K1, MAP3K10, MAP3K11, MAP3K12, MAP3K13, MAP3K2, MAP3K3, MAP3K4, MAP3K5, MAP3K7, MAP3K7IP1, MAP3K7IP2, MAP3K9, MAPK10, MAPK7, MAPK8, MAPK9, MYEF2, NFATC3, NR2C2, PAPPA, SHC1, TP53, TRAF6, ZAK | 38 | AKT1(12), ATF2(2), DLD(1), DUSP10(1), DUSP4(1), GAB1(1), GCK(2), IL1R1(1), JUN(1), MAP2K4(20), MAP2K5(2), MAP2K7(1), MAP3K1(46), MAP3K10(4), MAP3K11(1), MAP3K12(2), MAP3K13(5), MAP3K4(4), MAP3K5(2), MAP3K7(1), MAP3K9(3), MAPK10(1), MAPK8(2), MYEF2(2), NFATC3(3), NR2C2(1), PAPPA(4), SHC1(1), TP53(187), TRAF6(2), ZAK(1) | 38087868 | 317 | 263 | 230 | 20 | 42 | 46 | 38 | 51 | 125 | 15 | 1.34e-13 | <1.00e-15 | <1.81e-14 |
| 3 | APOPTOSIS_GENMAPP | APAF1, BAK1, BCL2L7P1, BAX, BCL2, BCL2L1, BID, BIRC2, BIRC3, BIRC4, CASP2, CASP3, CASP6, CASP7, CASP8, CASP9, CYCS, FADD, FAS, FASLG, GZMB, IKBKG, JUN, MAP2K4, MAP3K1, MAP3K14, MAPK10, MCL1, MDM2, MYC, NFKB1, NFKBIA, PARP1, PRF1, RELA, RIPK1, TNF, TNFRSF1A, TNFRSF1B, TNFSF10, TP53, TRADD, TRAF1, TRAF2 | 41 | APAF1(1), BAK1(1), BID(4), CASP2(3), CASP6(2), CASP8(3), FAS(1), FASLG(1), JUN(1), MAP2K4(20), MAP3K1(46), MAPK10(1), MDM2(2), MYC(1), NFKB1(1), NFKBIA(1), PARP1(1), PRF1(2), RELA(1), RIPK1(3), TNFRSF1A(1), TP53(187), TRAF1(1) | 27872325 | 285 | 245 | 209 | 14 | 39 | 34 | 33 | 47 | 117 | 15 | 4.00e-15 | <1.00e-15 | <1.81e-14 | |
| 4 | GLEEVECPATHWAY | The drug Gleevec specifically targets the abnormal bcr-abl protein, an apoptosis inhibitor present in chronic myeloid leukemia. | AKT1, BCL2, BCR, CRKL, FOS, GRB2, HRAS, JAK2, JUN, MAP2K1, MAP2K4, MAP3K1, MAPK3, MAPK8, MYC, PIK3CA, PIK3R1, RAF1, SOS1, STAT1, STAT5A, STAT5B | 22 | AKT1(12), BCR(1), CRKL(1), GRB2(1), JAK2(5), JUN(1), MAP2K1(1), MAP2K4(20), MAP3K1(46), MAPK3(1), MAPK8(2), MYC(1), PIK3CA(194), PIK3R1(14), RAF1(1), SOS1(4), STAT1(1), STAT5A(3), STAT5B(4) | 20923890 | 313 | 241 | 138 | 12 | 12 | 89 | 17 | 117 | 63 | 15 | <1.00e-15 | <1.00e-15 | <1.81e-14 |
| 5 | ST_B_CELL_ANTIGEN_RECEPTOR | B cell receptors bind antigens and promote B cell activation. | AKT1, AKT2, AKT3, BAD, BCR, BLNK, BTK, CD19, CSK, DAG1, EPHB2, GRB2, ITPKA, ITPKB, LYN, MAP2K1, MAP2K2, MAPK1, NFAT5, NFKB1, NFKB2, NFKBIA, NFKBIB, NFKBIE, NFKBIL1, NFKBIL2, PAG, PI3, PIK3CA, PIK3CD, PIK3R1, PLCG2, PPP1R13B, RAF1, SERPINA4, SHC1, SOS1, SOS2, SYK, VAV1 | 38 | AKT1(12), AKT2(1), AKT3(3), BAD(1), BCR(1), BLNK(1), BTK(3), CD19(2), DAG1(1), EPHB2(2), GRB2(1), ITPKA(1), ITPKB(8), LYN(4), MAP2K1(1), MAP2K2(1), MAPK1(1), NFAT5(3), NFKB1(1), NFKB2(3), NFKBIA(1), NFKBIE(1), PI3(1), PIK3CA(194), PIK3R1(14), PLCG2(2), PPP1R13B(2), RAF1(1), SERPINA4(3), SHC1(1), SOS1(4), SOS2(2), SYK(2), VAV1(2) | 39742716 | 281 | 240 | 108 | 15 | 18 | 96 | 25 | 115 | 26 | 1 | <1.00e-15 | <1.00e-15 | <1.81e-14 |
| 6 | HSA04115_P53_SIGNALING_PATHWAY | Genes involved in p53 signaling pathway | APAF1, ATM, ATR, BAI1, BAX, BBC3, BID, CASP3, CASP8, CASP9, CCNB1, CCNB2, CCNB3, CCND1, CCND2, CCND3, CCNE1, CCNE2, CCNG1, CCNG2, CD82, CDC2, CDK2, CDK4, CDK6, CDKN1A, CDKN2A, CHEK1, CHEK2, CYCS, DDB2, EI24, FAS, GADD45A, GADD45B, GADD45G, GTSE1, IGF1, IGFBP3, LRDD, MDM2, MDM4, P53AIP1, PERP, PMAIP1, PPM1D, PTEN, RCHY1, RFWD2, RPRM, RRM2, RRM2B, SCOTIN, SERPINB5, SERPINE1, SESN1, SESN2, SESN3, SFN, SIAH1, STEAP3, THBS1, TNFRSF10B, TP53, TP53I3, TP73, TSC2, ZMAT3 | 65 | APAF1(1), ATM(12), ATR(2), BAI1(7), BID(4), CASP8(3), CCNB1(2), CCNB3(6), CCND1(1), CCND3(3), CCNE1(1), CCNG2(2), CDK2(1), CDK6(1), CHEK2(2), DDB2(1), FAS(1), GTSE1(7), IGF1(1), IGFBP3(1), LRDD(1), MDM2(2), PERP(2), PTEN(17), RCHY1(1), RRM2(1), SERPINE1(2), SESN2(2), SIAH1(3), STEAP3(1), THBS1(4), TP53(187), TP53I3(1), TP73(1), TSC2(2) | 49849761 | 286 | 232 | 211 | 15 | 45 | 34 | 39 | 60 | 106 | 2 | 4.00e-15 | <1.00e-15 | <1.81e-14 |
| 7 | HCMVPATHWAY | Cytomegalovirus activates MAP kinase pathways in the host cell, inducing transcription of viral genes. | AKT1, CREB1, MAP2K1, MAP2K2, MAP2K3, MAP2K6, MAP3K1, MAPK1, MAPK14, MAPK3, NFKB1, PIK3CA, PIK3R1, RB1, RELA, SP1 | 16 | AKT1(12), CREB1(1), MAP2K1(1), MAP2K2(1), MAP2K3(1), MAP3K1(46), MAPK1(1), MAPK14(1), MAPK3(1), NFKB1(1), PIK3CA(194), PIK3R1(14), RB1(10), RELA(1), SP1(2) | 15156765 | 287 | 230 | 113 | 12 | 6 | 86 | 14 | 116 | 50 | 15 | <1.00e-15 | <1.00e-15 | <1.81e-14 |
| 8 | PTENPATHWAY | PTEN suppresses AKT-induced cell proliferation and antagonizes the action of PI3K. | AKT1, BCAR1, CDKN1B, FOXO3A, GRB2, ILK, ITGB1, MAPK1, MAPK3, PDK2, PDPK1, PIK3CA, PIK3R1, PTEN, PTK2, SHC1, SOS1, TNFSF6 | 16 | AKT1(12), CDKN1B(5), GRB2(1), ILK(2), ITGB1(2), MAPK1(1), MAPK3(1), PDK2(1), PIK3CA(194), PIK3R1(14), PTEN(17), PTK2(3), SHC1(1), SOS1(4) | 14667003 | 258 | 226 | 83 | 10 | 7 | 89 | 15 | 111 | 35 | 1 | <1.00e-15 | <1.00e-15 | <1.81e-14 |
| 9 | EIF4PATHWAY | The eIF-4F complex recognizes 5' mRNA caps, recruits RNA helicases, and maintains mRNA-ribosome bridging. | AKT1, EIF4A1, EIF4A2, EIF4E, EIF4EBP1, EIF4G1, EIF4G2, EIF4G3, FRAP1, GHR, IRS1, MAPK1, MAPK14, MAPK3, MKNK1, PABPC1, PDK2, PDPK1, PIK3CA, PIK3R1, PRKCA, PRKCB1, PTEN, RPS6KB1 | 22 | AKT1(12), EIF4A2(5), EIF4G1(1), EIF4G2(1), EIF4G3(2), GHR(2), IRS1(1), MAPK1(1), MAPK14(1), MAPK3(1), PABPC1(3), PDK2(1), PIK3CA(194), PIK3R1(14), PTEN(17) | 21334560 | 256 | 225 | 82 | 14 | 7 | 89 | 17 | 109 | 33 | 1 | <1.00e-15 | <1.00e-15 | <1.81e-14 |
| 10 | ST_PHOSPHOINOSITIDE_3_KINASE_PATHWAY | The phosphoinositide-3 kinase pathway produces the lipid second messenger PIP3 and regulates cell growth, survival, and movement. | A1BG, AKT1, AKT2, AKT3, BAD, BTK, CDKN2A, CSL4, DAF, DAPP1, FOXO1A, GRB2, GSK3A, GSK3B, IARS, IGFBP1, INPP5D, P14, PDK1, PIK3CA, PPP1R13B, PSCD3, PTEN, RPS6KA1, RPS6KA2, RPS6KA3, RPS6KB1, SFN, SHC1, SOS1, SOS2, TEC, YWHAB, YWHAE, YWHAG, YWHAH, YWHAQ, YWHAZ | 33 | AKT1(12), AKT2(1), AKT3(3), BAD(1), BTK(3), GRB2(1), GSK3A(1), IARS(6), INPP5D(3), PDK1(1), PIK3CA(194), PPP1R13B(2), PTEN(17), RPS6KA1(1), RPS6KA2(2), RPS6KA3(2), SHC1(1), SOS1(4), SOS2(2), TEC(1), YWHAB(1) | 27296880 | 259 | 225 | 86 | 13 | 13 | 89 | 22 | 111 | 23 | 1 | <1.00e-15 | <1.00e-15 | <1.81e-14 |
Table 7. Get Full Table A Ranked List of Significantly Mutated Genesets (Excluding Significantly Mutated Genes). Number of significant genesets found: 0. Number of genesets displayed: 10
| rank | geneset | description | genes | N_genes | mut_tally | N | n | npat | nsite | nsil | n1 | n2 | n3 | n4 | n5 | n6 | p_ns_s | p | q |
|---|---|---|---|---|---|---|---|---|---|---|---|---|---|---|---|---|---|---|---|
| 1 | STILBENE_COUMARINE_AND_LIGNIN_BIOSYNTHESIS | EPX, GBA3, LPO, MPO, PRDX1, PRDX2, PRDX5, PRDX6, TPO, TYR | 10 | EPX(1), LPO(5), MPO(2), PRDX1(1), PRDX5(1), TPO(6), TYR(4) | 7428057 | 20 | 20 | 20 | 2 | 6 | 2 | 5 | 3 | 4 | 0 | 0.067 | 0.018 | 1 | |
| 2 | ST_PAC1_RECEPTOR_PATHWAY | The signaling peptide PACAP binds to its receptor, PAC1R, which activates adenylyl cyclase and phospholipase C. | ASAH1, CAMP, DAG1, GAS, GNAQ, ITPKA, ITPKB, PACAP | 6 | ASAH1(1), DAG1(1), GNAQ(1), ITPKA(1), ITPKB(8) | 4432701 | 12 | 12 | 12 | 0 | 2 | 1 | 3 | 4 | 2 | 0 | 0.04 | 0.022 | 1 |
| 3 | HSA00601_GLYCOSPHINGOLIPID_BIOSYNTHESIS_LACTOSERIES | Genes involved in glycosphingolipid biosynthesis - lactoseries | ABO, B3GALT1, B3GALT2, B3GALT5, B3GNT5, FUT1, FUT2, FUT3, ST3GAL3, ST3GAL4 | 10 | ABO(4), B3GALT1(1), B3GALT2(1), B3GALT5(1), FUT2(2), FUT3(4), ST3GAL3(1), ST3GAL4(1) | 5407662 | 15 | 15 | 14 | 2 | 4 | 5 | 2 | 2 | 2 | 0 | 0.05 | 0.033 | 1 |
| 4 | CREMPATHWAY | The transcription factor CREM activates a post-meiotic transcriptional cascade culminating in spermatogenesis. | ADCY1, CREM, FHL5, FSHB, FSHR, GNAS, XPO1 | 7 | ADCY1(3), CREM(2), FHL5(1), FSHR(4), GNAS(5), XPO1(3) | 6833346 | 18 | 18 | 18 | 2 | 4 | 4 | 3 | 5 | 2 | 0 | 0.13 | 0.042 | 1 |
| 5 | BLOOD_GROUP_GLYCOLIPID_BIOSYNTHESIS_LACTOSERIES | ABO, FUT1, FUT2, FUT3, FUT5, FUT6, SIAT6, ST3GAL3 | 7 | ABO(4), FUT2(2), FUT3(4), FUT5(1), ST3GAL3(1) | 3810105 | 12 | 12 | 11 | 2 | 4 | 3 | 1 | 2 | 2 | 0 | 0.096 | 0.064 | 1 | |
| 6 | HSA00940_PHENYLPROPANOID_BIOSYNTHESIS | Genes involved in phenylpropanoid biosynthesis | EPX, GBA, GBA3, LPO, MPO, PRDX6, TPO | 7 | EPX(1), LPO(5), MPO(2), TPO(6) | 6402396 | 14 | 14 | 14 | 0 | 6 | 1 | 2 | 2 | 3 | 0 | 0.012 | 0.079 | 1 |
| 7 | INOSITOL_METABOLISM | ALDH6A1, ALDOA, ALDOB, ALDOC, TPI1 | 5 | ALDOA(4), ALDOB(2), TPI1(2) | 2928939 | 8 | 8 | 8 | 0 | 0 | 4 | 3 | 0 | 1 | 0 | 0.051 | 0.086 | 1 | |
| 8 | METHIONINEPATHWAY | Catabolic Pathways for Methionine, Isoleucine, Threonine and Valine | BCKDHB, BCKDK, CBS, CTH, MUT | 5 | BCKDK(2), CBS(2), CTH(3), MUT(1) | 3739125 | 8 | 8 | 8 | 0 | 1 | 1 | 1 | 1 | 4 | 0 | 0.14 | 0.12 | 1 |
| 9 | METHANE_METABOLISM | ADH5, ATP6V0C, SHMT1, CAT, EPX, LPO, MPO, PRDX1, PRDX2, PRDX5, PRDX6, SHMT1, SHMT2, TPO | 13 | CAT(1), EPX(1), LPO(5), MPO(2), PRDX1(1), PRDX5(1), TPO(6) | 9083412 | 17 | 17 | 17 | 1 | 7 | 1 | 2 | 3 | 4 | 0 | 0.036 | 0.15 | 1 | |
| 10 | SA_DIACYLGLYCEROL_SIGNALING | DAG (diacylglycerol) signaling activity | ESR1, ESR2, ITPKA, PDE1A, PDE1B, PLCB1, PLCB2, PRL, TRH, VIP | 10 | ESR1(2), ESR2(2), ITPKA(1), PDE1A(2), PDE1B(2), PLCB1(4), PLCB2(2), VIP(1) | 8374626 | 16 | 16 | 16 | 2 | 2 | 6 | 3 | 3 | 2 | 0 | 0.12 | 0.15 | 1 |
In brief, we tabulate the number of mutations and the number of covered bases for each gene. The counts are broken down by mutation context category: four context categories that are discovered by MutSig, and one for indel and 'null' mutations, which include indels, nonsense mutations, splice-site mutations, and non-stop (read-through) mutations. For each gene, we calculate the probability of seeing the observed constellation of mutations, i.e. the product P1 x P2 x ... x Pm, or a more extreme one, given the background mutation rates calculated across the dataset. [1]
This is an experimental feature. The full results of the analysis summarized in this report can be downloaded from the TCGA Data Coordination Center.