(primary solid tumor cohort)
This pipeline computes the correlation between significant arm-level copy number variations (cnvs) and selected clinical features.
Testing the association between copy number variation 34 arm-level results and 6 clinical features across 26 patients, one significant finding detected with Q value < 0.25.
-
15q gain cnv correlated to 'TOBACCOSMOKINGHISTORYINDICATOR'.
Table 1. Get Full Table Overview of the association between significant copy number variation of 34 arm-level results and 6 clinical features. Shown in the table are P values (Q values). Thresholded by Q value < 0.25, one significant finding detected.
|
Clinical Features |
Time to Death |
AGE |
RADIATIONS RADIATION REGIMENINDICATION |
NUMBERPACKYEARSSMOKED | STOPPEDSMOKINGYEAR | TOBACCOSMOKINGHISTORYINDICATOR | ||
| nCNV (%) | nWild-Type | logrank test | t-test | Fisher's exact test | t-test | t-test | t-test | |
| 15q gain | 3 (12%) | 23 |
1 (1.00) |
0.818 (1.00) |
1 (1.00) |
0.000729 (0.0984) |
||
| 1p gain | 5 (19%) | 21 |
0.617 (1.00) |
0.0415 (1.00) |
1 (1.00) |
0.94 (1.00) |
||
| 1q gain | 10 (38%) | 16 |
0.414 (1.00) |
0.00733 (0.983) |
0.625 (1.00) |
0.869 (1.00) |
||
| 3p gain | 3 (12%) | 23 |
1 (1.00) |
0.742 (1.00) |
0.408 (1.00) |
0.594 (1.00) |
||
| 3q gain | 16 (62%) | 10 |
1 (1.00) |
0.242 (1.00) |
1 (1.00) |
0.545 (1.00) |
||
| 5p gain | 8 (31%) | 18 |
0.617 (1.00) |
0.438 (1.00) |
0.563 (1.00) |
0.952 (1.00) |
||
| 6p gain | 3 (12%) | 23 |
1 (1.00) |
0.745 (1.00) |
1 (1.00) |
0.227 (1.00) |
||
| 8p gain | 3 (12%) | 23 |
1 (1.00) |
0.561 (1.00) |
0.408 (1.00) |
0.792 (1.00) |
||
| 8q gain | 5 (19%) | 21 |
0.617 (1.00) |
0.633 (1.00) |
1 (1.00) |
0.916 (1.00) |
||
| 10p gain | 3 (12%) | 23 |
0.0455 (1.00) |
0.332 (1.00) |
1 (1.00) |
0.291 (1.00) |
||
| 12p gain | 5 (19%) | 21 |
1 (1.00) |
0.485 (1.00) |
1 (1.00) |
0.639 (1.00) |
||
| 12q gain | 3 (12%) | 23 |
1 (1.00) |
0.723 (1.00) |
0.408 (1.00) |
0.792 (1.00) |
||
| 16p gain | 4 (15%) | 22 |
0.617 (1.00) |
0.944 (1.00) |
0.511 (1.00) |
0.792 (1.00) |
||
| 16q gain | 3 (12%) | 23 |
0.617 (1.00) |
0.165 (1.00) |
0.408 (1.00) |
|||
| 18p gain | 3 (12%) | 23 |
0.617 (1.00) |
0.336 (1.00) |
0.0523 (1.00) |
0.399 (1.00) |
||
| 20p gain | 8 (31%) | 18 |
1 (1.00) |
0.818 (1.00) |
0.563 (1.00) |
0.624 (1.00) |
||
| 20q gain | 9 (35%) | 17 |
1 (1.00) |
0.923 (1.00) |
1 (1.00) |
0.55 (1.00) |
||
| 22q gain | 4 (15%) | 22 |
0.617 (1.00) |
0.275 (1.00) |
0.511 (1.00) |
0.238 (1.00) |
||
| 3p loss | 7 (27%) | 19 |
0.414 (1.00) |
0.586 (1.00) |
1 (1.00) |
0.962 (1.00) |
||
| 4p loss | 10 (38%) | 16 |
0.414 (1.00) |
0.666 (1.00) |
0.625 (1.00) |
0.367 (1.00) |
||
| 4q loss | 3 (12%) | 23 |
0.617 (1.00) |
0.43 (1.00) |
0.408 (1.00) |
0.657 (1.00) |
||
| 5q loss | 8 (31%) | 18 |
0.414 (1.00) |
0.179 (1.00) |
0.277 (1.00) |
0.926 (1.00) |
||
| 8p loss | 7 (27%) | 19 |
0.414 (1.00) |
0.257 (1.00) |
1 (1.00) |
0.692 (1.00) |
||
| 10p loss | 5 (19%) | 21 |
0.617 (1.00) |
0.563 (1.00) |
0.155 (1.00) |
0.246 (1.00) |
||
| 10q loss | 5 (19%) | 21 |
0.0455 (1.00) |
0.582 (1.00) |
0.155 (1.00) |
0.0824 (1.00) |
||
| 11p loss | 5 (19%) | 21 |
0.414 (1.00) |
0.229 (1.00) |
0.155 (1.00) |
0.15 (1.00) |
||
| 11q loss | 5 (19%) | 21 |
0.414 (1.00) |
0.933 (1.00) |
0.155 (1.00) |
0.323 (1.00) |
||
| 12p loss | 4 (15%) | 22 |
0.0455 (1.00) |
0.077 (1.00) |
1 (1.00) |
0.436 (1.00) |
||
| 13q loss | 8 (31%) | 18 |
0.414 (1.00) |
0.907 (1.00) |
0.0721 (1.00) |
0.673 (1.00) |
||
| 17p loss | 7 (27%) | 19 |
0.414 (1.00) |
0.451 (1.00) |
0.287 (1.00) |
0.732 (1.00) |
||
| 17q loss | 3 (12%) | 23 |
0.221 (1.00) |
0.383 (1.00) |
0.408 (1.00) |
0.874 (1.00) |
||
| 18p loss | 3 (12%) | 23 |
0.617 (1.00) |
0.726 (1.00) |
0.408 (1.00) |
0.227 (1.00) |
||
| 18q loss | 4 (15%) | 22 |
0.414 (1.00) |
0.491 (1.00) |
0.511 (1.00) |
0.075 (1.00) |
||
| 21q loss | 6 (23%) | 20 |
0.617 (1.00) |
0.92 (1.00) |
0.542 (1.00) |
0.0689 (1.00) |
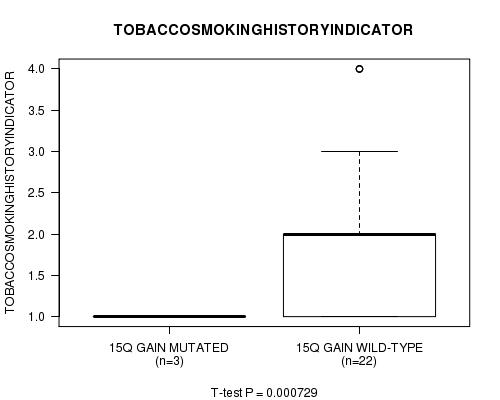
P value = 0.000729 (t-test), Q value = 0.098
Table S1. Gene #12: '15q gain mutation analysis' versus Clinical Feature #6: 'TOBACCOSMOKINGHISTORYINDICATOR'
| nPatients | Mean (Std.Dev) | |
|---|---|---|
| ALL | 25 | 1.8 (1.1) |
| 15Q GAIN MUTATED | 3 | 1.0 (0.0) |
| 15Q GAIN WILD-TYPE | 22 | 2.0 (1.1) |
Figure S1. Get High-res Image Gene #12: '15q gain mutation analysis' versus Clinical Feature #6: 'TOBACCOSMOKINGHISTORYINDICATOR'
-
Mutation data file = broad_values_by_arm.mutsig.cluster.txt
-
Clinical data file = CESC-TP.clin.merged.picked.txt
-
Number of patients = 26
-
Number of significantly arm-level cnvs = 34
-
Number of selected clinical features = 6
-
Exclude genes that fewer than K tumors have mutations, K = 3
For survival clinical features, the Kaplan-Meier survival curves of tumors with and without gene mutations were plotted and the statistical significance P values were estimated by logrank test (Bland and Altman 2004) using the 'survdiff' function in R
For continuous numerical clinical features, two-tailed Student's t test with unequal variance (Lehmann and Romano 2005) was applied to compare the clinical values between tumors with and without gene mutations using 't.test' function in R
For binary or multi-class clinical features (nominal or ordinal), two-tailed Fisher's exact tests (Fisher 1922) were used to estimate the P values using the 'fisher.test' function in R
For multiple hypothesis correction, Q value is the False Discovery Rate (FDR) analogue of the P value (Benjamini and Hochberg 1995), defined as the minimum FDR at which the test may be called significant. We used the 'Benjamini and Hochberg' method of 'p.adjust' function in R to convert P values into Q values.
This is an experimental feature. The full results of the analysis summarized in this report can be downloaded from the TCGA Data Coordination Center.