(primary solid tumor cohort)
This pipeline uses various statistical tests to identify RPPAs whose expression levels correlated to selected clinical features.
Testing the association between 171 genes and 9 clinical features across 269 samples, statistically thresholded by Q value < 0.05, 4 clinical features related to at least one genes.
-
2 genes correlated to 'AGE'.
-
RB1|RB_PS807_S811-R-V , BID|BID-R-C
-
1 gene correlated to 'PATHOLOGY.T'.
-
PTGS2|COX-2-R-C
-
1 gene correlated to 'PATHOLOGICSPREAD(M)'.
-
IGFBP2|IGFBP2-R-V
-
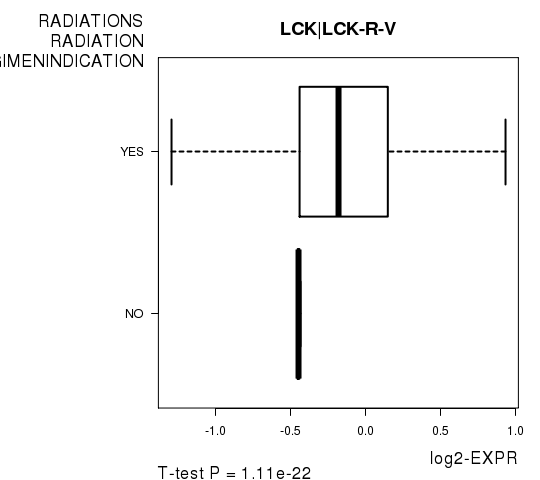
3 genes correlated to 'RADIATIONS.RADIATION.REGIMENINDICATION'.
-
LCK|LCK-R-V , PECAM1|CD31-M-V , SETD2|SETD2-R-NA
-
No genes correlated to 'Time to Death', 'GENDER', 'HISTOLOGICAL.TYPE', 'PATHOLOGY.N', and 'TUMOR.STAGE'.
Complete statistical result table is provided in Supplement Table 1
Table 1. Get Full Table This table shows the clinical features, statistical methods used, and the number of genes that are significantly associated with each clinical feature at Q value < 0.05.
| Clinical feature | Statistical test | Significant genes | Associated with | Associated with | ||
|---|---|---|---|---|---|---|
| Time to Death | Cox regression test | N=0 | ||||
| AGE | Spearman correlation test | N=2 | older | N=1 | younger | N=1 |
| GENDER | t test | N=0 | ||||
| HISTOLOGICAL TYPE | t test | N=0 | ||||
| PATHOLOGY T | Spearman correlation test | N=1 | higher pT | N=1 | lower pT | N=0 |
| PATHOLOGY N | Spearman correlation test | N=0 | ||||
| PATHOLOGICSPREAD(M) | ANOVA test | N=1 | ||||
| TUMOR STAGE | Spearman correlation test | N=0 | ||||
| RADIATIONS RADIATION REGIMENINDICATION | t test | N=3 | yes | N=2 | no | N=1 |
Table S1. Basic characteristics of clinical feature: 'Time to Death'
| Time to Death | Duration (Months) | 0.1-105.3 (median=6) |
| censored | N = 187 | |
| death | N = 19 | |
| Significant markers | N = 0 |
Table S2. Basic characteristics of clinical feature: 'AGE'
| AGE | Mean (SD) | 66.58 (13) |
| Significant markers | N = 2 | |
| pos. correlated | 1 | |
| neg. correlated | 1 |
Table S3. Get Full Table List of 2 genes significantly correlated to 'AGE' by Spearman correlation test
| SpearmanCorr | corrP | Q | |
|---|---|---|---|
| RB1|RB_PS807_S811-R-V | 0.2399 | 7.284e-05 | 0.0125 |
| BID|BID-R-C | -0.2394 | 7.519e-05 | 0.0128 |
Figure S1. Get High-res Image As an example, this figure shows the association of RB1|RB_PS807_S811-R-V to 'AGE'. P value = 7.28e-05 with Spearman correlation analysis. The straight line presents the best linear regression.

Table S4. Basic characteristics of clinical feature: 'GENDER'
| GENDER | Labels | N |
| FEMALE | 127 | |
| MALE | 142 | |
| Significant markers | N = 0 |
Table S5. Basic characteristics of clinical feature: 'HISTOLOGICAL.TYPE'
| HISTOLOGICAL.TYPE | Labels | N |
| COLON ADENOCARCINOMA | 238 | |
| COLON MUCINOUS ADENOCARCINOMA | 30 | |
| Significant markers | N = 0 |
Table S6. Basic characteristics of clinical feature: 'PATHOLOGY.T'
| PATHOLOGY.T | Mean (SD) | 2.91 (0.61) |
| N | ||
| T0 | 1 | |
| T1 | 4 | |
| T2 | 45 | |
| T3 | 185 | |
| T4 | 31 | |
| Significant markers | N = 1 | |
| pos. correlated | 1 | |
| neg. correlated | 0 |
Table S7. Get Full Table List of one gene significantly correlated to 'PATHOLOGY.T' by Spearman correlation test
| SpearmanCorr | corrP | Q | |
|---|---|---|---|
| PTGS2|COX-2-R-C | 0.2271 | 0.0001873 | 0.032 |
Figure S2. Get High-res Image As an example, this figure shows the association of PTGS2|COX-2-R-C to 'PATHOLOGY.T'. P value = 0.000187 with Spearman correlation analysis.
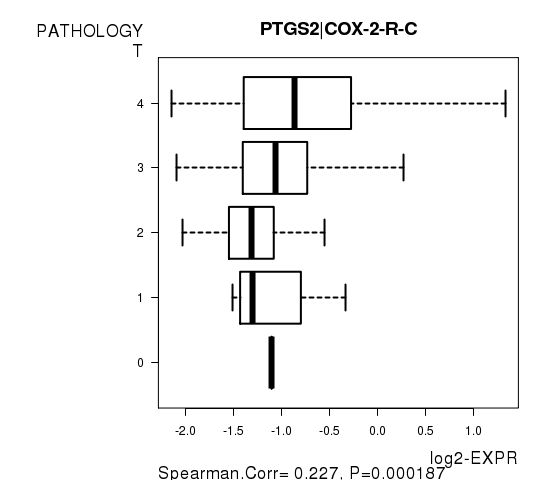
Table S8. Basic characteristics of clinical feature: 'PATHOLOGY.N'
| PATHOLOGY.N | Mean (SD) | 0.56 (0.75) |
| N | ||
| N0 | 160 | |
| N1 | 66 | |
| N2 | 42 | |
| Significant markers | N = 0 |
Table S9. Basic characteristics of clinical feature: 'PATHOLOGICSPREAD(M)'
| PATHOLOGICSPREAD(M) | Labels | N |
| M0 | 202 | |
| M1 | 31 | |
| M1A | 6 | |
| M1B | 1 | |
| MX | 26 | |
| Significant markers | N = 1 |
Table S10. Get Full Table List of one gene differentially expressed by 'PATHOLOGICSPREAD(M)'
| ANOVA_P | Q | |
|---|---|---|
| IGFBP2|IGFBP2-R-V | 0.0002593 | 0.0443 |
Figure S3. Get High-res Image As an example, this figure shows the association of IGFBP2|IGFBP2-R-V to 'PATHOLOGICSPREAD(M)'. P value = 0.000259 with ANOVA analysis.
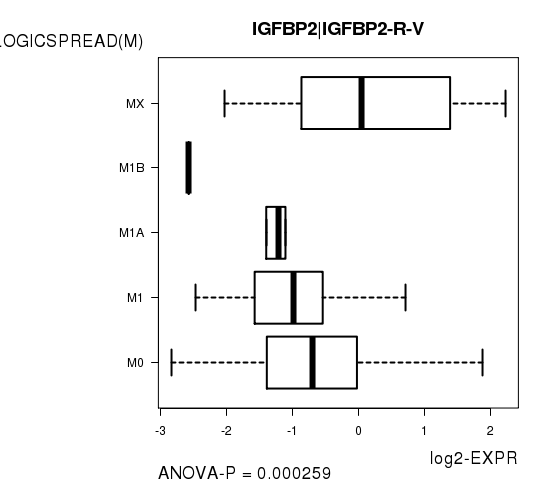
Table S11. Basic characteristics of clinical feature: 'TUMOR.STAGE'
| TUMOR.STAGE | Mean (SD) | 2.43 (0.92) |
| N | ||
| Stage 1 | 40 | |
| Stage 2 | 107 | |
| Stage 3 | 77 | |
| Stage 4 | 38 | |
| Significant markers | N = 0 |
3 genes related to 'RADIATIONS.RADIATION.REGIMENINDICATION'.
Table S12. Basic characteristics of clinical feature: 'RADIATIONS.RADIATION.REGIMENINDICATION'
| RADIATIONS.RADIATION.REGIMENINDICATION | Labels | N |
| NO | 3 | |
| YES | 266 | |
| Significant markers | N = 3 | |
| Higher in YES | 2 | |
| Higher in NO | 1 |
Table S13. Get Full Table List of 3 genes differentially expressed by 'RADIATIONS.RADIATION.REGIMENINDICATION'
| T(pos if higher in 'YES') | ttestP | Q | AUC | |
|---|---|---|---|---|
| LCK|LCK-R-V | 11.11 | 1.106e-22 | 1.89e-20 | 0.7531 |
| PECAM1|CD31-M-V | -10.82 | 1.561e-08 | 2.65e-06 | 0.8133 |
| SETD2|SETD2-R-NA | 4.79 | 2.966e-06 | 0.000501 | 0.5213 |
Figure S4. Get High-res Image As an example, this figure shows the association of LCK|LCK-R-V to 'RADIATIONS.RADIATION.REGIMENINDICATION'. P value = 1.11e-22 with T-test analysis.
-
Expresson data file = COAD-TP.rppa.txt
-
Clinical data file = COAD-TP.clin.merged.picked.txt
-
Number of patients = 269
-
Number of genes = 171
-
Number of clinical features = 9
For survival clinical features, Wald's test in univariate Cox regression analysis with proportional hazards model (Andersen and Gill 1982) was used to estimate the P values using the 'coxph' function in R. Kaplan-Meier survival curves were plot using the four quartile subgroups of patients based on expression levels
For continuous numerical clinical features, Spearman's rank correlation coefficients (Spearman 1904) and two-tailed P values were estimated using 'cor.test' function in R
For two-class clinical features, two-tailed Student's t test with unequal variance (Lehmann and Romano 2005) was applied to compare the log2-expression levels between the two clinical classes using 't.test' function in R
For multi-class clinical features (ordinal or nominal), one-way analysis of variance (Howell 2002) was applied to compare the log2-expression levels between different clinical classes using 'anova' function in R
For multiple hypothesis correction, Q value is the False Discovery Rate (FDR) analogue of the P value (Benjamini and Hochberg 1995), defined as the minimum FDR at which the test may be called significant. We used the 'Benjamini and Hochberg' method of 'p.adjust' function in R to convert P values into Q values.
This is an experimental feature. The full results of the analysis summarized in this report can be downloaded from the TCGA Data Coordination Center.