(primary solid tumor cohort)
This pipeline uses various statistical tests to identify mRNAs whose expression levels correlated to selected clinical features.
Testing the association between 17848 genes and 8 clinical features across 192 samples, statistically thresholded by Q value < 0.05, 4 clinical features related to at least one genes.
-
2 genes correlated to 'AGE'.
-
DDX27|55661 , KIAA0406|9675
-
25 genes correlated to 'GENDER'.
-
RPS4Y1|6192 , ZFY|7544 , DDX3Y|8653 , XIST|7503 , KDM5D|8284 , ...
-
101 genes correlated to 'HISTOLOGICAL.TYPE'.
-
PPP1R9A|55607 , DYNLRB1|83658 , ZIC5|85416 , MOCS3|27304 , POFUT1|23509 , ...
-
1 gene correlated to 'PATHOLOGY.N'.
-
CD2BP2|10421
-
No genes correlated to 'Time to Death', 'PATHOLOGY.T', 'PATHOLOGICSPREAD(M)', and 'TUMOR.STAGE'.
Complete statistical result table is provided in Supplement Table 1
Table 1. Get Full Table This table shows the clinical features, statistical methods used, and the number of genes that are significantly associated with each clinical feature at Q value < 0.05.
| Clinical feature | Statistical test | Significant genes | Associated with | Associated with | ||
|---|---|---|---|---|---|---|
| Time to Death | Cox regression test | N=0 | ||||
| AGE | Spearman correlation test | N=2 | older | N=0 | younger | N=2 |
| GENDER | t test | N=25 | male | N=13 | female | N=12 |
| HISTOLOGICAL TYPE | t test | N=101 | colon mucinous adenocarcinoma | N=49 | colon adenocarcinoma | N=52 |
| PATHOLOGY T | Spearman correlation test | N=0 | ||||
| PATHOLOGY N | Spearman correlation test | N=1 | higher pN | N=1 | lower pN | N=0 |
| PATHOLOGICSPREAD(M) | ANOVA test | N=0 | ||||
| TUMOR STAGE | Spearman correlation test | N=0 |
Table S1. Basic characteristics of clinical feature: 'Time to Death'
| Time to Death | Duration (Months) | 0.9-71.7 (median=12.4) |
| censored | N = 92 | |
| death | N = 16 | |
| Significant markers | N = 0 |
Table S2. Basic characteristics of clinical feature: 'AGE'
| AGE | Mean (SD) | 69.66 (12) |
| Significant markers | N = 2 | |
| pos. correlated | 0 | |
| neg. correlated | 2 |
Table S3. Get Full Table List of 2 genes significantly correlated to 'AGE' by Spearman correlation test
| SpearmanCorr | corrP | Q | |
|---|---|---|---|
| DDX27|55661 | -0.3351 | 2.019e-06 | 0.036 |
| KIAA0406|9675 | -0.3323 | 2.494e-06 | 0.0445 |
Figure S1. Get High-res Image As an example, this figure shows the association of DDX27|55661 to 'AGE'. P value = 2.02e-06 with Spearman correlation analysis. The straight line presents the best linear regression.
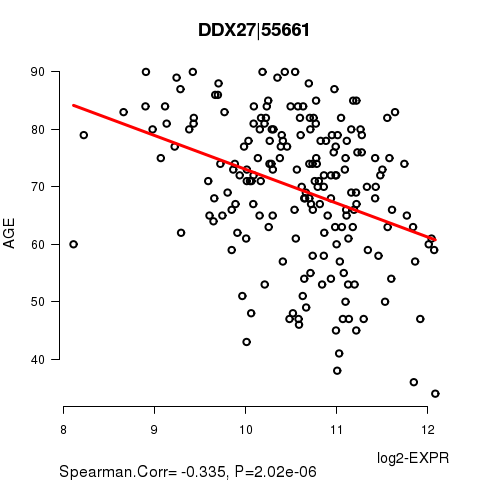
Table S4. Basic characteristics of clinical feature: 'GENDER'
| GENDER | Labels | N |
| FEMALE | 99 | |
| MALE | 93 | |
| Significant markers | N = 25 | |
| Higher in MALE | 13 | |
| Higher in FEMALE | 12 |
Table S5. Get Full Table List of top 10 genes differentially expressed by 'GENDER'
| T(pos if higher in 'MALE') | ttestP | Q | AUC | |
|---|---|---|---|---|
| RPS4Y1|6192 | 26.78 | 2.19e-63 | 3.91e-59 | 0.9974 |
| ZFY|7544 | 26.95 | 7.184e-51 | 1.28e-46 | 0.9919 |
| DDX3Y|8653 | 26.99 | 2.915e-47 | 5.2e-43 | 0.9951 |
| XIST|7503 | -20.01 | 9.653e-40 | 1.72e-35 | 0.9806 |
| KDM5D|8284 | 25.13 | 2.492e-39 | 4.45e-35 | 0.9955 |
| CYORF15A|246126 | 21.19 | 7.879e-38 | 1.41e-33 | 0.9884 |
| TMSB4Y|9087 | 19.26 | 1.606e-34 | 2.87e-30 | 0.975 |
| PRKY|5616 | 15.19 | 2.703e-34 | 4.82e-30 | 0.9331 |
| EIF1AY|9086 | 19.41 | 1.771e-28 | 3.16e-24 | 0.9901 |
| NLGN4Y|22829 | 14.56 | 7.649e-28 | 1.36e-23 | 0.9474 |
Figure S2. Get High-res Image As an example, this figure shows the association of RPS4Y1|6192 to 'GENDER'. P value = 2.19e-63 with T-test analysis.
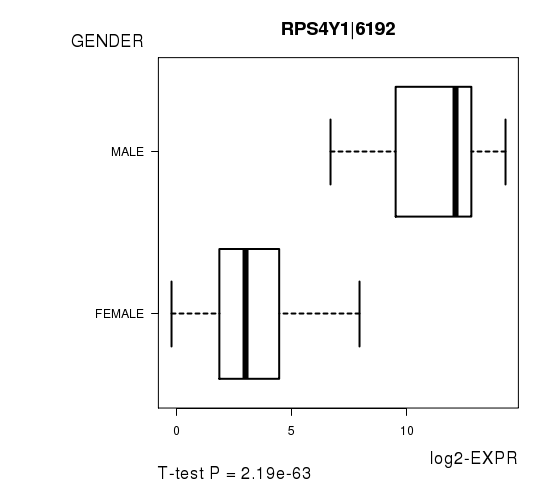
Table S6. Basic characteristics of clinical feature: 'HISTOLOGICAL.TYPE'
| HISTOLOGICAL.TYPE | Labels | N |
| COLON ADENOCARCINOMA | 162 | |
| COLON MUCINOUS ADENOCARCINOMA | 27 | |
| Significant markers | N = 101 | |
| Higher in COLON MUCINOUS ADENOCARCINOMA | 49 | |
| Higher in COLON ADENOCARCINOMA | 52 |
Table S7. Get Full Table List of top 10 genes differentially expressed by 'HISTOLOGICAL.TYPE'
| T(pos if higher in 'COLON MUCINOUS ADENOCARCINOMA') | ttestP | Q | AUC | |
|---|---|---|---|---|
| PPP1R9A|55607 | 7.66 | 9.842e-12 | 1.76e-07 | 0.7523 |
| DYNLRB1|83658 | -8.48 | 1.267e-11 | 2.26e-07 | 0.8425 |
| ZIC5|85416 | 7.92 | 3.9e-11 | 6.96e-07 | 0.8056 |
| MOCS3|27304 | -7.97 | 5.581e-11 | 9.96e-07 | 0.8185 |
| POFUT1|23509 | -7.71 | 1.731e-09 | 3.09e-05 | 0.8445 |
| C20ORF24|55969 | -7.34 | 1.813e-09 | 3.23e-05 | 0.8157 |
| ACTR5|79913 | -6.8 | 3.975e-09 | 7.09e-05 | 0.7757 |
| SDR16C5|195814 | 6.94 | 3.987e-09 | 7.11e-05 | 0.781 |
| PLAGL2|5326 | -7.46 | 4.012e-09 | 7.16e-05 | 0.8484 |
| CHMP4B|128866 | -7.22 | 5.549e-09 | 9.9e-05 | 0.8443 |
Figure S3. Get High-res Image As an example, this figure shows the association of PPP1R9A|55607 to 'HISTOLOGICAL.TYPE'. P value = 9.84e-12 with T-test analysis.
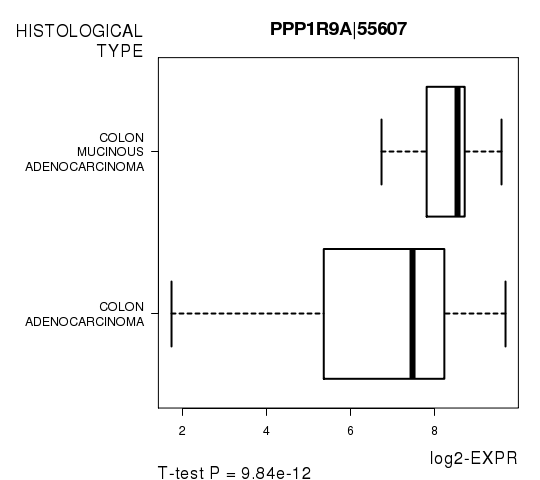
Table S8. Basic characteristics of clinical feature: 'PATHOLOGY.T'
| PATHOLOGY.T | Mean (SD) | 2.83 (0.63) |
| N | ||
| T1 | 6 | |
| T2 | 38 | |
| T3 | 128 | |
| T4 | 18 | |
| Significant markers | N = 0 |
Table S9. Basic characteristics of clinical feature: 'PATHOLOGY.N'
| PATHOLOGY.N | Mean (SD) | 0.59 (0.79) |
| N | ||
| N0 | 114 | |
| N1 | 41 | |
| N2 | 36 | |
| Significant markers | N = 1 | |
| pos. correlated | 1 | |
| neg. correlated | 0 |
Table S10. Get Full Table List of one gene significantly correlated to 'PATHOLOGY.N' by Spearman correlation test
| SpearmanCorr | corrP | Q | |
|---|---|---|---|
| CD2BP2|10421 | 0.3592 | 3.347e-07 | 0.00597 |
Figure S4. Get High-res Image As an example, this figure shows the association of CD2BP2|10421 to 'PATHOLOGY.N'. P value = 3.35e-07 with Spearman correlation analysis.
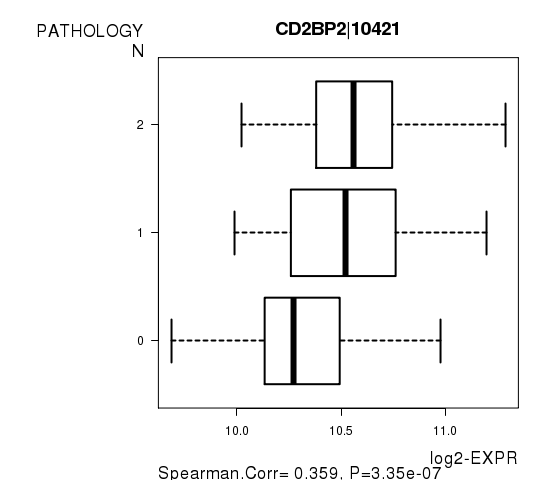
Table S11. Basic characteristics of clinical feature: 'PATHOLOGICSPREAD(M)'
| PATHOLOGICSPREAD(M) | Labels | N |
| M0 | 159 | |
| M1 | 28 | |
| M1A | 2 | |
| Significant markers | N = 0 |
-
Expresson data file = COAD-TP.uncv2.mRNAseq_RSEM_normalized_log2.txt
-
Clinical data file = COAD-TP.clin.merged.picked.txt
-
Number of patients = 192
-
Number of genes = 17848
-
Number of clinical features = 8
For survival clinical features, Wald's test in univariate Cox regression analysis with proportional hazards model (Andersen and Gill 1982) was used to estimate the P values using the 'coxph' function in R. Kaplan-Meier survival curves were plot using the four quartile subgroups of patients based on expression levels
For continuous numerical clinical features, Spearman's rank correlation coefficients (Spearman 1904) and two-tailed P values were estimated using 'cor.test' function in R
For two-class clinical features, two-tailed Student's t test with unequal variance (Lehmann and Romano 2005) was applied to compare the log2-expression levels between the two clinical classes using 't.test' function in R
For multi-class clinical features (ordinal or nominal), one-way analysis of variance (Howell 2002) was applied to compare the log2-expression levels between different clinical classes using 'anova' function in R
For multiple hypothesis correction, Q value is the False Discovery Rate (FDR) analogue of the P value (Benjamini and Hochberg 1995), defined as the minimum FDR at which the test may be called significant. We used the 'Benjamini and Hochberg' method of 'p.adjust' function in R to convert P values into Q values.
This is an experimental feature. The full results of the analysis summarized in this report can be downloaded from the TCGA Data Coordination Center.