(primary solid tumor cohort)
This pipeline uses various statistical tests to identify miRs whose expression levels correlated to selected clinical features.
Testing the association between 417 genes and 9 clinical features across 407 samples, statistically thresholded by Q value < 0.05, 5 clinical features related to at least one genes.
-
8 genes correlated to 'AGE'.
-
HSA-MIR-141 , HSA-MIR-26A-1 , HSA-MIR-153-2 , HSA-MIR-34A , HSA-MIR-432 , ...
-
13 genes correlated to 'HISTOLOGICAL.TYPE'.
-
HSA-MIR-592 , HSA-MIR-31 , HSA-MIR-92A-1 , HSA-MIR-92A-2 , HSA-MIR-374B , ...
-
1 gene correlated to 'PATHOLOGY.T'.
-
HSA-MIR-501
-
16 genes correlated to 'PATHOLOGICSPREAD(M)'.
-
HSA-MIR-628 , HSA-MIR-1180 , HSA-MIR-140 , HSA-MIR-106A , HSA-LET-7F-2 , ...
-
1 gene correlated to 'TUMOR.STAGE'.
-
HSA-MIR-625
-
No genes correlated to 'Time to Death', 'GENDER', 'PATHOLOGY.N', and 'RADIATIONS.RADIATION.REGIMENINDICATION'.
Complete statistical result table is provided in Supplement Table 1
Table 1. Get Full Table This table shows the clinical features, statistical methods used, and the number of genes that are significantly associated with each clinical feature at Q value < 0.05.
| Clinical feature | Statistical test | Significant genes | Associated with | Associated with | ||
|---|---|---|---|---|---|---|
| Time to Death | Cox regression test | N=0 | ||||
| AGE | Spearman correlation test | N=8 | older | N=7 | younger | N=1 |
| GENDER | t test | N=0 | ||||
| HISTOLOGICAL TYPE | t test | N=13 | colon mucinous adenocarcinoma | N=2 | colon adenocarcinoma | N=11 |
| PATHOLOGY T | Spearman correlation test | N=1 | higher pT | N=0 | lower pT | N=1 |
| PATHOLOGY N | Spearman correlation test | N=0 | ||||
| PATHOLOGICSPREAD(M) | ANOVA test | N=16 | ||||
| TUMOR STAGE | Spearman correlation test | N=1 | higher stage | N=0 | lower stage | N=1 |
| RADIATIONS RADIATION REGIMENINDICATION | t test | N=0 |
Table S1. Basic characteristics of clinical feature: 'Time to Death'
| Time to Death | Duration (Months) | 0.1-135.5 (median=7.5) |
| censored | N = 260 | |
| death | N = 49 | |
| Significant markers | N = 0 |
Table S2. Basic characteristics of clinical feature: 'AGE'
| AGE | Mean (SD) | 67.29 (13) |
| Significant markers | N = 8 | |
| pos. correlated | 7 | |
| neg. correlated | 1 |
Table S3. Get Full Table List of 8 genes significantly correlated to 'AGE' by Spearman correlation test
| SpearmanCorr | corrP | Q | |
|---|---|---|---|
| HSA-MIR-141 | 0.2362 | 1.484e-06 | 0.000619 |
| HSA-MIR-26A-1 | 0.2238 | 5.295e-06 | 0.0022 |
| HSA-MIR-153-2 | 0.2191 | 8.38e-06 | 0.00348 |
| HSA-MIR-34A | 0.2147 | 1.283e-05 | 0.00531 |
| HSA-MIR-432 | -0.2118 | 1.94e-05 | 0.00801 |
| HSA-MIR-33B | 0.1961 | 7.079e-05 | 0.0292 |
| HSA-MIR-616 | 0.1945 | 9.184e-05 | 0.0377 |
| HSA-MIR-653 | 0.1932 | 0.0001073 | 0.044 |
Figure S1. Get High-res Image As an example, this figure shows the association of HSA-MIR-141 to 'AGE'. P value = 1.48e-06 with Spearman correlation analysis. The straight line presents the best linear regression.

Table S4. Basic characteristics of clinical feature: 'GENDER'
| GENDER | Labels | N |
| FEMALE | 192 | |
| MALE | 215 | |
| Significant markers | N = 0 |
Table S5. Basic characteristics of clinical feature: 'HISTOLOGICAL.TYPE'
| HISTOLOGICAL.TYPE | Labels | N |
| COLON ADENOCARCINOMA | 349 | |
| COLON MUCINOUS ADENOCARCINOMA | 55 | |
| Significant markers | N = 13 | |
| Higher in COLON MUCINOUS ADENOCARCINOMA | 2 | |
| Higher in COLON ADENOCARCINOMA | 11 |
Table S6. Get Full Table List of top 10 genes differentially expressed by 'HISTOLOGICAL.TYPE'
| T(pos if higher in 'COLON MUCINOUS ADENOCARCINOMA') | ttestP | Q | AUC | |
|---|---|---|---|---|
| HSA-MIR-592 | -6.31 | 1.886e-08 | 7.87e-06 | 0.746 |
| HSA-MIR-31 | 5.81 | 1.242e-07 | 5.17e-05 | 0.7159 |
| HSA-MIR-92A-1 | -5.59 | 3.277e-07 | 0.000136 | 0.714 |
| HSA-MIR-92A-2 | -4.83 | 7.505e-06 | 0.00311 | 0.6961 |
| HSA-MIR-374B | -4.78 | 7.745e-06 | 0.0032 | 0.6792 |
| HSA-MIR-196B | -4.77 | 9.22e-06 | 0.0038 | 0.686 |
| HSA-MIR-574 | 4.64 | 1.48e-05 | 0.00608 | 0.6868 |
| HSA-MIR-29A | -4.63 | 1.666e-05 | 0.00683 | 0.6971 |
| HSA-MIR-1247 | -4.61 | 1.728e-05 | 0.00707 | 0.6913 |
| HSA-MIR-98 | -4.53 | 2.086e-05 | 0.00851 | 0.6802 |
Figure S2. Get High-res Image As an example, this figure shows the association of HSA-MIR-592 to 'HISTOLOGICAL.TYPE'. P value = 1.89e-08 with T-test analysis.
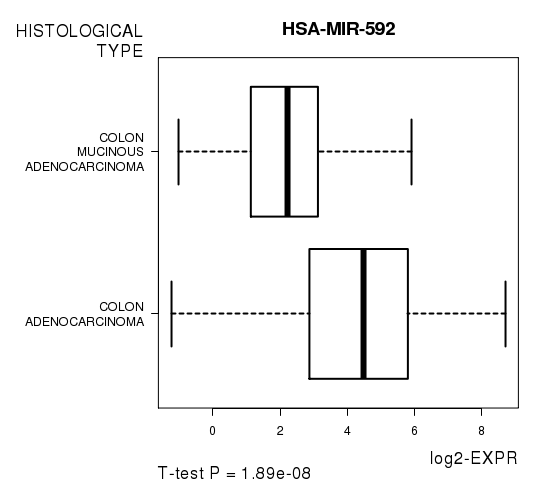
Table S7. Basic characteristics of clinical feature: 'PATHOLOGY.T'
| PATHOLOGY.T | Mean (SD) | 2.88 (0.63) |
| N | ||
| T0 | 1 | |
| T1 | 10 | |
| T2 | 69 | |
| T3 | 279 | |
| T4 | 45 | |
| Significant markers | N = 1 | |
| pos. correlated | 0 | |
| neg. correlated | 1 |
Table S8. Get Full Table List of one gene significantly correlated to 'PATHOLOGY.T' by Spearman correlation test
| SpearmanCorr | corrP | Q | |
|---|---|---|---|
| HSA-MIR-501 | -0.1908 | 0.0001139 | 0.0475 |
Figure S3. Get High-res Image As an example, this figure shows the association of HSA-MIR-501 to 'PATHOLOGY.T'. P value = 0.000114 with Spearman correlation analysis.
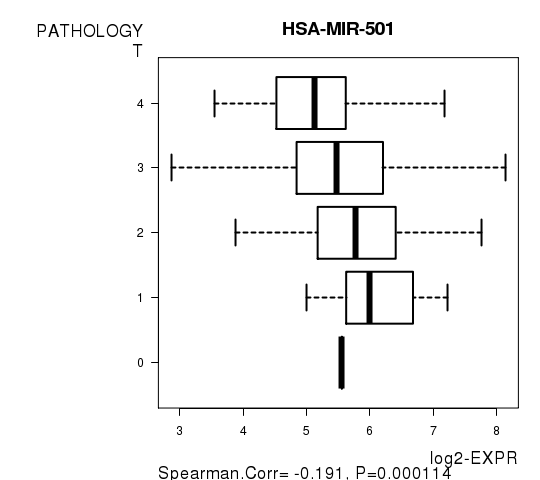
Table S9. Basic characteristics of clinical feature: 'PATHOLOGY.N'
| PATHOLOGY.N | Mean (SD) | 0.58 (0.77) |
| N | ||
| N0 | 241 | |
| N1 | 94 | |
| N2 | 70 | |
| Significant markers | N = 0 |
Table S10. Basic characteristics of clinical feature: 'PATHOLOGICSPREAD(M)'
| PATHOLOGICSPREAD(M) | Labels | N |
| M0 | 305 | |
| M1 | 50 | |
| M1A | 7 | |
| M1B | 1 | |
| MX | 36 | |
| Significant markers | N = 16 |
Table S11. Get Full Table List of top 10 genes differentially expressed by 'PATHOLOGICSPREAD(M)'
| ANOVA_P | Q | |
|---|---|---|
| HSA-MIR-628 | 1.496e-06 | 0.000624 |
| HSA-MIR-1180 | 1.503e-06 | 0.000625 |
| HSA-MIR-140 | 1.926e-06 | 0.000799 |
| HSA-MIR-106A | 4.51e-06 | 0.00187 |
| HSA-LET-7F-2 | 5.673e-06 | 0.00234 |
| HSA-MIR-142 | 7.536e-06 | 0.0031 |
| HSA-MIR-301A | 1.422e-05 | 0.00585 |
| HSA-LET-7A-1 | 2.684e-05 | 0.011 |
| HSA-MIR-126 | 2.76e-05 | 0.0113 |
| HSA-MIR-1277 | 2.984e-05 | 0.0122 |
Figure S4. Get High-res Image As an example, this figure shows the association of HSA-MIR-628 to 'PATHOLOGICSPREAD(M)'. P value = 1.5e-06 with ANOVA analysis.
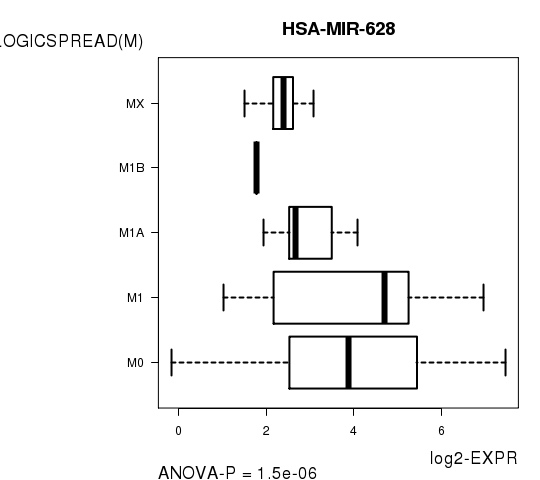
Table S12. Basic characteristics of clinical feature: 'TUMOR.STAGE'
| TUMOR.STAGE | Mean (SD) | 2.42 (0.93) |
| N | ||
| Stage 1 | 65 | |
| Stage 2 | 155 | |
| Stage 3 | 113 | |
| Stage 4 | 57 | |
| Significant markers | N = 1 | |
| pos. correlated | 0 | |
| neg. correlated | 1 |
Table S13. Get Full Table List of one gene significantly correlated to 'TUMOR.STAGE' by Spearman correlation test
| SpearmanCorr | corrP | Q | |
|---|---|---|---|
| HSA-MIR-625 | -0.2101 | 2.892e-05 | 0.0121 |
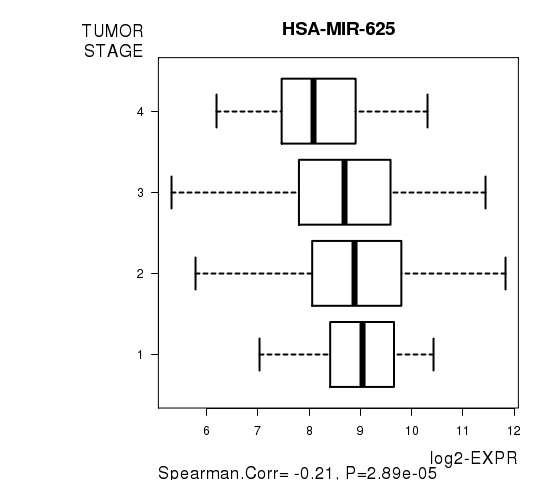
Figure S5. Get High-res Image As an example, this figure shows the association of HSA-MIR-625 to 'TUMOR.STAGE'. P value = 2.89e-05 with Spearman correlation analysis.
No gene related to 'RADIATIONS.RADIATION.REGIMENINDICATION'.
Table S14. Basic characteristics of clinical feature: 'RADIATIONS.RADIATION.REGIMENINDICATION'
| RADIATIONS.RADIATION.REGIMENINDICATION | Labels | N |
| NO | 3 | |
| YES | 404 | |
| Significant markers | N = 0 |
-
Expresson data file = COAD-TP.miRseq_RPKM_log2.txt
-
Clinical data file = COAD-TP.clin.merged.picked.txt
-
Number of patients = 407
-
Number of genes = 417
-
Number of clinical features = 9
For survival clinical features, Wald's test in univariate Cox regression analysis with proportional hazards model (Andersen and Gill 1982) was used to estimate the P values using the 'coxph' function in R. Kaplan-Meier survival curves were plot using the four quartile subgroups of patients based on expression levels
For continuous numerical clinical features, Spearman's rank correlation coefficients (Spearman 1904) and two-tailed P values were estimated using 'cor.test' function in R
For two-class clinical features, two-tailed Student's t test with unequal variance (Lehmann and Romano 2005) was applied to compare the log2-expression levels between the two clinical classes using 't.test' function in R
For multi-class clinical features (ordinal or nominal), one-way analysis of variance (Howell 2002) was applied to compare the log2-expression levels between different clinical classes using 'anova' function in R
For multiple hypothesis correction, Q value is the False Discovery Rate (FDR) analogue of the P value (Benjamini and Hochberg 1995), defined as the minimum FDR at which the test may be called significant. We used the 'Benjamini and Hochberg' method of 'p.adjust' function in R to convert P values into Q values.
This is an experimental feature. The full results of the analysis summarized in this report can be downloaded from the TCGA Data Coordination Center.