(primary solid tumor cohort)
This pipeline computes the correlation between cancer subtypes identified by different molecular patterns and selected clinical features.
Testing the association between subtypes identified by 8 different clustering approaches and 11 clinical features across 315 patients, 5 significant findings detected with P value < 0.05 and Q value < 0.25.
-
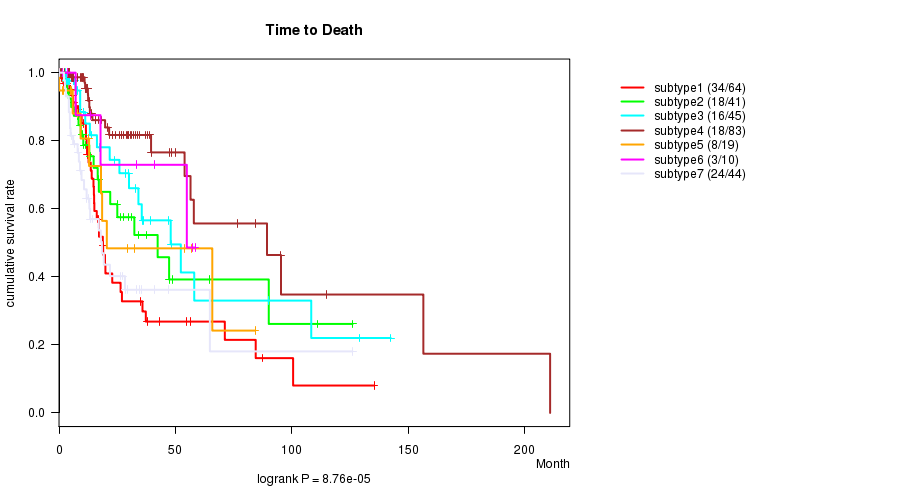
7 subtypes identified in current cancer cohort by 'CN CNMF'. These subtypes correlate to 'Time to Death', 'NUMBERPACKYEARSSMOKED', and 'TOBACCOSMOKINGHISTORYINDICATOR'.
-
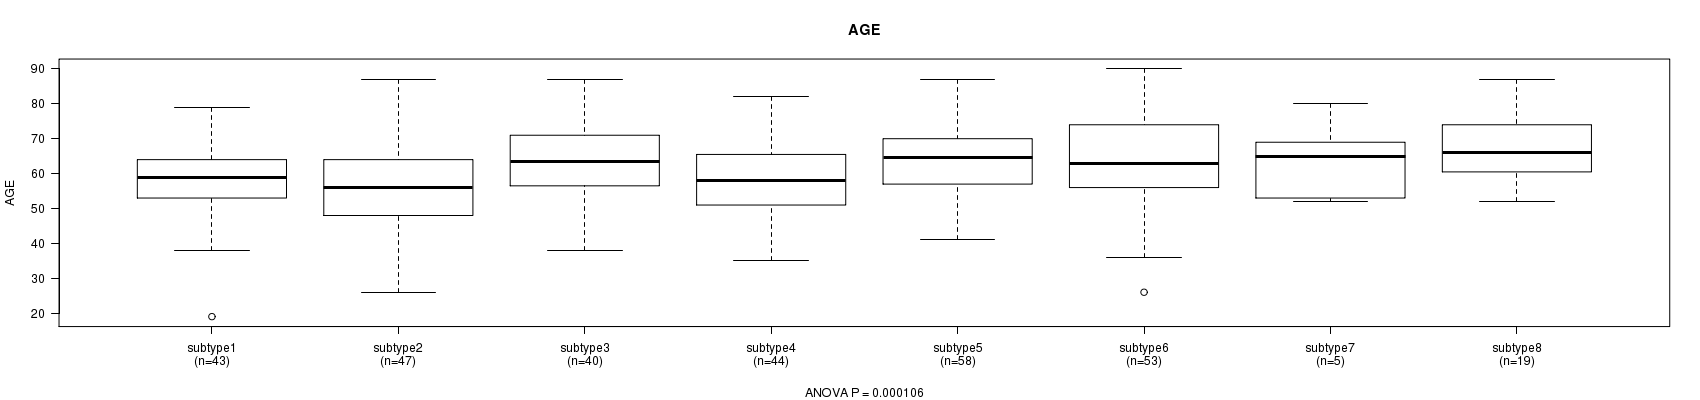
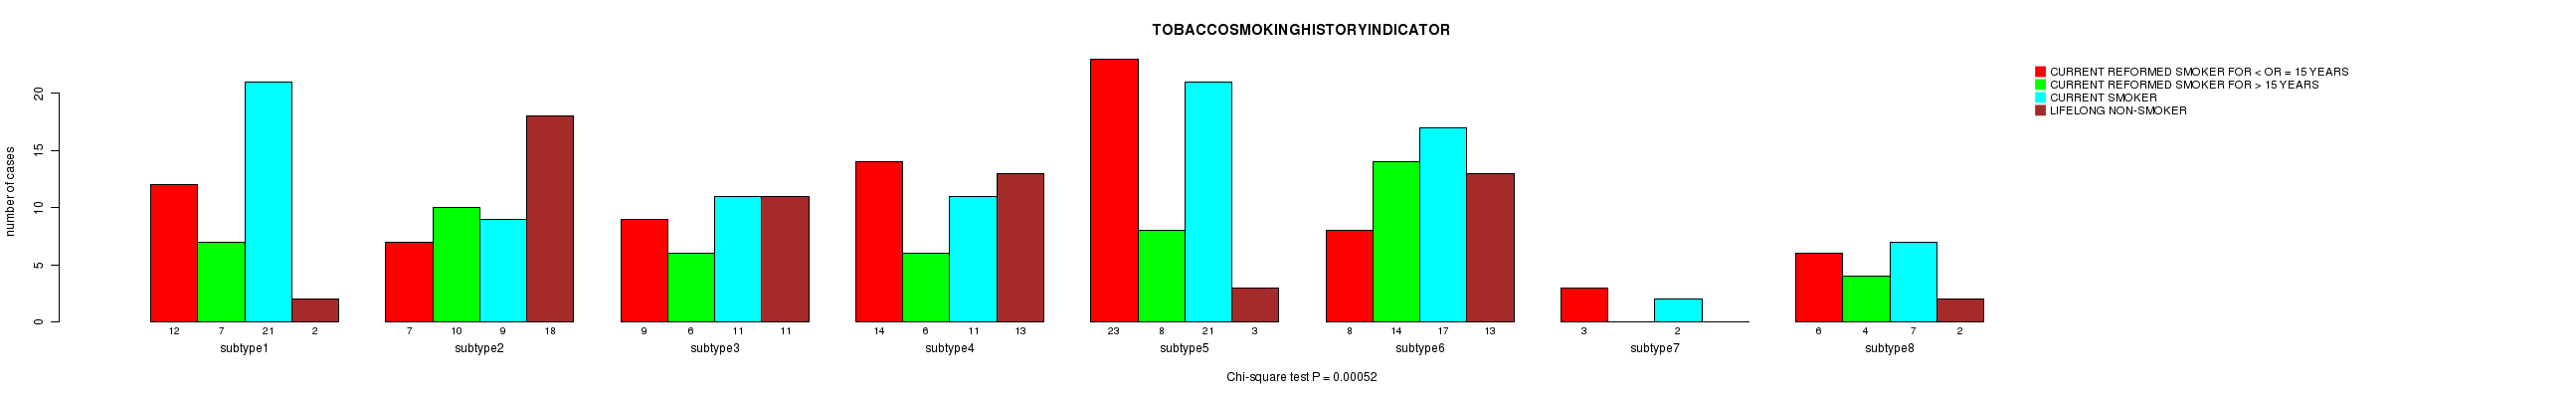
8 subtypes identified in current cancer cohort by 'METHLYATION CNMF'. These subtypes correlate to 'AGE' and 'TOBACCOSMOKINGHISTORYINDICATOR'.
-
CNMF clustering analysis on RPPA data identified 3 subtypes that do not correlate to any clinical features.
-
Consensus hierarchical clustering analysis on RPPA data identified 3 subtypes that do not correlate to any clinical features.
-
CNMF clustering analysis on sequencing-based mRNA expression data identified 3 subtypes that do not correlate to any clinical features.
-
Consensus hierarchical clustering analysis on sequencing-based mRNA expression data identified 3 subtypes that do not correlate to any clinical features.
-
CNMF clustering analysis on sequencing-based miR expression data identified 3 subtypes that do not correlate to any clinical features.
-
Consensus hierarchical clustering analysis on sequencing-based miR expression data identified 4 subtypes that do not correlate to any clinical features.
Table 1. Get Full Table Overview of the association between subtypes identified by 8 different clustering approaches and 11 clinical features. Shown in the table are P values (Q values). Thresholded by P value < 0.05 and Q value < 0.25, 5 significant findings detected.
|
Clinical Features |
Statistical Tests |
CN CNMF |
METHLYATION CNMF |
RPPA CNMF subtypes |
RPPA cHierClus subtypes |
RNAseq CNMF subtypes |
RNAseq cHierClus subtypes |
MIRseq CNMF subtypes |
MIRseq cHierClus subtypes |
| Time to Death | logrank test |
8.76e-05 (0.00771) |
0.0554 (1.00) |
0.109 (1.00) |
0.265 (1.00) |
0.448 (1.00) |
0.205 (1.00) |
0.94 (1.00) |
0.574 (1.00) |
| AGE | ANOVA |
0.193 (1.00) |
0.000106 (0.00922) |
0.434 (1.00) |
0.303 (1.00) |
0.925 (1.00) |
0.383 (1.00) |
0.73 (1.00) |
0.688 (1.00) |
| GENDER | Fisher's exact test |
0.71 (1.00) |
0.0445 (1.00) |
0.139 (1.00) |
0.842 (1.00) |
0.188 (1.00) |
0.00985 (0.808) |
0.0643 (1.00) |
0.637 (1.00) |
| PATHOLOGY T | Chi-square test |
0.473 (1.00) |
0.0887 (1.00) |
0.216 (1.00) |
0.194 (1.00) |
0.225 (1.00) |
0.298 (1.00) |
0.121 (1.00) |
0.395 (1.00) |
| PATHOLOGY N | Chi-square test |
0.0188 (1.00) |
0.439 (1.00) |
0.0063 (0.523) |
0.0534 (1.00) |
0.194 (1.00) |
0.0772 (1.00) |
0.109 (1.00) |
0.191 (1.00) |
| TUMOR STAGE | Chi-square test |
0.486 (1.00) |
0.272 (1.00) |
0.0532 (1.00) |
0.103 (1.00) |
0.0364 (1.00) |
0.39 (1.00) |
0.451 (1.00) |
0.321 (1.00) |
| RADIATIONS RADIATION REGIMENINDICATION | Fisher's exact test |
0.86 (1.00) |
0.715 (1.00) |
0.301 (1.00) |
0.595 (1.00) |
0.413 (1.00) |
0.546 (1.00) |
0.533 (1.00) |
0.551 (1.00) |
| NUMBERPACKYEARSSMOKED | ANOVA |
0.00135 (0.114) |
0.0491 (1.00) |
0.658 (1.00) |
0.752 (1.00) |
0.0646 (1.00) |
0.0544 (1.00) |
0.413 (1.00) |
0.315 (1.00) |
| STOPPEDSMOKINGYEAR | ANOVA |
0.362 (1.00) |
0.19 (1.00) |
0.79 (1.00) |
0.37 (1.00) |
0.587 (1.00) |
0.724 (1.00) |
0.632 (1.00) |
0.447 (1.00) |
| TOBACCOSMOKINGHISTORYINDICATOR | Chi-square test |
0.000205 (0.0176) |
0.00052 (0.0442) |
0.167 (1.00) |
0.433 (1.00) |
0.42 (1.00) |
0.129 (1.00) |
0.217 (1.00) |
0.624 (1.00) |
| YEAROFTOBACCOSMOKINGONSET | ANOVA |
0.801 (1.00) |
0.0163 (1.00) |
0.539 (1.00) |
0.746 (1.00) |
0.133 (1.00) |
0.125 (1.00) |
0.366 (1.00) |
0.213 (1.00) |
Table S1. Get Full Table Description of clustering approach #1: 'CN CNMF'
| Cluster Labels | 1 | 2 | 3 | 4 | 5 | 6 | 7 |
|---|---|---|---|---|---|---|---|
| Number of samples | 64 | 41 | 45 | 83 | 20 | 10 | 46 |
P value = 8.76e-05 (logrank test), Q value = 0.0077
Table S2. Clustering Approach #1: 'CN CNMF' versus Clinical Feature #1: 'Time to Death'
| nPatients | nDeath | Duration Range (Median), Month | |
|---|---|---|---|
| ALL | 306 | 121 | 0.1 - 210.9 (14.2) |
| subtype1 | 64 | 34 | 0.2 - 135.3 (12.4) |
| subtype2 | 41 | 18 | 1.0 - 126.1 (16.6) |
| subtype3 | 45 | 16 | 1.0 - 142.5 (16.3) |
| subtype4 | 83 | 18 | 0.8 - 210.9 (17.8) |
| subtype5 | 19 | 8 | 0.1 - 84.2 (12.9) |
| subtype6 | 10 | 3 | 1.5 - 58.4 (25.5) |
| subtype7 | 44 | 24 | 0.1 - 126.1 (12.2) |
Figure S1. Get High-res Image Clustering Approach #1: 'CN CNMF' versus Clinical Feature #1: 'Time to Death'
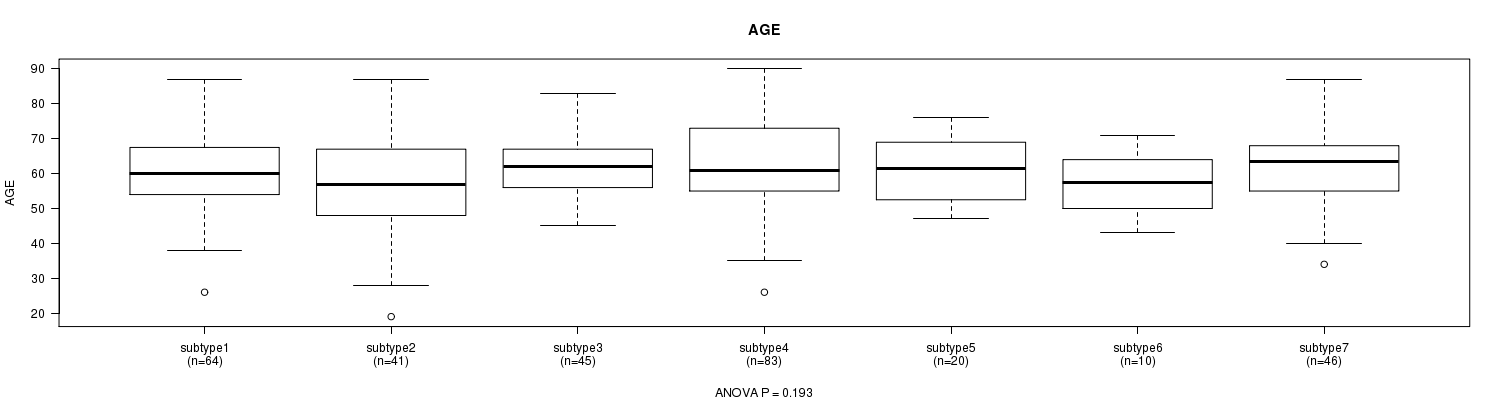
P value = 0.193 (ANOVA), Q value = 1
Table S3. Clustering Approach #1: 'CN CNMF' versus Clinical Feature #2: 'AGE'
| nPatients | Mean (Std.Dev) | |
|---|---|---|
| ALL | 309 | 61.0 (12.0) |
| subtype1 | 64 | 60.7 (11.4) |
| subtype2 | 41 | 56.8 (15.7) |
| subtype3 | 45 | 62.5 (9.4) |
| subtype4 | 83 | 62.4 (13.0) |
| subtype5 | 20 | 61.2 (8.8) |
| subtype6 | 10 | 56.8 (8.8) |
| subtype7 | 46 | 62.3 (10.8) |
Figure S2. Get High-res Image Clustering Approach #1: 'CN CNMF' versus Clinical Feature #2: 'AGE'
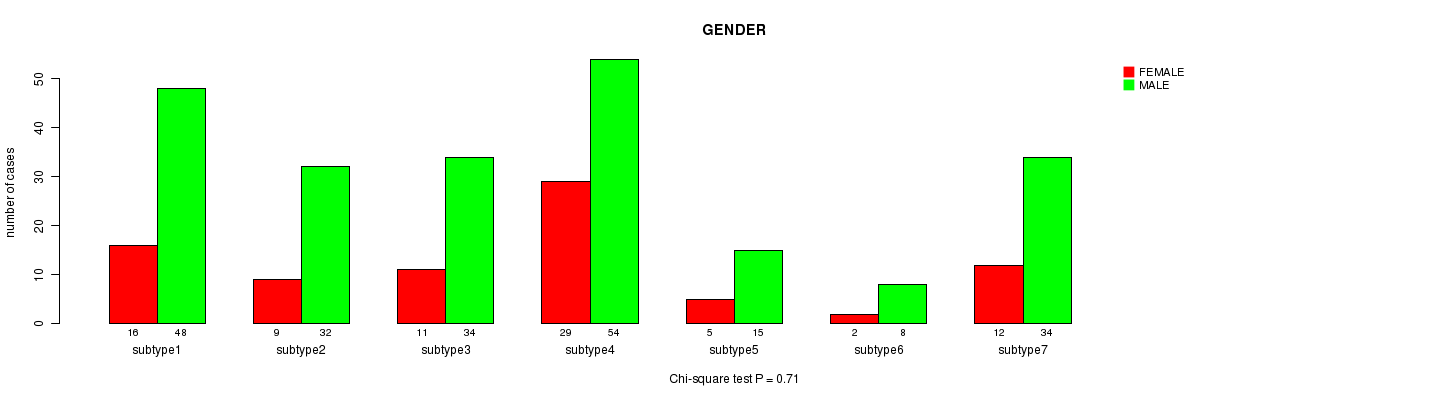
P value = 0.71 (Chi-square test), Q value = 1
Table S4. Clustering Approach #1: 'CN CNMF' versus Clinical Feature #3: 'GENDER'
| nPatients | FEMALE | MALE |
|---|---|---|
| ALL | 84 | 225 |
| subtype1 | 16 | 48 |
| subtype2 | 9 | 32 |
| subtype3 | 11 | 34 |
| subtype4 | 29 | 54 |
| subtype5 | 5 | 15 |
| subtype6 | 2 | 8 |
| subtype7 | 12 | 34 |
Figure S3. Get High-res Image Clustering Approach #1: 'CN CNMF' versus Clinical Feature #3: 'GENDER'
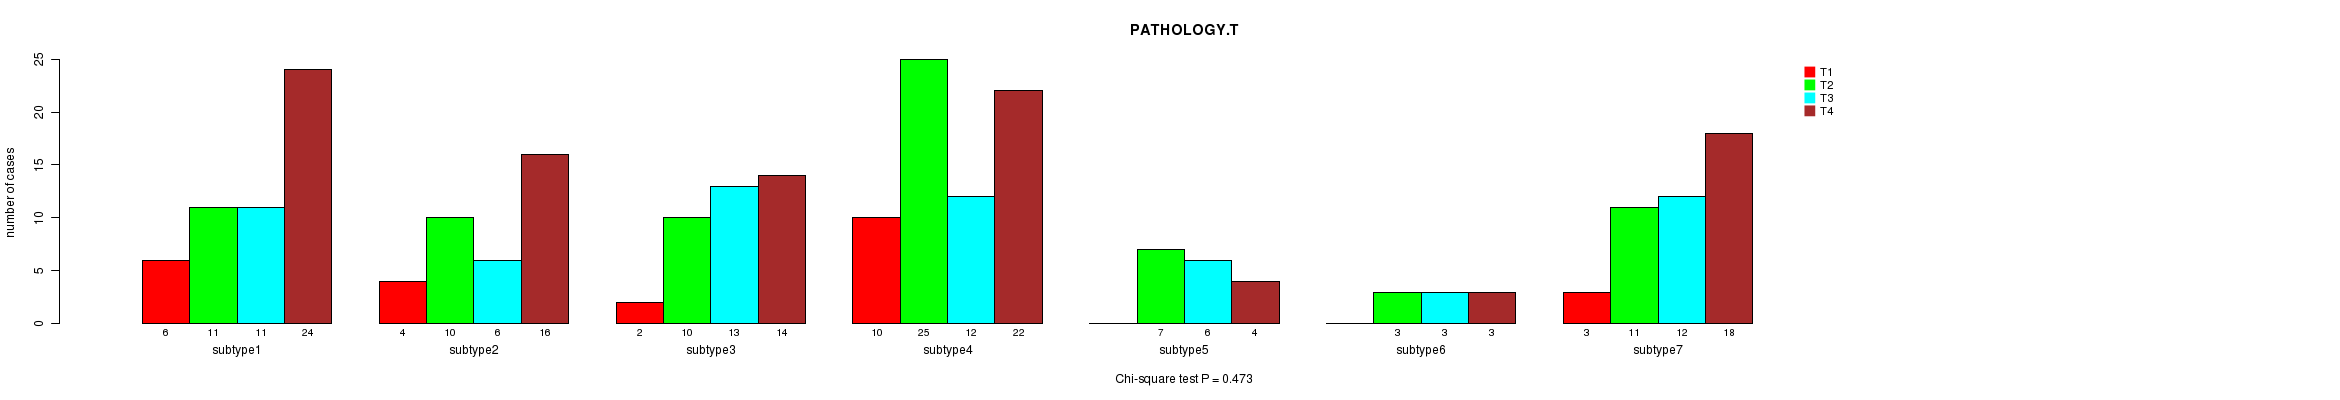
P value = 0.473 (Chi-square test), Q value = 1
Table S5. Clustering Approach #1: 'CN CNMF' versus Clinical Feature #4: 'PATHOLOGY.T'
| nPatients | T1 | T2 | T3 | T4 |
|---|---|---|---|---|
| ALL | 25 | 77 | 63 | 101 |
| subtype1 | 6 | 11 | 11 | 24 |
| subtype2 | 4 | 10 | 6 | 16 |
| subtype3 | 2 | 10 | 13 | 14 |
| subtype4 | 10 | 25 | 12 | 22 |
| subtype5 | 0 | 7 | 6 | 4 |
| subtype6 | 0 | 3 | 3 | 3 |
| subtype7 | 3 | 11 | 12 | 18 |
Figure S4. Get High-res Image Clustering Approach #1: 'CN CNMF' versus Clinical Feature #4: 'PATHOLOGY.T'
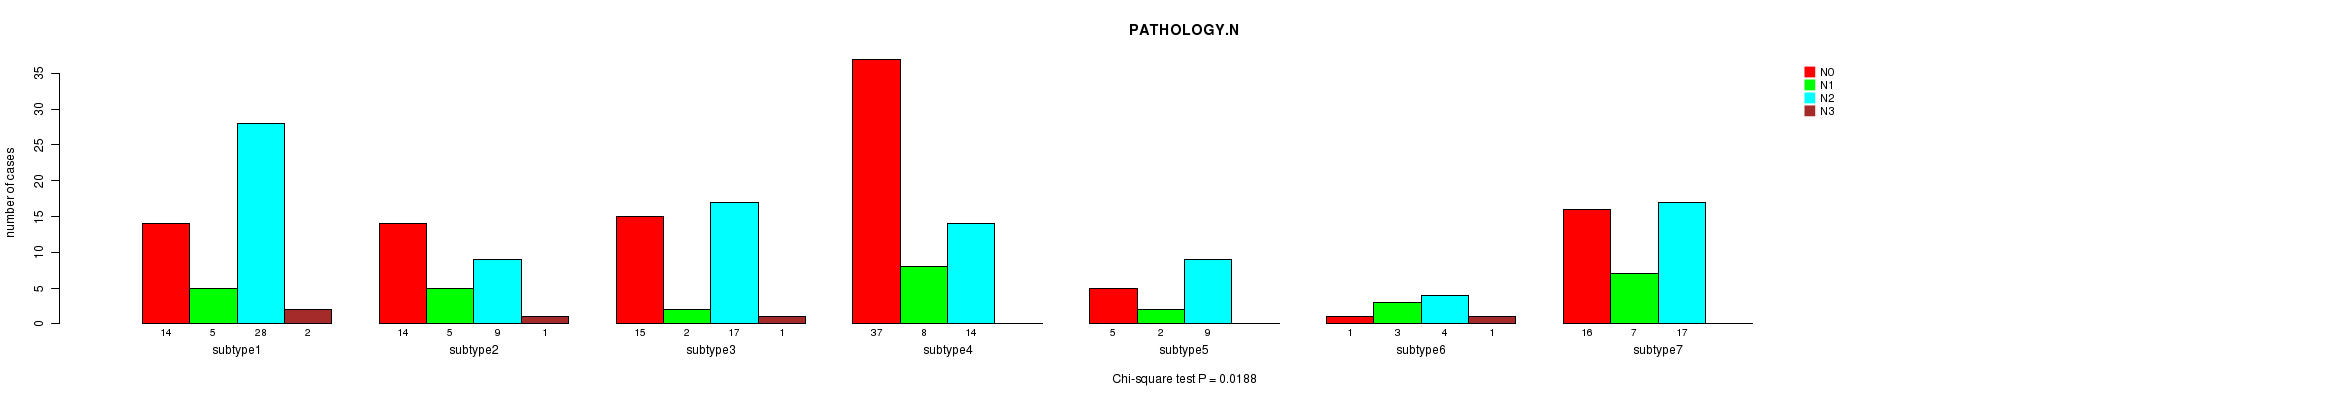
P value = 0.0188 (Chi-square test), Q value = 1
Table S6. Clustering Approach #1: 'CN CNMF' versus Clinical Feature #5: 'PATHOLOGY.N'
| nPatients | N0 | N1 | N2 | N3 |
|---|---|---|---|---|
| ALL | 102 | 32 | 98 | 5 |
| subtype1 | 14 | 5 | 28 | 2 |
| subtype2 | 14 | 5 | 9 | 1 |
| subtype3 | 15 | 2 | 17 | 1 |
| subtype4 | 37 | 8 | 14 | 0 |
| subtype5 | 5 | 2 | 9 | 0 |
| subtype6 | 1 | 3 | 4 | 1 |
| subtype7 | 16 | 7 | 17 | 0 |
Figure S5. Get High-res Image Clustering Approach #1: 'CN CNMF' versus Clinical Feature #5: 'PATHOLOGY.N'
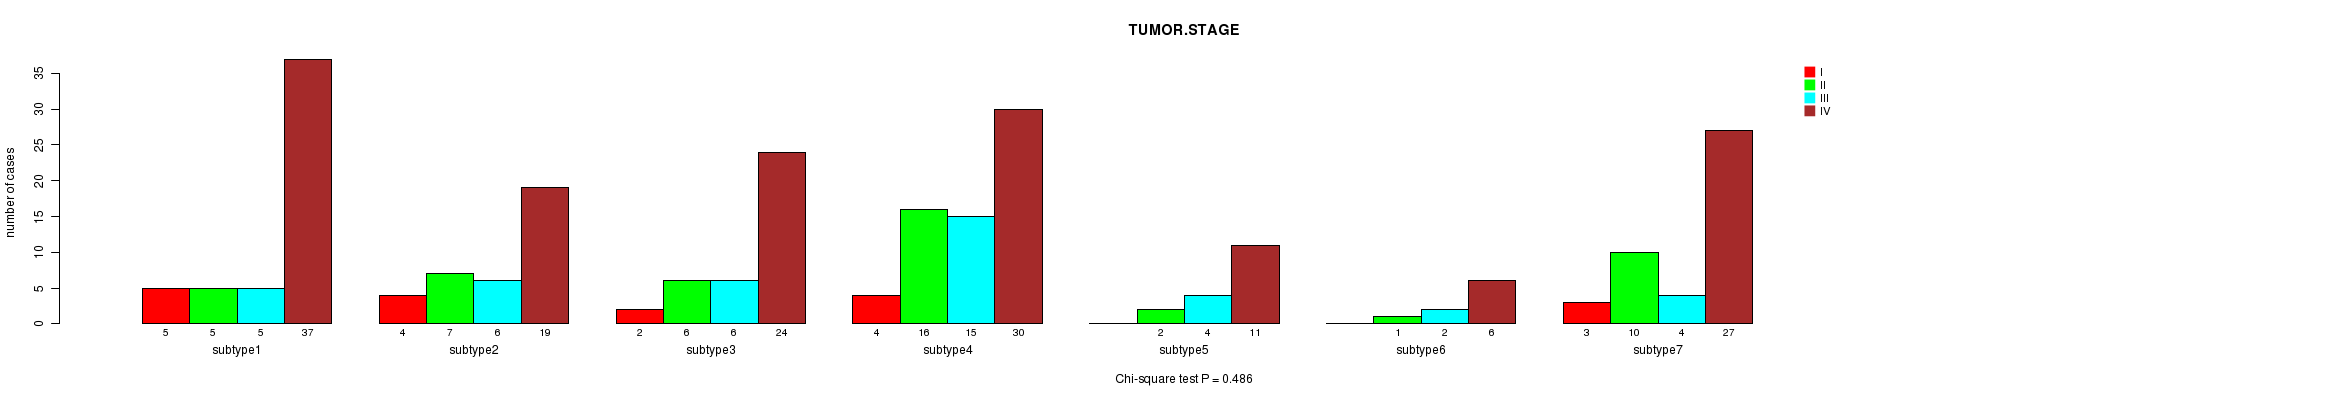
P value = 0.486 (Chi-square test), Q value = 1
Table S7. Clustering Approach #1: 'CN CNMF' versus Clinical Feature #6: 'TUMOR.STAGE'
| nPatients | I | II | III | IV |
|---|---|---|---|---|
| ALL | 18 | 47 | 42 | 154 |
| subtype1 | 5 | 5 | 5 | 37 |
| subtype2 | 4 | 7 | 6 | 19 |
| subtype3 | 2 | 6 | 6 | 24 |
| subtype4 | 4 | 16 | 15 | 30 |
| subtype5 | 0 | 2 | 4 | 11 |
| subtype6 | 0 | 1 | 2 | 6 |
| subtype7 | 3 | 10 | 4 | 27 |
Figure S6. Get High-res Image Clustering Approach #1: 'CN CNMF' versus Clinical Feature #6: 'TUMOR.STAGE'
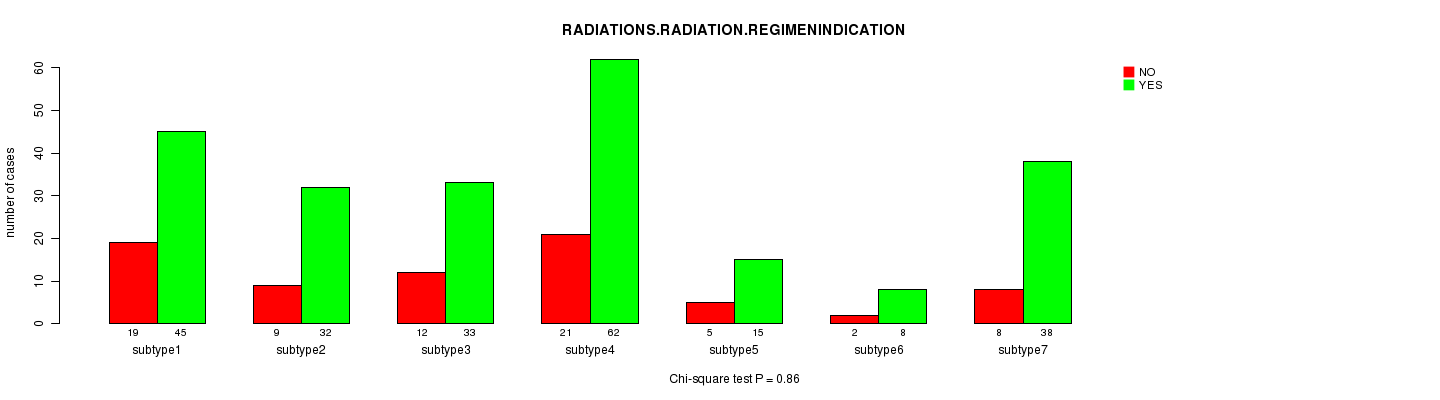
P value = 0.86 (Chi-square test), Q value = 1
Table S8. Clustering Approach #1: 'CN CNMF' versus Clinical Feature #7: 'RADIATIONS.RADIATION.REGIMENINDICATION'
| nPatients | NO | YES |
|---|---|---|
| ALL | 76 | 233 |
| subtype1 | 19 | 45 |
| subtype2 | 9 | 32 |
| subtype3 | 12 | 33 |
| subtype4 | 21 | 62 |
| subtype5 | 5 | 15 |
| subtype6 | 2 | 8 |
| subtype7 | 8 | 38 |
Figure S7. Get High-res Image Clustering Approach #1: 'CN CNMF' versus Clinical Feature #7: 'RADIATIONS.RADIATION.REGIMENINDICATION'
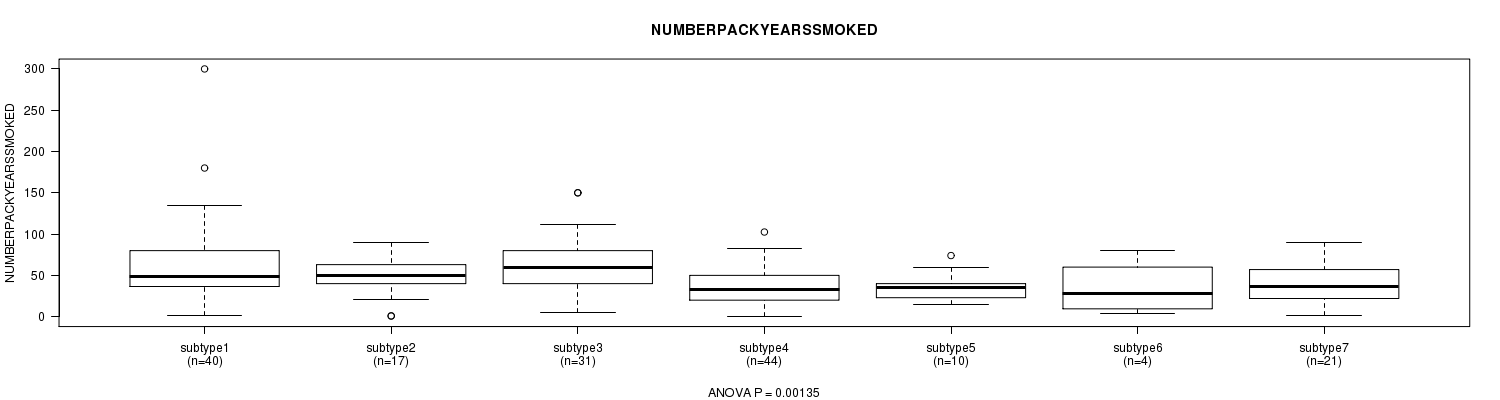
P value = 0.00135 (ANOVA), Q value = 0.11
Table S9. Clustering Approach #1: 'CN CNMF' versus Clinical Feature #8: 'NUMBERPACKYEARSSMOKED'
| nPatients | Mean (Std.Dev) | |
|---|---|---|
| ALL | 167 | 49.8 (37.1) |
| subtype1 | 40 | 64.9 (53.1) |
| subtype2 | 17 | 49.1 (25.1) |
| subtype3 | 31 | 63.6 (36.5) |
| subtype4 | 44 | 35.1 (23.3) |
| subtype5 | 10 | 37.8 (17.8) |
| subtype6 | 4 | 34.8 (33.7) |
| subtype7 | 21 | 40.4 (22.8) |
Figure S8. Get High-res Image Clustering Approach #1: 'CN CNMF' versus Clinical Feature #8: 'NUMBERPACKYEARSSMOKED'
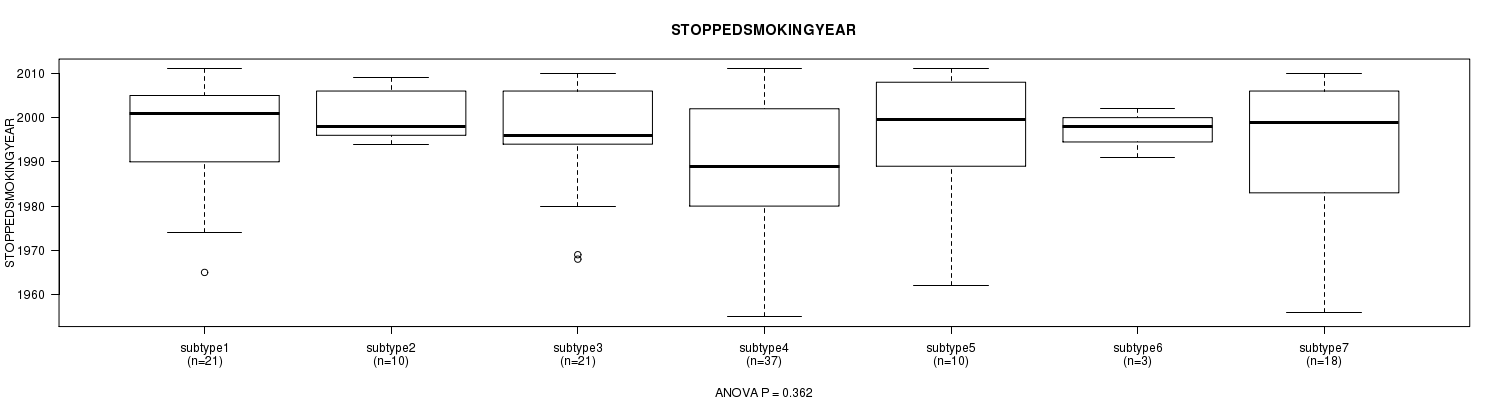
P value = 0.362 (ANOVA), Q value = 1
Table S10. Clustering Approach #1: 'CN CNMF' versus Clinical Feature #9: 'STOPPEDSMOKINGYEAR'
| nPatients | Mean (Std.Dev) | |
|---|---|---|
| ALL | 120 | 1994.5 (13.8) |
| subtype1 | 21 | 1996.0 (13.7) |
| subtype2 | 10 | 2000.2 (5.6) |
| subtype3 | 21 | 1996.4 (12.1) |
| subtype4 | 37 | 1990.0 (15.4) |
| subtype5 | 10 | 1996.8 (14.9) |
| subtype6 | 3 | 1997.0 (5.6) |
| subtype7 | 18 | 1994.6 (14.8) |
Figure S9. Get High-res Image Clustering Approach #1: 'CN CNMF' versus Clinical Feature #9: 'STOPPEDSMOKINGYEAR'
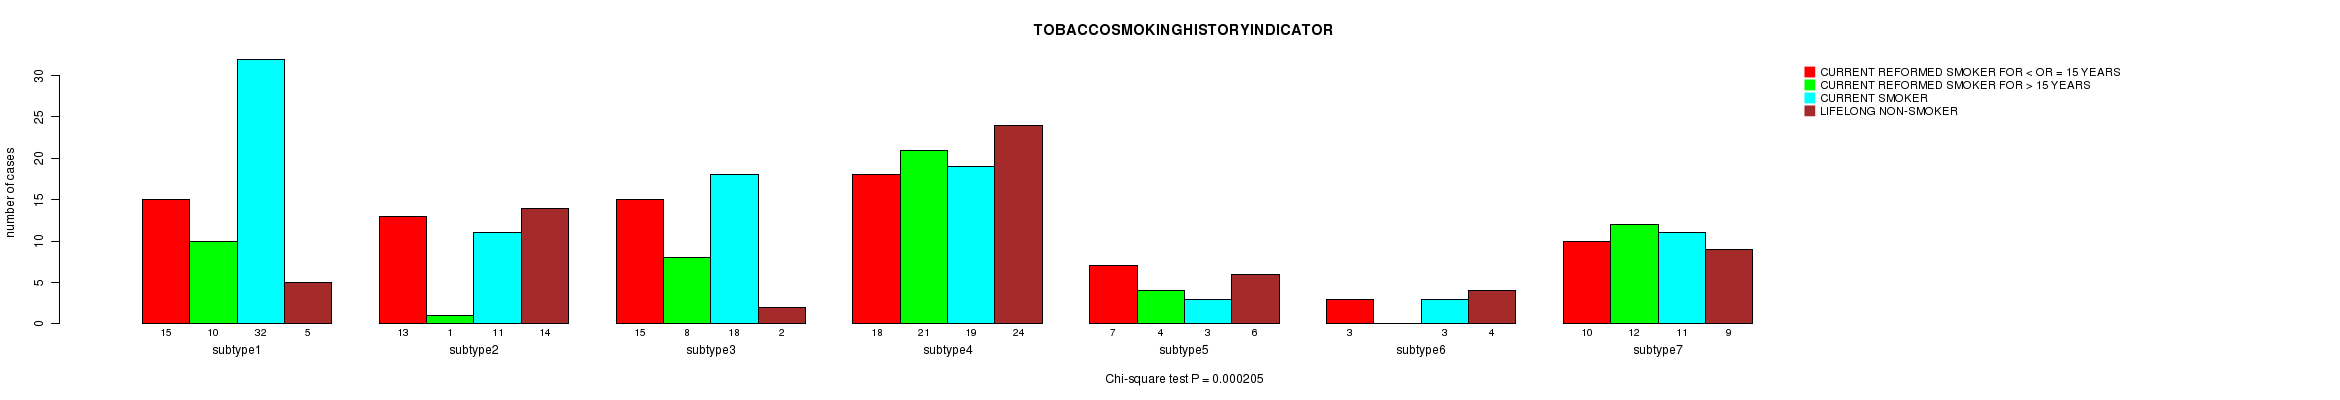
P value = 0.000205 (Chi-square test), Q value = 0.018
Table S11. Clustering Approach #1: 'CN CNMF' versus Clinical Feature #10: 'TOBACCOSMOKINGHISTORYINDICATOR'
| nPatients | CURRENT REFORMED SMOKER FOR < OR = 15 YEARS | CURRENT REFORMED SMOKER FOR > 15 YEARS | CURRENT SMOKER | LIFELONG NON-SMOKER |
|---|---|---|---|---|
| ALL | 81 | 56 | 97 | 64 |
| subtype1 | 15 | 10 | 32 | 5 |
| subtype2 | 13 | 1 | 11 | 14 |
| subtype3 | 15 | 8 | 18 | 2 |
| subtype4 | 18 | 21 | 19 | 24 |
| subtype5 | 7 | 4 | 3 | 6 |
| subtype6 | 3 | 0 | 3 | 4 |
| subtype7 | 10 | 12 | 11 | 9 |
Figure S10. Get High-res Image Clustering Approach #1: 'CN CNMF' versus Clinical Feature #10: 'TOBACCOSMOKINGHISTORYINDICATOR'
P value = 0.801 (ANOVA), Q value = 1
Table S12. Clustering Approach #1: 'CN CNMF' versus Clinical Feature #11: 'YEAROFTOBACCOSMOKINGONSET'
| nPatients | Mean (Std.Dev) | |
|---|---|---|
| ALL | 174 | 1964.6 (12.3) |
| subtype1 | 43 | 1965.7 (11.5) |
| subtype2 | 18 | 1966.3 (13.5) |
| subtype3 | 31 | 1963.3 (11.0) |
| subtype4 | 45 | 1963.1 (14.2) |
| subtype5 | 8 | 1967.9 (7.4) |
| subtype6 | 5 | 1969.4 (6.8) |
| subtype7 | 24 | 1964.0 (13.1) |
Figure S11. Get High-res Image Clustering Approach #1: 'CN CNMF' versus Clinical Feature #11: 'YEAROFTOBACCOSMOKINGONSET'
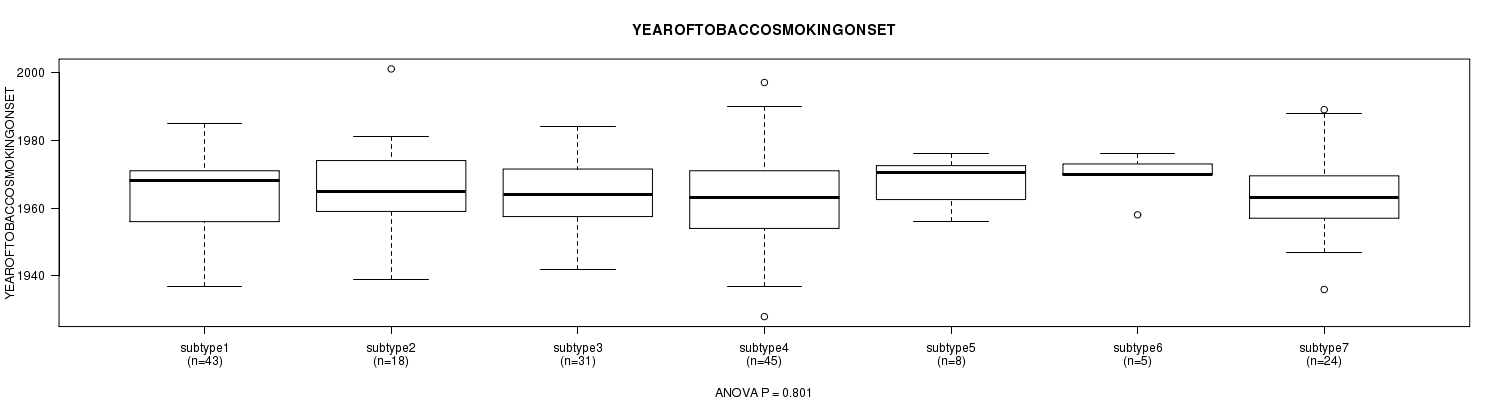
Table S13. Get Full Table Description of clustering approach #2: 'METHLYATION CNMF'
| Cluster Labels | 1 | 2 | 3 | 4 | 5 | 6 | 7 | 8 |
|---|---|---|---|---|---|---|---|---|
| Number of samples | 43 | 47 | 40 | 44 | 58 | 53 | 5 | 19 |
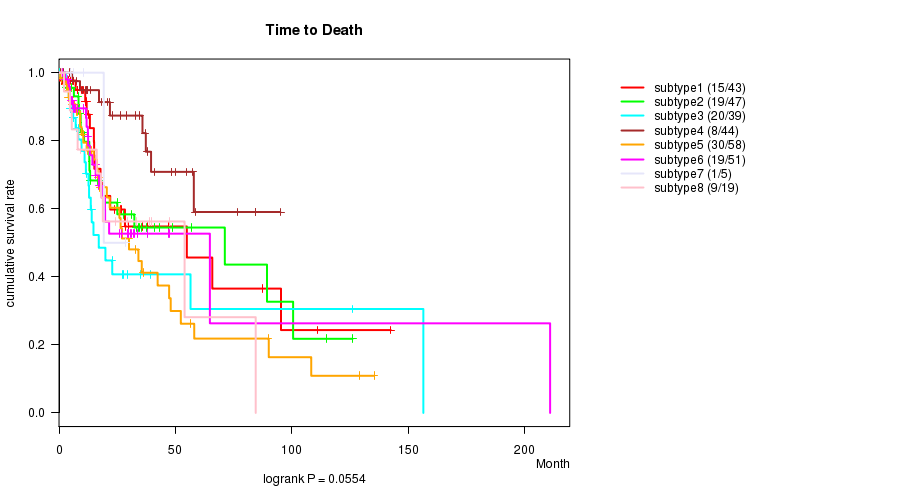
P value = 0.0554 (logrank test), Q value = 1
Table S14. Clustering Approach #2: 'METHLYATION CNMF' versus Clinical Feature #1: 'Time to Death'
| nPatients | nDeath | Duration Range (Median), Month | |
|---|---|---|---|
| ALL | 306 | 121 | 0.1 - 210.9 (14.6) |
| subtype1 | 43 | 15 | 0.1 - 142.5 (13.2) |
| subtype2 | 47 | 19 | 0.2 - 126.1 (13.6) |
| subtype3 | 39 | 20 | 0.1 - 156.5 (12.7) |
| subtype4 | 44 | 8 | 0.8 - 95.0 (22.3) |
| subtype5 | 58 | 30 | 0.5 - 135.3 (14.4) |
| subtype6 | 51 | 19 | 1.5 - 210.9 (14.3) |
| subtype7 | 5 | 1 | 5.0 - 28.6 (10.7) |
| subtype8 | 19 | 9 | 1.0 - 84.5 (18.0) |
Figure S12. Get High-res Image Clustering Approach #2: 'METHLYATION CNMF' versus Clinical Feature #1: 'Time to Death'
P value = 0.000106 (ANOVA), Q value = 0.0092
Table S15. Clustering Approach #2: 'METHLYATION CNMF' versus Clinical Feature #2: 'AGE'
| nPatients | Mean (Std.Dev) | |
|---|---|---|
| ALL | 309 | 61.1 (12.1) |
| subtype1 | 43 | 58.0 (10.6) |
| subtype2 | 47 | 55.5 (13.8) |
| subtype3 | 40 | 62.4 (11.1) |
| subtype4 | 44 | 58.1 (10.9) |
| subtype5 | 58 | 64.4 (10.1) |
| subtype6 | 53 | 63.9 (13.2) |
| subtype7 | 5 | 63.8 (11.7) |
| subtype8 | 19 | 67.4 (10.3) |
Figure S13. Get High-res Image Clustering Approach #2: 'METHLYATION CNMF' versus Clinical Feature #2: 'AGE'
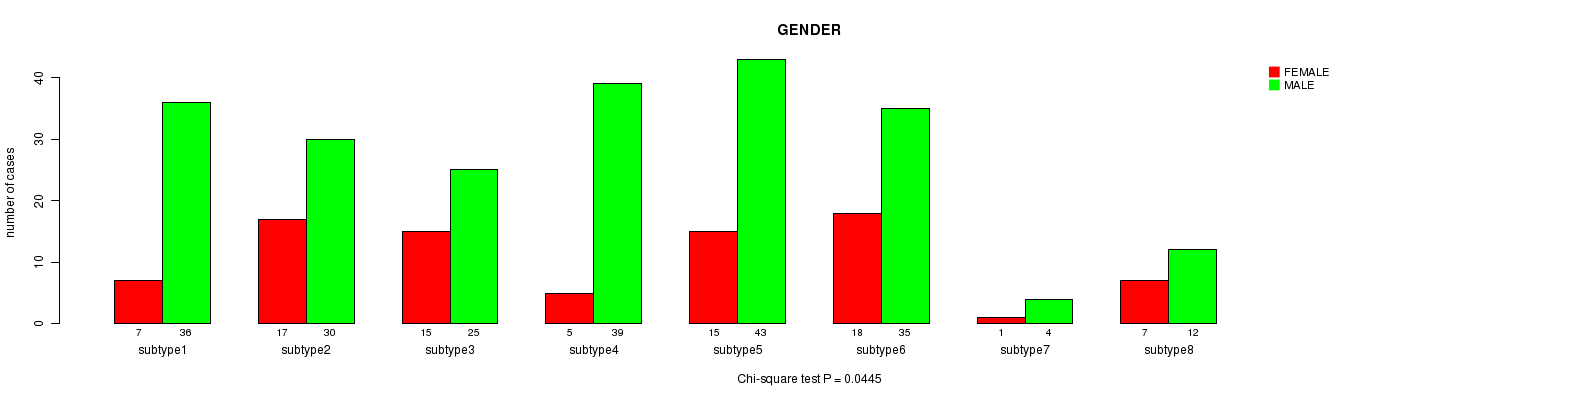
P value = 0.0445 (Chi-square test), Q value = 1
Table S16. Clustering Approach #2: 'METHLYATION CNMF' versus Clinical Feature #3: 'GENDER'
| nPatients | FEMALE | MALE |
|---|---|---|
| ALL | 85 | 224 |
| subtype1 | 7 | 36 |
| subtype2 | 17 | 30 |
| subtype3 | 15 | 25 |
| subtype4 | 5 | 39 |
| subtype5 | 15 | 43 |
| subtype6 | 18 | 35 |
| subtype7 | 1 | 4 |
| subtype8 | 7 | 12 |
Figure S14. Get High-res Image Clustering Approach #2: 'METHLYATION CNMF' versus Clinical Feature #3: 'GENDER'
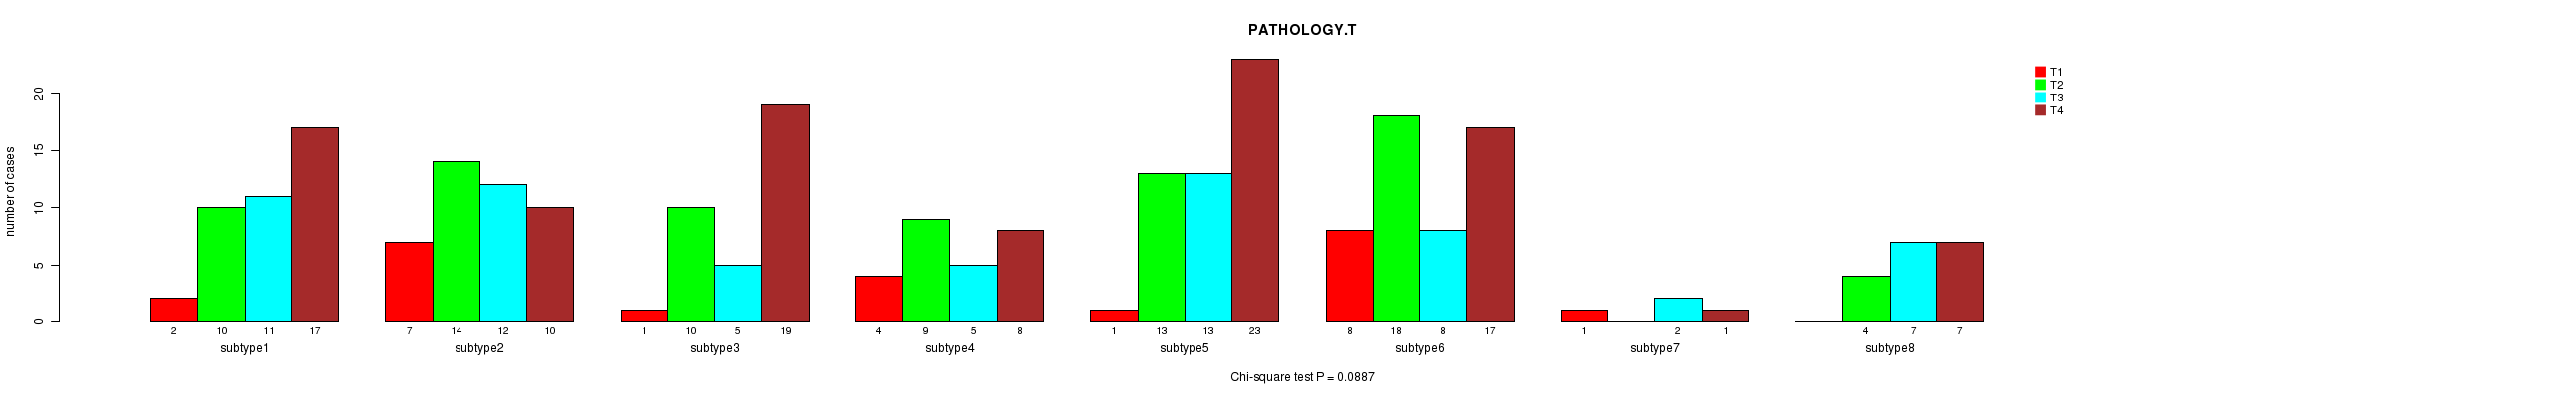
P value = 0.0887 (Chi-square test), Q value = 1
Table S17. Clustering Approach #2: 'METHLYATION CNMF' versus Clinical Feature #4: 'PATHOLOGY.T'
| nPatients | T1 | T2 | T3 | T4 |
|---|---|---|---|---|
| ALL | 24 | 78 | 63 | 102 |
| subtype1 | 2 | 10 | 11 | 17 |
| subtype2 | 7 | 14 | 12 | 10 |
| subtype3 | 1 | 10 | 5 | 19 |
| subtype4 | 4 | 9 | 5 | 8 |
| subtype5 | 1 | 13 | 13 | 23 |
| subtype6 | 8 | 18 | 8 | 17 |
| subtype7 | 1 | 0 | 2 | 1 |
| subtype8 | 0 | 4 | 7 | 7 |
Figure S15. Get High-res Image Clustering Approach #2: 'METHLYATION CNMF' versus Clinical Feature #4: 'PATHOLOGY.T'
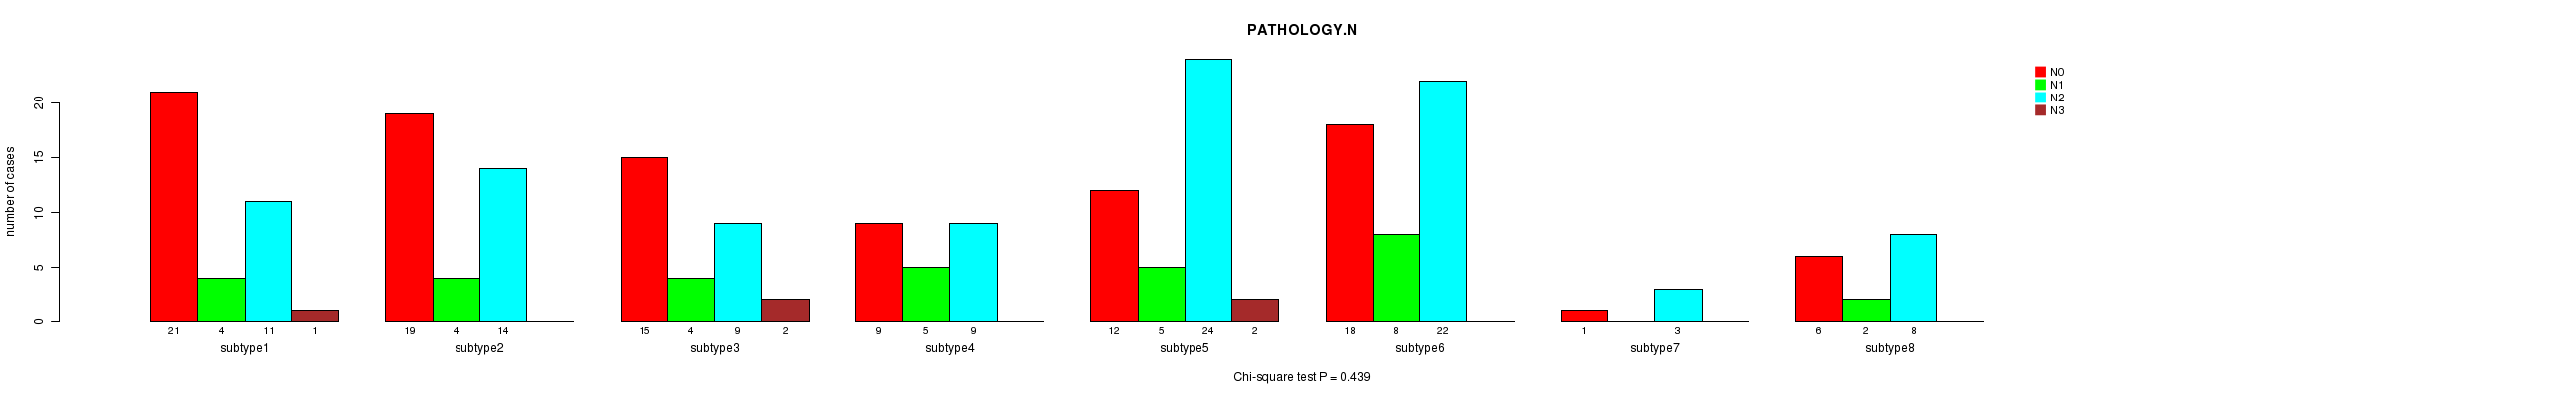
P value = 0.439 (Chi-square test), Q value = 1
Table S18. Clustering Approach #2: 'METHLYATION CNMF' versus Clinical Feature #5: 'PATHOLOGY.N'
| nPatients | N0 | N1 | N2 | N3 |
|---|---|---|---|---|
| ALL | 101 | 32 | 100 | 5 |
| subtype1 | 21 | 4 | 11 | 1 |
| subtype2 | 19 | 4 | 14 | 0 |
| subtype3 | 15 | 4 | 9 | 2 |
| subtype4 | 9 | 5 | 9 | 0 |
| subtype5 | 12 | 5 | 24 | 2 |
| subtype6 | 18 | 8 | 22 | 0 |
| subtype7 | 1 | 0 | 3 | 0 |
| subtype8 | 6 | 2 | 8 | 0 |
Figure S16. Get High-res Image Clustering Approach #2: 'METHLYATION CNMF' versus Clinical Feature #5: 'PATHOLOGY.N'
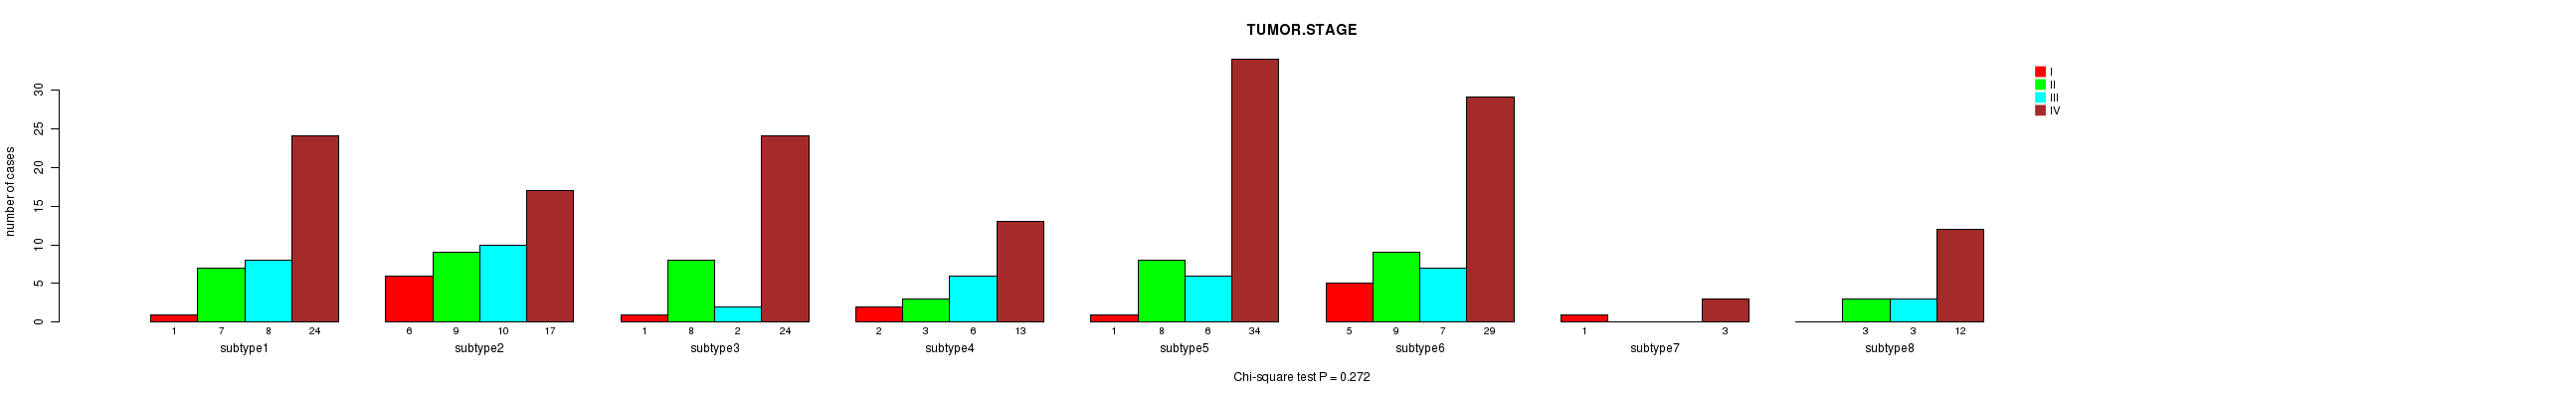
P value = 0.272 (Chi-square test), Q value = 1
Table S19. Clustering Approach #2: 'METHLYATION CNMF' versus Clinical Feature #6: 'TUMOR.STAGE'
| nPatients | I | II | III | IV |
|---|---|---|---|---|
| ALL | 17 | 47 | 42 | 156 |
| subtype1 | 1 | 7 | 8 | 24 |
| subtype2 | 6 | 9 | 10 | 17 |
| subtype3 | 1 | 8 | 2 | 24 |
| subtype4 | 2 | 3 | 6 | 13 |
| subtype5 | 1 | 8 | 6 | 34 |
| subtype6 | 5 | 9 | 7 | 29 |
| subtype7 | 1 | 0 | 0 | 3 |
| subtype8 | 0 | 3 | 3 | 12 |
Figure S17. Get High-res Image Clustering Approach #2: 'METHLYATION CNMF' versus Clinical Feature #6: 'TUMOR.STAGE'
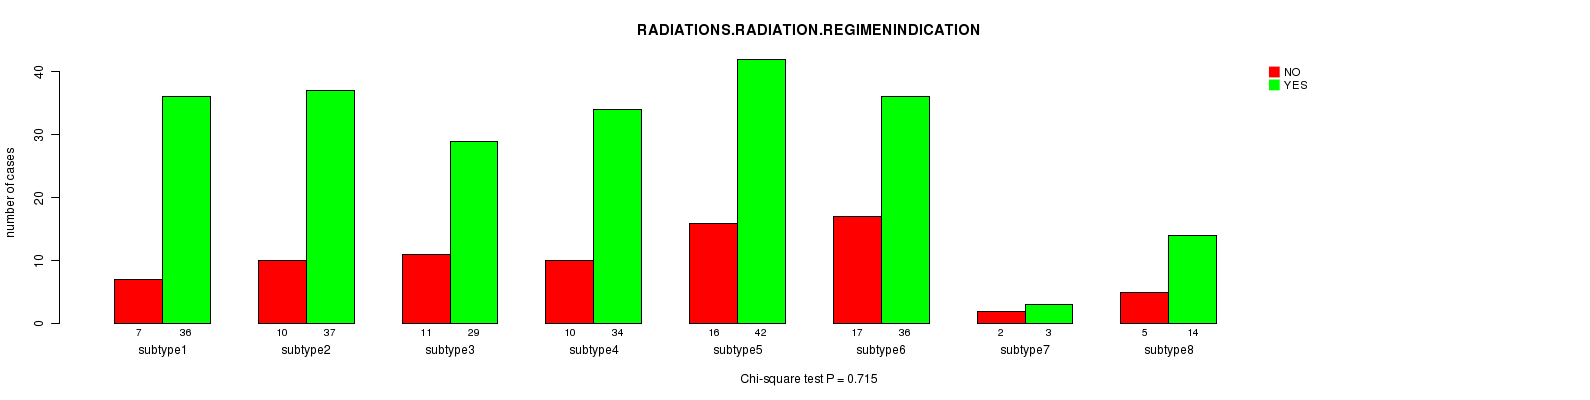
P value = 0.715 (Chi-square test), Q value = 1
Table S20. Clustering Approach #2: 'METHLYATION CNMF' versus Clinical Feature #7: 'RADIATIONS.RADIATION.REGIMENINDICATION'
| nPatients | NO | YES |
|---|---|---|
| ALL | 78 | 231 |
| subtype1 | 7 | 36 |
| subtype2 | 10 | 37 |
| subtype3 | 11 | 29 |
| subtype4 | 10 | 34 |
| subtype5 | 16 | 42 |
| subtype6 | 17 | 36 |
| subtype7 | 2 | 3 |
| subtype8 | 5 | 14 |
Figure S18. Get High-res Image Clustering Approach #2: 'METHLYATION CNMF' versus Clinical Feature #7: 'RADIATIONS.RADIATION.REGIMENINDICATION'
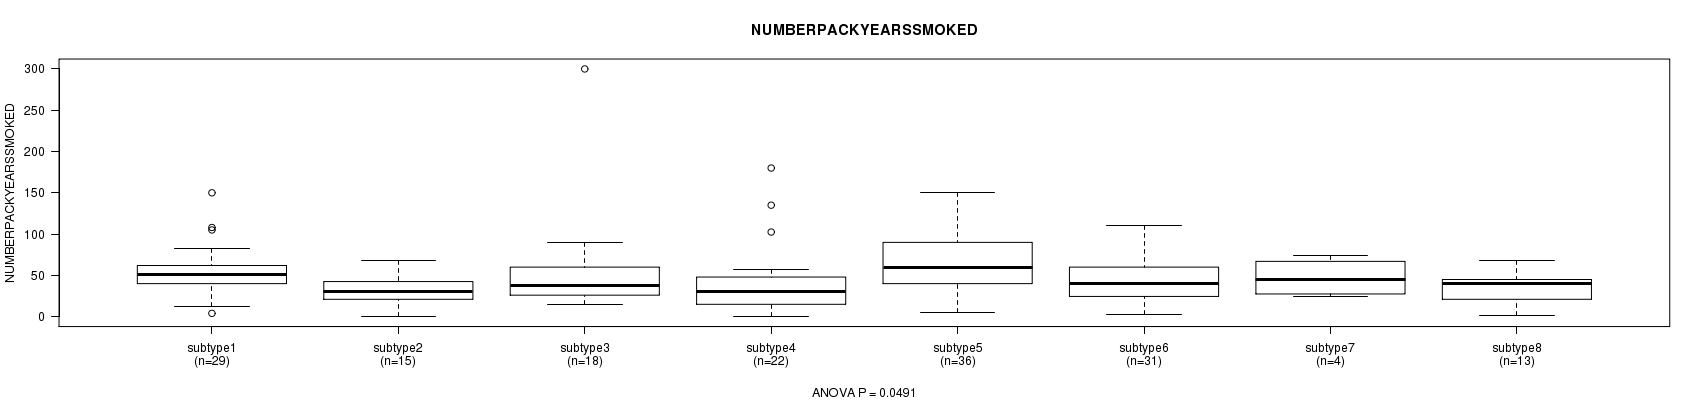
P value = 0.0491 (ANOVA), Q value = 1
Table S21. Clustering Approach #2: 'METHLYATION CNMF' versus Clinical Feature #8: 'NUMBERPACKYEARSSMOKED'
| nPatients | Mean (Std.Dev) | |
|---|---|---|
| ALL | 168 | 49.5 (37.2) |
| subtype1 | 29 | 56.3 (30.5) |
| subtype2 | 15 | 33.5 (20.9) |
| subtype3 | 18 | 55.2 (64.5) |
| subtype4 | 22 | 41.8 (44.6) |
| subtype5 | 36 | 64.1 (33.8) |
| subtype6 | 31 | 42.9 (25.7) |
| subtype7 | 4 | 47.2 (23.6) |
| subtype8 | 13 | 34.2 (21.4) |
Figure S19. Get High-res Image Clustering Approach #2: 'METHLYATION CNMF' versus Clinical Feature #8: 'NUMBERPACKYEARSSMOKED'
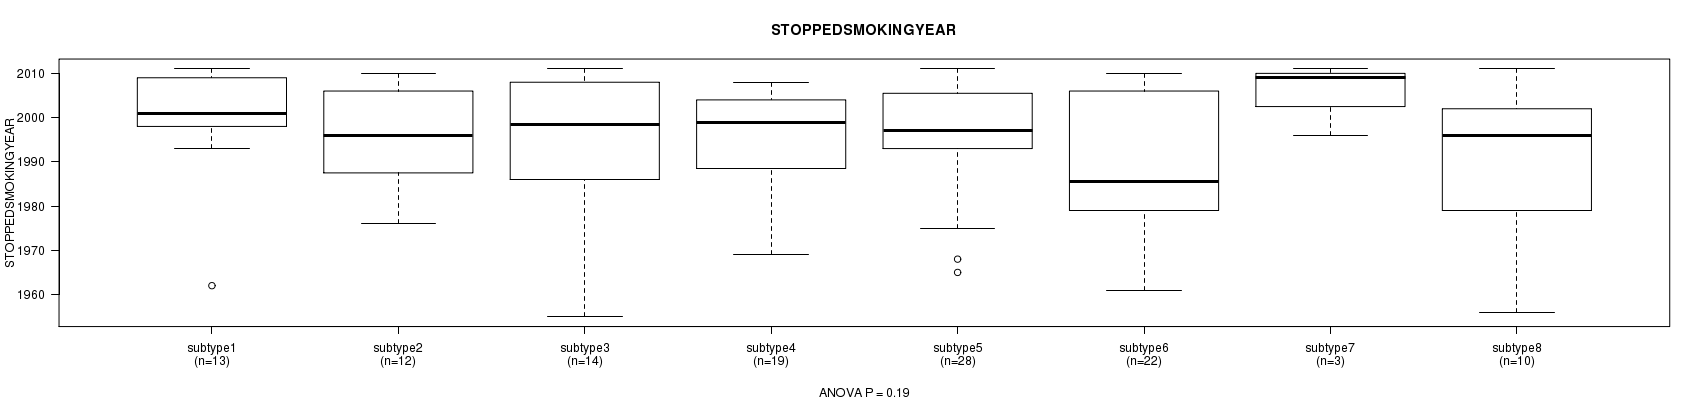
P value = 0.19 (ANOVA), Q value = 1
Table S22. Clustering Approach #2: 'METHLYATION CNMF' versus Clinical Feature #9: 'STOPPEDSMOKINGYEAR'
| nPatients | Mean (Std.Dev) | |
|---|---|---|
| ALL | 121 | 1994.5 (13.8) |
| subtype1 | 13 | 1999.8 (12.8) |
| subtype2 | 12 | 1995.8 (11.7) |
| subtype3 | 14 | 1995.7 (15.2) |
| subtype4 | 19 | 1994.3 (12.2) |
| subtype5 | 28 | 1996.3 (12.1) |
| subtype6 | 22 | 1988.0 (15.9) |
| subtype7 | 3 | 2005.3 (8.1) |
| subtype8 | 10 | 1990.7 (16.7) |
Figure S20. Get High-res Image Clustering Approach #2: 'METHLYATION CNMF' versus Clinical Feature #9: 'STOPPEDSMOKINGYEAR'
P value = 0.00052 (Chi-square test), Q value = 0.044
Table S23. Clustering Approach #2: 'METHLYATION CNMF' versus Clinical Feature #10: 'TOBACCOSMOKINGHISTORYINDICATOR'
| nPatients | CURRENT REFORMED SMOKER FOR < OR = 15 YEARS | CURRENT REFORMED SMOKER FOR > 15 YEARS | CURRENT SMOKER | LIFELONG NON-SMOKER |
|---|---|---|---|---|
| ALL | 82 | 55 | 99 | 62 |
| subtype1 | 12 | 7 | 21 | 2 |
| subtype2 | 7 | 10 | 9 | 18 |
| subtype3 | 9 | 6 | 11 | 11 |
| subtype4 | 14 | 6 | 11 | 13 |
| subtype5 | 23 | 8 | 21 | 3 |
| subtype6 | 8 | 14 | 17 | 13 |
| subtype7 | 3 | 0 | 2 | 0 |
| subtype8 | 6 | 4 | 7 | 2 |
Figure S21. Get High-res Image Clustering Approach #2: 'METHLYATION CNMF' versus Clinical Feature #10: 'TOBACCOSMOKINGHISTORYINDICATOR'
P value = 0.0163 (ANOVA), Q value = 1
Table S24. Clustering Approach #2: 'METHLYATION CNMF' versus Clinical Feature #11: 'YEAROFTOBACCOSMOKINGONSET'
| nPatients | Mean (Std.Dev) | |
|---|---|---|
| ALL | 175 | 1964.6 (12.1) |
| subtype1 | 25 | 1965.2 (9.2) |
| subtype2 | 18 | 1971.8 (12.9) |
| subtype3 | 19 | 1967.8 (11.9) |
| subtype4 | 26 | 1965.3 (11.8) |
| subtype5 | 36 | 1962.4 (11.1) |
| subtype6 | 34 | 1964.2 (12.4) |
| subtype7 | 5 | 1963.4 (11.3) |
| subtype8 | 12 | 1954.9 (14.8) |
Figure S22. Get High-res Image Clustering Approach #2: 'METHLYATION CNMF' versus Clinical Feature #11: 'YEAROFTOBACCOSMOKINGONSET'
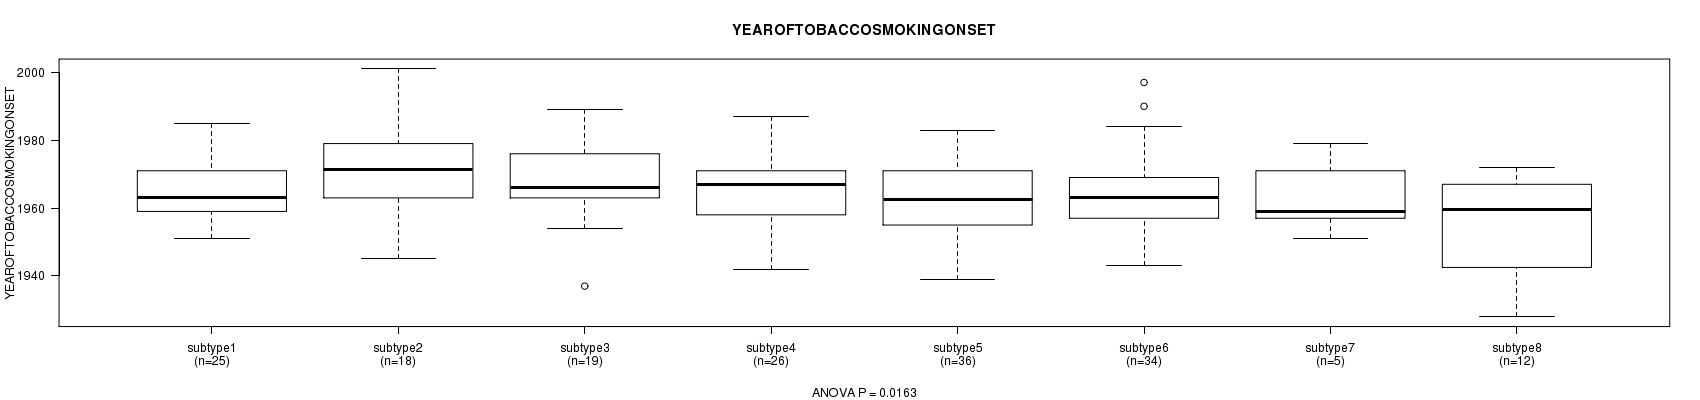
Table S25. Get Full Table Description of clustering approach #3: 'RPPA CNMF subtypes'
| Cluster Labels | 1 | 2 | 3 |
|---|---|---|---|
| Number of samples | 82 | 85 | 45 |
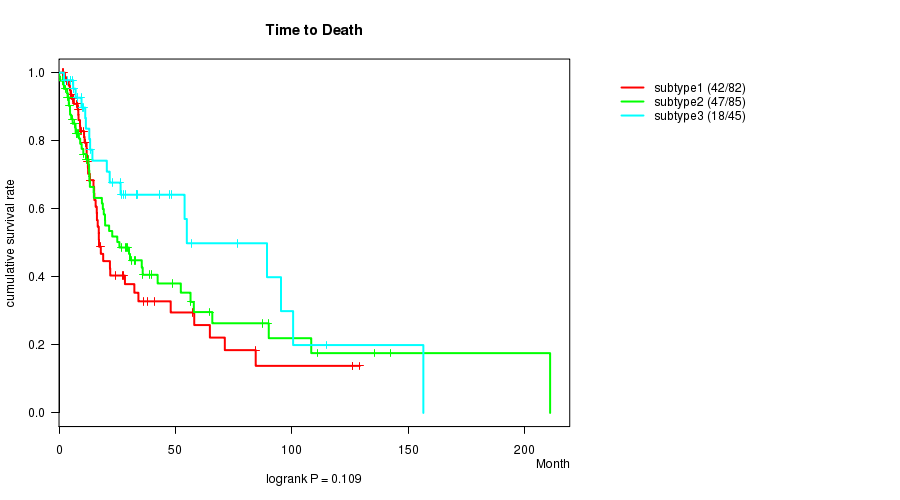
P value = 0.109 (logrank test), Q value = 1
Table S26. Clustering Approach #3: 'RPPA CNMF subtypes' versus Clinical Feature #1: 'Time to Death'
| nPatients | nDeath | Duration Range (Median), Month | |
|---|---|---|---|
| ALL | 212 | 107 | 0.1 - 210.9 (13.2) |
| subtype1 | 82 | 42 | 1.5 - 129.2 (12.1) |
| subtype2 | 85 | 47 | 0.1 - 210.9 (13.1) |
| subtype3 | 45 | 18 | 2.1 - 156.5 (20.5) |
Figure S23. Get High-res Image Clustering Approach #3: 'RPPA CNMF subtypes' versus Clinical Feature #1: 'Time to Death'
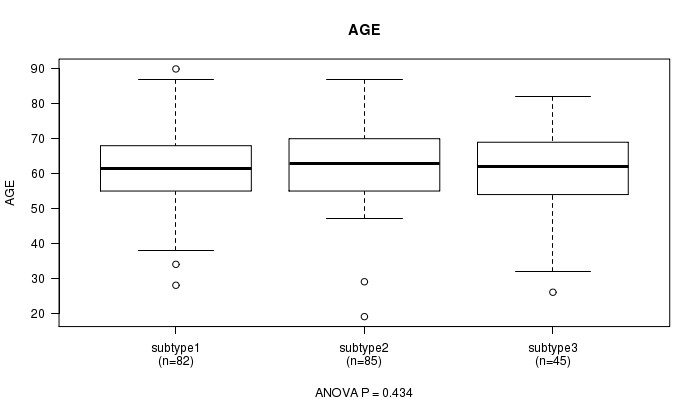
P value = 0.434 (ANOVA), Q value = 1
Table S27. Clustering Approach #3: 'RPPA CNMF subtypes' versus Clinical Feature #2: 'AGE'
| nPatients | Mean (Std.Dev) | |
|---|---|---|
| ALL | 212 | 62.1 (12.2) |
| subtype1 | 82 | 61.1 (12.1) |
| subtype2 | 85 | 63.4 (12.1) |
| subtype3 | 45 | 61.4 (12.7) |
Figure S24. Get High-res Image Clustering Approach #3: 'RPPA CNMF subtypes' versus Clinical Feature #2: 'AGE'
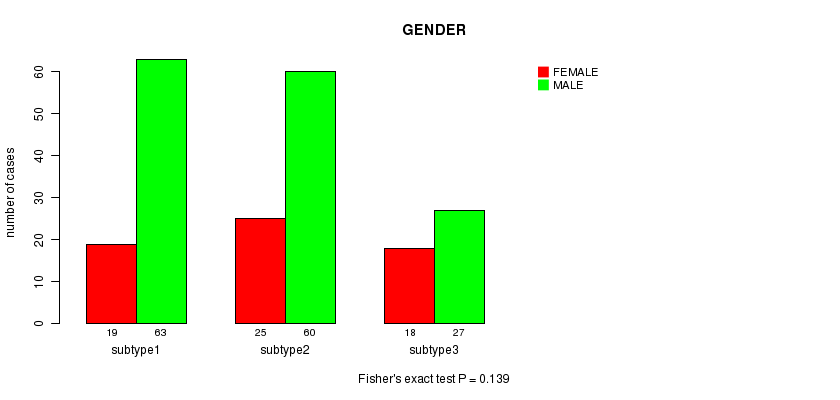
P value = 0.139 (Fisher's exact test), Q value = 1
Table S28. Clustering Approach #3: 'RPPA CNMF subtypes' versus Clinical Feature #3: 'GENDER'
| nPatients | FEMALE | MALE |
|---|---|---|
| ALL | 62 | 150 |
| subtype1 | 19 | 63 |
| subtype2 | 25 | 60 |
| subtype3 | 18 | 27 |
Figure S25. Get High-res Image Clustering Approach #3: 'RPPA CNMF subtypes' versus Clinical Feature #3: 'GENDER'
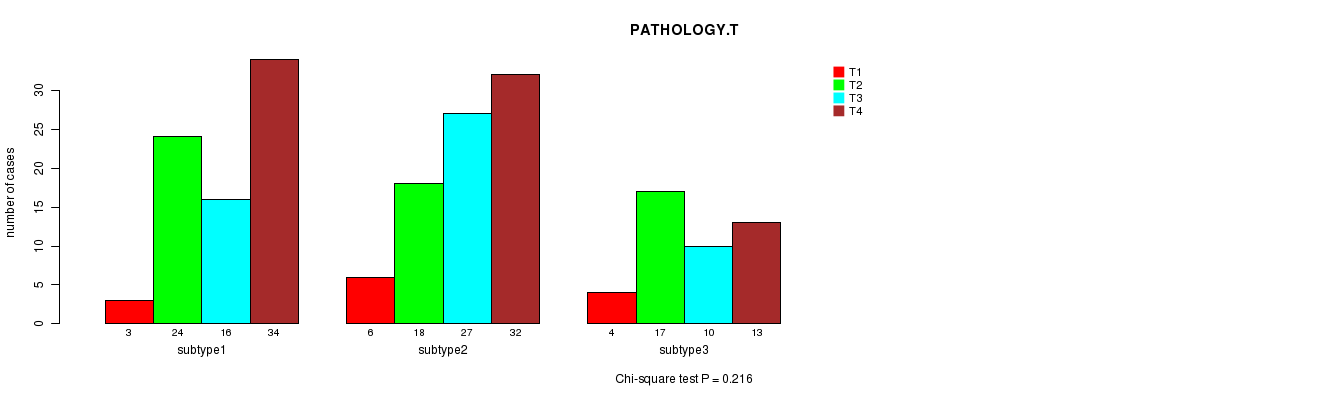
P value = 0.216 (Chi-square test), Q value = 1
Table S29. Clustering Approach #3: 'RPPA CNMF subtypes' versus Clinical Feature #4: 'PATHOLOGY.T'
| nPatients | T1 | T2 | T3 | T4 |
|---|---|---|---|---|
| ALL | 13 | 59 | 53 | 79 |
| subtype1 | 3 | 24 | 16 | 34 |
| subtype2 | 6 | 18 | 27 | 32 |
| subtype3 | 4 | 17 | 10 | 13 |
Figure S26. Get High-res Image Clustering Approach #3: 'RPPA CNMF subtypes' versus Clinical Feature #4: 'PATHOLOGY.T'
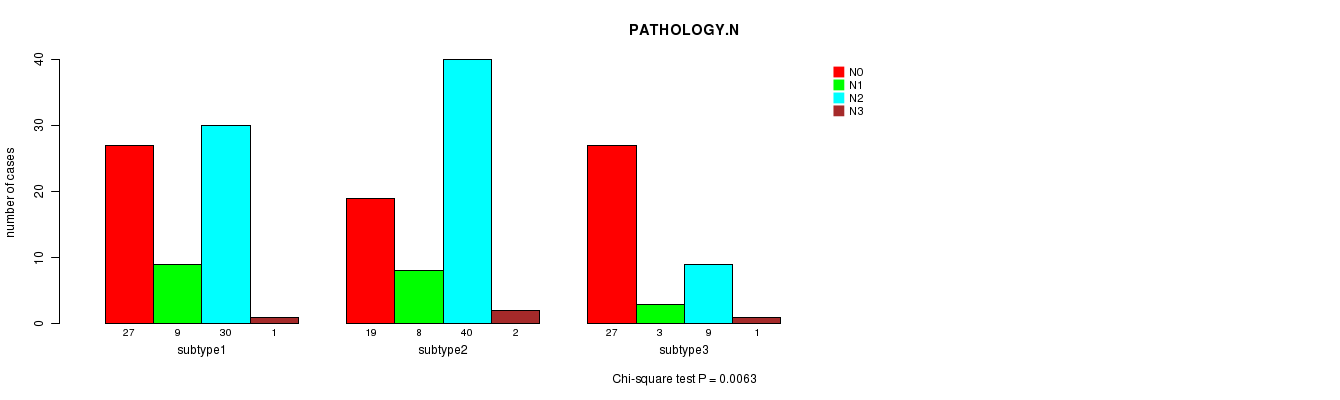
P value = 0.0063 (Chi-square test), Q value = 0.52
Table S30. Clustering Approach #3: 'RPPA CNMF subtypes' versus Clinical Feature #5: 'PATHOLOGY.N'
| nPatients | N0 | N1 | N2 | N3 |
|---|---|---|---|---|
| ALL | 73 | 20 | 79 | 4 |
| subtype1 | 27 | 9 | 30 | 1 |
| subtype2 | 19 | 8 | 40 | 2 |
| subtype3 | 27 | 3 | 9 | 1 |
Figure S27. Get High-res Image Clustering Approach #3: 'RPPA CNMF subtypes' versus Clinical Feature #5: 'PATHOLOGY.N'
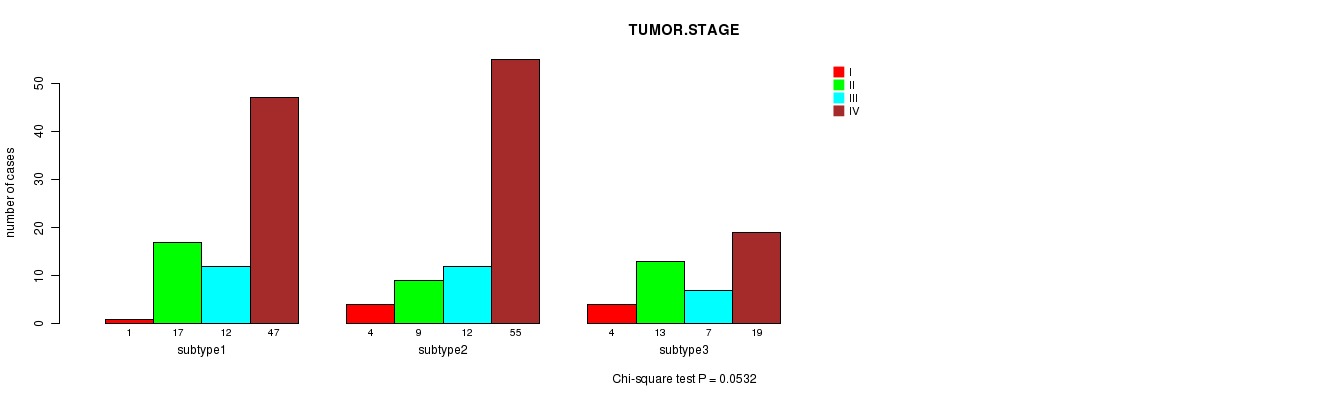
P value = 0.0532 (Chi-square test), Q value = 1
Table S31. Clustering Approach #3: 'RPPA CNMF subtypes' versus Clinical Feature #6: 'TUMOR.STAGE'
| nPatients | I | II | III | IV |
|---|---|---|---|---|
| ALL | 9 | 39 | 31 | 121 |
| subtype1 | 1 | 17 | 12 | 47 |
| subtype2 | 4 | 9 | 12 | 55 |
| subtype3 | 4 | 13 | 7 | 19 |
Figure S28. Get High-res Image Clustering Approach #3: 'RPPA CNMF subtypes' versus Clinical Feature #6: 'TUMOR.STAGE'
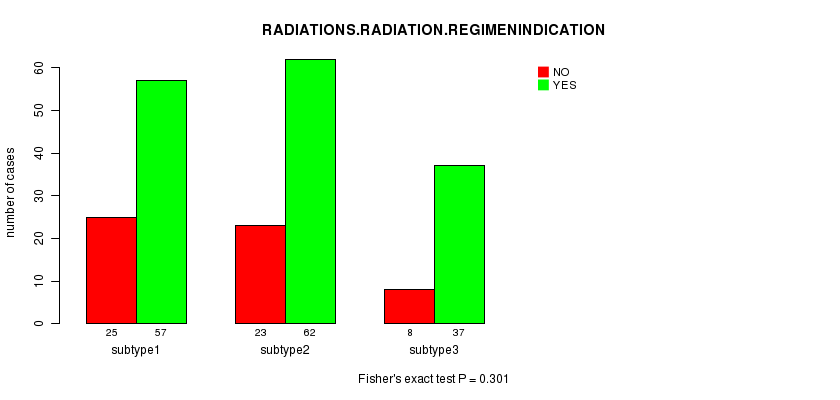
P value = 0.301 (Fisher's exact test), Q value = 1
Table S32. Clustering Approach #3: 'RPPA CNMF subtypes' versus Clinical Feature #7: 'RADIATIONS.RADIATION.REGIMENINDICATION'
| nPatients | NO | YES |
|---|---|---|
| ALL | 56 | 156 |
| subtype1 | 25 | 57 |
| subtype2 | 23 | 62 |
| subtype3 | 8 | 37 |
Figure S29. Get High-res Image Clustering Approach #3: 'RPPA CNMF subtypes' versus Clinical Feature #7: 'RADIATIONS.RADIATION.REGIMENINDICATION'
P value = 0.658 (ANOVA), Q value = 1
Table S33. Clustering Approach #3: 'RPPA CNMF subtypes' versus Clinical Feature #8: 'NUMBERPACKYEARSSMOKED'
| nPatients | Mean (Std.Dev) | |
|---|---|---|
| ALL | 105 | 48.9 (38.6) |
| subtype1 | 39 | 48.3 (34.1) |
| subtype2 | 44 | 46.2 (29.7) |
| subtype3 | 22 | 55.4 (58.5) |
Figure S30. Get High-res Image Clustering Approach #3: 'RPPA CNMF subtypes' versus Clinical Feature #8: 'NUMBERPACKYEARSSMOKED'

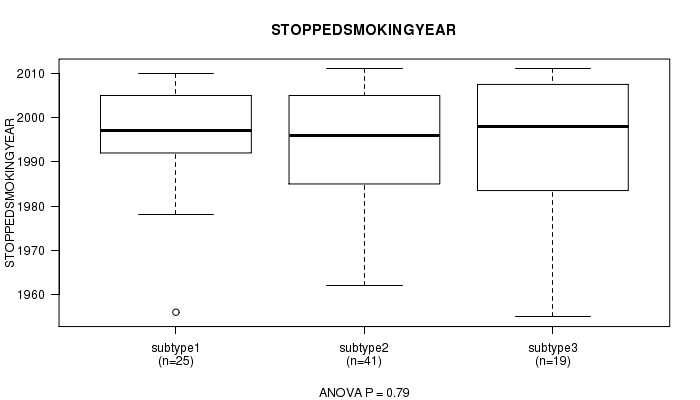
P value = 0.79 (ANOVA), Q value = 1
Table S34. Clustering Approach #3: 'RPPA CNMF subtypes' versus Clinical Feature #9: 'STOPPEDSMOKINGYEAR'
| nPatients | Mean (Std.Dev) | |
|---|---|---|
| ALL | 85 | 1994.1 (14.2) |
| subtype1 | 25 | 1995.7 (13.1) |
| subtype2 | 41 | 1993.2 (13.8) |
| subtype3 | 19 | 1993.8 (16.8) |
Figure S31. Get High-res Image Clustering Approach #3: 'RPPA CNMF subtypes' versus Clinical Feature #9: 'STOPPEDSMOKINGYEAR'
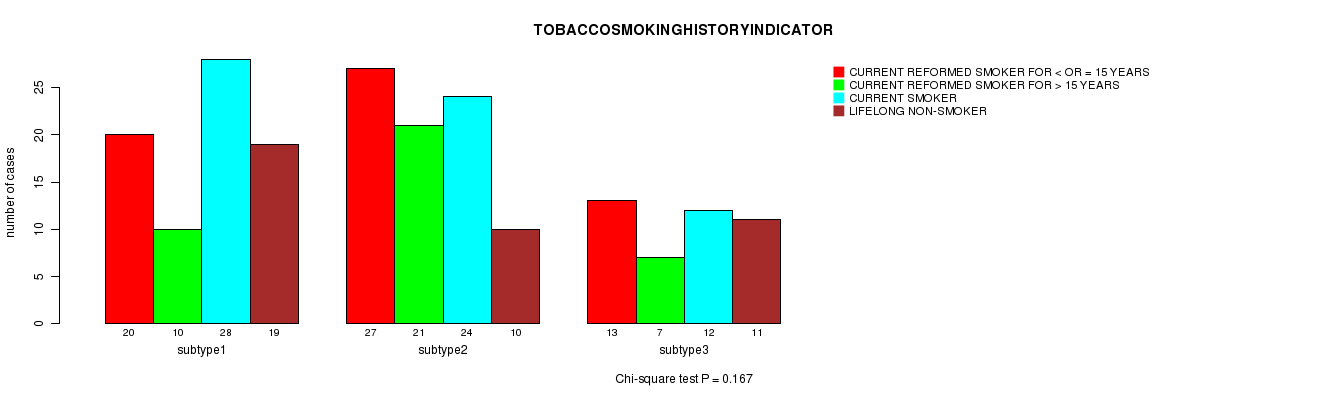
P value = 0.167 (Chi-square test), Q value = 1
Table S35. Clustering Approach #3: 'RPPA CNMF subtypes' versus Clinical Feature #10: 'TOBACCOSMOKINGHISTORYINDICATOR'
| nPatients | CURRENT REFORMED SMOKER FOR < OR = 15 YEARS | CURRENT REFORMED SMOKER FOR > 15 YEARS | CURRENT SMOKER | LIFELONG NON-SMOKER |
|---|---|---|---|---|
| ALL | 60 | 38 | 64 | 40 |
| subtype1 | 20 | 10 | 28 | 19 |
| subtype2 | 27 | 21 | 24 | 10 |
| subtype3 | 13 | 7 | 12 | 11 |
Figure S32. Get High-res Image Clustering Approach #3: 'RPPA CNMF subtypes' versus Clinical Feature #10: 'TOBACCOSMOKINGHISTORYINDICATOR'
P value = 0.539 (ANOVA), Q value = 1
Table S36. Clustering Approach #3: 'RPPA CNMF subtypes' versus Clinical Feature #11: 'YEAROFTOBACCOSMOKINGONSET'
| nPatients | Mean (Std.Dev) | |
|---|---|---|
| ALL | 115 | 1964.2 (12.4) |
| subtype1 | 43 | 1965.9 (14.1) |
| subtype2 | 49 | 1963.0 (11.7) |
| subtype3 | 23 | 1963.7 (10.9) |
Figure S33. Get High-res Image Clustering Approach #3: 'RPPA CNMF subtypes' versus Clinical Feature #11: 'YEAROFTOBACCOSMOKINGONSET'
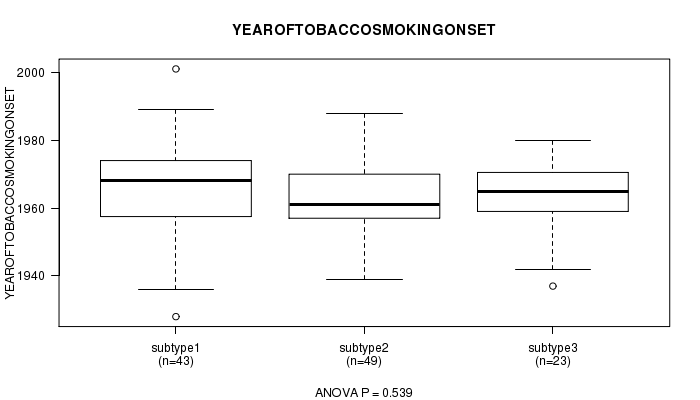
Table S37. Get Full Table Description of clustering approach #4: 'RPPA cHierClus subtypes'
| Cluster Labels | 1 | 2 | 3 |
|---|---|---|---|
| Number of samples | 115 | 81 | 16 |
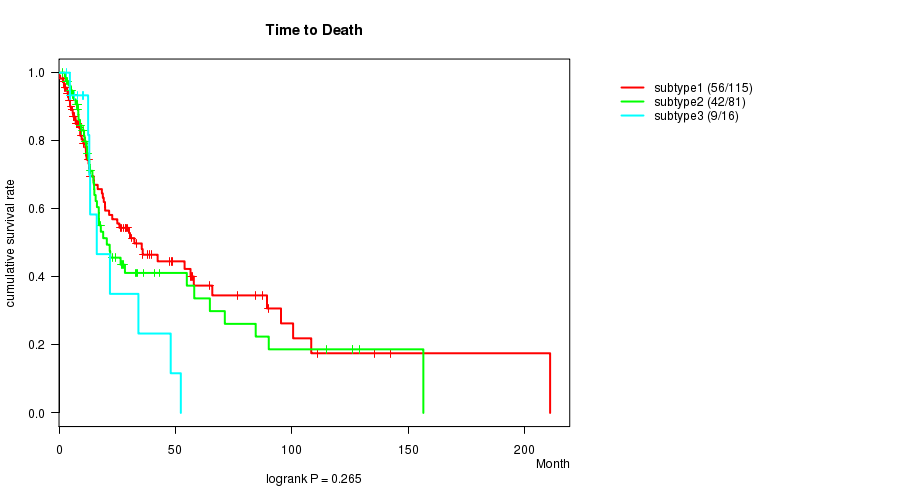
P value = 0.265 (logrank test), Q value = 1
Table S38. Clustering Approach #4: 'RPPA cHierClus subtypes' versus Clinical Feature #1: 'Time to Death'
| nPatients | nDeath | Duration Range (Median), Month | |
|---|---|---|---|
| ALL | 212 | 107 | 0.1 - 210.9 (13.2) |
| subtype1 | 115 | 56 | 0.1 - 210.9 (13.2) |
| subtype2 | 81 | 42 | 1.5 - 156.5 (13.6) |
| subtype3 | 16 | 9 | 3.3 - 52.3 (11.6) |
Figure S34. Get High-res Image Clustering Approach #4: 'RPPA cHierClus subtypes' versus Clinical Feature #1: 'Time to Death'
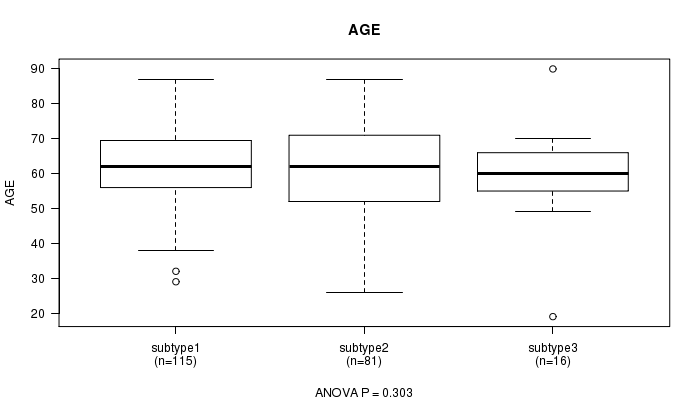
P value = 0.303 (ANOVA), Q value = 1
Table S39. Clustering Approach #4: 'RPPA cHierClus subtypes' versus Clinical Feature #2: 'AGE'
| nPatients | Mean (Std.Dev) | |
|---|---|---|
| ALL | 212 | 62.1 (12.2) |
| subtype1 | 115 | 63.3 (11.2) |
| subtype2 | 81 | 61.1 (13.1) |
| subtype3 | 16 | 59.4 (14.3) |
Figure S35. Get High-res Image Clustering Approach #4: 'RPPA cHierClus subtypes' versus Clinical Feature #2: 'AGE'
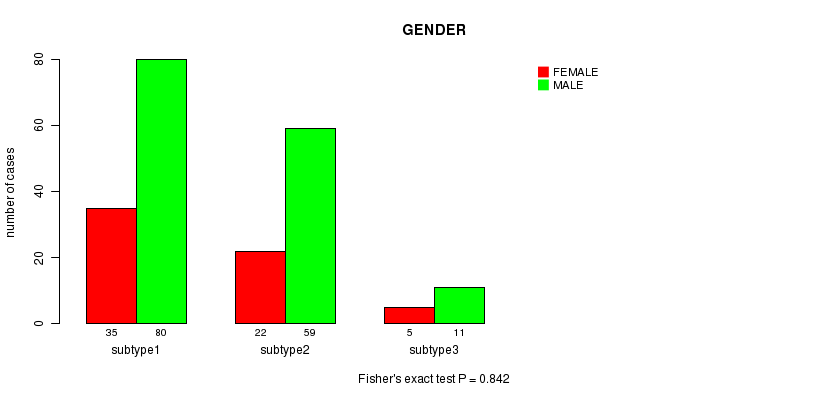
P value = 0.842 (Fisher's exact test), Q value = 1
Table S40. Clustering Approach #4: 'RPPA cHierClus subtypes' versus Clinical Feature #3: 'GENDER'
| nPatients | FEMALE | MALE |
|---|---|---|
| ALL | 62 | 150 |
| subtype1 | 35 | 80 |
| subtype2 | 22 | 59 |
| subtype3 | 5 | 11 |
Figure S36. Get High-res Image Clustering Approach #4: 'RPPA cHierClus subtypes' versus Clinical Feature #3: 'GENDER'
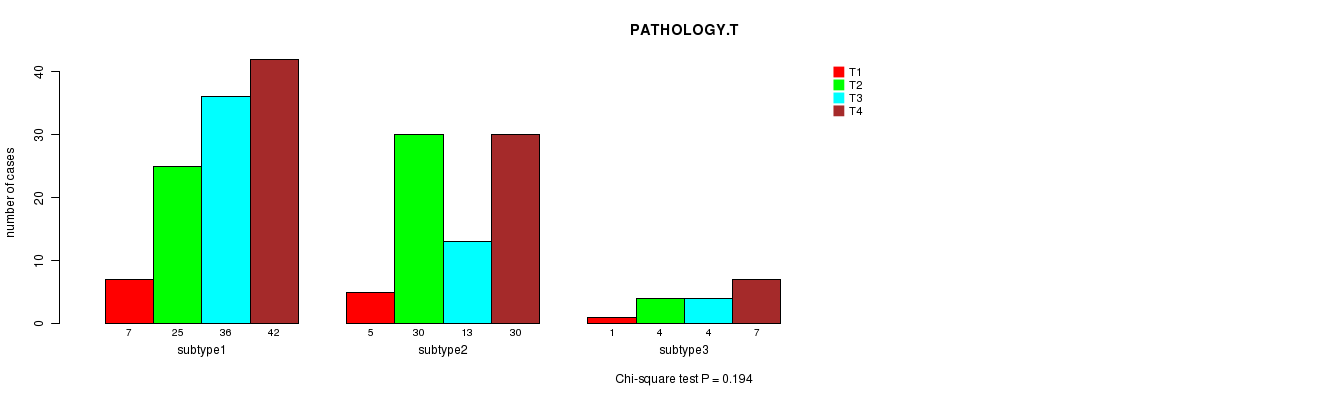
P value = 0.194 (Chi-square test), Q value = 1
Table S41. Clustering Approach #4: 'RPPA cHierClus subtypes' versus Clinical Feature #4: 'PATHOLOGY.T'
| nPatients | T1 | T2 | T3 | T4 |
|---|---|---|---|---|
| ALL | 13 | 59 | 53 | 79 |
| subtype1 | 7 | 25 | 36 | 42 |
| subtype2 | 5 | 30 | 13 | 30 |
| subtype3 | 1 | 4 | 4 | 7 |
Figure S37. Get High-res Image Clustering Approach #4: 'RPPA cHierClus subtypes' versus Clinical Feature #4: 'PATHOLOGY.T'
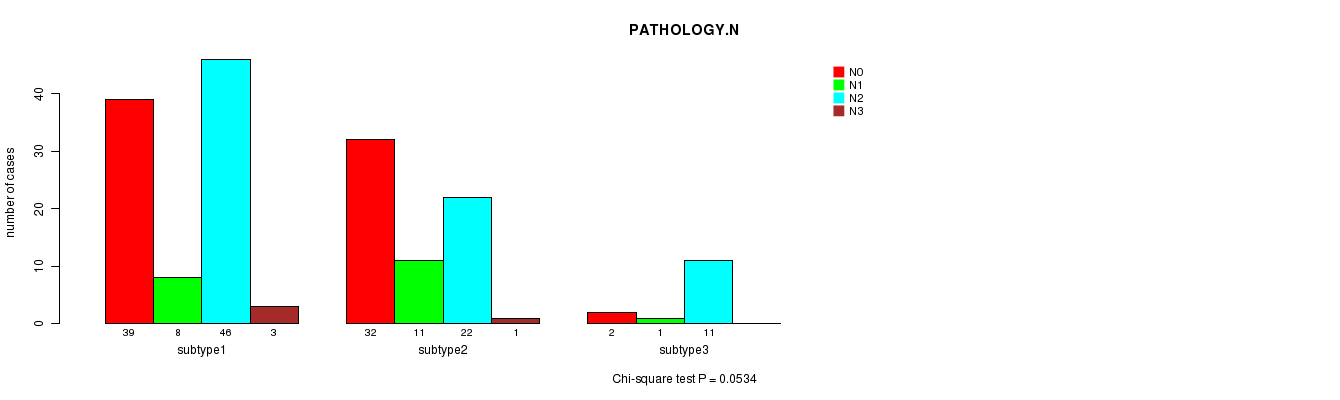
P value = 0.0534 (Chi-square test), Q value = 1
Table S42. Clustering Approach #4: 'RPPA cHierClus subtypes' versus Clinical Feature #5: 'PATHOLOGY.N'
| nPatients | N0 | N1 | N2 | N3 |
|---|---|---|---|---|
| ALL | 73 | 20 | 79 | 4 |
| subtype1 | 39 | 8 | 46 | 3 |
| subtype2 | 32 | 11 | 22 | 1 |
| subtype3 | 2 | 1 | 11 | 0 |
Figure S38. Get High-res Image Clustering Approach #4: 'RPPA cHierClus subtypes' versus Clinical Feature #5: 'PATHOLOGY.N'
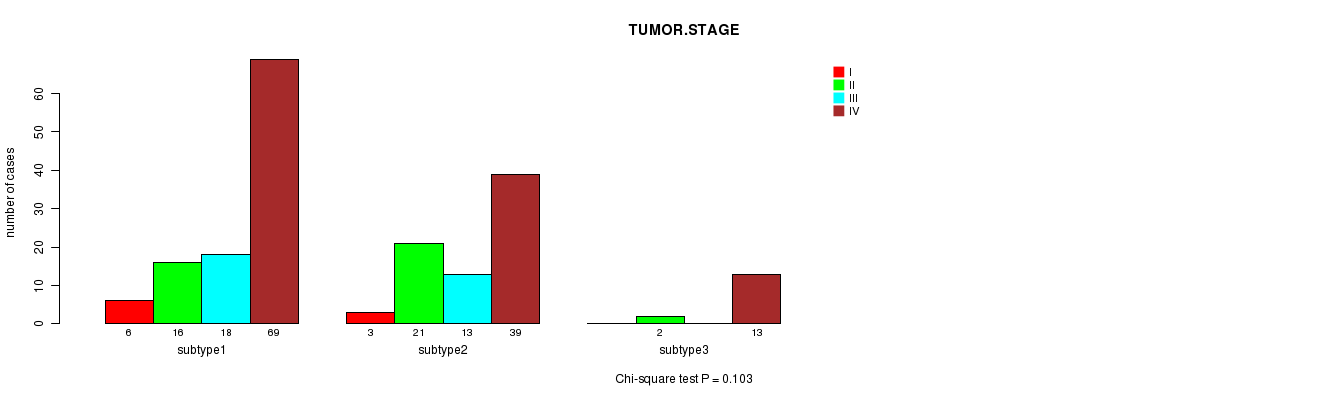
P value = 0.103 (Chi-square test), Q value = 1
Table S43. Clustering Approach #4: 'RPPA cHierClus subtypes' versus Clinical Feature #6: 'TUMOR.STAGE'
| nPatients | I | II | III | IV |
|---|---|---|---|---|
| ALL | 9 | 39 | 31 | 121 |
| subtype1 | 6 | 16 | 18 | 69 |
| subtype2 | 3 | 21 | 13 | 39 |
| subtype3 | 0 | 2 | 0 | 13 |
Figure S39. Get High-res Image Clustering Approach #4: 'RPPA cHierClus subtypes' versus Clinical Feature #6: 'TUMOR.STAGE'
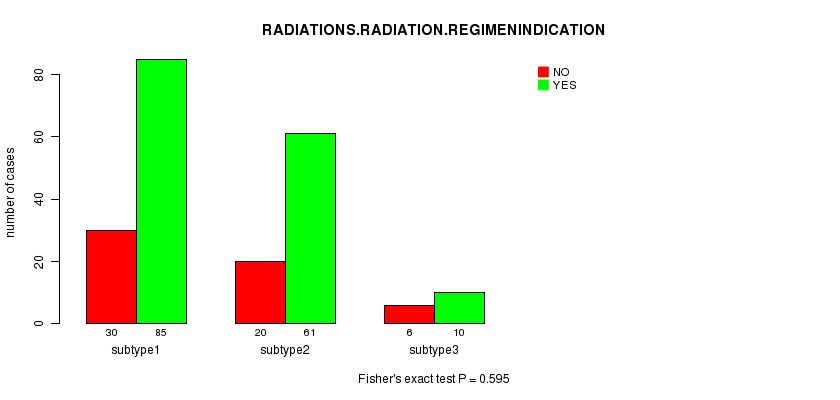
P value = 0.595 (Fisher's exact test), Q value = 1
Table S44. Clustering Approach #4: 'RPPA cHierClus subtypes' versus Clinical Feature #7: 'RADIATIONS.RADIATION.REGIMENINDICATION'
| nPatients | NO | YES |
|---|---|---|
| ALL | 56 | 156 |
| subtype1 | 30 | 85 |
| subtype2 | 20 | 61 |
| subtype3 | 6 | 10 |
Figure S40. Get High-res Image Clustering Approach #4: 'RPPA cHierClus subtypes' versus Clinical Feature #7: 'RADIATIONS.RADIATION.REGIMENINDICATION'
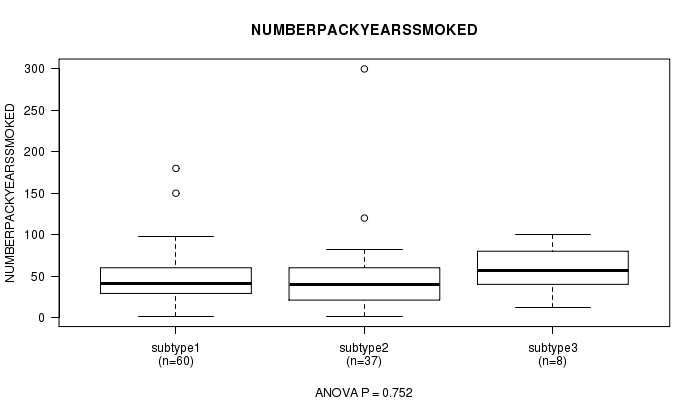
P value = 0.752 (ANOVA), Q value = 1
Table S45. Clustering Approach #4: 'RPPA cHierClus subtypes' versus Clinical Feature #8: 'NUMBERPACKYEARSSMOKED'
| nPatients | Mean (Std.Dev) | |
|---|---|---|
| ALL | 105 | 48.9 (38.6) |
| subtype1 | 60 | 47.2 (31.5) |
| subtype2 | 37 | 49.6 (50.0) |
| subtype3 | 8 | 58.1 (28.6) |
Figure S41. Get High-res Image Clustering Approach #4: 'RPPA cHierClus subtypes' versus Clinical Feature #8: 'NUMBERPACKYEARSSMOKED'
P value = 0.37 (ANOVA), Q value = 1
Table S46. Clustering Approach #4: 'RPPA cHierClus subtypes' versus Clinical Feature #9: 'STOPPEDSMOKINGYEAR'
| nPatients | Mean (Std.Dev) | |
|---|---|---|
| ALL | 85 | 1994.1 (14.2) |
| subtype1 | 53 | 1994.4 (13.7) |
| subtype2 | 27 | 1992.0 (16.0) |
| subtype3 | 5 | 2001.6 (5.9) |
Figure S42. Get High-res Image Clustering Approach #4: 'RPPA cHierClus subtypes' versus Clinical Feature #9: 'STOPPEDSMOKINGYEAR'
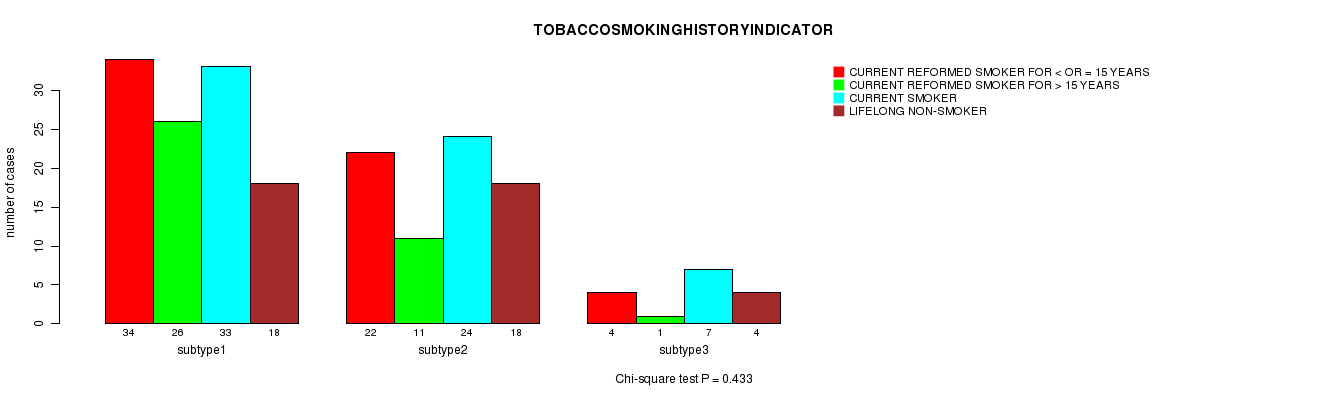
P value = 0.433 (Chi-square test), Q value = 1
Table S47. Clustering Approach #4: 'RPPA cHierClus subtypes' versus Clinical Feature #10: 'TOBACCOSMOKINGHISTORYINDICATOR'
| nPatients | CURRENT REFORMED SMOKER FOR < OR = 15 YEARS | CURRENT REFORMED SMOKER FOR > 15 YEARS | CURRENT SMOKER | LIFELONG NON-SMOKER |
|---|---|---|---|---|
| ALL | 60 | 38 | 64 | 40 |
| subtype1 | 34 | 26 | 33 | 18 |
| subtype2 | 22 | 11 | 24 | 18 |
| subtype3 | 4 | 1 | 7 | 4 |
Figure S43. Get High-res Image Clustering Approach #4: 'RPPA cHierClus subtypes' versus Clinical Feature #10: 'TOBACCOSMOKINGHISTORYINDICATOR'
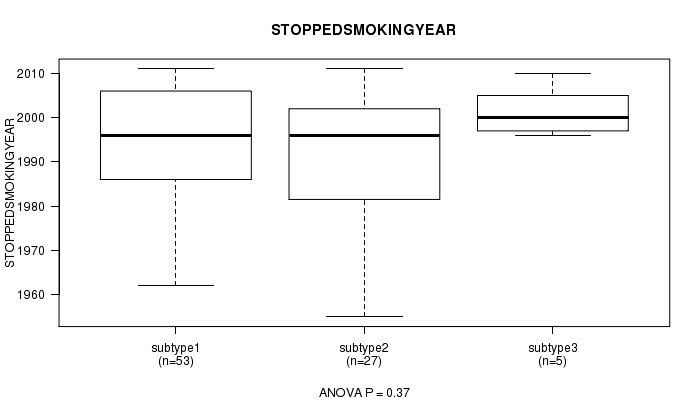
P value = 0.746 (ANOVA), Q value = 1
Table S48. Clustering Approach #4: 'RPPA cHierClus subtypes' versus Clinical Feature #11: 'YEAROFTOBACCOSMOKINGONSET'
| nPatients | Mean (Std.Dev) | |
|---|---|---|
| ALL | 115 | 1964.2 (12.4) |
| subtype1 | 66 | 1963.7 (10.8) |
| subtype2 | 41 | 1964.5 (15.4) |
| subtype3 | 8 | 1967.2 (7.9) |
Figure S44. Get High-res Image Clustering Approach #4: 'RPPA cHierClus subtypes' versus Clinical Feature #11: 'YEAROFTOBACCOSMOKINGONSET'
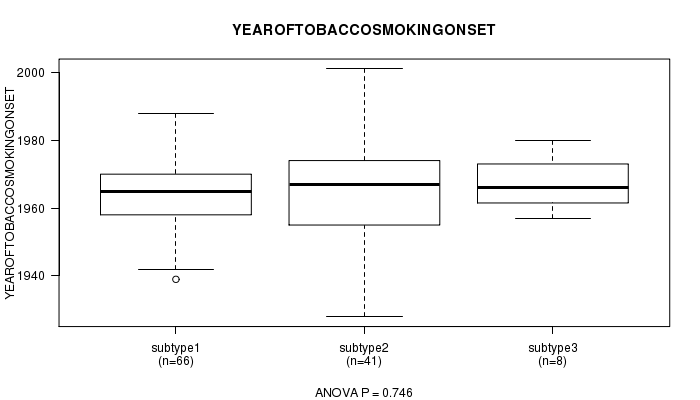
Table S49. Get Full Table Description of clustering approach #5: 'RNAseq CNMF subtypes'
| Cluster Labels | 1 | 2 | 3 |
|---|---|---|---|
| Number of samples | 118 | 93 | 91 |
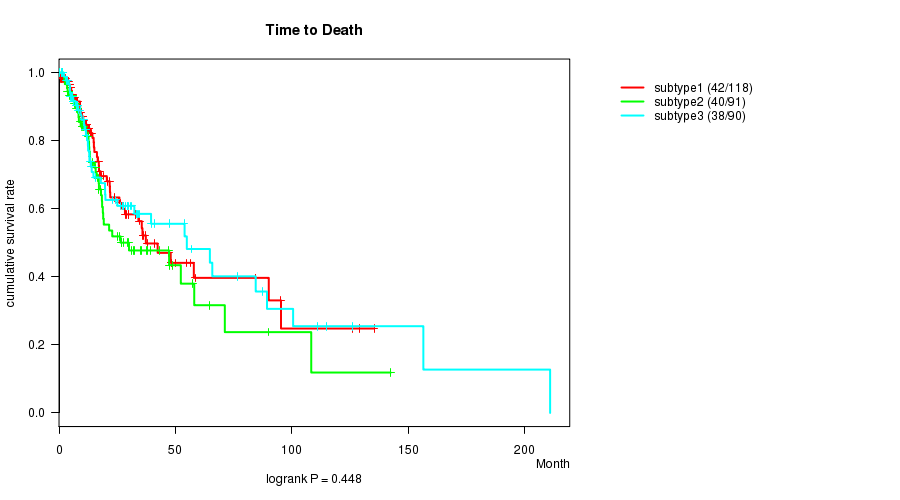
P value = 0.448 (logrank test), Q value = 1
Table S50. Clustering Approach #5: 'RNAseq CNMF subtypes' versus Clinical Feature #1: 'Time to Death'
| nPatients | nDeath | Duration Range (Median), Month | |
|---|---|---|---|
| ALL | 299 | 120 | 0.1 - 210.9 (14.8) |
| subtype1 | 118 | 42 | 0.1 - 135.3 (14.2) |
| subtype2 | 91 | 40 | 0.2 - 142.5 (15.7) |
| subtype3 | 90 | 38 | 0.1 - 210.9 (14.0) |
Figure S45. Get High-res Image Clustering Approach #5: 'RNAseq CNMF subtypes' versus Clinical Feature #1: 'Time to Death'
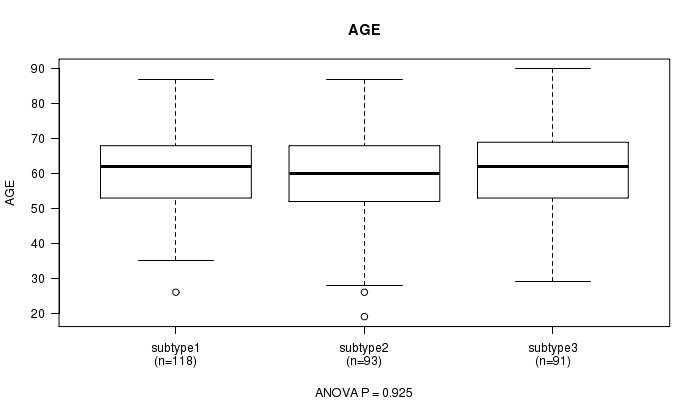
P value = 0.925 (ANOVA), Q value = 1
Table S51. Clustering Approach #5: 'RNAseq CNMF subtypes' versus Clinical Feature #2: 'AGE'
| nPatients | Mean (Std.Dev) | |
|---|---|---|
| ALL | 302 | 61.0 (12.2) |
| subtype1 | 118 | 61.3 (11.1) |
| subtype2 | 93 | 60.6 (12.8) |
| subtype3 | 91 | 61.2 (12.9) |
Figure S46. Get High-res Image Clustering Approach #5: 'RNAseq CNMF subtypes' versus Clinical Feature #2: 'AGE'
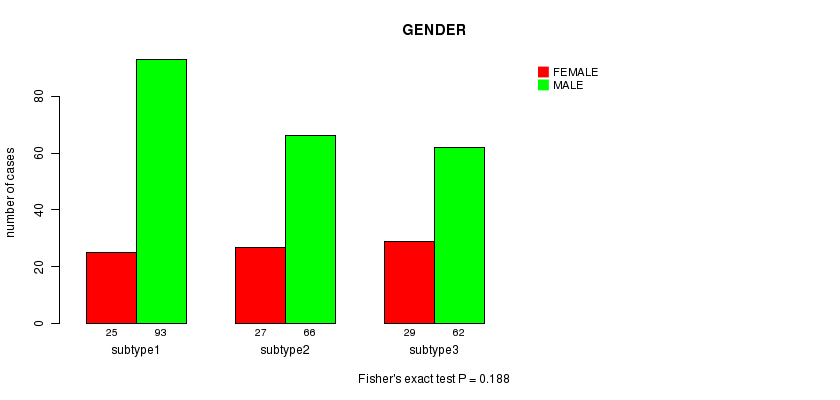
P value = 0.188 (Fisher's exact test), Q value = 1
Table S52. Clustering Approach #5: 'RNAseq CNMF subtypes' versus Clinical Feature #3: 'GENDER'
| nPatients | FEMALE | MALE |
|---|---|---|
| ALL | 81 | 221 |
| subtype1 | 25 | 93 |
| subtype2 | 27 | 66 |
| subtype3 | 29 | 62 |
Figure S47. Get High-res Image Clustering Approach #5: 'RNAseq CNMF subtypes' versus Clinical Feature #3: 'GENDER'
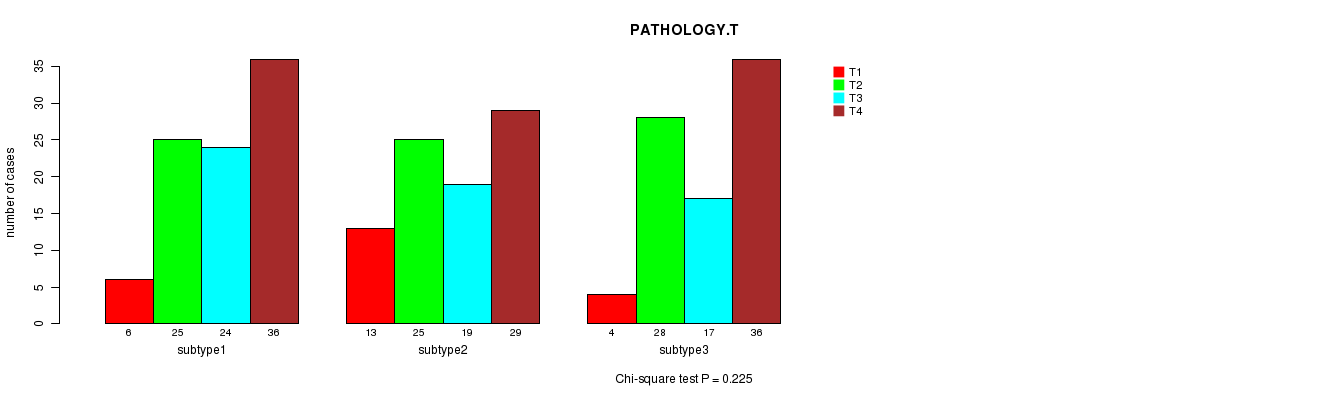
P value = 0.225 (Chi-square test), Q value = 1
Table S53. Clustering Approach #5: 'RNAseq CNMF subtypes' versus Clinical Feature #4: 'PATHOLOGY.T'
| nPatients | T1 | T2 | T3 | T4 |
|---|---|---|---|---|
| ALL | 23 | 78 | 60 | 101 |
| subtype1 | 6 | 25 | 24 | 36 |
| subtype2 | 13 | 25 | 19 | 29 |
| subtype3 | 4 | 28 | 17 | 36 |
Figure S48. Get High-res Image Clustering Approach #5: 'RNAseq CNMF subtypes' versus Clinical Feature #4: 'PATHOLOGY.T'
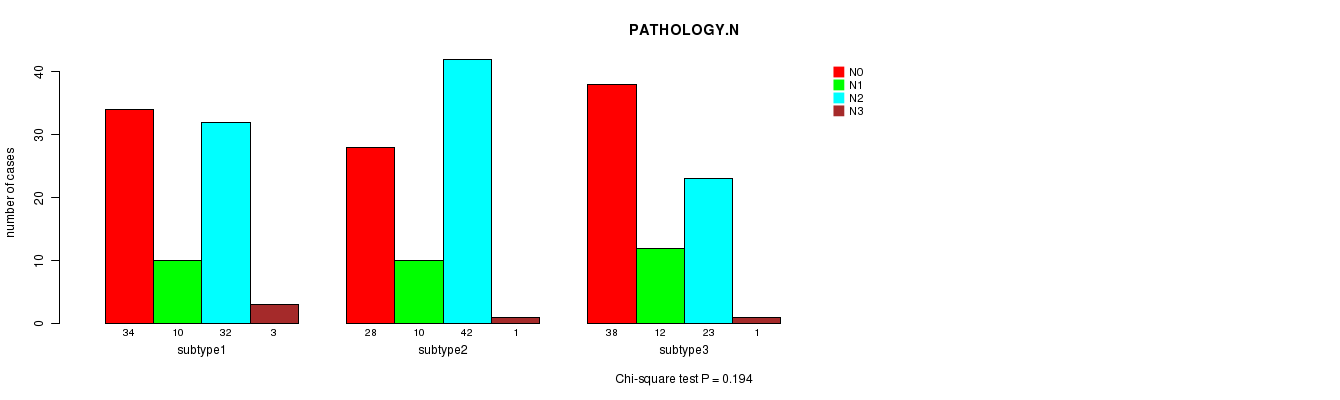
P value = 0.194 (Chi-square test), Q value = 1
Table S54. Clustering Approach #5: 'RNAseq CNMF subtypes' versus Clinical Feature #5: 'PATHOLOGY.N'
| nPatients | N0 | N1 | N2 | N3 |
|---|---|---|---|---|
| ALL | 100 | 32 | 97 | 5 |
| subtype1 | 34 | 10 | 32 | 3 |
| subtype2 | 28 | 10 | 42 | 1 |
| subtype3 | 38 | 12 | 23 | 1 |
Figure S49. Get High-res Image Clustering Approach #5: 'RNAseq CNMF subtypes' versus Clinical Feature #5: 'PATHOLOGY.N'
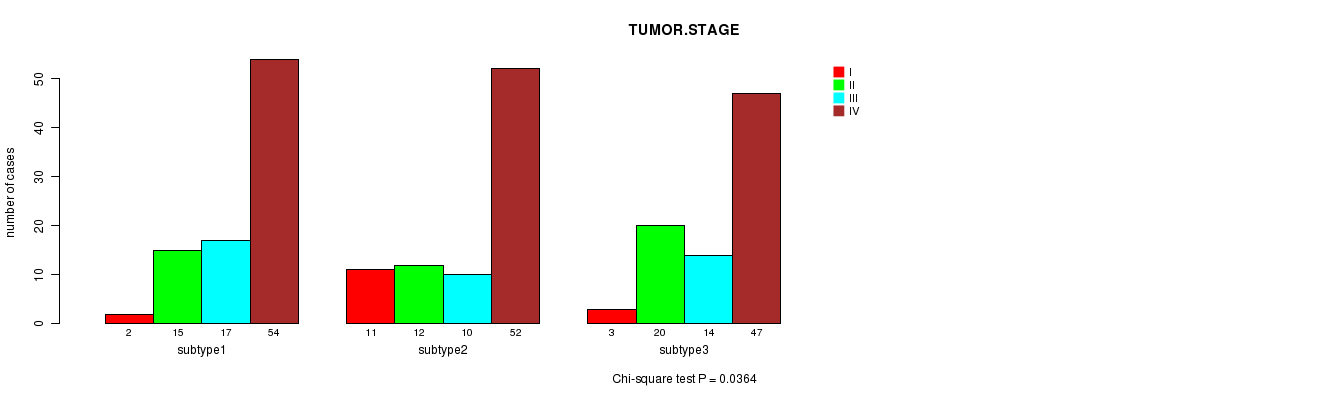
P value = 0.0364 (Chi-square test), Q value = 1
Table S55. Clustering Approach #5: 'RNAseq CNMF subtypes' versus Clinical Feature #6: 'TUMOR.STAGE'
| nPatients | I | II | III | IV |
|---|---|---|---|---|
| ALL | 16 | 47 | 41 | 153 |
| subtype1 | 2 | 15 | 17 | 54 |
| subtype2 | 11 | 12 | 10 | 52 |
| subtype3 | 3 | 20 | 14 | 47 |
Figure S50. Get High-res Image Clustering Approach #5: 'RNAseq CNMF subtypes' versus Clinical Feature #6: 'TUMOR.STAGE'
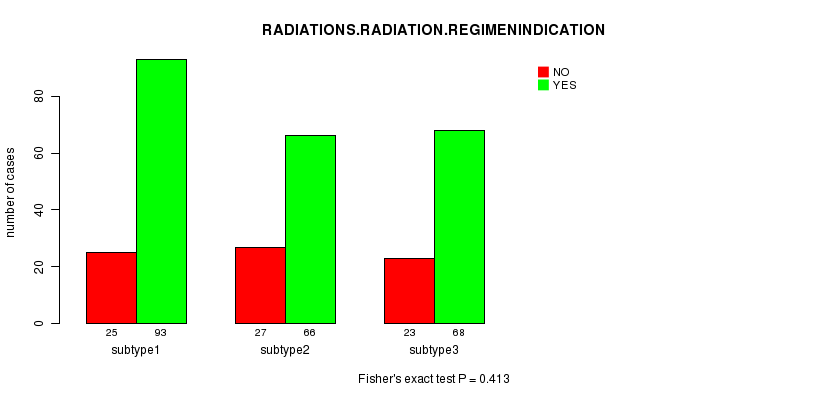
P value = 0.413 (Fisher's exact test), Q value = 1
Table S56. Clustering Approach #5: 'RNAseq CNMF subtypes' versus Clinical Feature #7: 'RADIATIONS.RADIATION.REGIMENINDICATION'
| nPatients | NO | YES |
|---|---|---|
| ALL | 75 | 227 |
| subtype1 | 25 | 93 |
| subtype2 | 27 | 66 |
| subtype3 | 23 | 68 |
Figure S51. Get High-res Image Clustering Approach #5: 'RNAseq CNMF subtypes' versus Clinical Feature #7: 'RADIATIONS.RADIATION.REGIMENINDICATION'
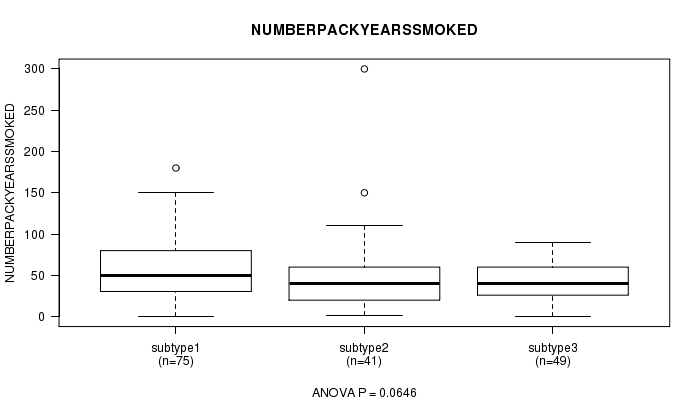
P value = 0.0646 (ANOVA), Q value = 1
Table S57. Clustering Approach #5: 'RNAseq CNMF subtypes' versus Clinical Feature #8: 'NUMBERPACKYEARSSMOKED'
| nPatients | Mean (Std.Dev) | |
|---|---|---|
| ALL | 165 | 50.0 (37.4) |
| subtype1 | 75 | 56.7 (36.5) |
| subtype2 | 41 | 48.5 (50.4) |
| subtype3 | 49 | 40.9 (21.1) |
Figure S52. Get High-res Image Clustering Approach #5: 'RNAseq CNMF subtypes' versus Clinical Feature #8: 'NUMBERPACKYEARSSMOKED'
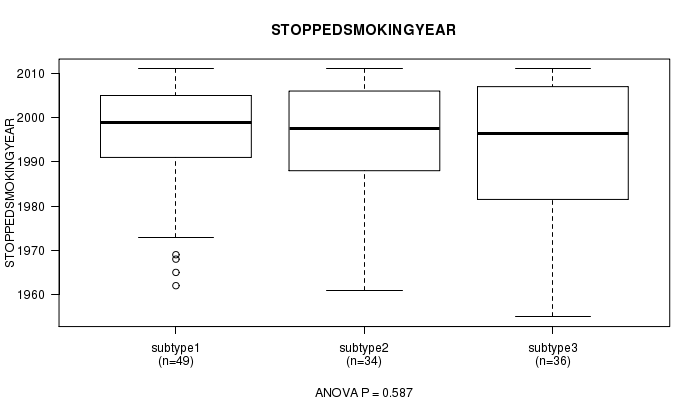
P value = 0.587 (ANOVA), Q value = 1
Table S58. Clustering Approach #5: 'RNAseq CNMF subtypes' versus Clinical Feature #9: 'STOPPEDSMOKINGYEAR'
| nPatients | Mean (Std.Dev) | |
|---|---|---|
| ALL | 119 | 1994.6 (13.9) |
| subtype1 | 49 | 1995.7 (13.1) |
| subtype2 | 34 | 1995.0 (13.4) |
| subtype3 | 36 | 1992.6 (15.6) |
Figure S53. Get High-res Image Clustering Approach #5: 'RNAseq CNMF subtypes' versus Clinical Feature #9: 'STOPPEDSMOKINGYEAR'
P value = 0.42 (Chi-square test), Q value = 1
Table S59. Clustering Approach #5: 'RNAseq CNMF subtypes' versus Clinical Feature #10: 'TOBACCOSMOKINGHISTORYINDICATOR'
| nPatients | CURRENT REFORMED SMOKER FOR < OR = 15 YEARS | CURRENT REFORMED SMOKER FOR > 15 YEARS | CURRENT SMOKER | LIFELONG NON-SMOKER |
|---|---|---|---|---|
| ALL | 82 | 53 | 98 | 58 |
| subtype1 | 37 | 17 | 42 | 17 |
| subtype2 | 24 | 16 | 29 | 21 |
| subtype3 | 21 | 20 | 27 | 20 |
Figure S54. Get High-res Image Clustering Approach #5: 'RNAseq CNMF subtypes' versus Clinical Feature #10: 'TOBACCOSMOKINGHISTORYINDICATOR'
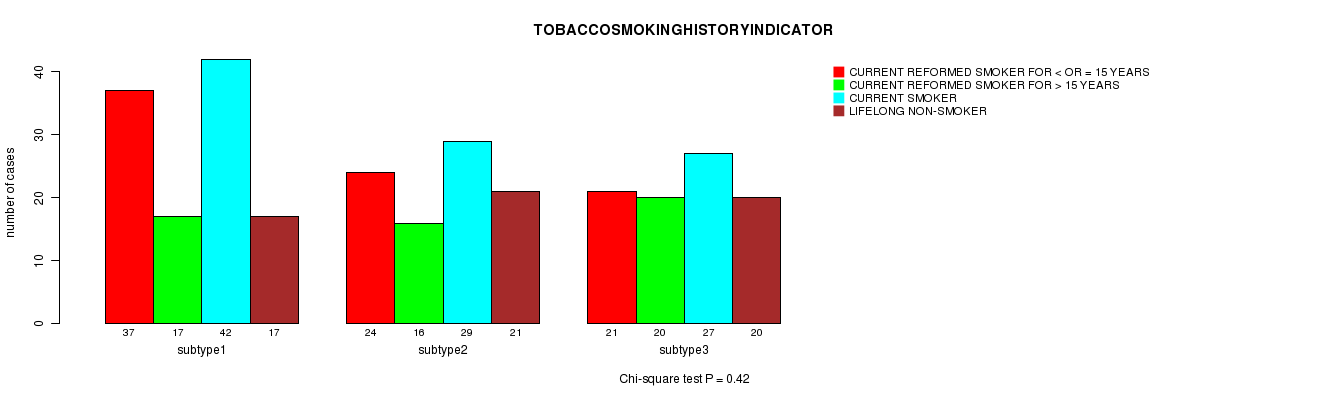
P value = 0.133 (ANOVA), Q value = 1
Table S60. Clustering Approach #5: 'RNAseq CNMF subtypes' versus Clinical Feature #11: 'YEAROFTOBACCOSMOKINGONSET'
| nPatients | Mean (Std.Dev) | |
|---|---|---|
| ALL | 173 | 1964.5 (12.1) |
| subtype1 | 73 | 1963.0 (11.0) |
| subtype2 | 49 | 1967.4 (11.5) |
| subtype3 | 51 | 1964.1 (13.8) |
Figure S55. Get High-res Image Clustering Approach #5: 'RNAseq CNMF subtypes' versus Clinical Feature #11: 'YEAROFTOBACCOSMOKINGONSET'
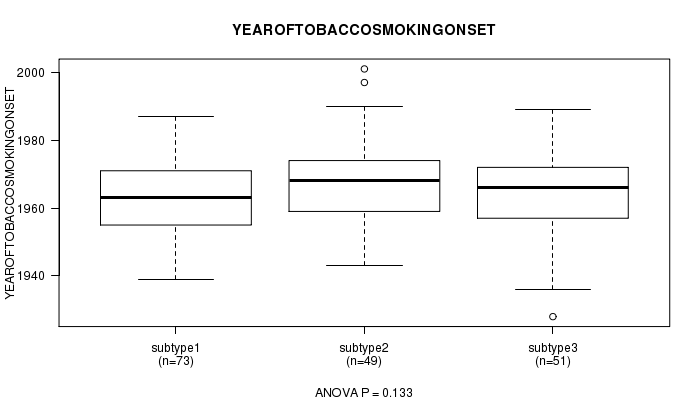
Table S61. Get Full Table Description of clustering approach #6: 'RNAseq cHierClus subtypes'
| Cluster Labels | 1 | 2 | 3 |
|---|---|---|---|
| Number of samples | 97 | 85 | 120 |
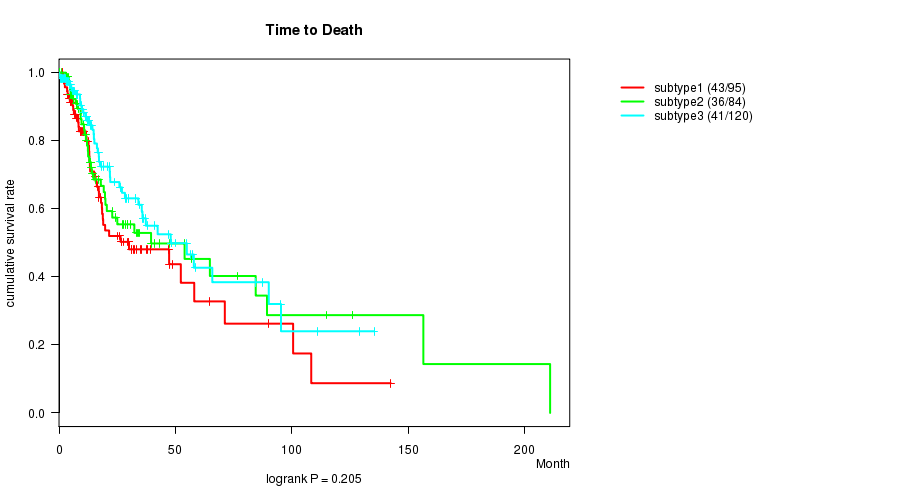
P value = 0.205 (logrank test), Q value = 1
Table S62. Clustering Approach #6: 'RNAseq cHierClus subtypes' versus Clinical Feature #1: 'Time to Death'
| nPatients | nDeath | Duration Range (Median), Month | |
|---|---|---|---|
| ALL | 299 | 120 | 0.1 - 210.9 (14.8) |
| subtype1 | 95 | 43 | 1.5 - 142.5 (15.1) |
| subtype2 | 84 | 36 | 0.1 - 210.9 (14.0) |
| subtype3 | 120 | 41 | 0.1 - 135.3 (15.1) |
Figure S56. Get High-res Image Clustering Approach #6: 'RNAseq cHierClus subtypes' versus Clinical Feature #1: 'Time to Death'
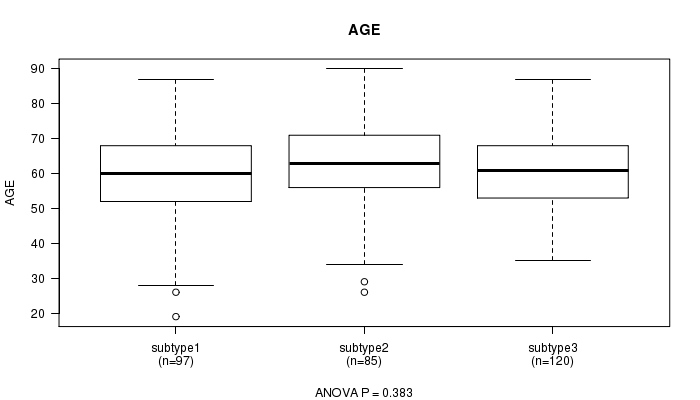
P value = 0.383 (ANOVA), Q value = 1
Table S63. Clustering Approach #6: 'RNAseq cHierClus subtypes' versus Clinical Feature #2: 'AGE'
| nPatients | Mean (Std.Dev) | |
|---|---|---|
| ALL | 302 | 61.0 (12.2) |
| subtype1 | 97 | 60.0 (13.3) |
| subtype2 | 85 | 62.5 (12.9) |
| subtype3 | 120 | 60.9 (10.5) |
Figure S57. Get High-res Image Clustering Approach #6: 'RNAseq cHierClus subtypes' versus Clinical Feature #2: 'AGE'
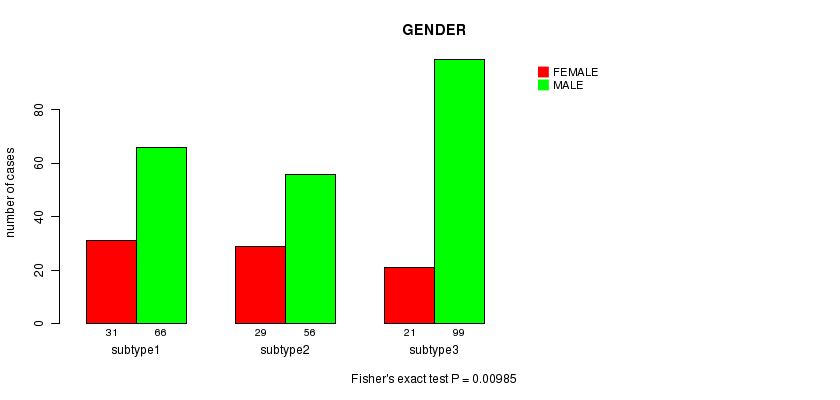
P value = 0.00985 (Fisher's exact test), Q value = 0.81
Table S64. Clustering Approach #6: 'RNAseq cHierClus subtypes' versus Clinical Feature #3: 'GENDER'
| nPatients | FEMALE | MALE |
|---|---|---|
| ALL | 81 | 221 |
| subtype1 | 31 | 66 |
| subtype2 | 29 | 56 |
| subtype3 | 21 | 99 |
Figure S58. Get High-res Image Clustering Approach #6: 'RNAseq cHierClus subtypes' versus Clinical Feature #3: 'GENDER'
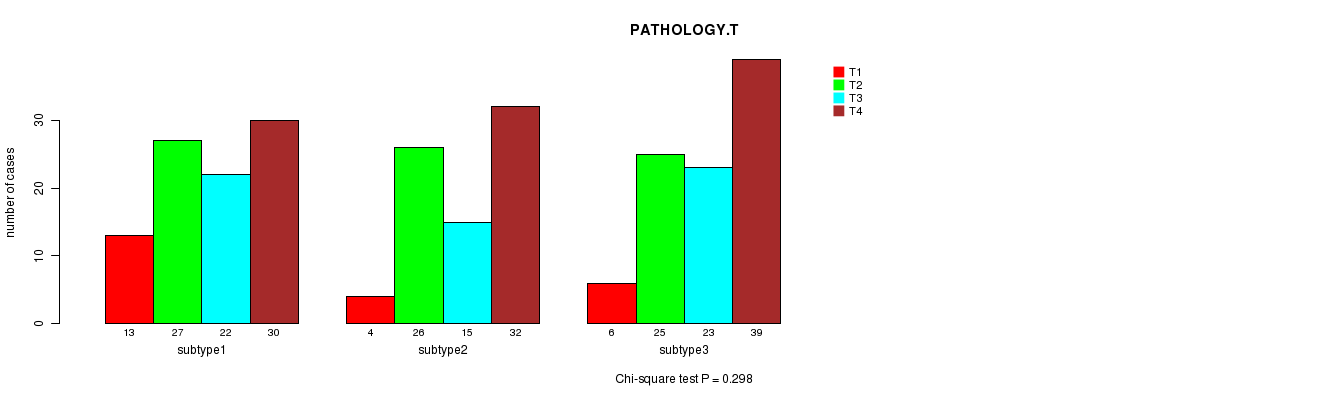
P value = 0.298 (Chi-square test), Q value = 1
Table S65. Clustering Approach #6: 'RNAseq cHierClus subtypes' versus Clinical Feature #4: 'PATHOLOGY.T'
| nPatients | T1 | T2 | T3 | T4 |
|---|---|---|---|---|
| ALL | 23 | 78 | 60 | 101 |
| subtype1 | 13 | 27 | 22 | 30 |
| subtype2 | 4 | 26 | 15 | 32 |
| subtype3 | 6 | 25 | 23 | 39 |
Figure S59. Get High-res Image Clustering Approach #6: 'RNAseq cHierClus subtypes' versus Clinical Feature #4: 'PATHOLOGY.T'
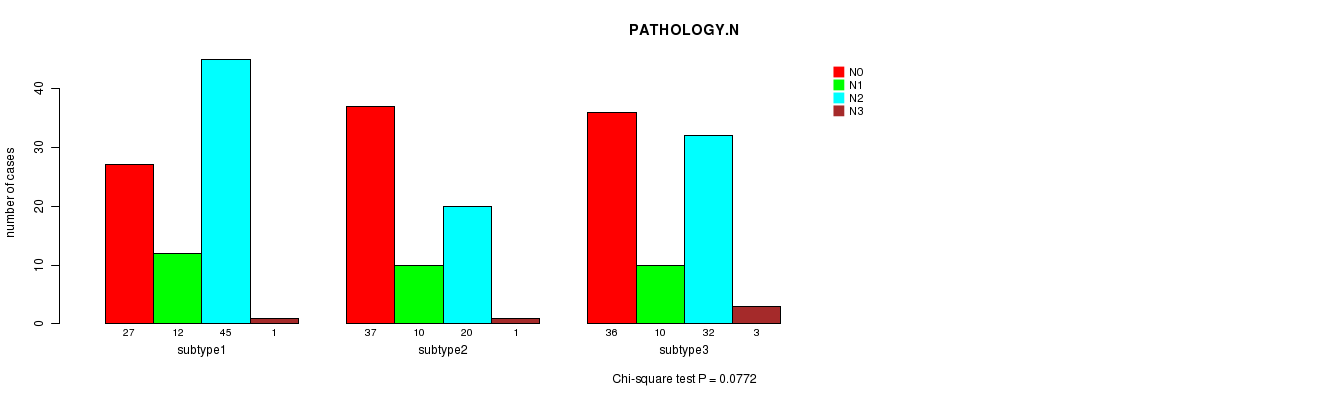
P value = 0.0772 (Chi-square test), Q value = 1
Table S66. Clustering Approach #6: 'RNAseq cHierClus subtypes' versus Clinical Feature #5: 'PATHOLOGY.N'
| nPatients | N0 | N1 | N2 | N3 |
|---|---|---|---|---|
| ALL | 100 | 32 | 97 | 5 |
| subtype1 | 27 | 12 | 45 | 1 |
| subtype2 | 37 | 10 | 20 | 1 |
| subtype3 | 36 | 10 | 32 | 3 |
Figure S60. Get High-res Image Clustering Approach #6: 'RNAseq cHierClus subtypes' versus Clinical Feature #5: 'PATHOLOGY.N'
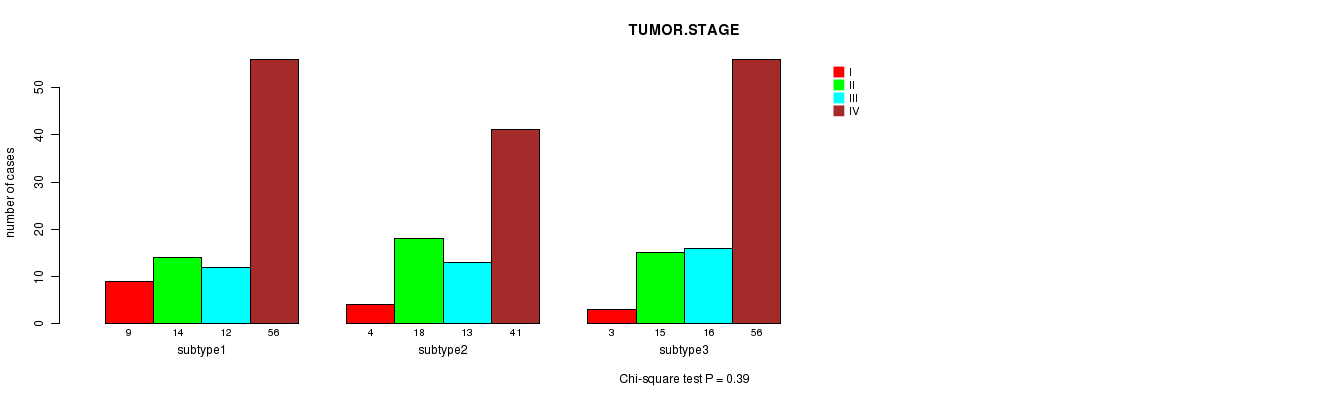
P value = 0.39 (Chi-square test), Q value = 1
Table S67. Clustering Approach #6: 'RNAseq cHierClus subtypes' versus Clinical Feature #6: 'TUMOR.STAGE'
| nPatients | I | II | III | IV |
|---|---|---|---|---|
| ALL | 16 | 47 | 41 | 153 |
| subtype1 | 9 | 14 | 12 | 56 |
| subtype2 | 4 | 18 | 13 | 41 |
| subtype3 | 3 | 15 | 16 | 56 |
Figure S61. Get High-res Image Clustering Approach #6: 'RNAseq cHierClus subtypes' versus Clinical Feature #6: 'TUMOR.STAGE'
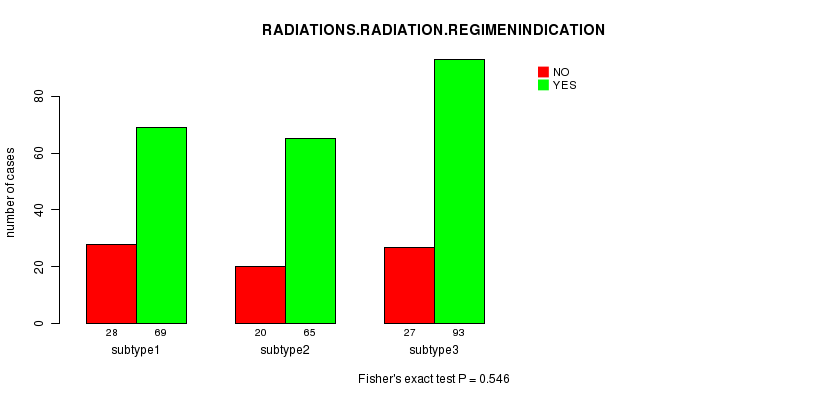
P value = 0.546 (Fisher's exact test), Q value = 1
Table S68. Clustering Approach #6: 'RNAseq cHierClus subtypes' versus Clinical Feature #7: 'RADIATIONS.RADIATION.REGIMENINDICATION'
| nPatients | NO | YES |
|---|---|---|
| ALL | 75 | 227 |
| subtype1 | 28 | 69 |
| subtype2 | 20 | 65 |
| subtype3 | 27 | 93 |
Figure S62. Get High-res Image Clustering Approach #6: 'RNAseq cHierClus subtypes' versus Clinical Feature #7: 'RADIATIONS.RADIATION.REGIMENINDICATION'
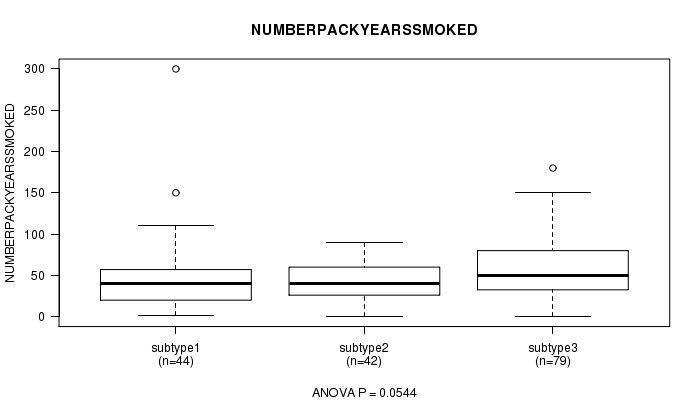
P value = 0.0544 (ANOVA), Q value = 1
Table S69. Clustering Approach #6: 'RNAseq cHierClus subtypes' versus Clinical Feature #8: 'NUMBERPACKYEARSSMOKED'
| nPatients | Mean (Std.Dev) | |
|---|---|---|
| ALL | 165 | 50.0 (37.4) |
| subtype1 | 44 | 46.6 (49.1) |
| subtype2 | 42 | 40.5 (20.5) |
| subtype3 | 79 | 56.9 (35.8) |
Figure S63. Get High-res Image Clustering Approach #6: 'RNAseq cHierClus subtypes' versus Clinical Feature #8: 'NUMBERPACKYEARSSMOKED'
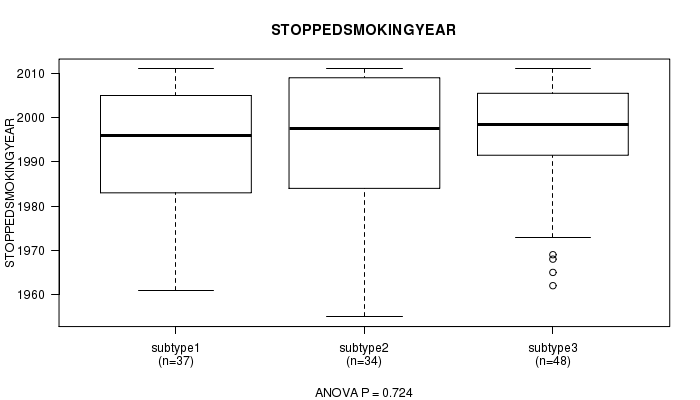
P value = 0.724 (ANOVA), Q value = 1
Table S70. Clustering Approach #6: 'RNAseq cHierClus subtypes' versus Clinical Feature #9: 'STOPPEDSMOKINGYEAR'
| nPatients | Mean (Std.Dev) | |
|---|---|---|
| ALL | 119 | 1994.6 (13.9) |
| subtype1 | 37 | 1993.6 (14.0) |
| subtype2 | 34 | 1993.9 (15.5) |
| subtype3 | 48 | 1995.8 (12.9) |
Figure S64. Get High-res Image Clustering Approach #6: 'RNAseq cHierClus subtypes' versus Clinical Feature #9: 'STOPPEDSMOKINGYEAR'
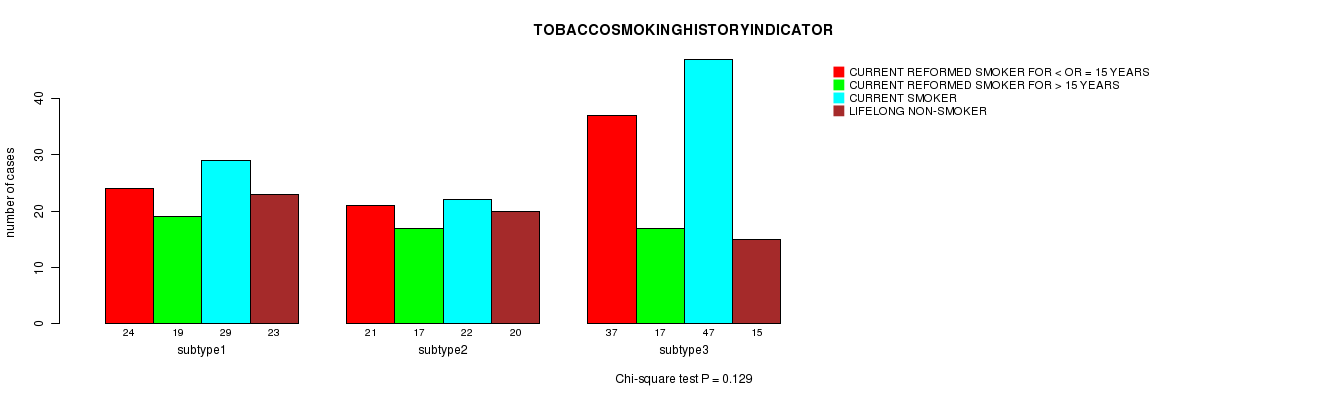
P value = 0.129 (Chi-square test), Q value = 1
Table S71. Clustering Approach #6: 'RNAseq cHierClus subtypes' versus Clinical Feature #10: 'TOBACCOSMOKINGHISTORYINDICATOR'
| nPatients | CURRENT REFORMED SMOKER FOR < OR = 15 YEARS | CURRENT REFORMED SMOKER FOR > 15 YEARS | CURRENT SMOKER | LIFELONG NON-SMOKER |
|---|---|---|---|---|
| ALL | 82 | 53 | 98 | 58 |
| subtype1 | 24 | 19 | 29 | 23 |
| subtype2 | 21 | 17 | 22 | 20 |
| subtype3 | 37 | 17 | 47 | 15 |
Figure S65. Get High-res Image Clustering Approach #6: 'RNAseq cHierClus subtypes' versus Clinical Feature #10: 'TOBACCOSMOKINGHISTORYINDICATOR'
P value = 0.125 (ANOVA), Q value = 1
Table S72. Clustering Approach #6: 'RNAseq cHierClus subtypes' versus Clinical Feature #11: 'YEAROFTOBACCOSMOKINGONSET'
| nPatients | Mean (Std.Dev) | |
|---|---|---|
| ALL | 173 | 1964.5 (12.1) |
| subtype1 | 51 | 1967.4 (11.8) |
| subtype2 | 44 | 1963.9 (14.2) |
| subtype3 | 78 | 1963.0 (10.8) |
Figure S66. Get High-res Image Clustering Approach #6: 'RNAseq cHierClus subtypes' versus Clinical Feature #11: 'YEAROFTOBACCOSMOKINGONSET'
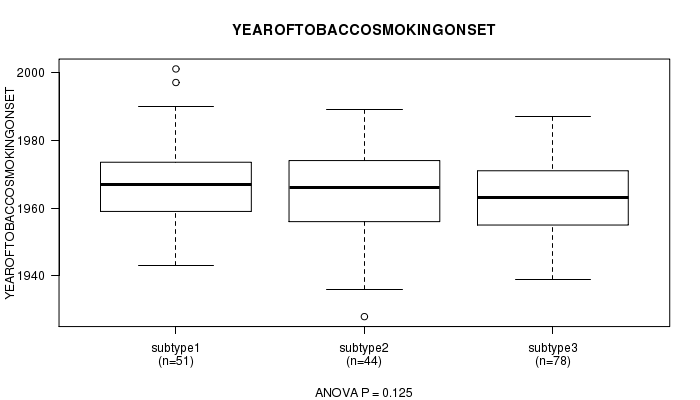
Table S73. Get Full Table Description of clustering approach #7: 'MIRseq CNMF subtypes'
| Cluster Labels | 1 | 2 | 3 |
|---|---|---|---|
| Number of samples | 83 | 131 | 94 |
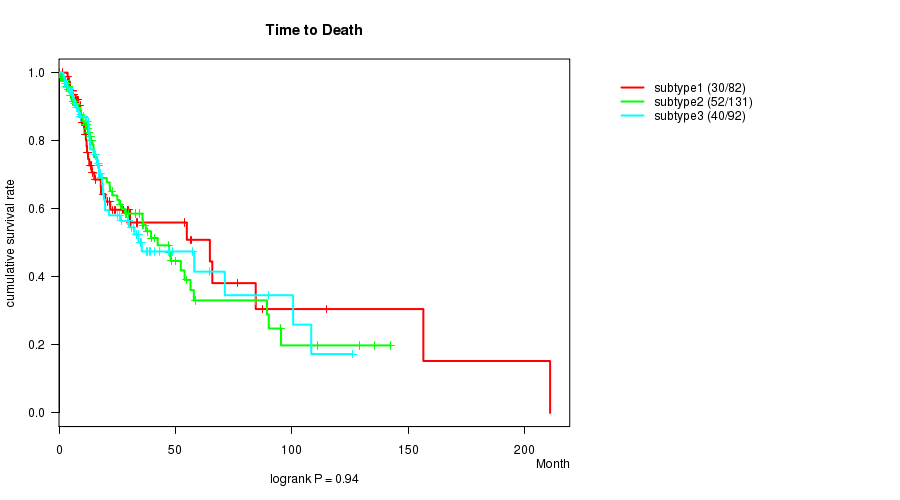
P value = 0.94 (logrank test), Q value = 1
Table S74. Clustering Approach #7: 'MIRseq CNMF subtypes' versus Clinical Feature #1: 'Time to Death'
| nPatients | nDeath | Duration Range (Median), Month | |
|---|---|---|---|
| ALL | 305 | 122 | 0.1 - 210.9 (15.0) |
| subtype1 | 82 | 30 | 0.1 - 210.9 (12.1) |
| subtype2 | 131 | 52 | 0.1 - 142.5 (14.3) |
| subtype3 | 92 | 40 | 1.8 - 126.1 (18.1) |
Figure S67. Get High-res Image Clustering Approach #7: 'MIRseq CNMF subtypes' versus Clinical Feature #1: 'Time to Death'
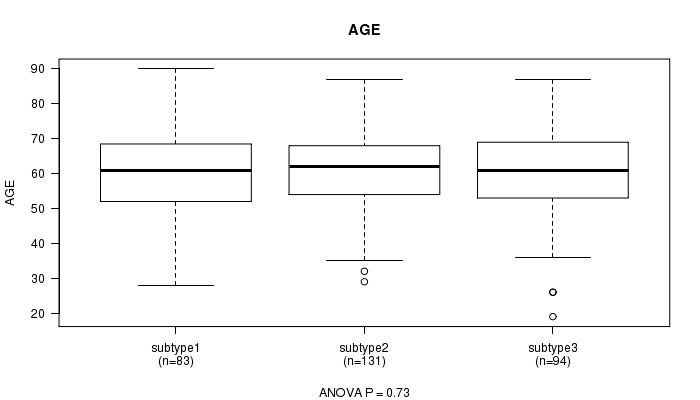
P value = 0.73 (ANOVA), Q value = 1
Table S75. Clustering Approach #7: 'MIRseq CNMF subtypes' versus Clinical Feature #2: 'AGE'
| nPatients | Mean (Std.Dev) | |
|---|---|---|
| ALL | 308 | 61.1 (12.1) |
| subtype1 | 83 | 60.4 (12.5) |
| subtype2 | 131 | 61.7 (11.4) |
| subtype3 | 94 | 60.9 (12.7) |
Figure S68. Get High-res Image Clustering Approach #7: 'MIRseq CNMF subtypes' versus Clinical Feature #2: 'AGE'
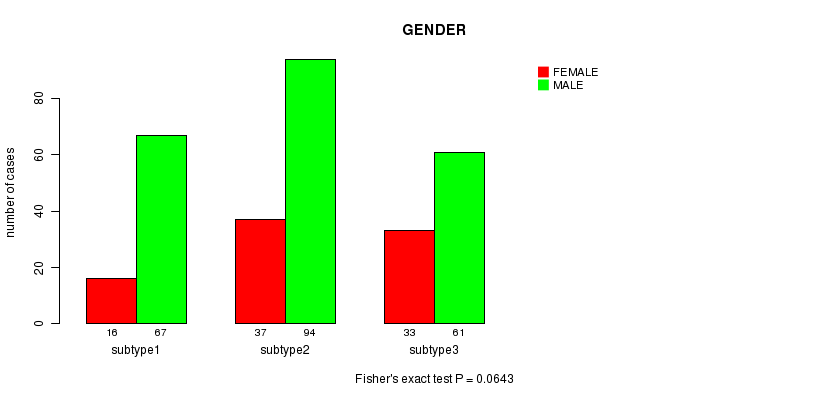
P value = 0.0643 (Fisher's exact test), Q value = 1
Table S76. Clustering Approach #7: 'MIRseq CNMF subtypes' versus Clinical Feature #3: 'GENDER'
| nPatients | FEMALE | MALE |
|---|---|---|
| ALL | 86 | 222 |
| subtype1 | 16 | 67 |
| subtype2 | 37 | 94 |
| subtype3 | 33 | 61 |
Figure S69. Get High-res Image Clustering Approach #7: 'MIRseq CNMF subtypes' versus Clinical Feature #3: 'GENDER'
P value = 0.121 (Chi-square test), Q value = 1
Table S77. Clustering Approach #7: 'MIRseq CNMF subtypes' versus Clinical Feature #4: 'PATHOLOGY.T'
| nPatients | T1 | T2 | T3 | T4 |
|---|---|---|---|---|
| ALL | 24 | 78 | 62 | 103 |
| subtype1 | 5 | 23 | 11 | 30 |
| subtype2 | 7 | 26 | 29 | 47 |
| subtype3 | 12 | 29 | 22 | 26 |
Figure S70. Get High-res Image Clustering Approach #7: 'MIRseq CNMF subtypes' versus Clinical Feature #4: 'PATHOLOGY.T'
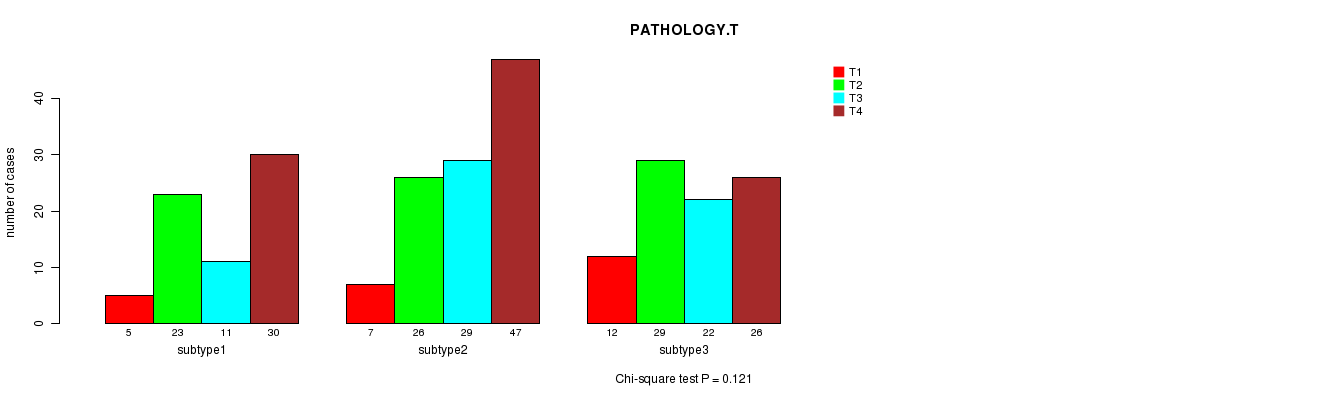
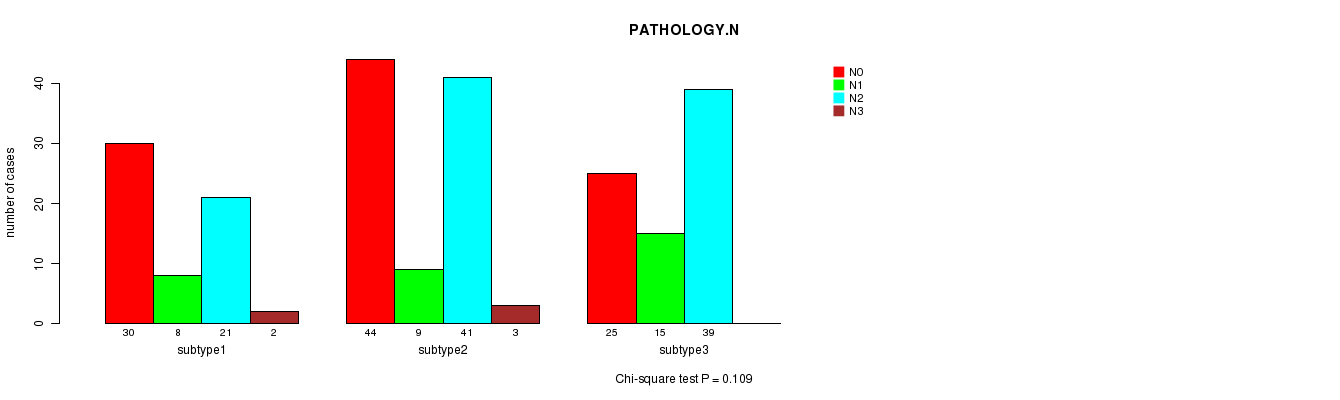
P value = 0.109 (Chi-square test), Q value = 1
Table S78. Clustering Approach #7: 'MIRseq CNMF subtypes' versus Clinical Feature #5: 'PATHOLOGY.N'
| nPatients | N0 | N1 | N2 | N3 |
|---|---|---|---|---|
| ALL | 99 | 32 | 101 | 5 |
| subtype1 | 30 | 8 | 21 | 2 |
| subtype2 | 44 | 9 | 41 | 3 |
| subtype3 | 25 | 15 | 39 | 0 |
Figure S71. Get High-res Image Clustering Approach #7: 'MIRseq CNMF subtypes' versus Clinical Feature #5: 'PATHOLOGY.N'
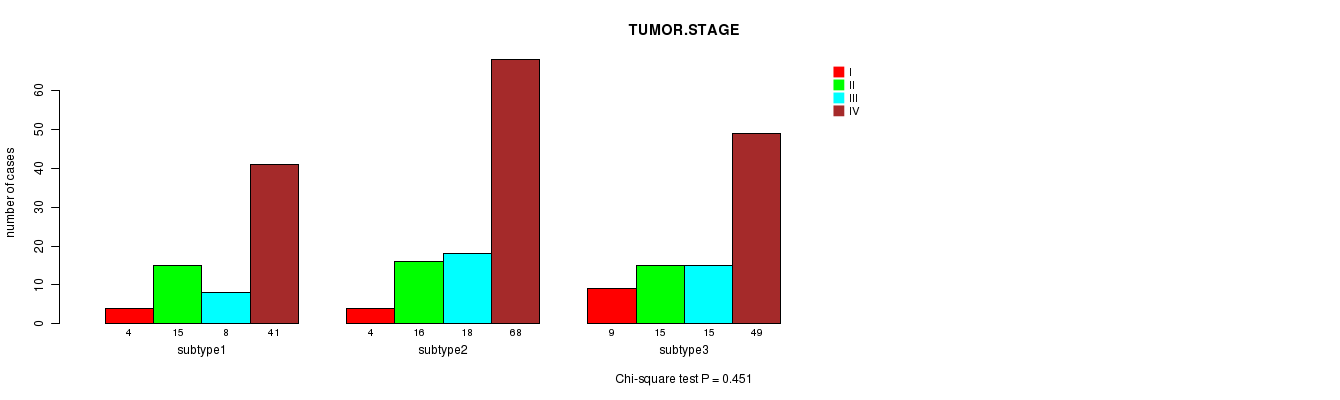
P value = 0.451 (Chi-square test), Q value = 1
Table S79. Clustering Approach #7: 'MIRseq CNMF subtypes' versus Clinical Feature #6: 'TUMOR.STAGE'
| nPatients | I | II | III | IV |
|---|---|---|---|---|
| ALL | 17 | 46 | 41 | 158 |
| subtype1 | 4 | 15 | 8 | 41 |
| subtype2 | 4 | 16 | 18 | 68 |
| subtype3 | 9 | 15 | 15 | 49 |
Figure S72. Get High-res Image Clustering Approach #7: 'MIRseq CNMF subtypes' versus Clinical Feature #6: 'TUMOR.STAGE'
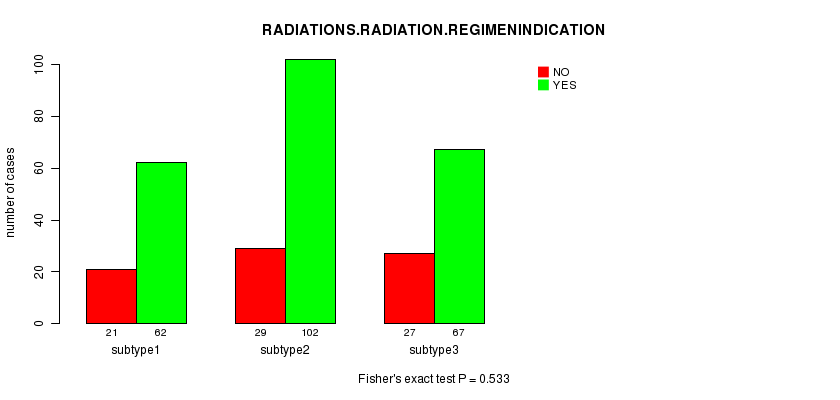
P value = 0.533 (Fisher's exact test), Q value = 1
Table S80. Clustering Approach #7: 'MIRseq CNMF subtypes' versus Clinical Feature #7: 'RADIATIONS.RADIATION.REGIMENINDICATION'
| nPatients | NO | YES |
|---|---|---|
| ALL | 77 | 231 |
| subtype1 | 21 | 62 |
| subtype2 | 29 | 102 |
| subtype3 | 27 | 67 |
Figure S73. Get High-res Image Clustering Approach #7: 'MIRseq CNMF subtypes' versus Clinical Feature #7: 'RADIATIONS.RADIATION.REGIMENINDICATION'
P value = 0.413 (ANOVA), Q value = 1
Table S81. Clustering Approach #7: 'MIRseq CNMF subtypes' versus Clinical Feature #8: 'NUMBERPACKYEARSSMOKED'
| nPatients | Mean (Std.Dev) | |
|---|---|---|
| ALL | 169 | 49.8 (37.1) |
| subtype1 | 53 | 45.8 (25.8) |
| subtype2 | 76 | 54.0 (35.3) |
| subtype3 | 40 | 47.1 (51.0) |
Figure S74. Get High-res Image Clustering Approach #7: 'MIRseq CNMF subtypes' versus Clinical Feature #8: 'NUMBERPACKYEARSSMOKED'
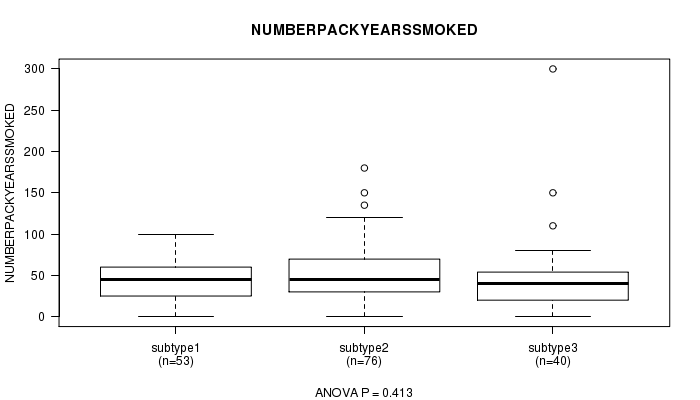
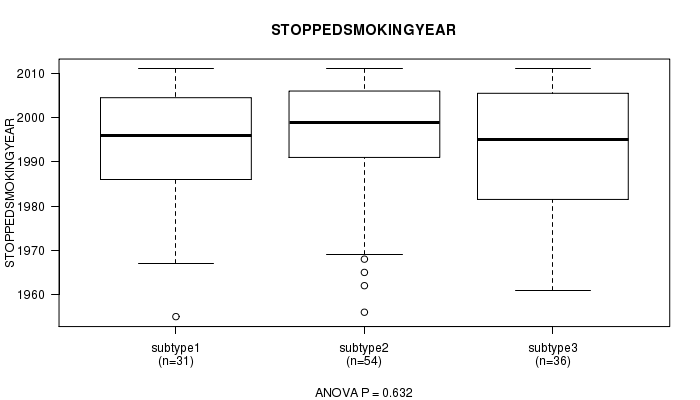
P value = 0.632 (ANOVA), Q value = 1
Table S82. Clustering Approach #7: 'MIRseq CNMF subtypes' versus Clinical Feature #9: 'STOPPEDSMOKINGYEAR'
| nPatients | Mean (Std.Dev) | |
|---|---|---|
| ALL | 121 | 1994.4 (13.8) |
| subtype1 | 31 | 1993.5 (13.6) |
| subtype2 | 54 | 1995.7 (13.8) |
| subtype3 | 36 | 1993.1 (14.1) |
Figure S75. Get High-res Image Clustering Approach #7: 'MIRseq CNMF subtypes' versus Clinical Feature #9: 'STOPPEDSMOKINGYEAR'
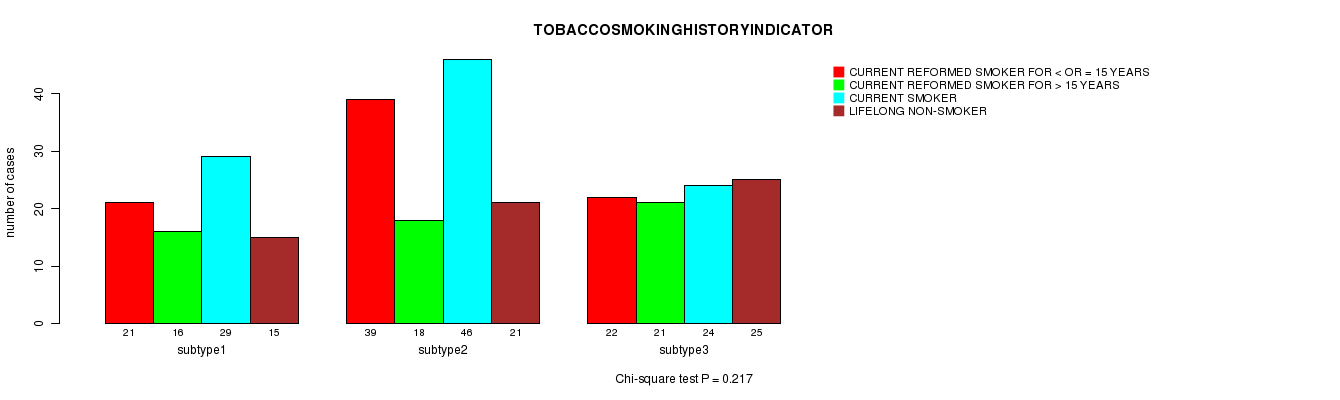
P value = 0.217 (Chi-square test), Q value = 1
Table S83. Clustering Approach #7: 'MIRseq CNMF subtypes' versus Clinical Feature #10: 'TOBACCOSMOKINGHISTORYINDICATOR'
| nPatients | CURRENT REFORMED SMOKER FOR < OR = 15 YEARS | CURRENT REFORMED SMOKER FOR > 15 YEARS | CURRENT SMOKER | LIFELONG NON-SMOKER |
|---|---|---|---|---|
| ALL | 82 | 55 | 99 | 61 |
| subtype1 | 21 | 16 | 29 | 15 |
| subtype2 | 39 | 18 | 46 | 21 |
| subtype3 | 22 | 21 | 24 | 25 |
Figure S76. Get High-res Image Clustering Approach #7: 'MIRseq CNMF subtypes' versus Clinical Feature #10: 'TOBACCOSMOKINGHISTORYINDICATOR'
P value = 0.366 (ANOVA), Q value = 1
Table S84. Clustering Approach #7: 'MIRseq CNMF subtypes' versus Clinical Feature #11: 'YEAROFTOBACCOSMOKINGONSET'
| nPatients | Mean (Std.Dev) | |
|---|---|---|
| ALL | 176 | 1964.5 (12.1) |
| subtype1 | 52 | 1964.9 (13.4) |
| subtype2 | 76 | 1963.2 (11.6) |
| subtype3 | 48 | 1966.3 (11.3) |
Figure S77. Get High-res Image Clustering Approach #7: 'MIRseq CNMF subtypes' versus Clinical Feature #11: 'YEAROFTOBACCOSMOKINGONSET'
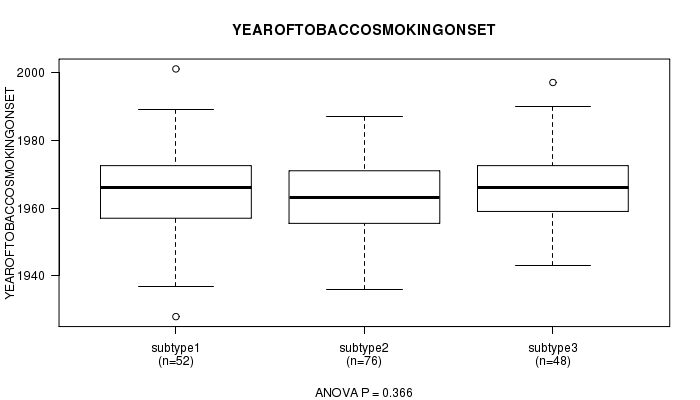
Table S85. Get Full Table Description of clustering approach #8: 'MIRseq cHierClus subtypes'
| Cluster Labels | 1 | 2 | 3 | 4 |
|---|---|---|---|---|
| Number of samples | 13 | 12 | 167 | 116 |
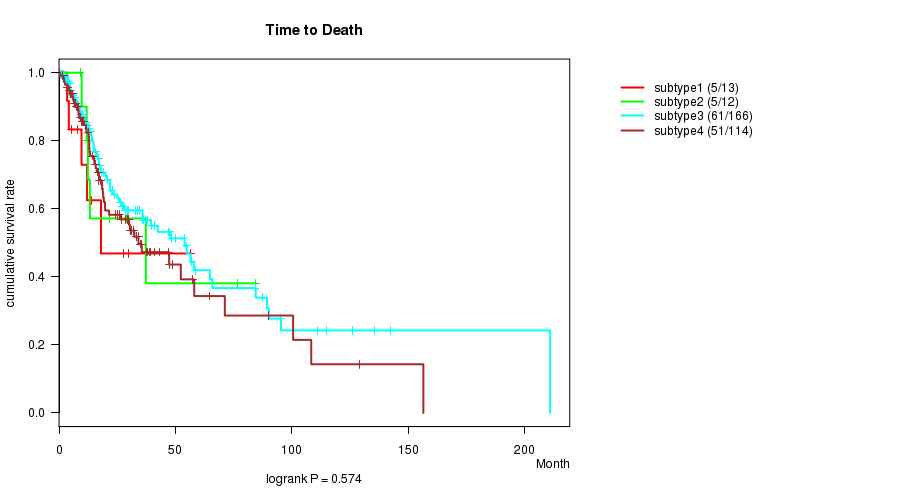
P value = 0.574 (logrank test), Q value = 1
Table S86. Clustering Approach #8: 'MIRseq cHierClus subtypes' versus Clinical Feature #1: 'Time to Death'
| nPatients | nDeath | Duration Range (Median), Month | |
|---|---|---|---|
| ALL | 305 | 122 | 0.1 - 210.9 (15.0) |
| subtype1 | 13 | 5 | 0.2 - 56.7 (12.0) |
| subtype2 | 12 | 5 | 9.0 - 84.4 (12.8) |
| subtype3 | 166 | 61 | 0.1 - 210.9 (14.0) |
| subtype4 | 114 | 51 | 0.5 - 156.5 (17.1) |
Figure S78. Get High-res Image Clustering Approach #8: 'MIRseq cHierClus subtypes' versus Clinical Feature #1: 'Time to Death'
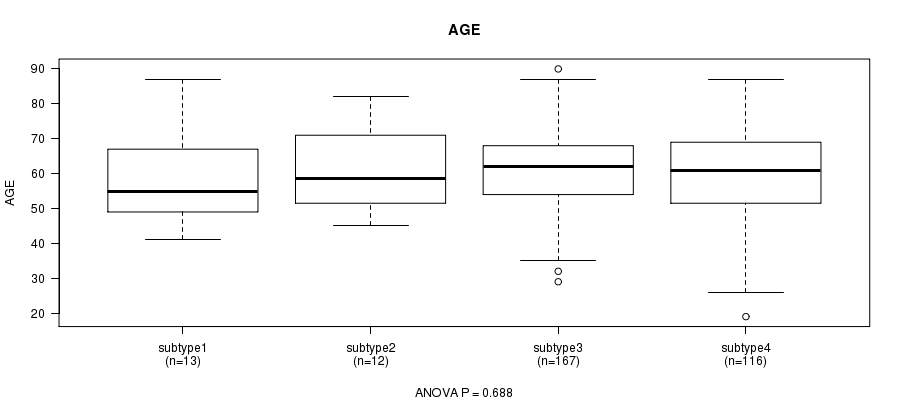
P value = 0.688 (ANOVA), Q value = 1
Table S87. Clustering Approach #8: 'MIRseq cHierClus subtypes' versus Clinical Feature #2: 'AGE'
| nPatients | Mean (Std.Dev) | |
|---|---|---|
| ALL | 308 | 61.1 (12.1) |
| subtype1 | 13 | 58.4 (13.2) |
| subtype2 | 12 | 60.8 (12.0) |
| subtype3 | 167 | 61.8 (11.5) |
| subtype4 | 116 | 60.4 (12.9) |
Figure S79. Get High-res Image Clustering Approach #8: 'MIRseq cHierClus subtypes' versus Clinical Feature #2: 'AGE'
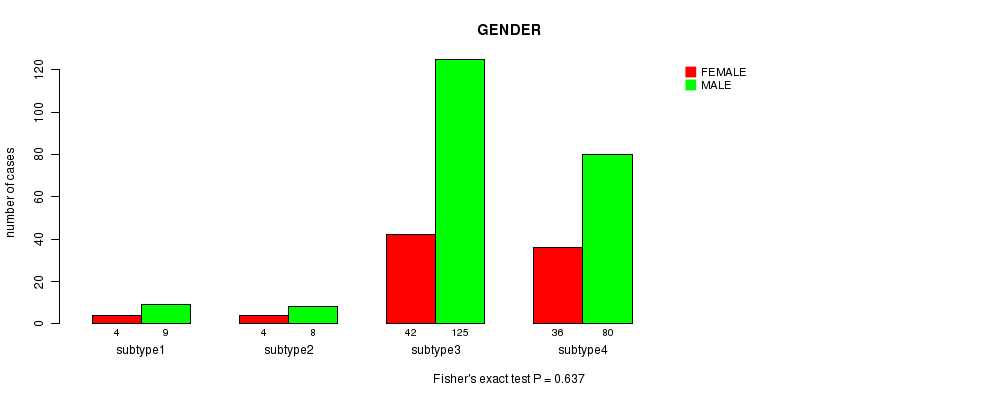
P value = 0.637 (Fisher's exact test), Q value = 1
Table S88. Clustering Approach #8: 'MIRseq cHierClus subtypes' versus Clinical Feature #3: 'GENDER'
| nPatients | FEMALE | MALE |
|---|---|---|
| ALL | 86 | 222 |
| subtype1 | 4 | 9 |
| subtype2 | 4 | 8 |
| subtype3 | 42 | 125 |
| subtype4 | 36 | 80 |
Figure S80. Get High-res Image Clustering Approach #8: 'MIRseq cHierClus subtypes' versus Clinical Feature #3: 'GENDER'
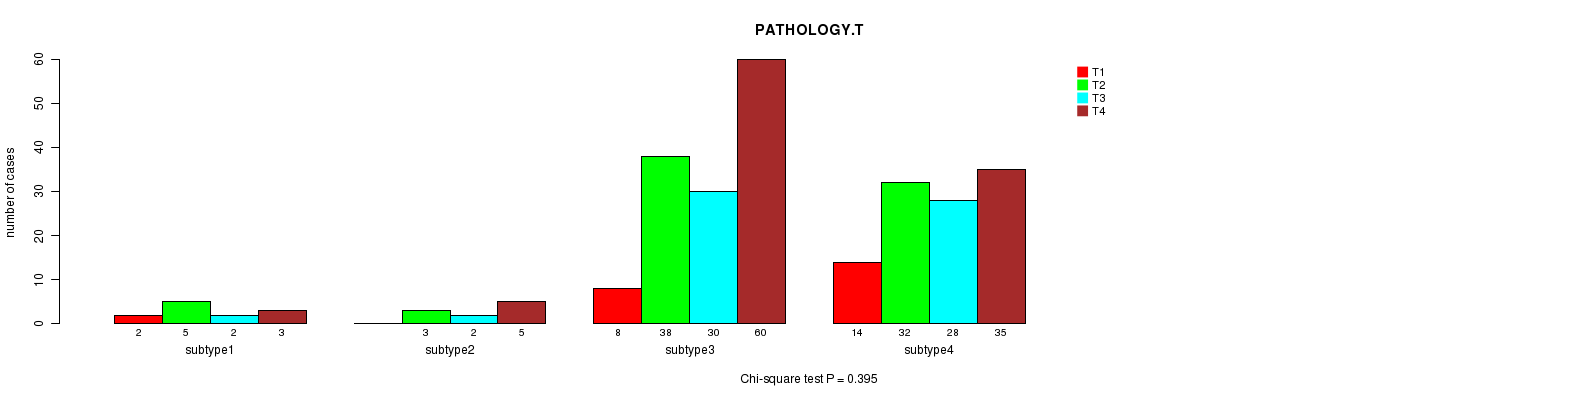
P value = 0.395 (Chi-square test), Q value = 1
Table S89. Clustering Approach #8: 'MIRseq cHierClus subtypes' versus Clinical Feature #4: 'PATHOLOGY.T'
| nPatients | T1 | T2 | T3 | T4 |
|---|---|---|---|---|
| ALL | 24 | 78 | 62 | 103 |
| subtype1 | 2 | 5 | 2 | 3 |
| subtype2 | 0 | 3 | 2 | 5 |
| subtype3 | 8 | 38 | 30 | 60 |
| subtype4 | 14 | 32 | 28 | 35 |
Figure S81. Get High-res Image Clustering Approach #8: 'MIRseq cHierClus subtypes' versus Clinical Feature #4: 'PATHOLOGY.T'
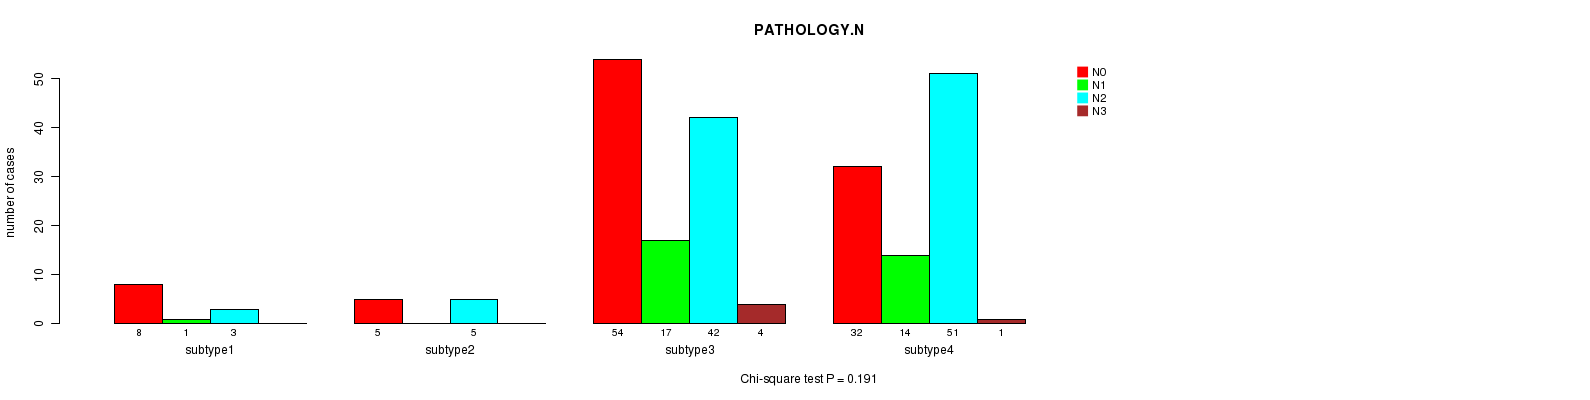
P value = 0.191 (Chi-square test), Q value = 1
Table S90. Clustering Approach #8: 'MIRseq cHierClus subtypes' versus Clinical Feature #5: 'PATHOLOGY.N'
| nPatients | N0 | N1 | N2 | N3 |
|---|---|---|---|---|
| ALL | 99 | 32 | 101 | 5 |
| subtype1 | 8 | 1 | 3 | 0 |
| subtype2 | 5 | 0 | 5 | 0 |
| subtype3 | 54 | 17 | 42 | 4 |
| subtype4 | 32 | 14 | 51 | 1 |
Figure S82. Get High-res Image Clustering Approach #8: 'MIRseq cHierClus subtypes' versus Clinical Feature #5: 'PATHOLOGY.N'
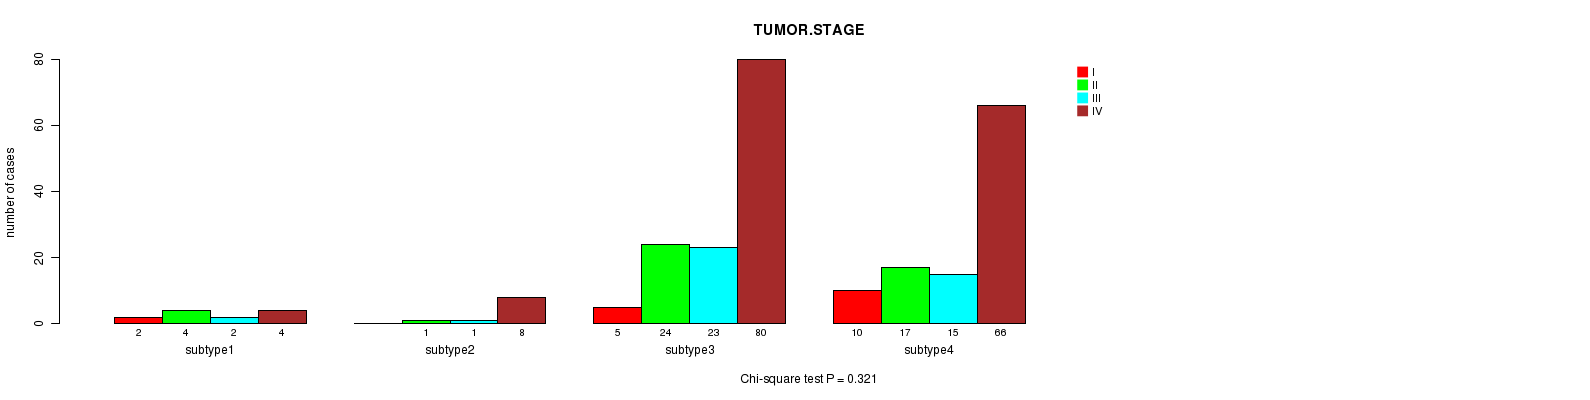
P value = 0.321 (Chi-square test), Q value = 1
Table S91. Clustering Approach #8: 'MIRseq cHierClus subtypes' versus Clinical Feature #6: 'TUMOR.STAGE'
| nPatients | I | II | III | IV |
|---|---|---|---|---|
| ALL | 17 | 46 | 41 | 158 |
| subtype1 | 2 | 4 | 2 | 4 |
| subtype2 | 0 | 1 | 1 | 8 |
| subtype3 | 5 | 24 | 23 | 80 |
| subtype4 | 10 | 17 | 15 | 66 |
Figure S83. Get High-res Image Clustering Approach #8: 'MIRseq cHierClus subtypes' versus Clinical Feature #6: 'TUMOR.STAGE'
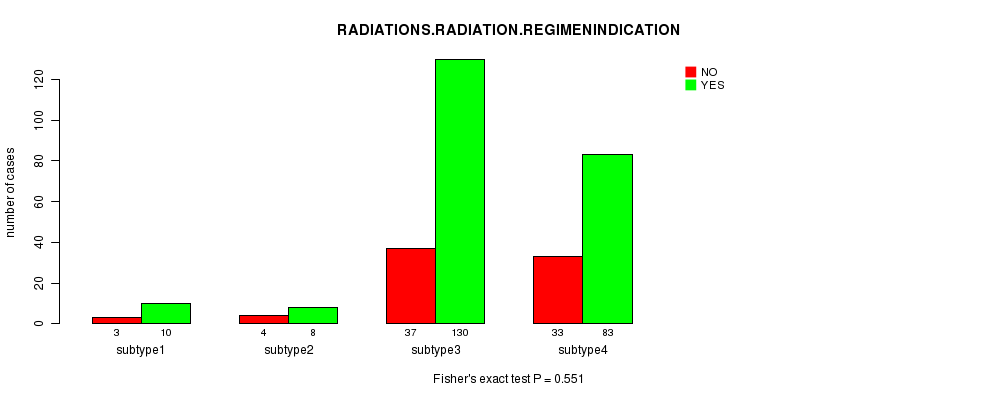
P value = 0.551 (Fisher's exact test), Q value = 1
Table S92. Clustering Approach #8: 'MIRseq cHierClus subtypes' versus Clinical Feature #7: 'RADIATIONS.RADIATION.REGIMENINDICATION'
| nPatients | NO | YES |
|---|---|---|
| ALL | 77 | 231 |
| subtype1 | 3 | 10 |
| subtype2 | 4 | 8 |
| subtype3 | 37 | 130 |
| subtype4 | 33 | 83 |
Figure S84. Get High-res Image Clustering Approach #8: 'MIRseq cHierClus subtypes' versus Clinical Feature #7: 'RADIATIONS.RADIATION.REGIMENINDICATION'
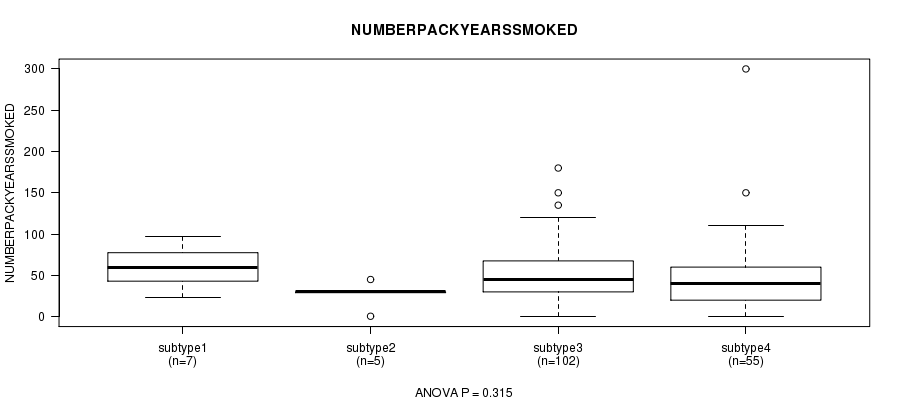
P value = 0.315 (ANOVA), Q value = 1
Table S93. Clustering Approach #8: 'MIRseq cHierClus subtypes' versus Clinical Feature #8: 'NUMBERPACKYEARSSMOKED'
| nPatients | Mean (Std.Dev) | |
|---|---|---|
| ALL | 169 | 49.8 (37.1) |
| subtype1 | 7 | 60.2 (25.8) |
| subtype2 | 5 | 26.9 (16.2) |
| subtype3 | 102 | 52.3 (33.3) |
| subtype4 | 55 | 45.8 (45.0) |
Figure S85. Get High-res Image Clustering Approach #8: 'MIRseq cHierClus subtypes' versus Clinical Feature #8: 'NUMBERPACKYEARSSMOKED'
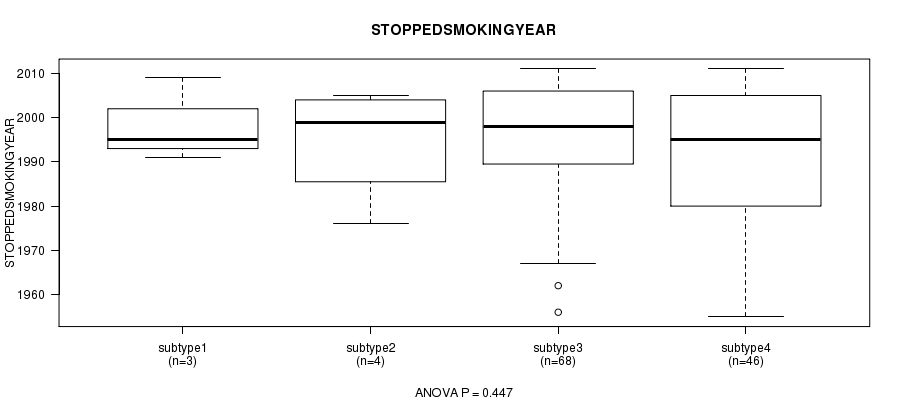
P value = 0.447 (ANOVA), Q value = 1
Table S94. Clustering Approach #8: 'MIRseq cHierClus subtypes' versus Clinical Feature #9: 'STOPPEDSMOKINGYEAR'
| nPatients | Mean (Std.Dev) | |
|---|---|---|
| ALL | 121 | 1994.4 (13.8) |
| subtype1 | 3 | 1998.3 (9.5) |
| subtype2 | 4 | 1994.8 (13.2) |
| subtype3 | 68 | 1995.9 (13.3) |
| subtype4 | 46 | 1991.8 (14.6) |
Figure S86. Get High-res Image Clustering Approach #8: 'MIRseq cHierClus subtypes' versus Clinical Feature #9: 'STOPPEDSMOKINGYEAR'
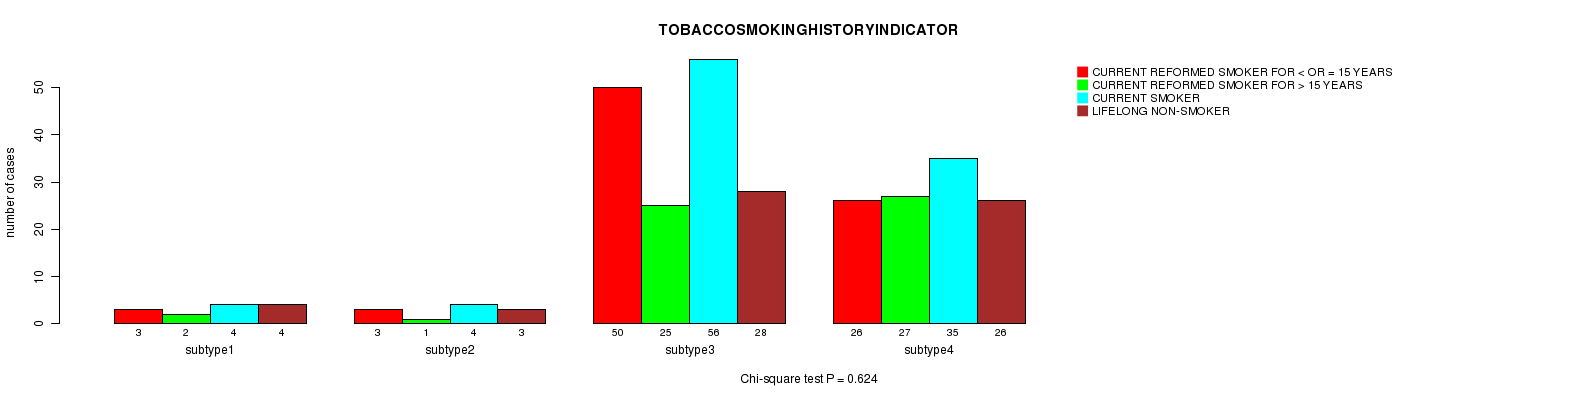
P value = 0.624 (Chi-square test), Q value = 1
Table S95. Clustering Approach #8: 'MIRseq cHierClus subtypes' versus Clinical Feature #10: 'TOBACCOSMOKINGHISTORYINDICATOR'
| nPatients | CURRENT REFORMED SMOKER FOR < OR = 15 YEARS | CURRENT REFORMED SMOKER FOR > 15 YEARS | CURRENT SMOKER | LIFELONG NON-SMOKER |
|---|---|---|---|---|
| ALL | 82 | 55 | 99 | 61 |
| subtype1 | 3 | 2 | 4 | 4 |
| subtype2 | 3 | 1 | 4 | 3 |
| subtype3 | 50 | 25 | 56 | 28 |
| subtype4 | 26 | 27 | 35 | 26 |
Figure S87. Get High-res Image Clustering Approach #8: 'MIRseq cHierClus subtypes' versus Clinical Feature #10: 'TOBACCOSMOKINGHISTORYINDICATOR'
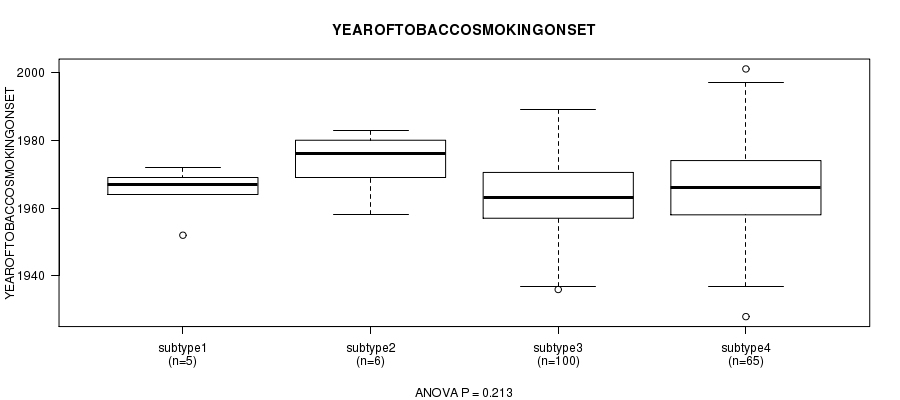
P value = 0.213 (ANOVA), Q value = 1
Table S96. Clustering Approach #8: 'MIRseq cHierClus subtypes' versus Clinical Feature #11: 'YEAROFTOBACCOSMOKINGONSET'
| nPatients | Mean (Std.Dev) | |
|---|---|---|
| ALL | 176 | 1964.5 (12.1) |
| subtype1 | 5 | 1964.8 (7.7) |
| subtype2 | 6 | 1973.7 (9.1) |
| subtype3 | 100 | 1963.5 (11.2) |
| subtype4 | 65 | 1965.3 (13.6) |
Figure S88. Get High-res Image Clustering Approach #8: 'MIRseq cHierClus subtypes' versus Clinical Feature #11: 'YEAROFTOBACCOSMOKINGONSET'
-
Cluster data file = HNSC-TP.mergedcluster.txt
-
Clinical data file = HNSC-TP.clin.merged.picked.txt
-
Number of patients = 315
-
Number of clustering approaches = 8
-
Number of selected clinical features = 11
-
Exclude small clusters that include fewer than K patients, K = 3
consensus non-negative matrix factorization clustering approach (Brunet et al. 2004)
Resampling-based clustering method (Monti et al. 2003)
For survival clinical features, the Kaplan-Meier survival curves of tumors with and without gene mutations were plotted and the statistical significance P values were estimated by logrank test (Bland and Altman 2004) using the 'survdiff' function in R
For continuous numerical clinical features, one-way analysis of variance (Howell 2002) was applied to compare the clinical values between tumor subtypes using 'anova' function in R
For multi-class clinical features (nominal or ordinal), Chi-square tests (Greenwood and Nikulin 1996) were used to estimate the P values using the 'chisq.test' function in R
For binary clinical features, two-tailed Fisher's exact tests (Fisher 1922) were used to estimate the P values using the 'fisher.test' function in R
For multiple hypothesis correction, Q value is the False Discovery Rate (FDR) analogue of the P value (Benjamini and Hochberg 1995), defined as the minimum FDR at which the test may be called significant. We used the 'Benjamini and Hochberg' method of 'p.adjust' function in R to convert P values into Q values.
This is an experimental feature. The full results of the analysis summarized in this report can be downloaded from the TCGA Data Coordination Center.