(primary solid tumor cohort)
This report serves to describe the mutational landscape and properties of a given individual set, as well as rank genes and genesets according to mutational significance. MutSig v2.0 was used to generate the results found in this report.
-
Working with individual set: HNSC-TP
-
Number of patients in set: 306
The input for this pipeline is a set of individuals with the following files associated for each:
-
An annotated .maf file describing the mutations called for the respective individual, and their properties.
-
A .wig file that contains information about the coverage of the sample.
-
MAF used for this analysis:HNSC-TP.final_analysis_set.maf
-
Significantly mutated genes (q ≤ 0.1): 104
-
Mutations seen in COSMIC: 469
-
Significantly mutated genes in COSMIC territory: 8
-
Genes with clustered mutations (≤ 3 aa apart): 550
-
Significantly mutated genesets: 66
-
Significantly mutated genesets: (excluding sig. mutated genes):0
-
Read 306 MAFs of type "Broad"
-
Total number of mutations in input MAFs: 74008
-
After removing 10 mutations outside chr1-24: 73998
-
After removing 1938 blacklisted mutations: 72060
-
After removing 4374 noncoding mutations: 67686
-
After collapsing adjacent/redundant mutations: 57601
-
Number of mutations before filtering: 57601
-
After removing 872 mutations outside gene set: 56729
-
After removing 343 mutations outside category set: 56386
Table 1. Get Full Table Table representing breakdown of mutations by type.
| type | count |
|---|---|
| Frame_Shift_Del | 1115 |
| Frame_Shift_Ins | 519 |
| In_Frame_Del | 299 |
| In_Frame_Ins | 42 |
| Missense_Mutation | 36355 |
| Nonsense_Mutation | 2876 |
| Nonstop_Mutation | 53 |
| Silent | 14127 |
| Splice_Site | 910 |
| Translation_Start_Site | 90 |
| Total | 56386 |
Table 2. Get Full Table A breakdown of mutation rates per category discovered for this individual set.
| category | n | N | rate | rate_per_mb | relative_rate | exp_ns_s_ratio |
|---|---|---|---|---|---|---|
| *CpG->T | 5984 | 498919062 | 0.000012 | 12 | 2.6 | 2.1 |
| *Cp(A/C/T)->T | 9123 | 4084447193 | 2.2e-06 | 2.2 | 0.48 | 1.7 |
| C->(G/A) | 14174 | 4583366255 | 3.1e-06 | 3.1 | 0.66 | 4.8 |
| A->mut | 7046 | 4404728973 | 1.6e-06 | 1.6 | 0.34 | 3.9 |
| indel+null | 5880 | 8988095228 | 6.5e-07 | 0.65 | 0.14 | NaN |
| double_null | 52 | 8988095228 | 5.8e-09 | 0.0058 | 0.0012 | NaN |
| Total | 42259 | 8988095228 | 4.7e-06 | 4.7 | 1 | 3.5 |
The x axis represents the samples. The y axis represents the exons, one row per exon, and they are sorted by average coverage across samples. For exons with exactly the same average coverage, they are sorted next by the %GC of the exon. (The secondary sort is especially useful for the zero-coverage exons at the bottom).
Figure 1.
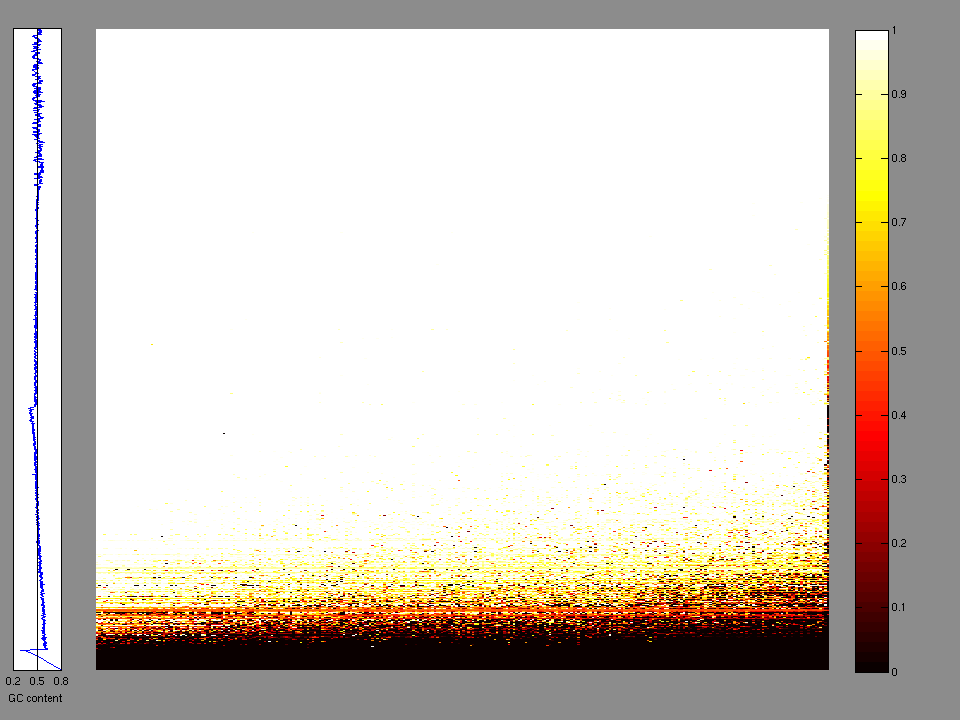
Figure 2. Patients counts and rates file used to generate this plot: HNSC-TP.patients.counts_and_rates.txt
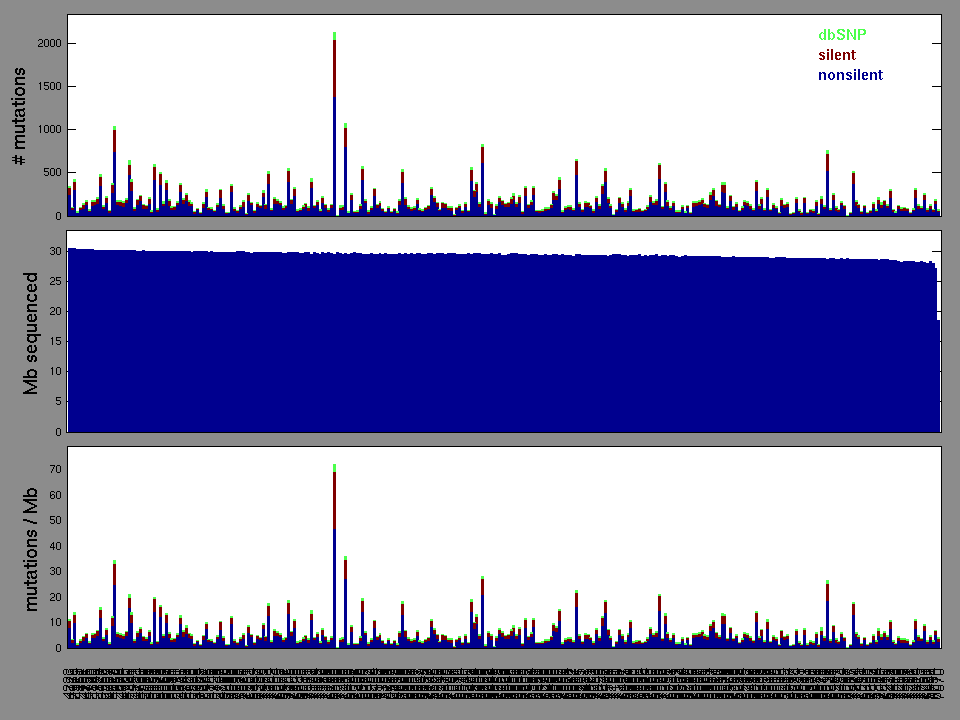
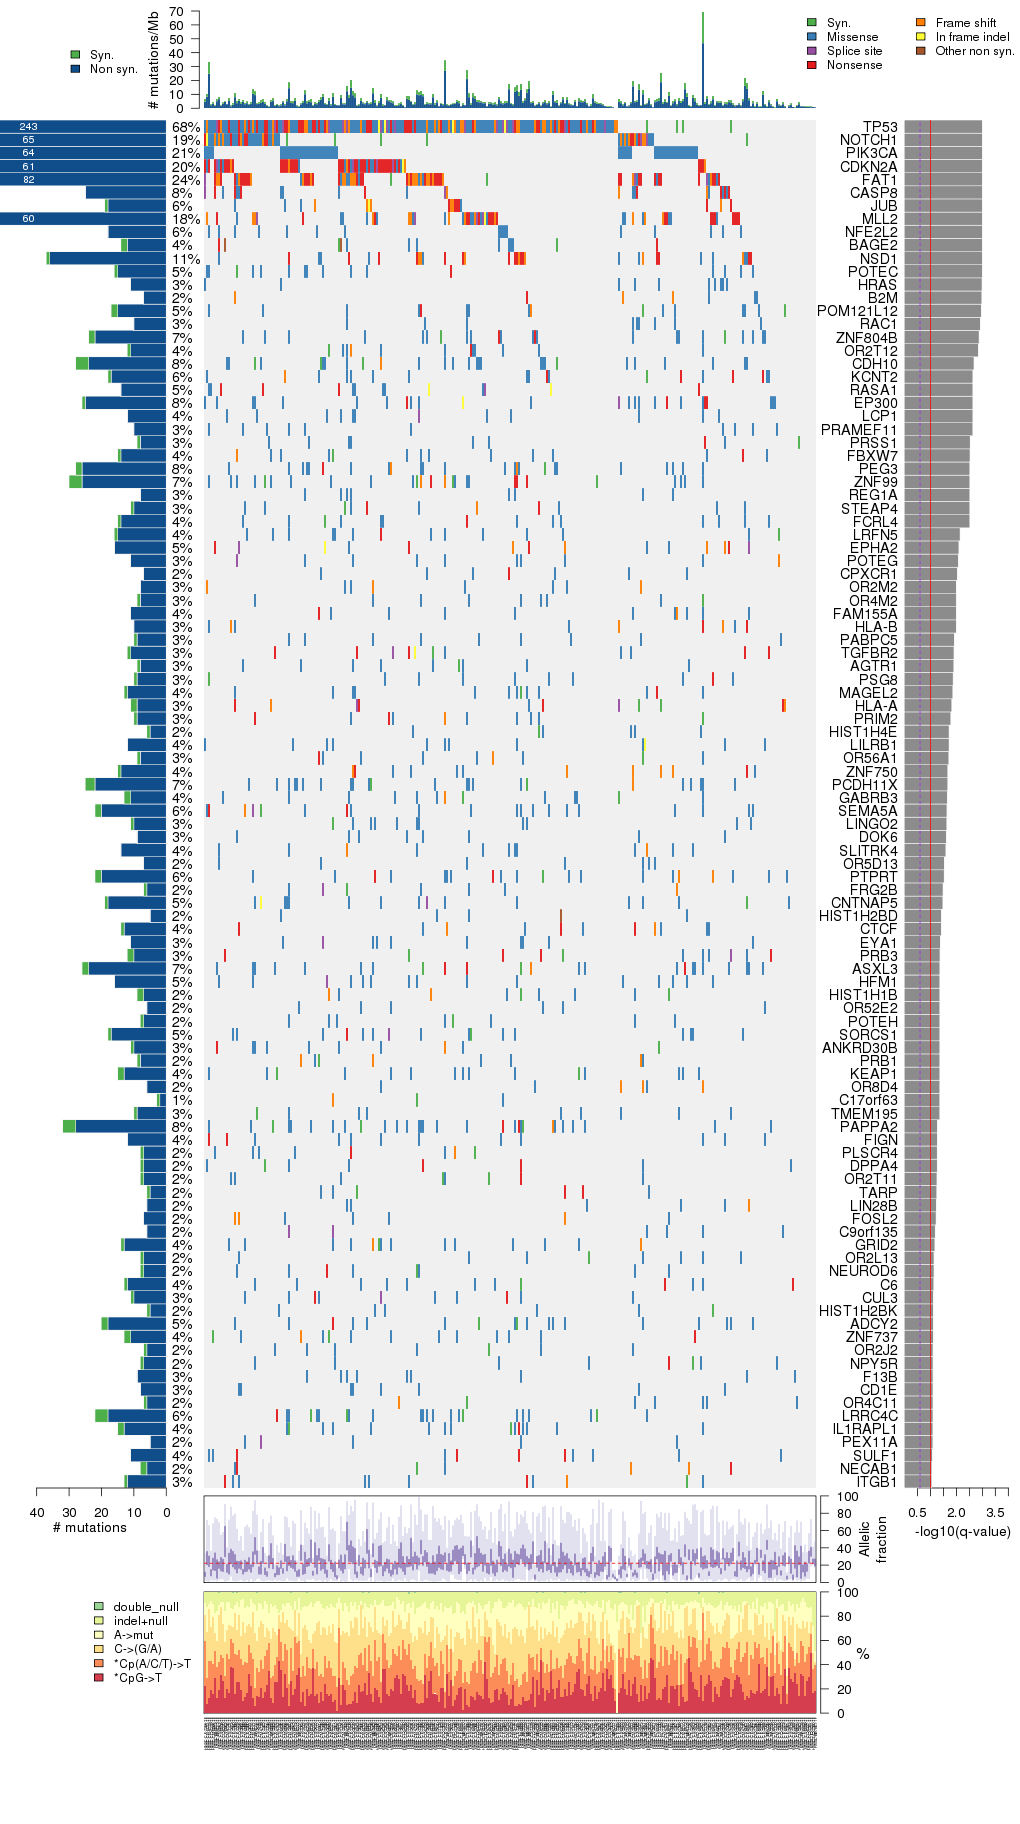
Figure 3. Get High-res Image The matrix in the center of the figure represents individual mutations in patient samples, color-coded by type of mutation, for the significantly mutated genes. The rate of synonymous and non-synonymous mutations is displayed at the top of the matrix. The barplot on the left of the matrix shows the number of mutations in each gene. The percentages represent the fraction of tumors with at least one mutation in the specified gene. The barplot to the right of the matrix displays the q-values for the most significantly mutated genes. The purple boxplots below the matrix (only displayed if required columns are present in the provided MAF) represent the distributions of allelic fractions observed in each sample. The plot at the bottom represents the base substitution distribution of individual samples, using the same categories that were used to calculate significance.
Column Descriptions:
-
N = number of sequenced bases in this gene across the individual set
-
n = number of (nonsilent) mutations in this gene across the individual set
-
npat = number of patients (individuals) with at least one nonsilent mutation
-
nsite = number of unique sites having a non-silent mutation
-
nsil = number of silent mutations in this gene across the individual set
-
n1 = number of nonsilent mutations of type: *CpG->T
-
n2 = number of nonsilent mutations of type: *Cp(A/C/T)->T
-
n3 = number of nonsilent mutations of type: C->(G/A)
-
n4 = number of nonsilent mutations of type: A->mut
-
n5 = number of nonsilent mutations of type: indel+null
-
n6 = number of nonsilent mutations of type: double_null
-
p_classic = p-value for the observed amount of nonsilent mutations being elevated in this gene
-
p_ns_s = p-value for the observed nonsilent/silent ratio being elevated in this gene
-
p_cons = p-value for enrichment of mutations at evolutionarily most-conserved sites in gene
-
p_joint = p-value for clustering + conservation
-
p = p-value (overall)
-
q = q-value, False Discovery Rate (Benjamini-Hochberg procedure)
Table 3. Get Full Table A Ranked List of Significantly Mutated Genes. Number of significant genes found: 104. Number of genes displayed: 35. Click on a gene name to display its stick figure depicting the distribution of mutations and mutation types across the chosen gene (this feature may not be available for all significant genes).
| rank | gene | description | N | n | npat | nsite | nsil | n1 | n2 | n3 | n4 | n5 | n6 | p_classic | p_ns_s | p_cons | p_joint | p | q |
|---|---|---|---|---|---|---|---|---|---|---|---|---|---|---|---|---|---|---|---|
| 1 | TP53 | tumor protein p53 | 375773 | 238 | 207 | 146 | 5 | 41 | 27 | 39 | 40 | 84 | 7 | <1.00e-15 | <1.00e-15 | NaN | NaN | <1.00e-15 | <9.05e-12 |
| 2 | NOTCH1 | Notch homolog 1, translocation-associated (Drosophila) | 1904576 | 61 | 57 | 61 | 4 | 10 | 10 | 9 | 6 | 26 | 0 | <1.00e-15 | 2.83e-06 | NaN | NaN | <1.00e-15 | <9.05e-12 |
| 3 | PIK3CA | phosphoinositide-3-kinase, catalytic, alpha polypeptide | 1003706 | 64 | 63 | 23 | 0 | 1 | 40 | 6 | 17 | 0 | 0 | 2.89e-15 | 6.29e-09 | NaN | NaN | 2.89e-15 | 1.64e-11 |
| 4 | CDKN2A | cyclin-dependent kinase inhibitor 2A (melanoma, p16, inhibits CDK4) | 255389 | 61 | 61 | 27 | 0 | 2 | 2 | 2 | 6 | 48 | 1 | 3.89e-15 | 5.28e-08 | NaN | NaN | 3.89e-15 | 1.64e-11 |
| 5 | FAT1 | FAT tumor suppressor homolog 1 (Drosophila) | 4166666 | 80 | 72 | 80 | 2 | 1 | 5 | 7 | 6 | 53 | 8 | 5.33e-15 | 2.19e-06 | NaN | NaN | 5.33e-15 | 1.64e-11 |
| 6 | CASP8 | caspase 8, apoptosis-related cysteine peptidase | 533487 | 25 | 25 | 22 | 0 | 1 | 4 | 2 | 5 | 13 | 0 | 5.44e-15 | 0.000959 | NaN | NaN | 5.44e-15 | 1.64e-11 |
| 7 | JUB | jub, ajuba homolog (Xenopus laevis) | 357659 | 18 | 17 | 18 | 1 | 1 | 2 | 0 | 2 | 13 | 0 | 1.53e-14 | 0.0608 | NaN | NaN | 1.53e-14 | 3.96e-11 |
| 8 | MLL2 | myeloid/lymphoid or mixed-lineage leukemia 2 | 4343439 | 57 | 55 | 57 | 3 | 4 | 7 | 7 | 2 | 34 | 3 | 8.49e-14 | 0.000263 | NaN | NaN | 8.49e-14 | 1.92e-10 |
| 9 | NFE2L2 | nuclear factor (erythroid-derived 2)-like 2 | 546479 | 18 | 17 | 13 | 0 | 0 | 4 | 10 | 4 | 0 | 0 | 3.97e-11 | 0.0282 | NaN | NaN | 3.97e-11 | 7.99e-08 |
| 10 | BAGE2 | B melanoma antigen family, member 2 | 105801 | 12 | 11 | 9 | 2 | 0 | 6 | 2 | 2 | 1 | 1 | 3.83e-10 | 0.129 | NaN | NaN | 3.83e-10 | 6.93e-07 |
| 11 | NSD1 | nuclear receptor binding SET domain protein 1 | 2490988 | 36 | 33 | 36 | 1 | 0 | 2 | 8 | 4 | 20 | 2 | 1.08e-09 | 0.0169 | NaN | NaN | 1.08e-09 | 1.69e-06 |
| 12 | POTEC | POTE ankyrin domain family, member C | 471221 | 15 | 15 | 15 | 1 | 2 | 4 | 4 | 4 | 1 | 0 | 1.12e-09 | 0.0681 | NaN | NaN | 1.12e-09 | 1.69e-06 |
| 13 | HRAS | v-Ha-ras Harvey rat sarcoma viral oncogene homolog | 198292 | 11 | 10 | 6 | 0 | 2 | 2 | 6 | 1 | 0 | 0 | 2.33e-08 | 0.0221 | NaN | NaN | 2.33e-08 | 3.24e-05 |
| 14 | B2M | beta-2-microglobulin | 113810 | 7 | 7 | 6 | 0 | 0 | 1 | 1 | 1 | 4 | 0 | 4.50e-08 | 0.355 | NaN | NaN | 4.50e-08 | 5.82e-05 |
| 15 | POM121L12 | POM121 transmembrane nucleoporin-like 12 | 264068 | 15 | 14 | 15 | 2 | 4 | 2 | 4 | 3 | 2 | 0 | 8.25e-08 | 0.104 | NaN | NaN | 8.25e-08 | 9.95e-05 |
| 16 | RAC1 | ras-related C3 botulinum toxin substrate 1 (rho family, small GTP binding protein Rac1) | 189570 | 10 | 9 | 8 | 0 | 2 | 3 | 2 | 3 | 0 | 0 | 1.65e-07 | 0.0351 | NaN | NaN | 1.65e-07 | 0.000187 |
| 17 | ZNF804B | zinc finger protein 804B | 1240408 | 22 | 21 | 22 | 2 | 4 | 5 | 6 | 5 | 2 | 0 | 3.19e-07 | 0.0640 | NaN | NaN | 3.19e-07 | 0.000339 |
| 18 | OR2T12 | olfactory receptor, family 2, subfamily T, member 12 | 294908 | 11 | 11 | 11 | 1 | 2 | 2 | 2 | 3 | 2 | 0 | 4.27e-07 | 0.104 | NaN | NaN | 4.27e-07 | 0.000429 |
| 19 | CDH10 | cadherin 10, type 2 (T2-cadherin) | 736566 | 24 | 23 | 24 | 4 | 0 | 3 | 12 | 8 | 1 | 0 | 1.16e-06 | 0.344 | NaN | NaN | 1.16e-06 | 0.00110 |
| 20 | KCNT2 | potassium channel, subfamily T, member 2 | 1040701 | 17 | 17 | 16 | 1 | 2 | 1 | 6 | 3 | 5 | 0 | 1.54e-06 | 0.142 | NaN | NaN | 1.54e-06 | 0.00134 |
| 21 | RASA1 | RAS p21 protein activator (GTPase activating protein) 1 | 928769 | 14 | 14 | 12 | 0 | 2 | 0 | 3 | 2 | 7 | 0 | 1.67e-06 | 0.0560 | NaN | NaN | 1.67e-06 | 0.00134 |
| 22 | EP300 | E1A binding protein p300 | 2248955 | 25 | 25 | 22 | 1 | 3 | 7 | 4 | 5 | 6 | 0 | 1.69e-06 | 0.00726 | NaN | NaN | 1.69e-06 | 0.00134 |
| 23 | LCP1 | lymphocyte cytosolic protein 1 (L-plastin) | 593980 | 12 | 12 | 12 | 0 | 3 | 1 | 3 | 4 | 1 | 0 | 1.71e-06 | 0.0391 | NaN | NaN | 1.71e-06 | 0.00134 |
| 24 | PRAMEF11 | PRAME family member 11 | 390027 | 10 | 10 | 9 | 0 | 2 | 1 | 5 | 2 | 0 | 0 | 1.84e-06 | 0.0783 | NaN | NaN | 1.84e-06 | 0.00139 |
| 25 | PRSS1 | protease, serine, 1 (trypsin 1) | 233784 | 8 | 8 | 7 | 1 | 0 | 4 | 1 | 2 | 1 | 0 | 2.68e-06 | 0.168 | NaN | NaN | 2.68e-06 | 0.00194 |
| 26 | FBXW7 | F-box and WD repeat domain containing 7 | 757876 | 14 | 13 | 12 | 1 | 2 | 2 | 5 | 3 | 2 | 0 | 2.85e-06 | 0.179 | NaN | NaN | 2.85e-06 | 0.00198 |
| 27 | PEG3 | paternally expressed 3 | 1345043 | 26 | 23 | 26 | 2 | 0 | 6 | 11 | 6 | 3 | 0 | 3.15e-06 | 0.0764 | NaN | NaN | 3.15e-06 | 0.00208 |
| 28 | ZNF99 | zinc finger protein 99 | 949165 | 26 | 22 | 26 | 4 | 0 | 4 | 10 | 6 | 6 | 0 | 3.31e-06 | 0.461 | NaN | NaN | 3.31e-06 | 0.00208 |
| 29 | REG1A | regenerating islet-derived 1 alpha (pancreatic stone protein, pancreatic thread protein) | 159337 | 8 | 8 | 8 | 0 | 0 | 1 | 5 | 2 | 0 | 0 | 3.37e-06 | 0.151 | NaN | NaN | 3.37e-06 | 0.00208 |
| 30 | STEAP4 | STEAP family member 4 | 425992 | 10 | 10 | 10 | 1 | 0 | 4 | 1 | 2 | 3 | 0 | 3.45e-06 | 0.174 | NaN | NaN | 3.45e-06 | 0.00208 |
| 31 | FCRL4 | Fc receptor-like 4 | 485362 | 14 | 13 | 14 | 1 | 1 | 2 | 7 | 3 | 1 | 0 | 3.64e-06 | 0.140 | NaN | NaN | 3.64e-06 | 0.00212 |
| 32 | LRFN5 | leucine rich repeat and fibronectin type III domain containing 5 | 664309 | 15 | 13 | 14 | 1 | 0 | 2 | 8 | 4 | 1 | 0 | 1.10e-05 | 0.134 | NaN | NaN | 1.10e-05 | 0.00620 |
| 33 | EPHA2 | EPH receptor A2 | 868017 | 16 | 14 | 15 | 0 | 3 | 0 | 1 | 1 | 10 | 1 | 1.29e-05 | 0.0203 | NaN | NaN | 1.29e-05 | 0.00705 |
| 34 | POTEG | POTE ankyrin domain family, member G | 366329 | 11 | 10 | 11 | 0 | 1 | 2 | 6 | 0 | 2 | 0 | 1.39e-05 | 0.113 | NaN | NaN | 1.39e-05 | 0.00737 |
| 35 | CPXCR1 | CPX chromosome region, candidate 1 | 219187 | 7 | 7 | 7 | 0 | 0 | 0 | 5 | 1 | 1 | 0 | 1.57e-05 | 0.368 | NaN | NaN | 1.57e-05 | 0.00813 |
Figure S1. This figure depicts the distribution of mutations and mutation types across the TP53 significant gene.
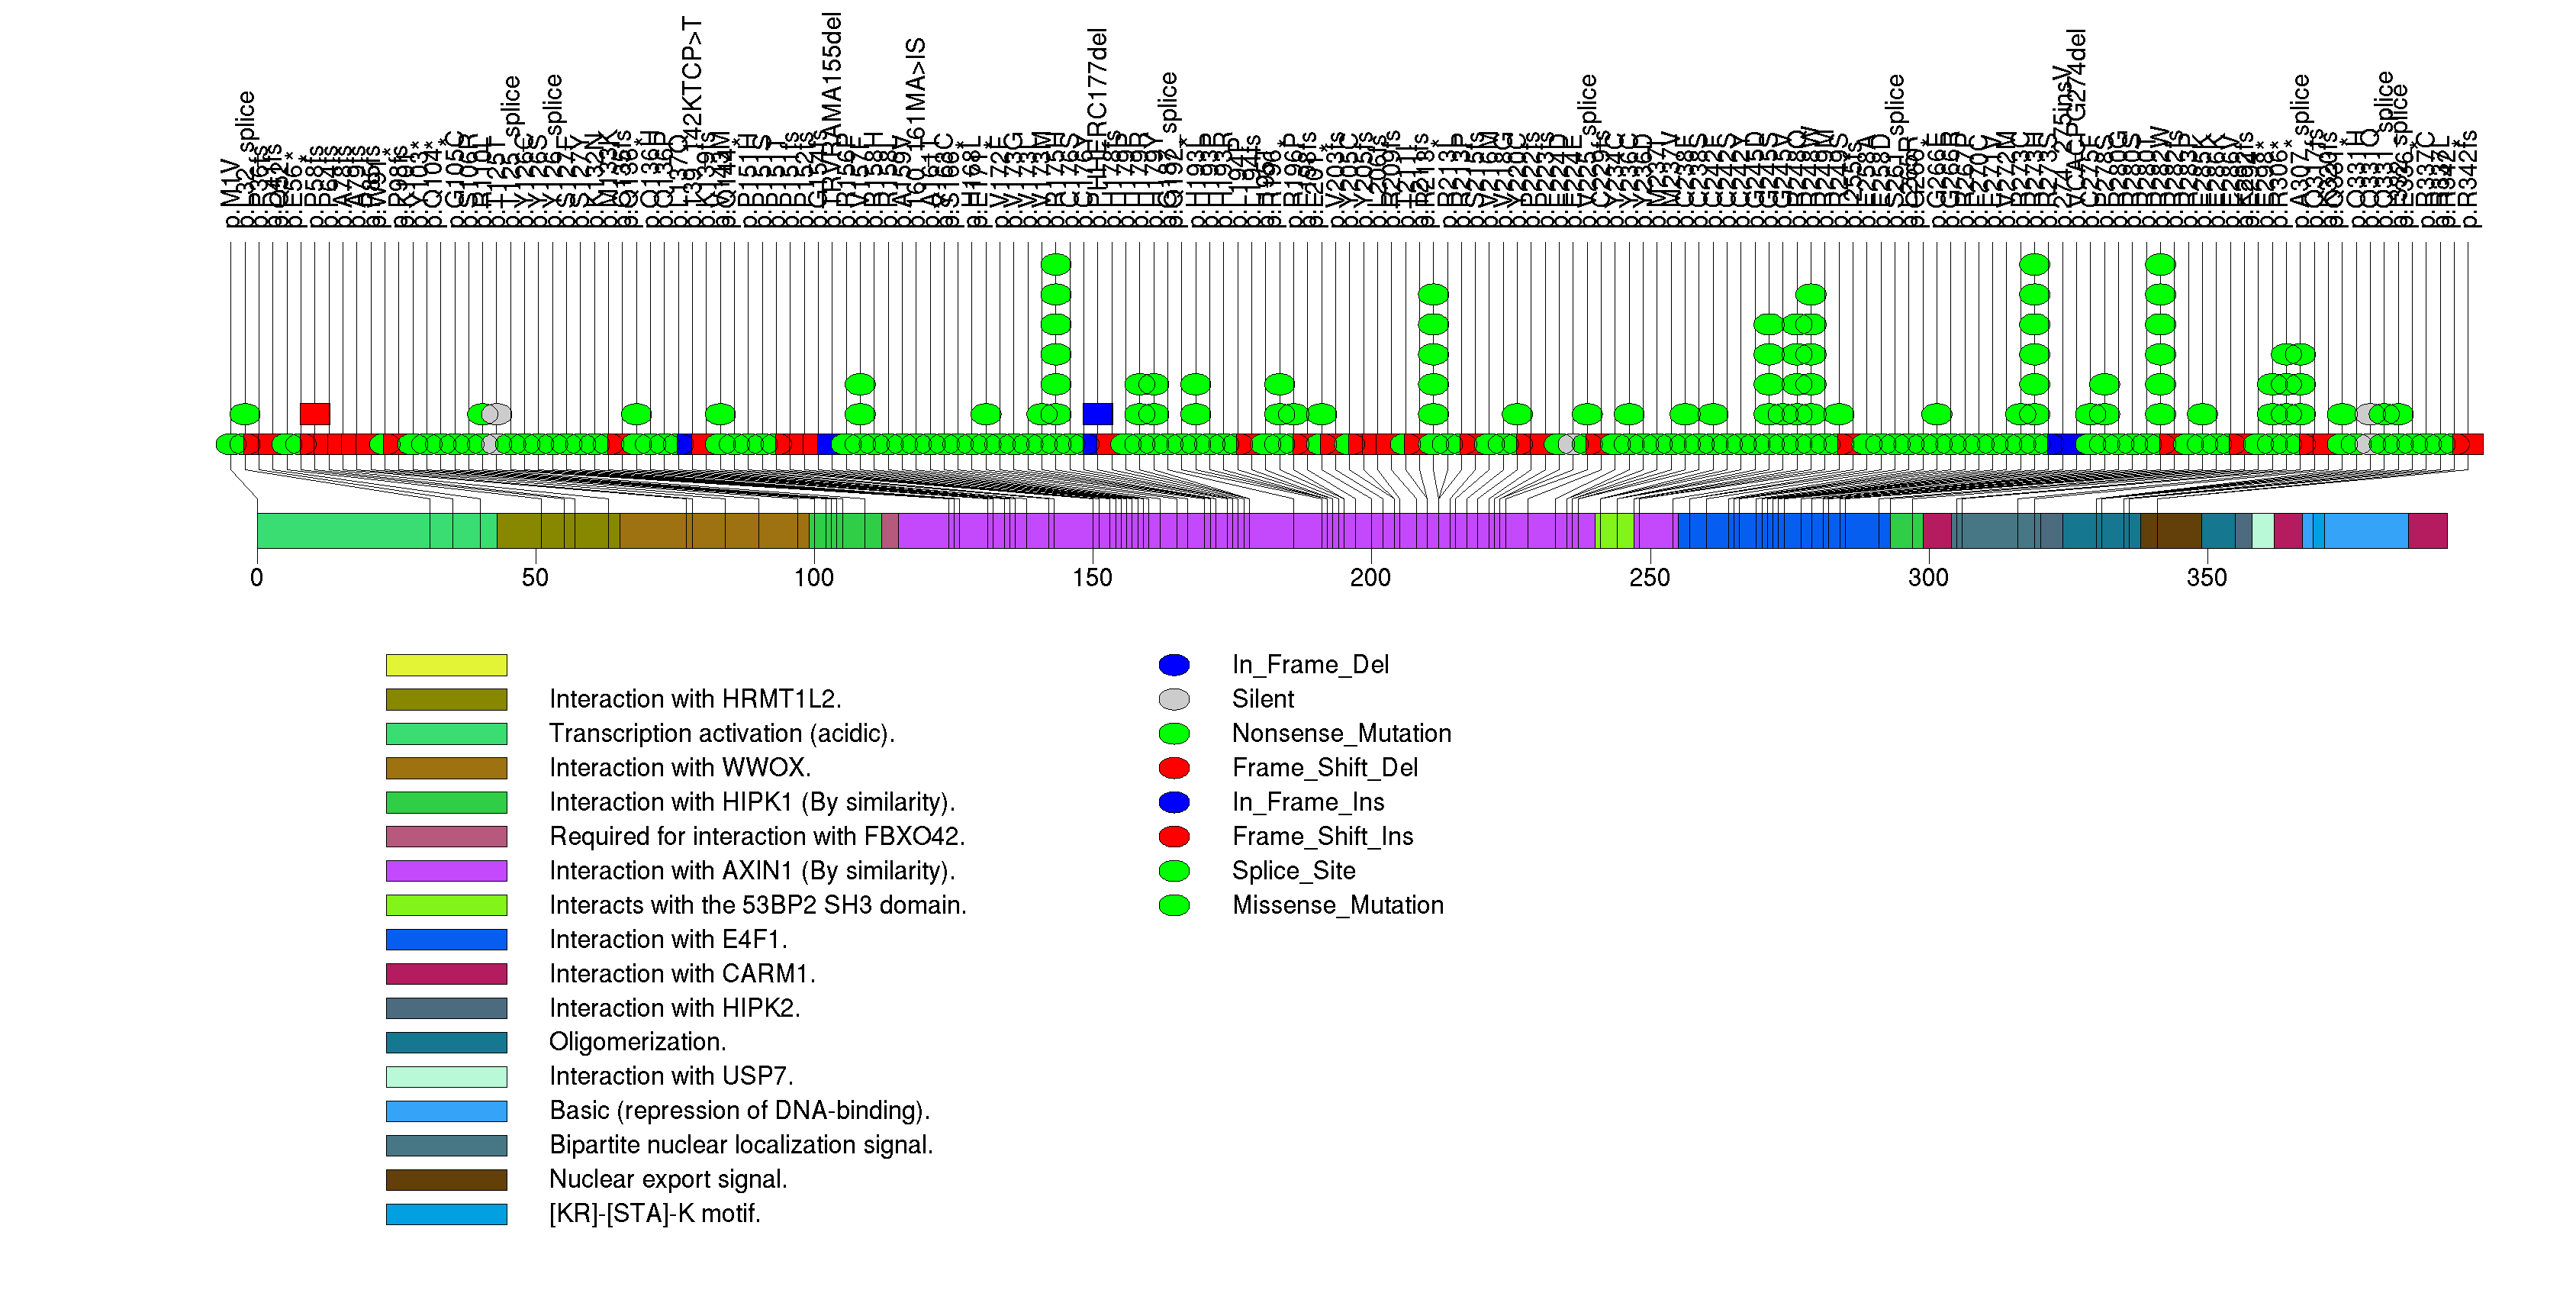
Figure S2. This figure depicts the distribution of mutations and mutation types across the NOTCH1 significant gene.
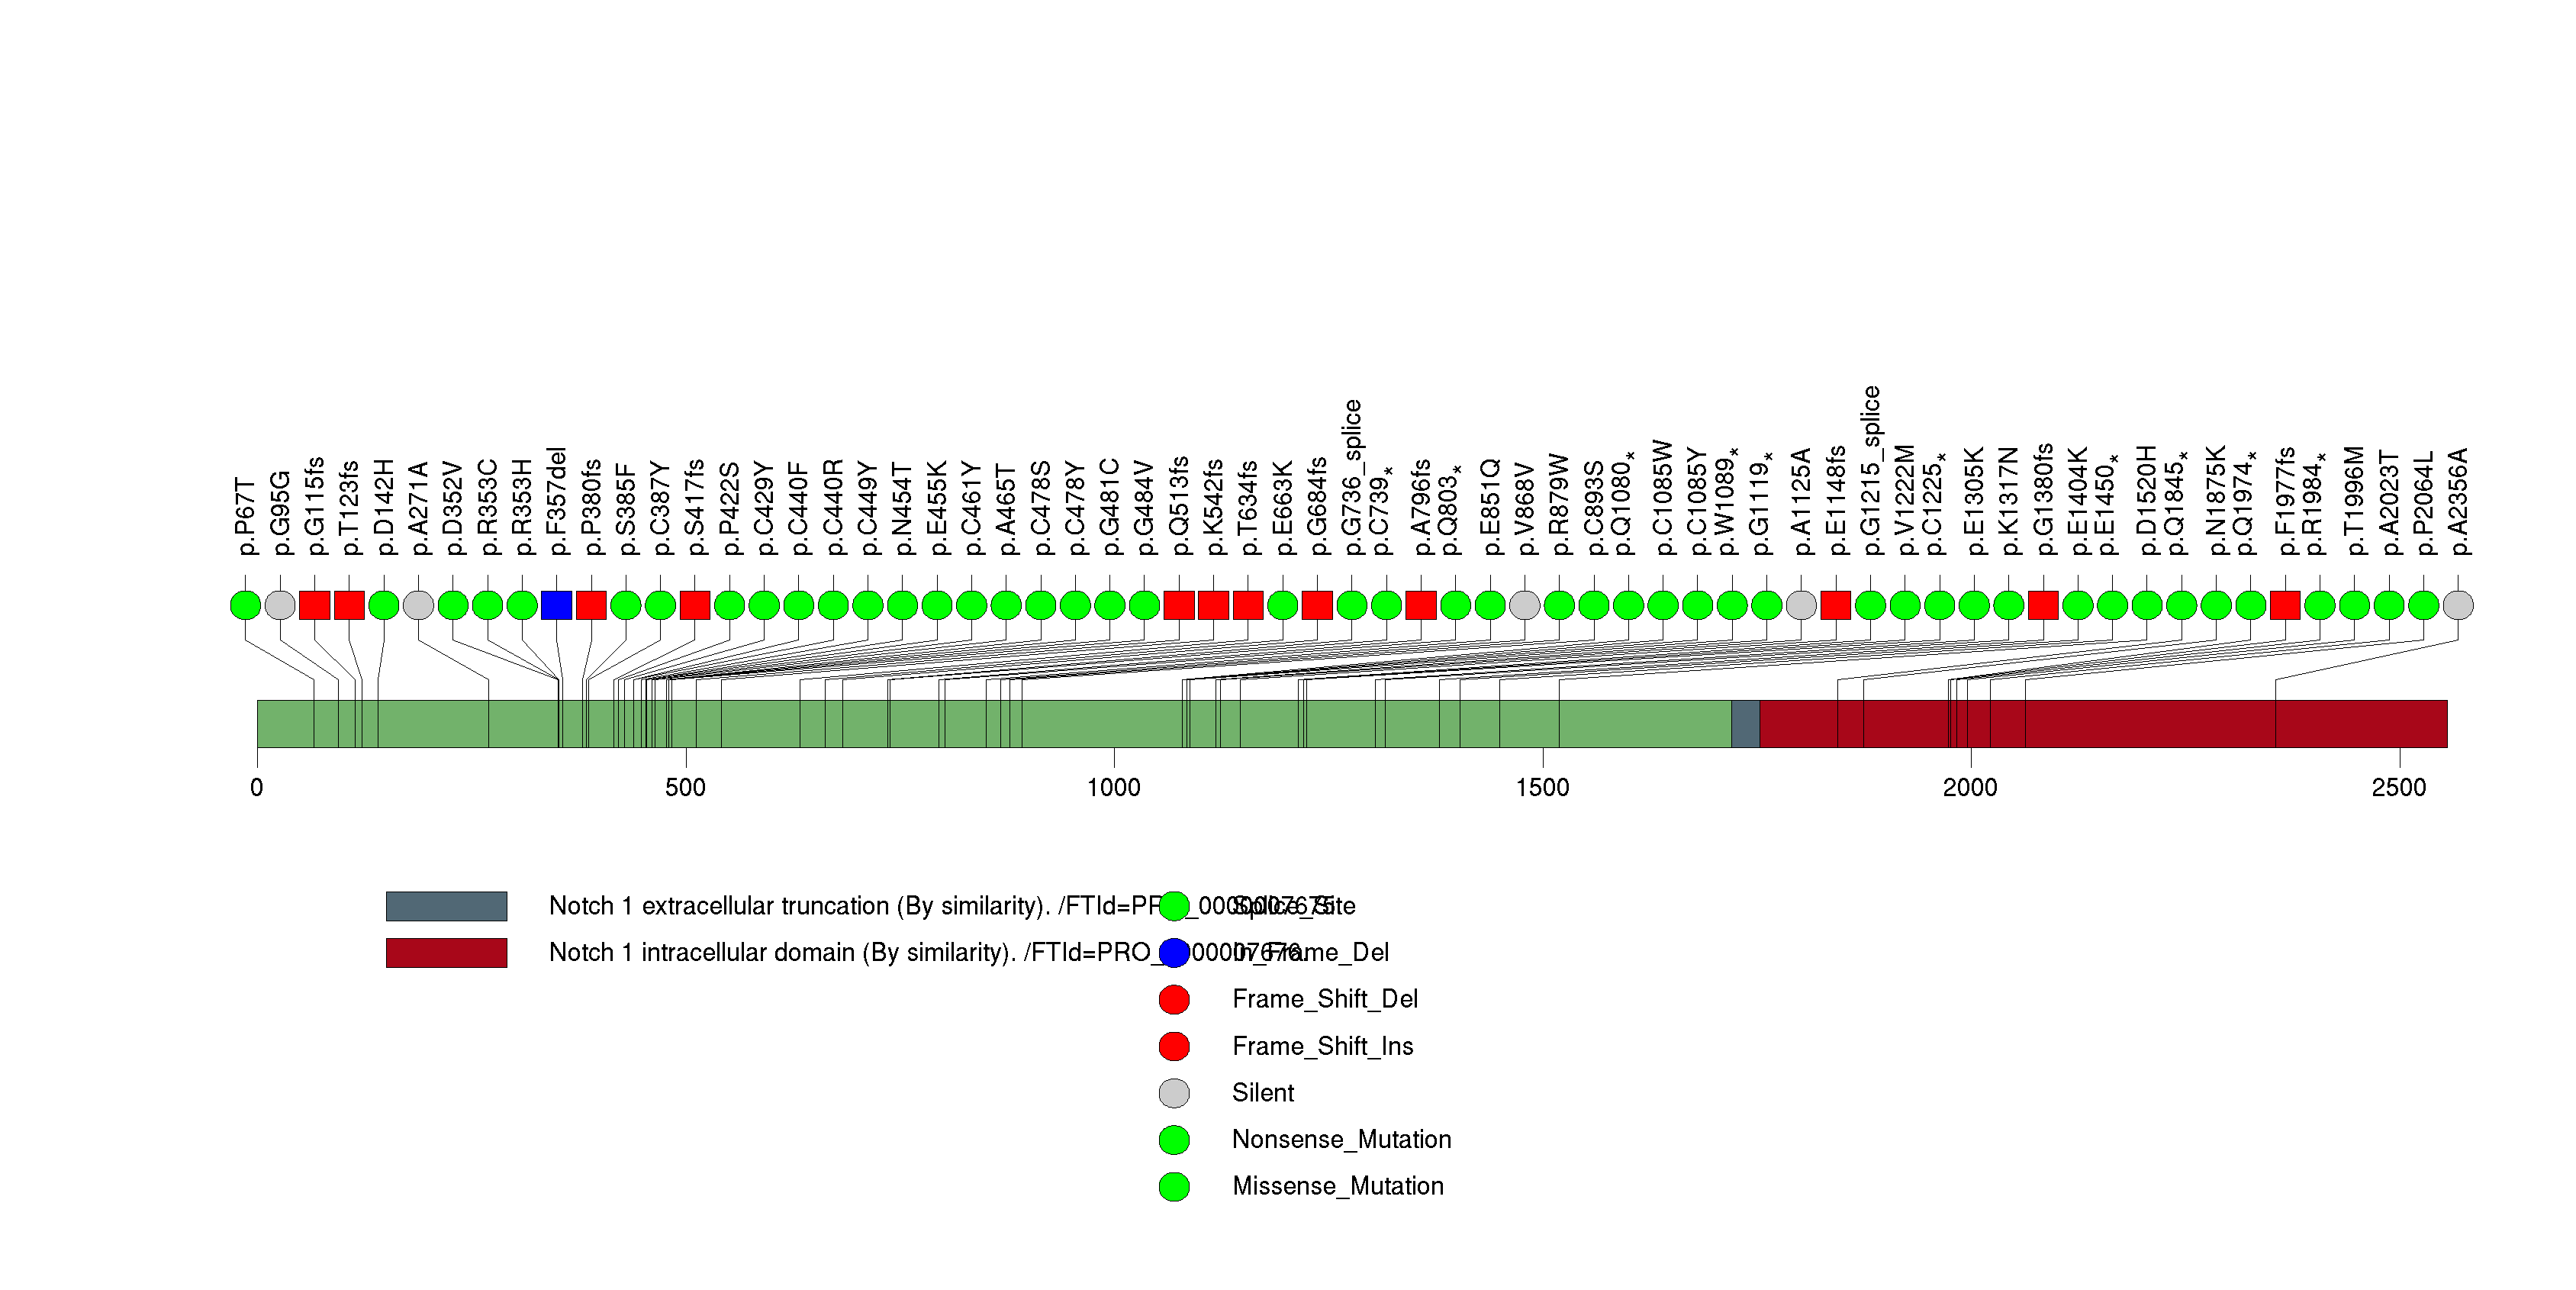
Figure S3. This figure depicts the distribution of mutations and mutation types across the PIK3CA significant gene.
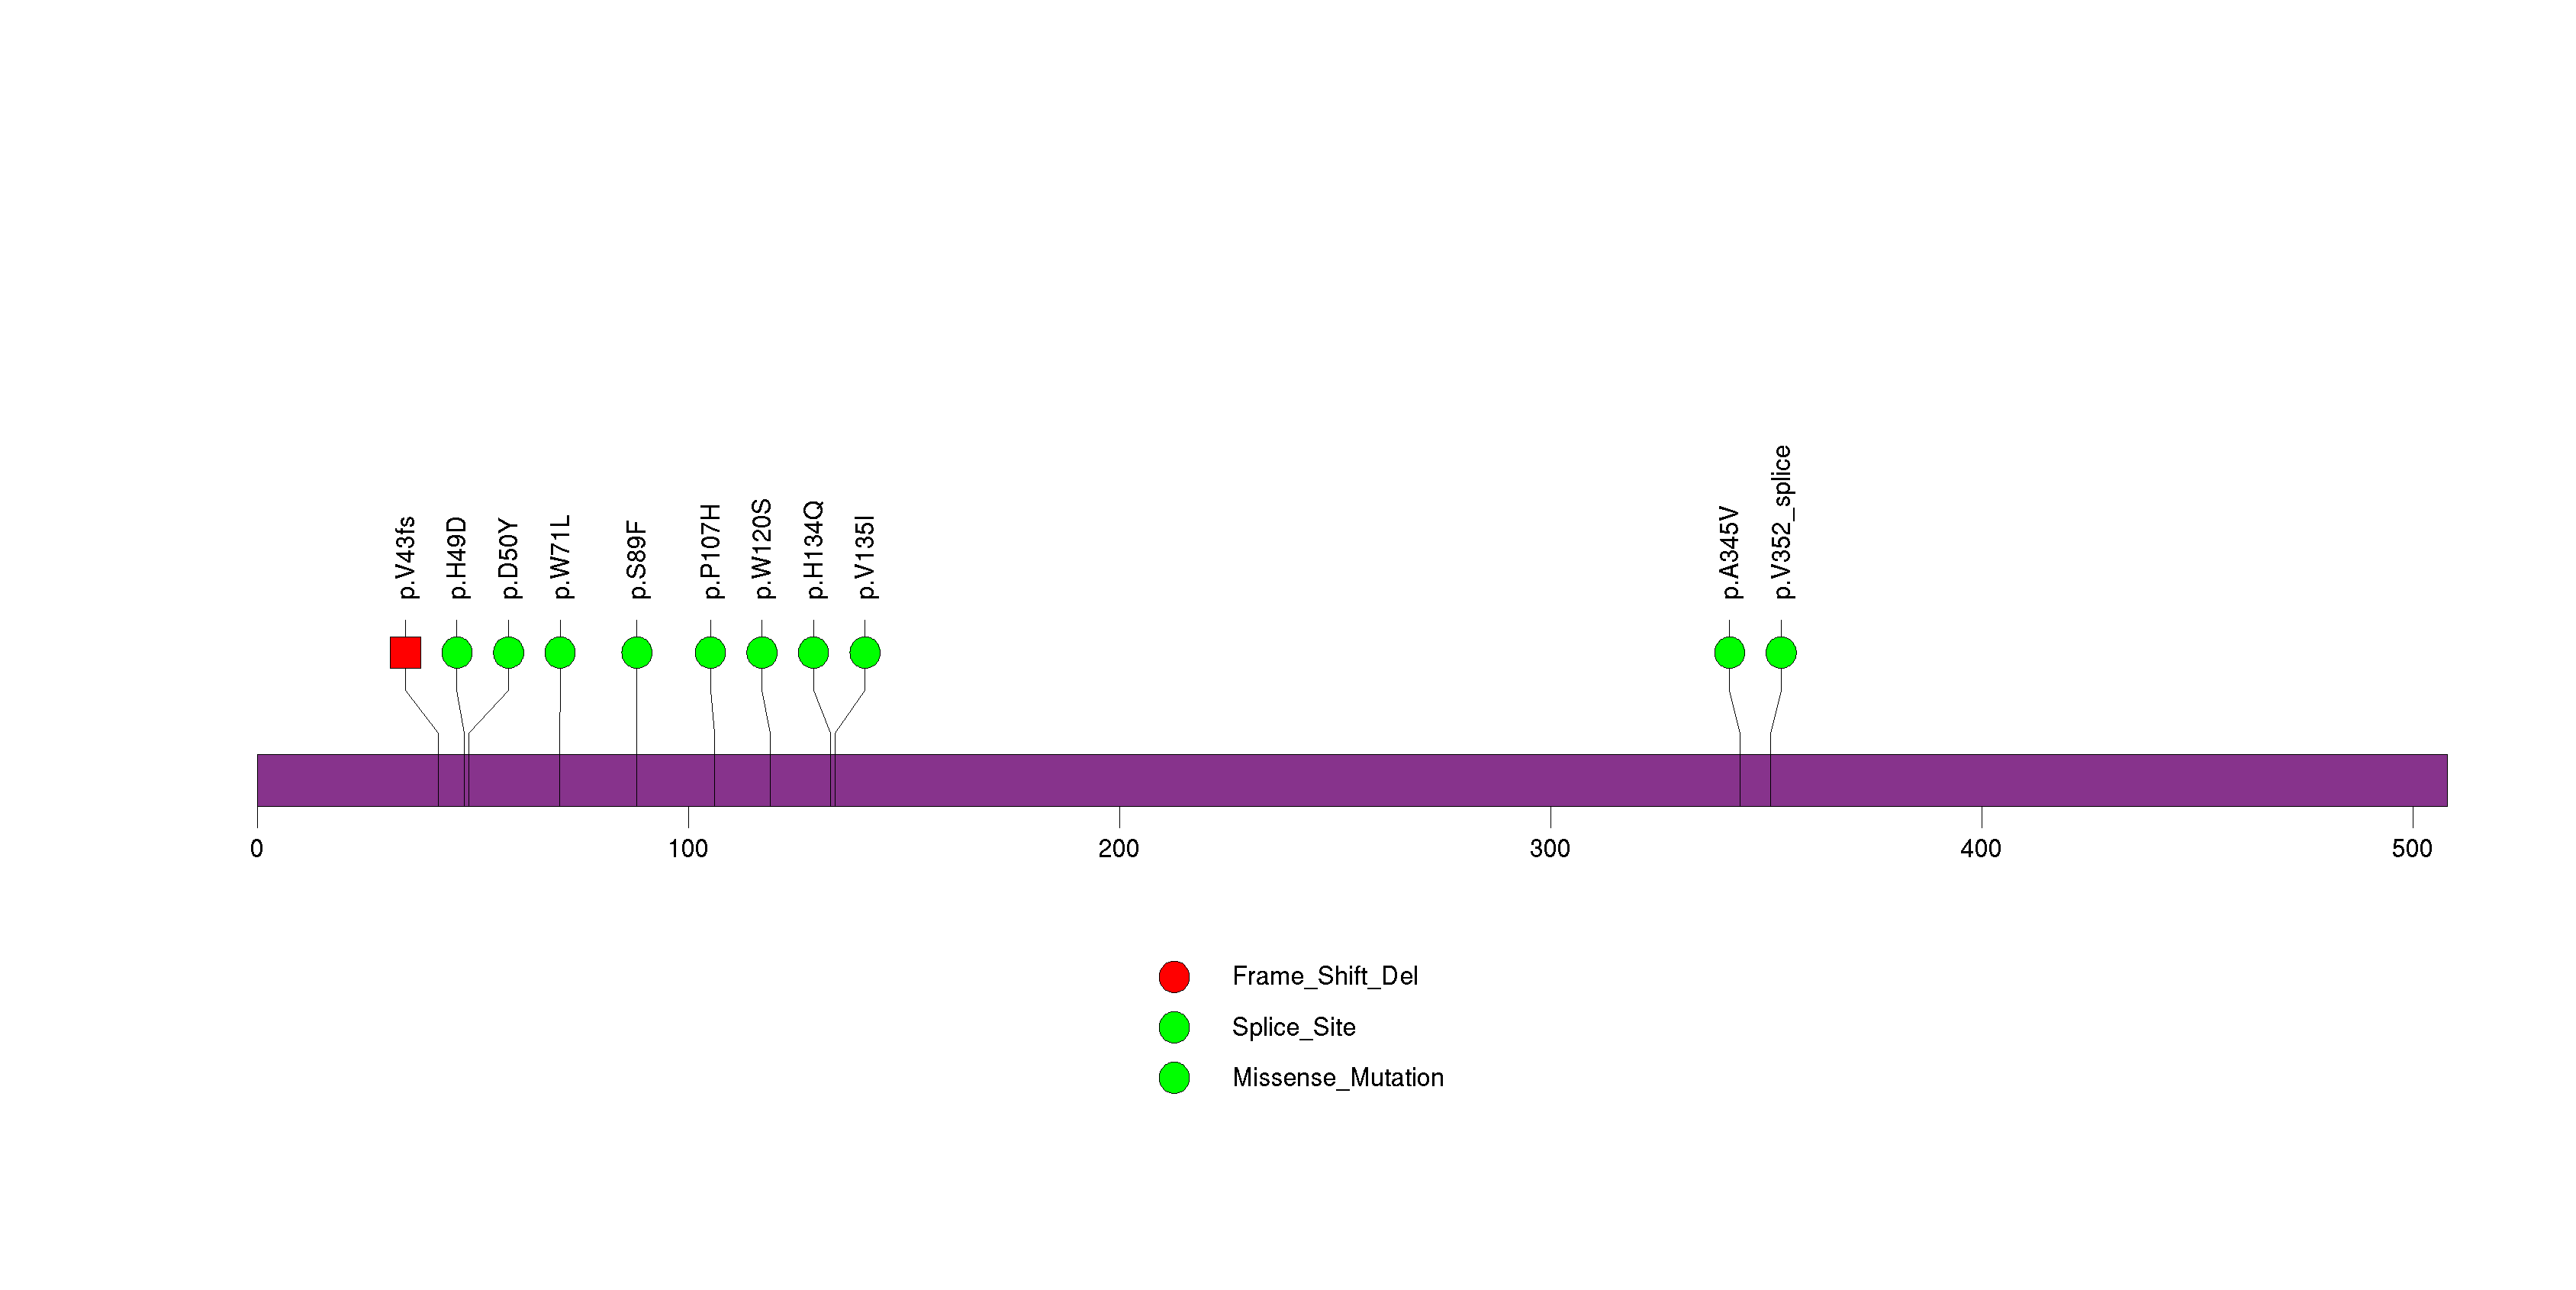
Figure S4. This figure depicts the distribution of mutations and mutation types across the CDKN2A significant gene.
Figure S5. This figure depicts the distribution of mutations and mutation types across the FAT1 significant gene.
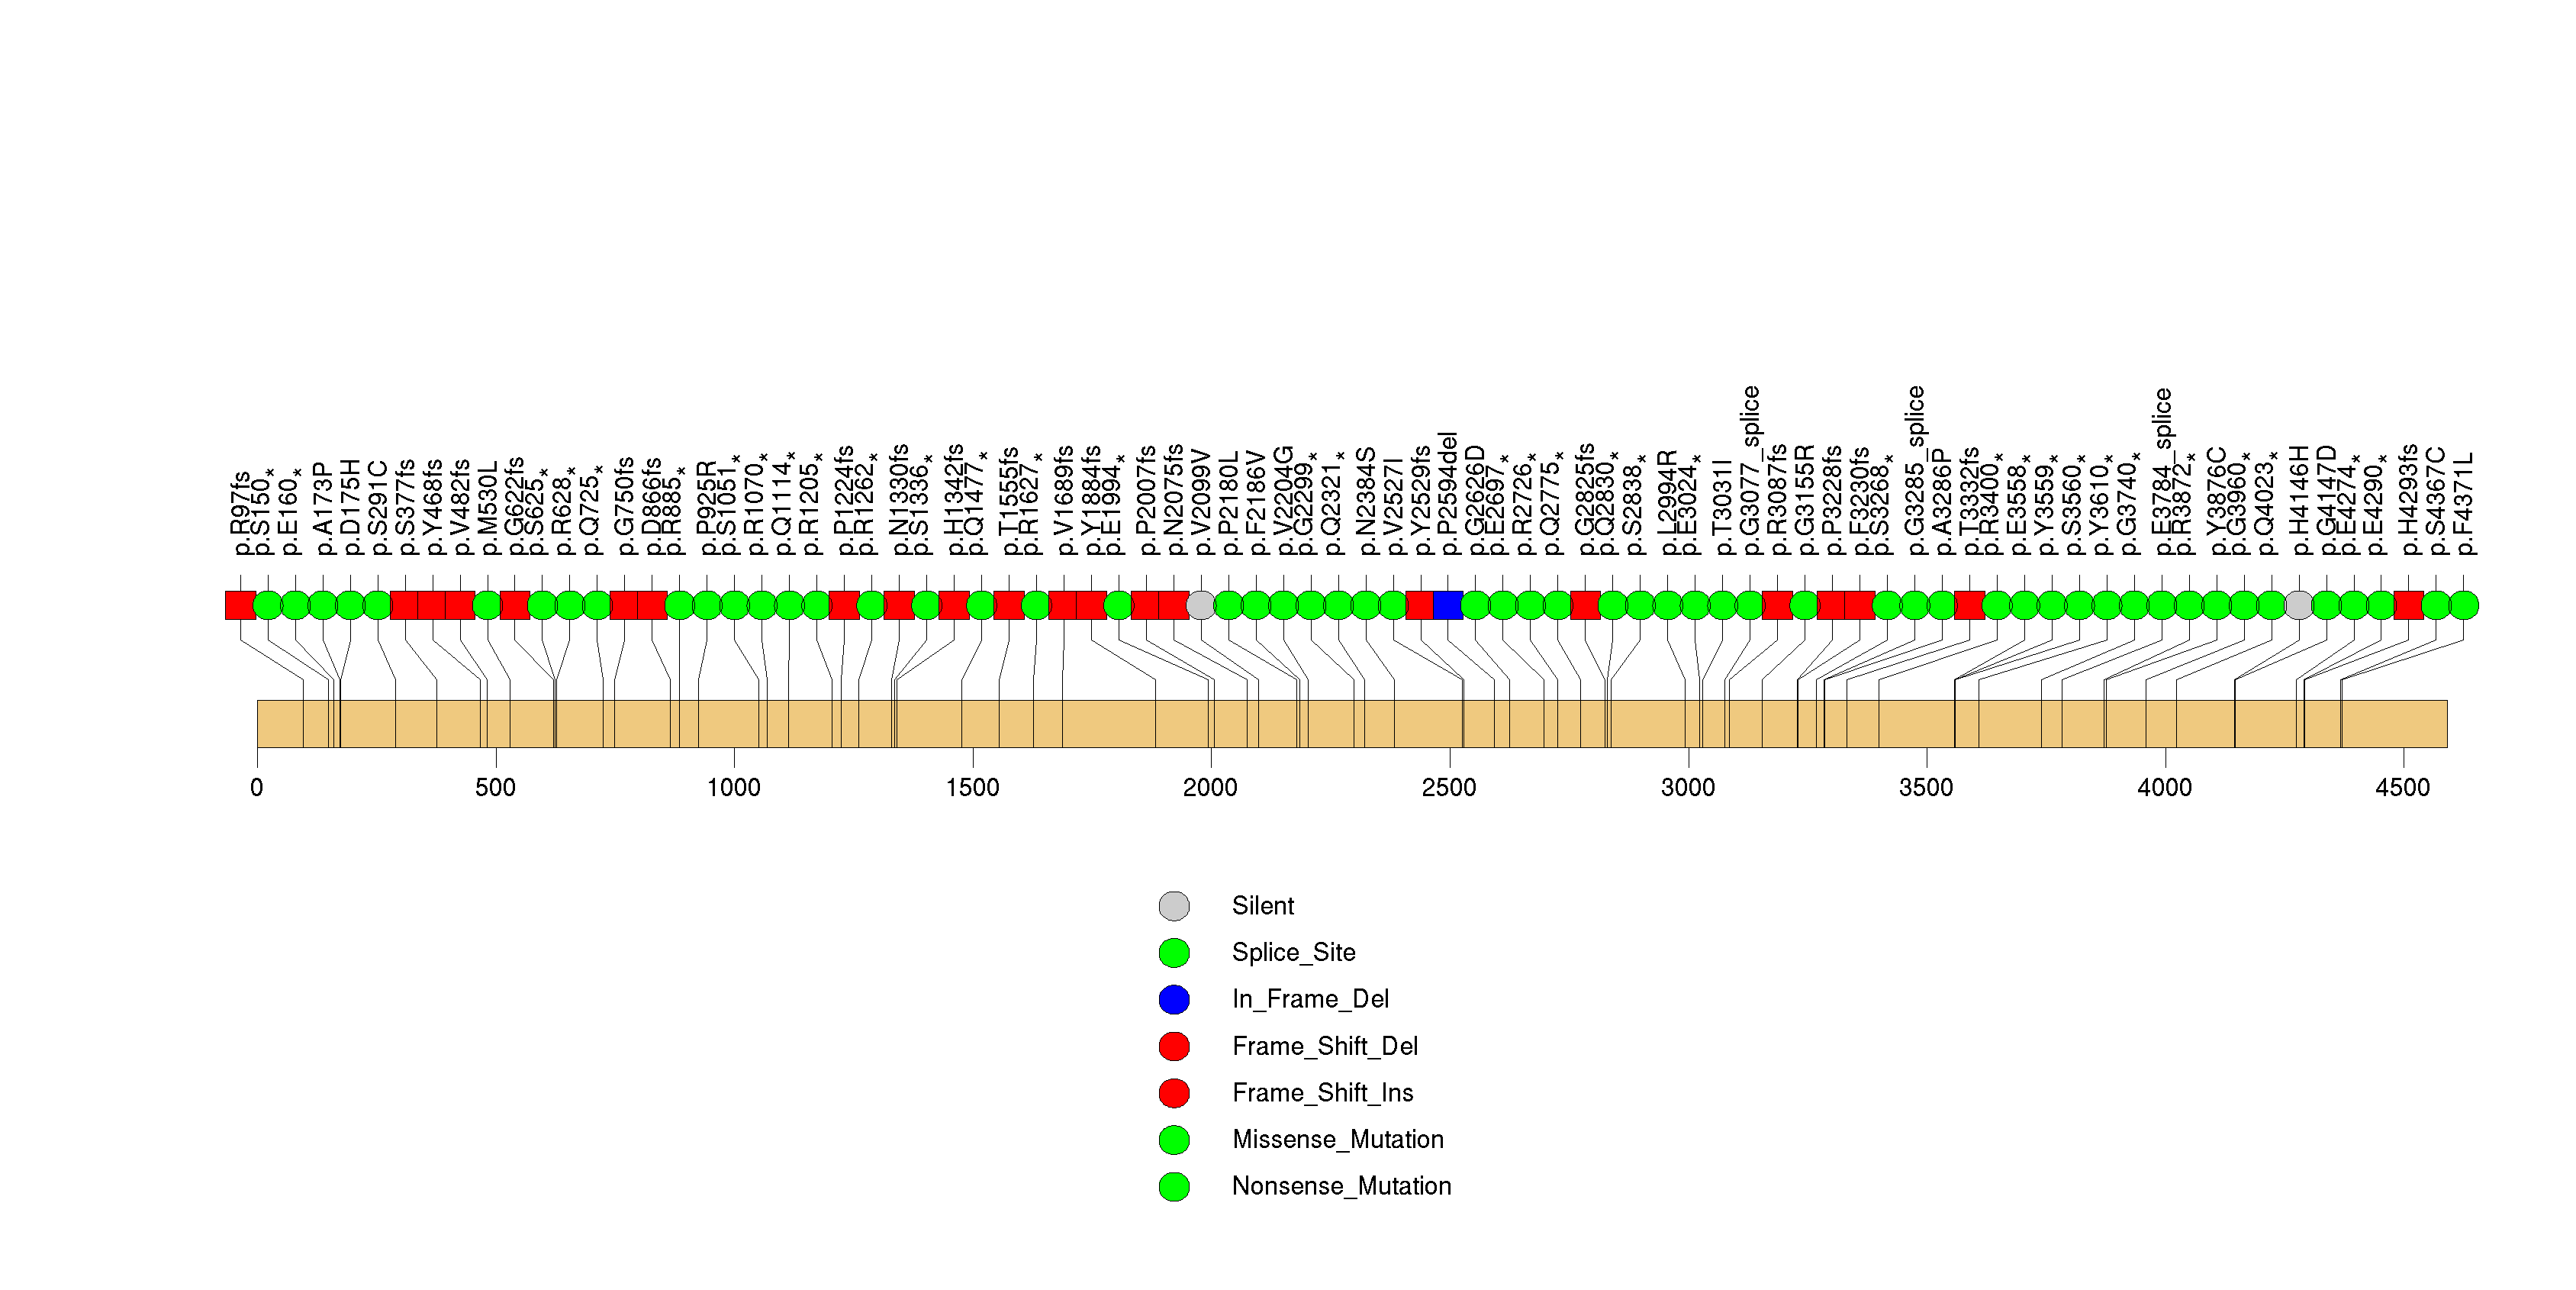
Figure S6. This figure depicts the distribution of mutations and mutation types across the JUB significant gene.
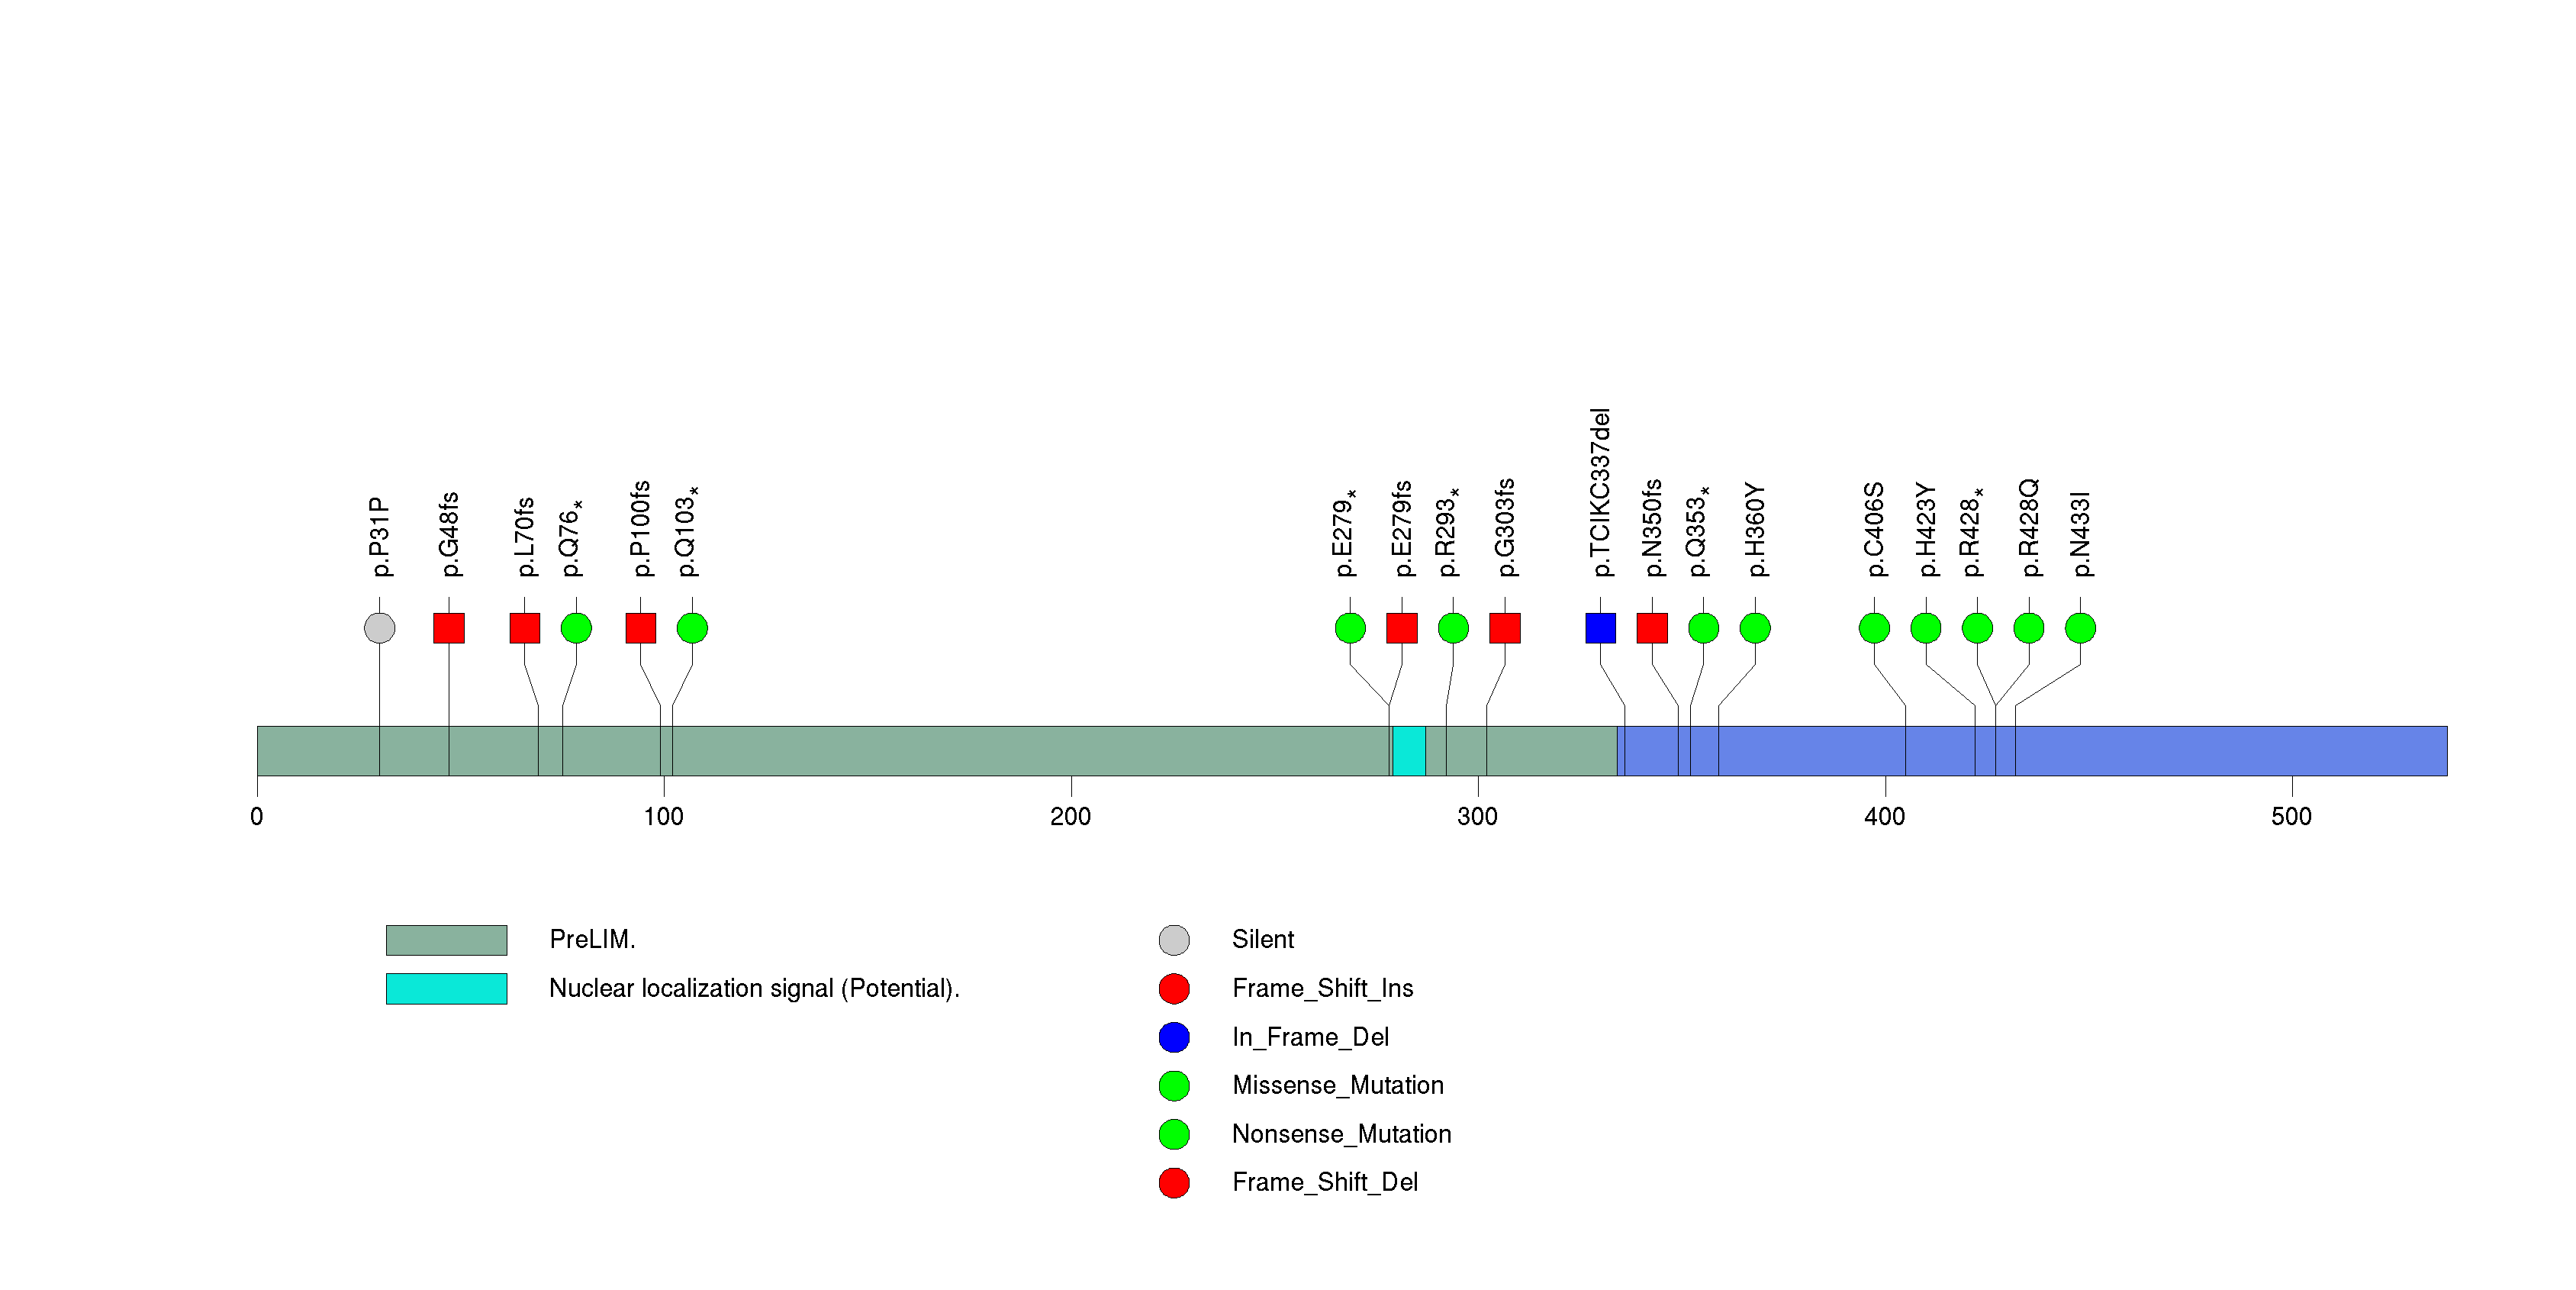
Figure S7. This figure depicts the distribution of mutations and mutation types across the MLL2 significant gene.
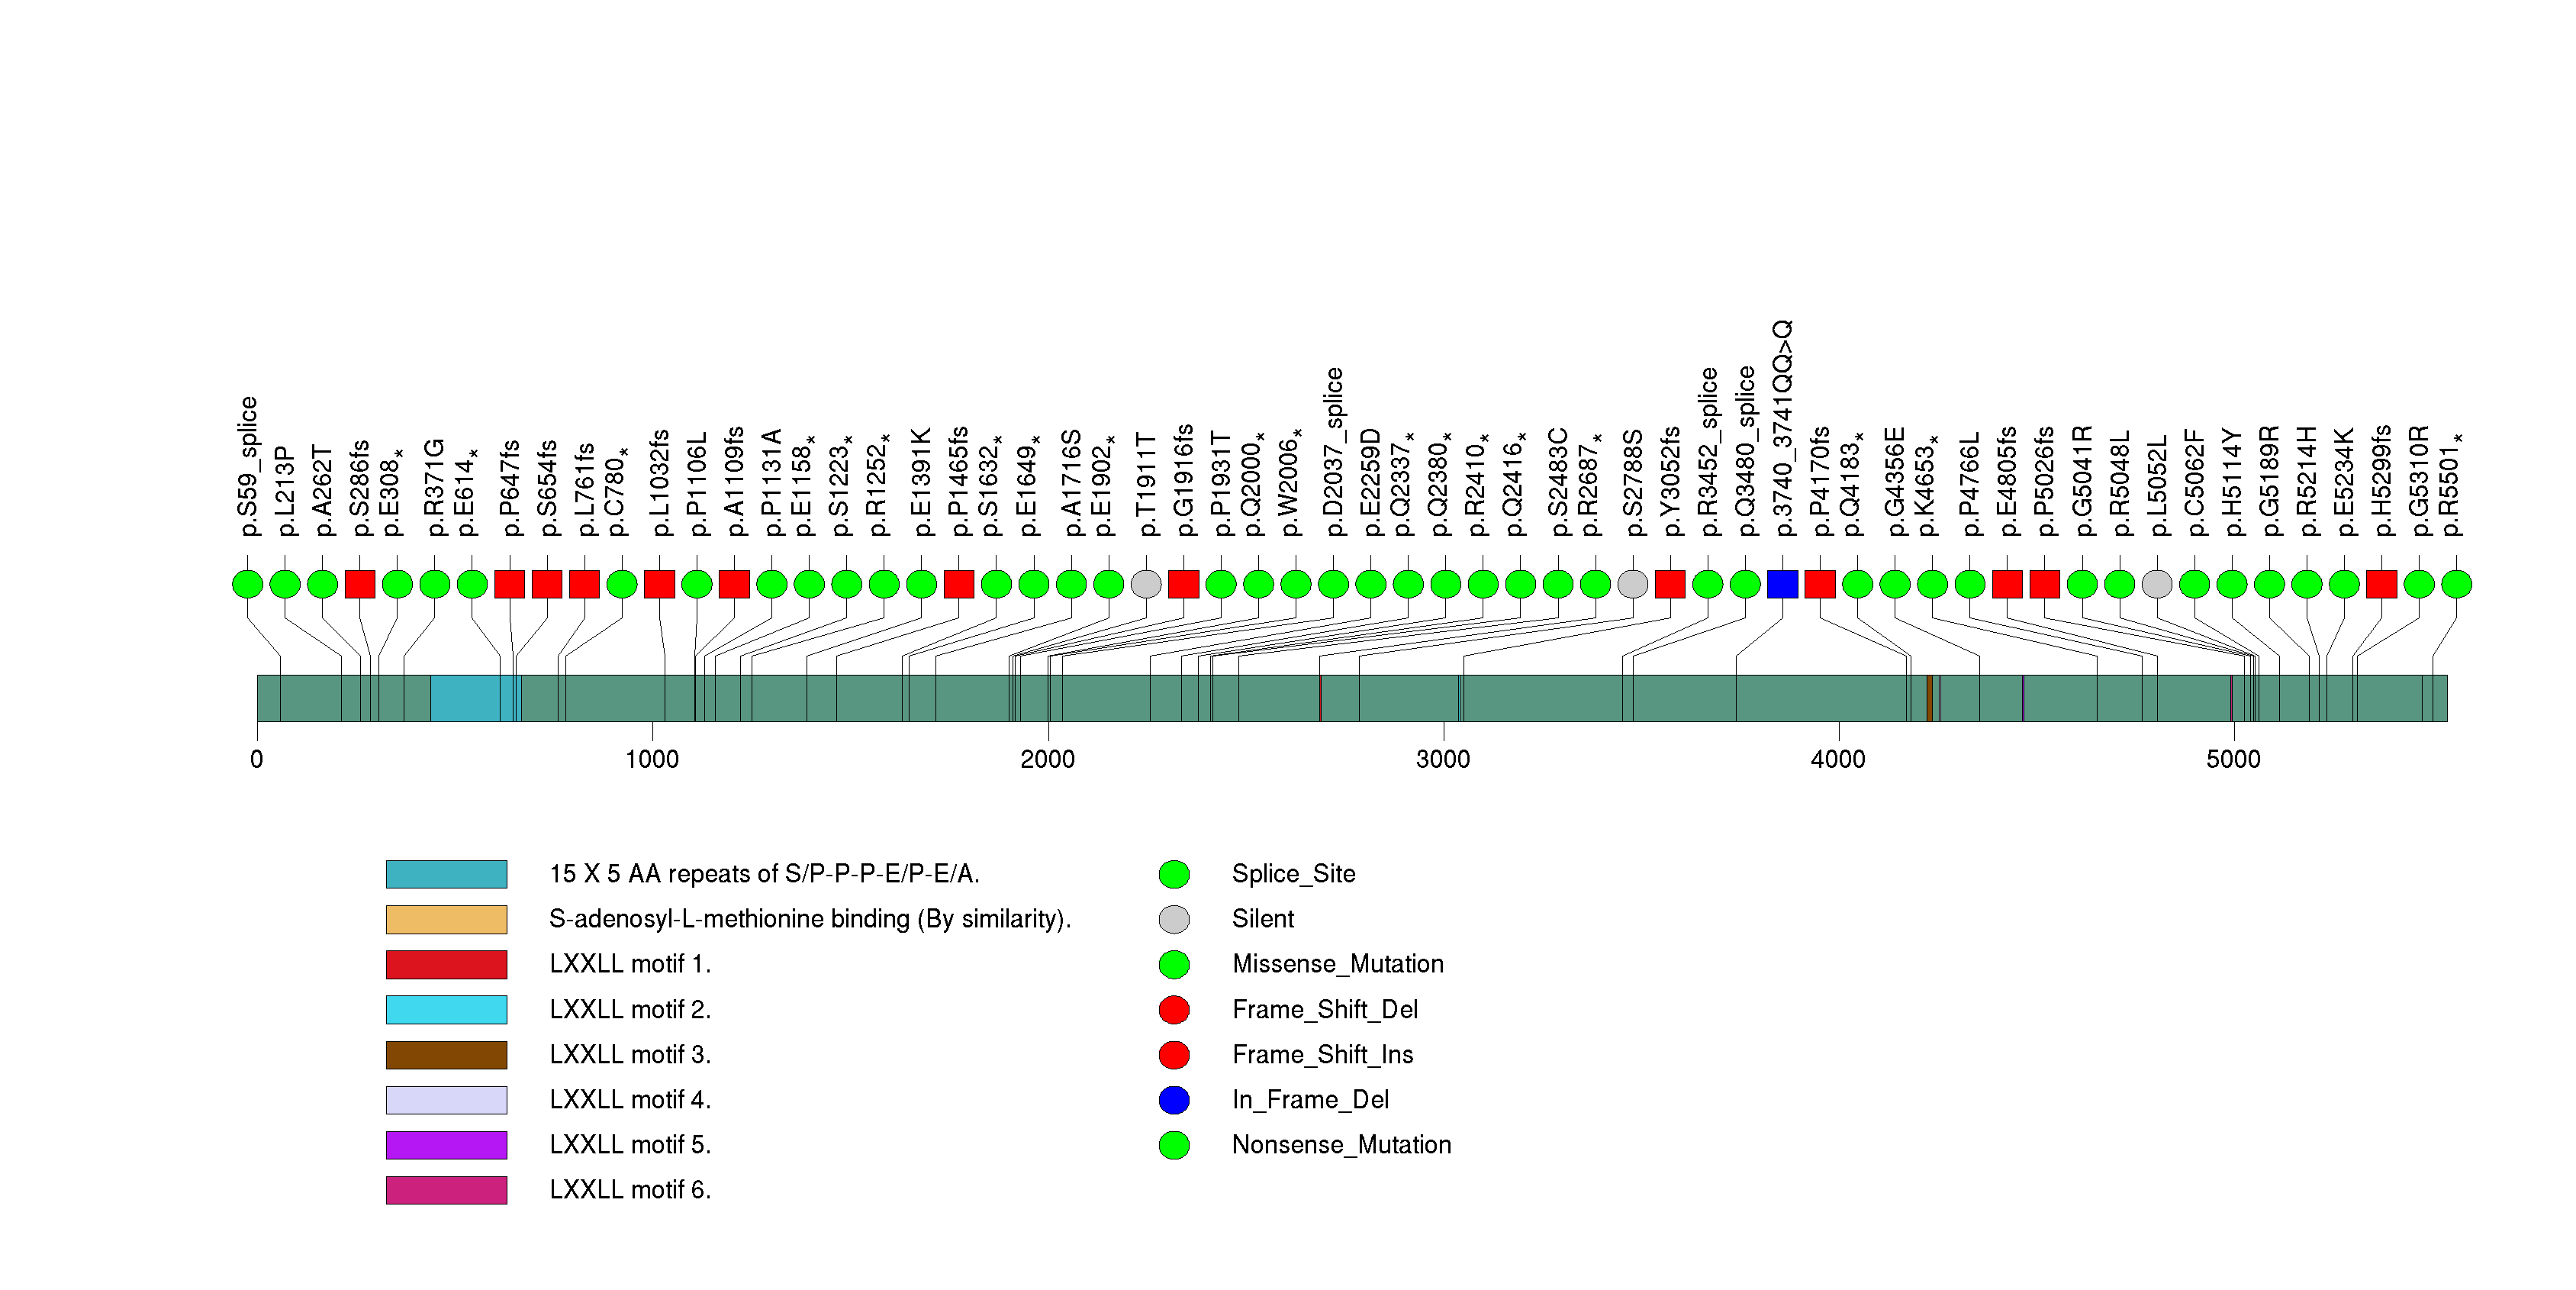
Figure S8. This figure depicts the distribution of mutations and mutation types across the NFE2L2 significant gene.
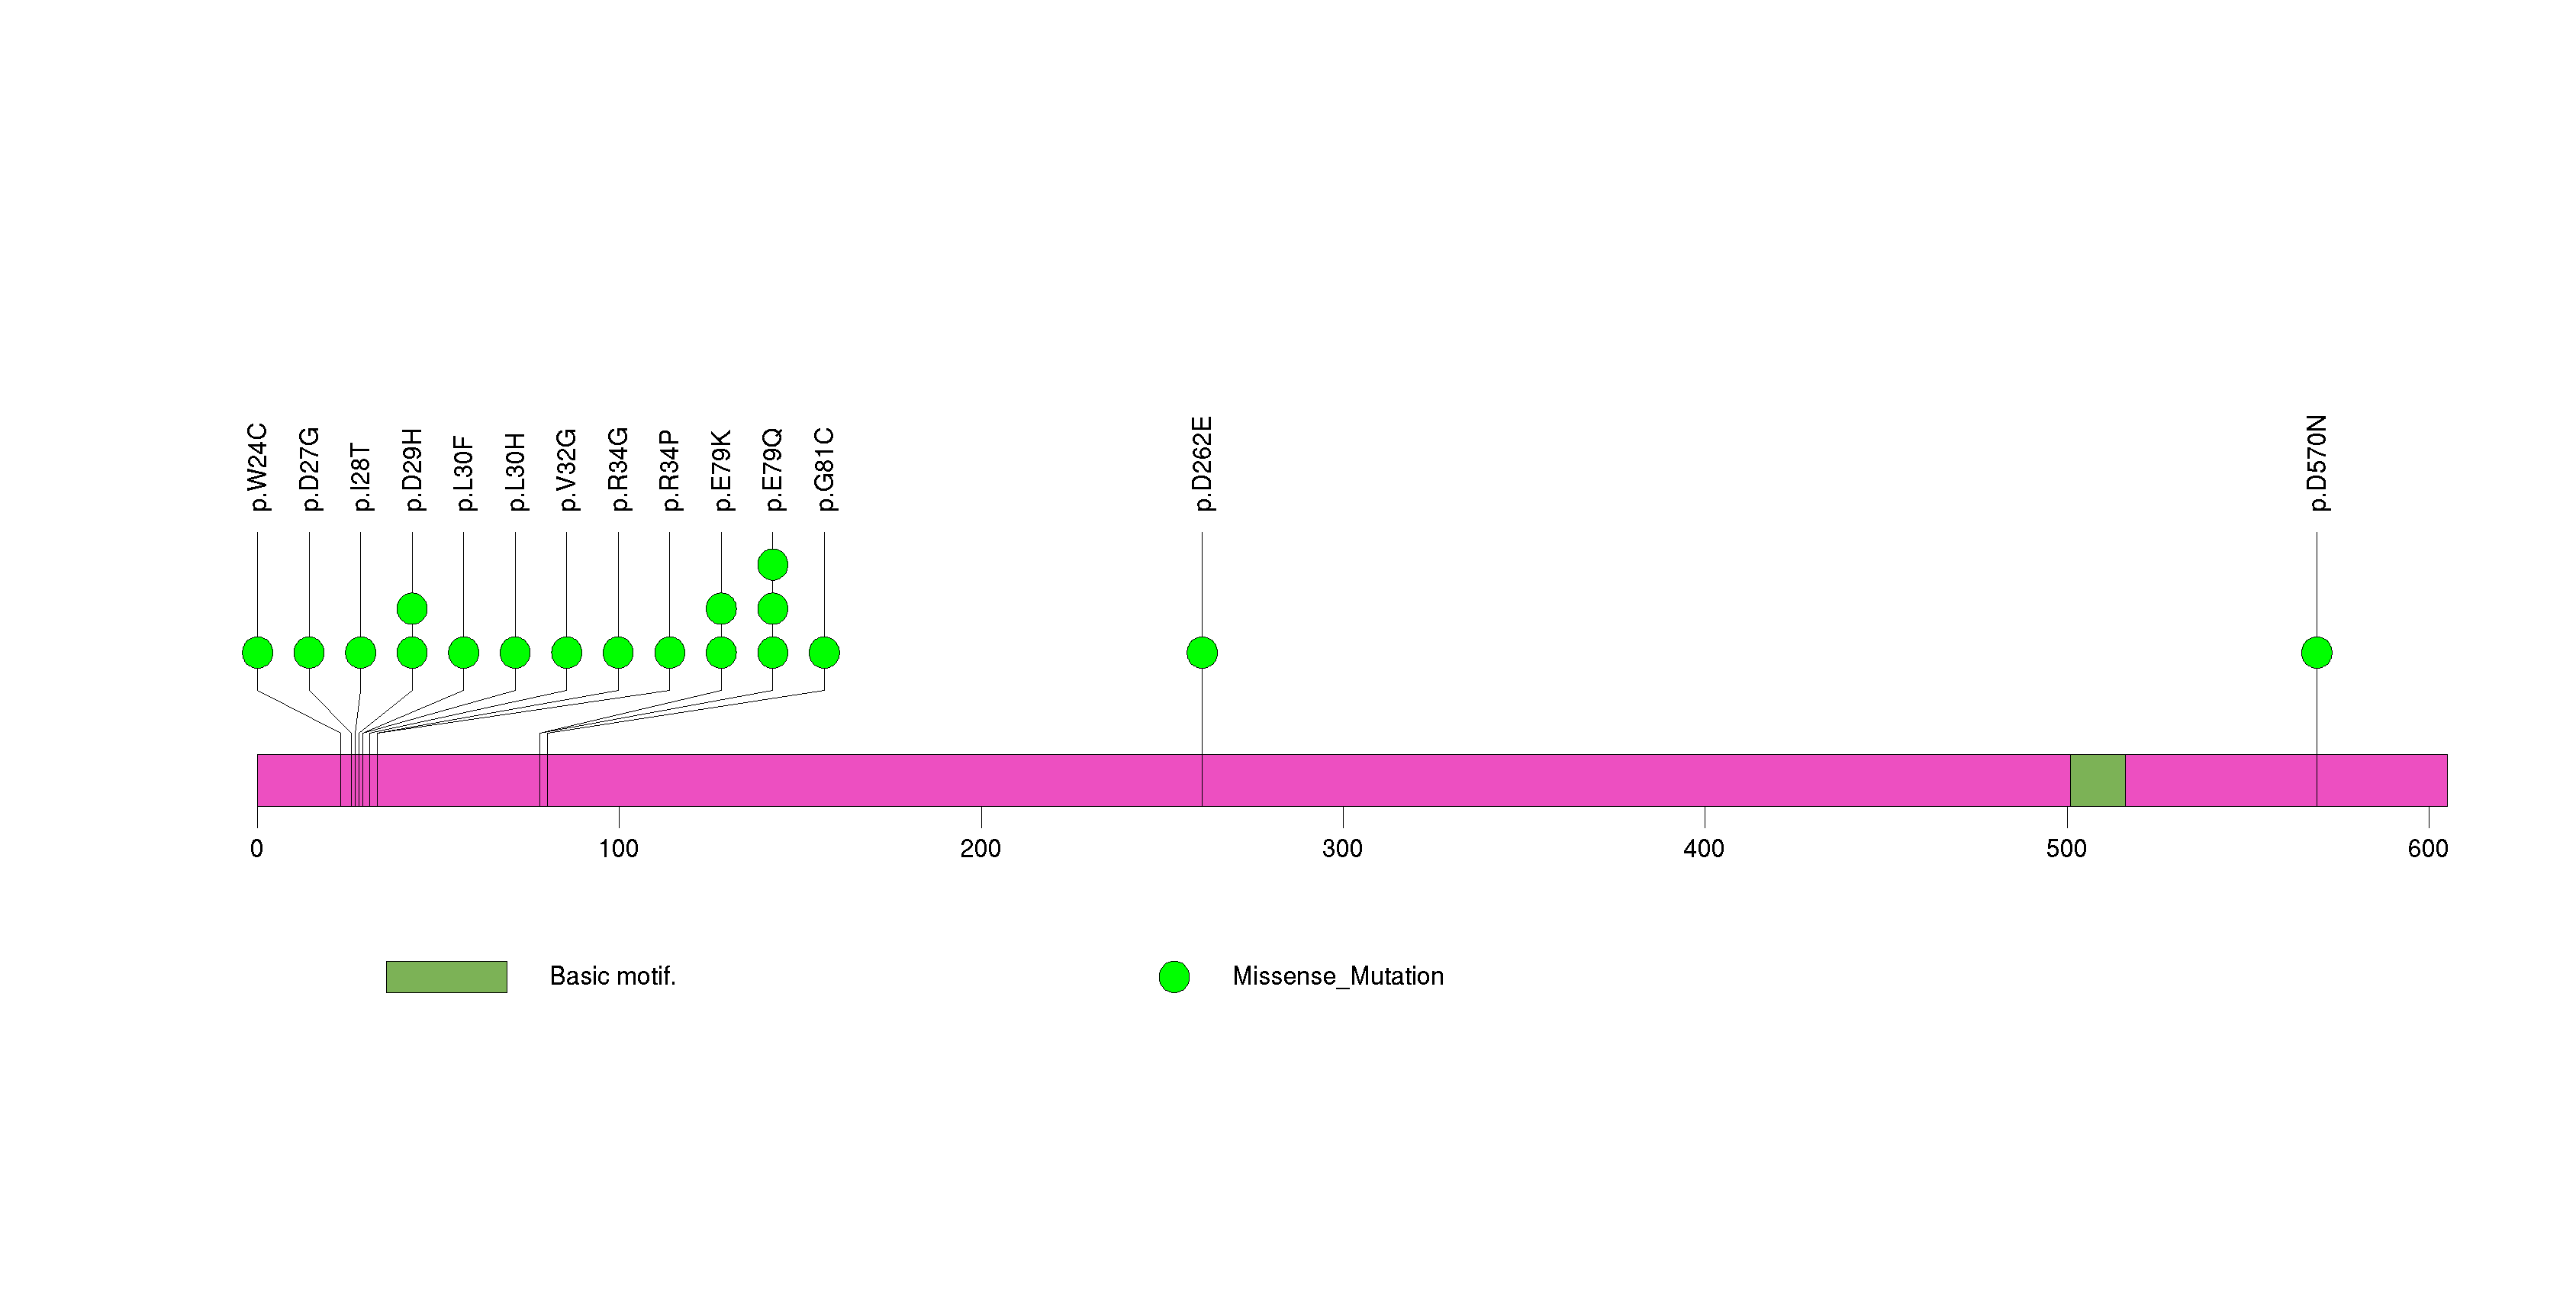
Figure S9. This figure depicts the distribution of mutations and mutation types across the NSD1 significant gene.
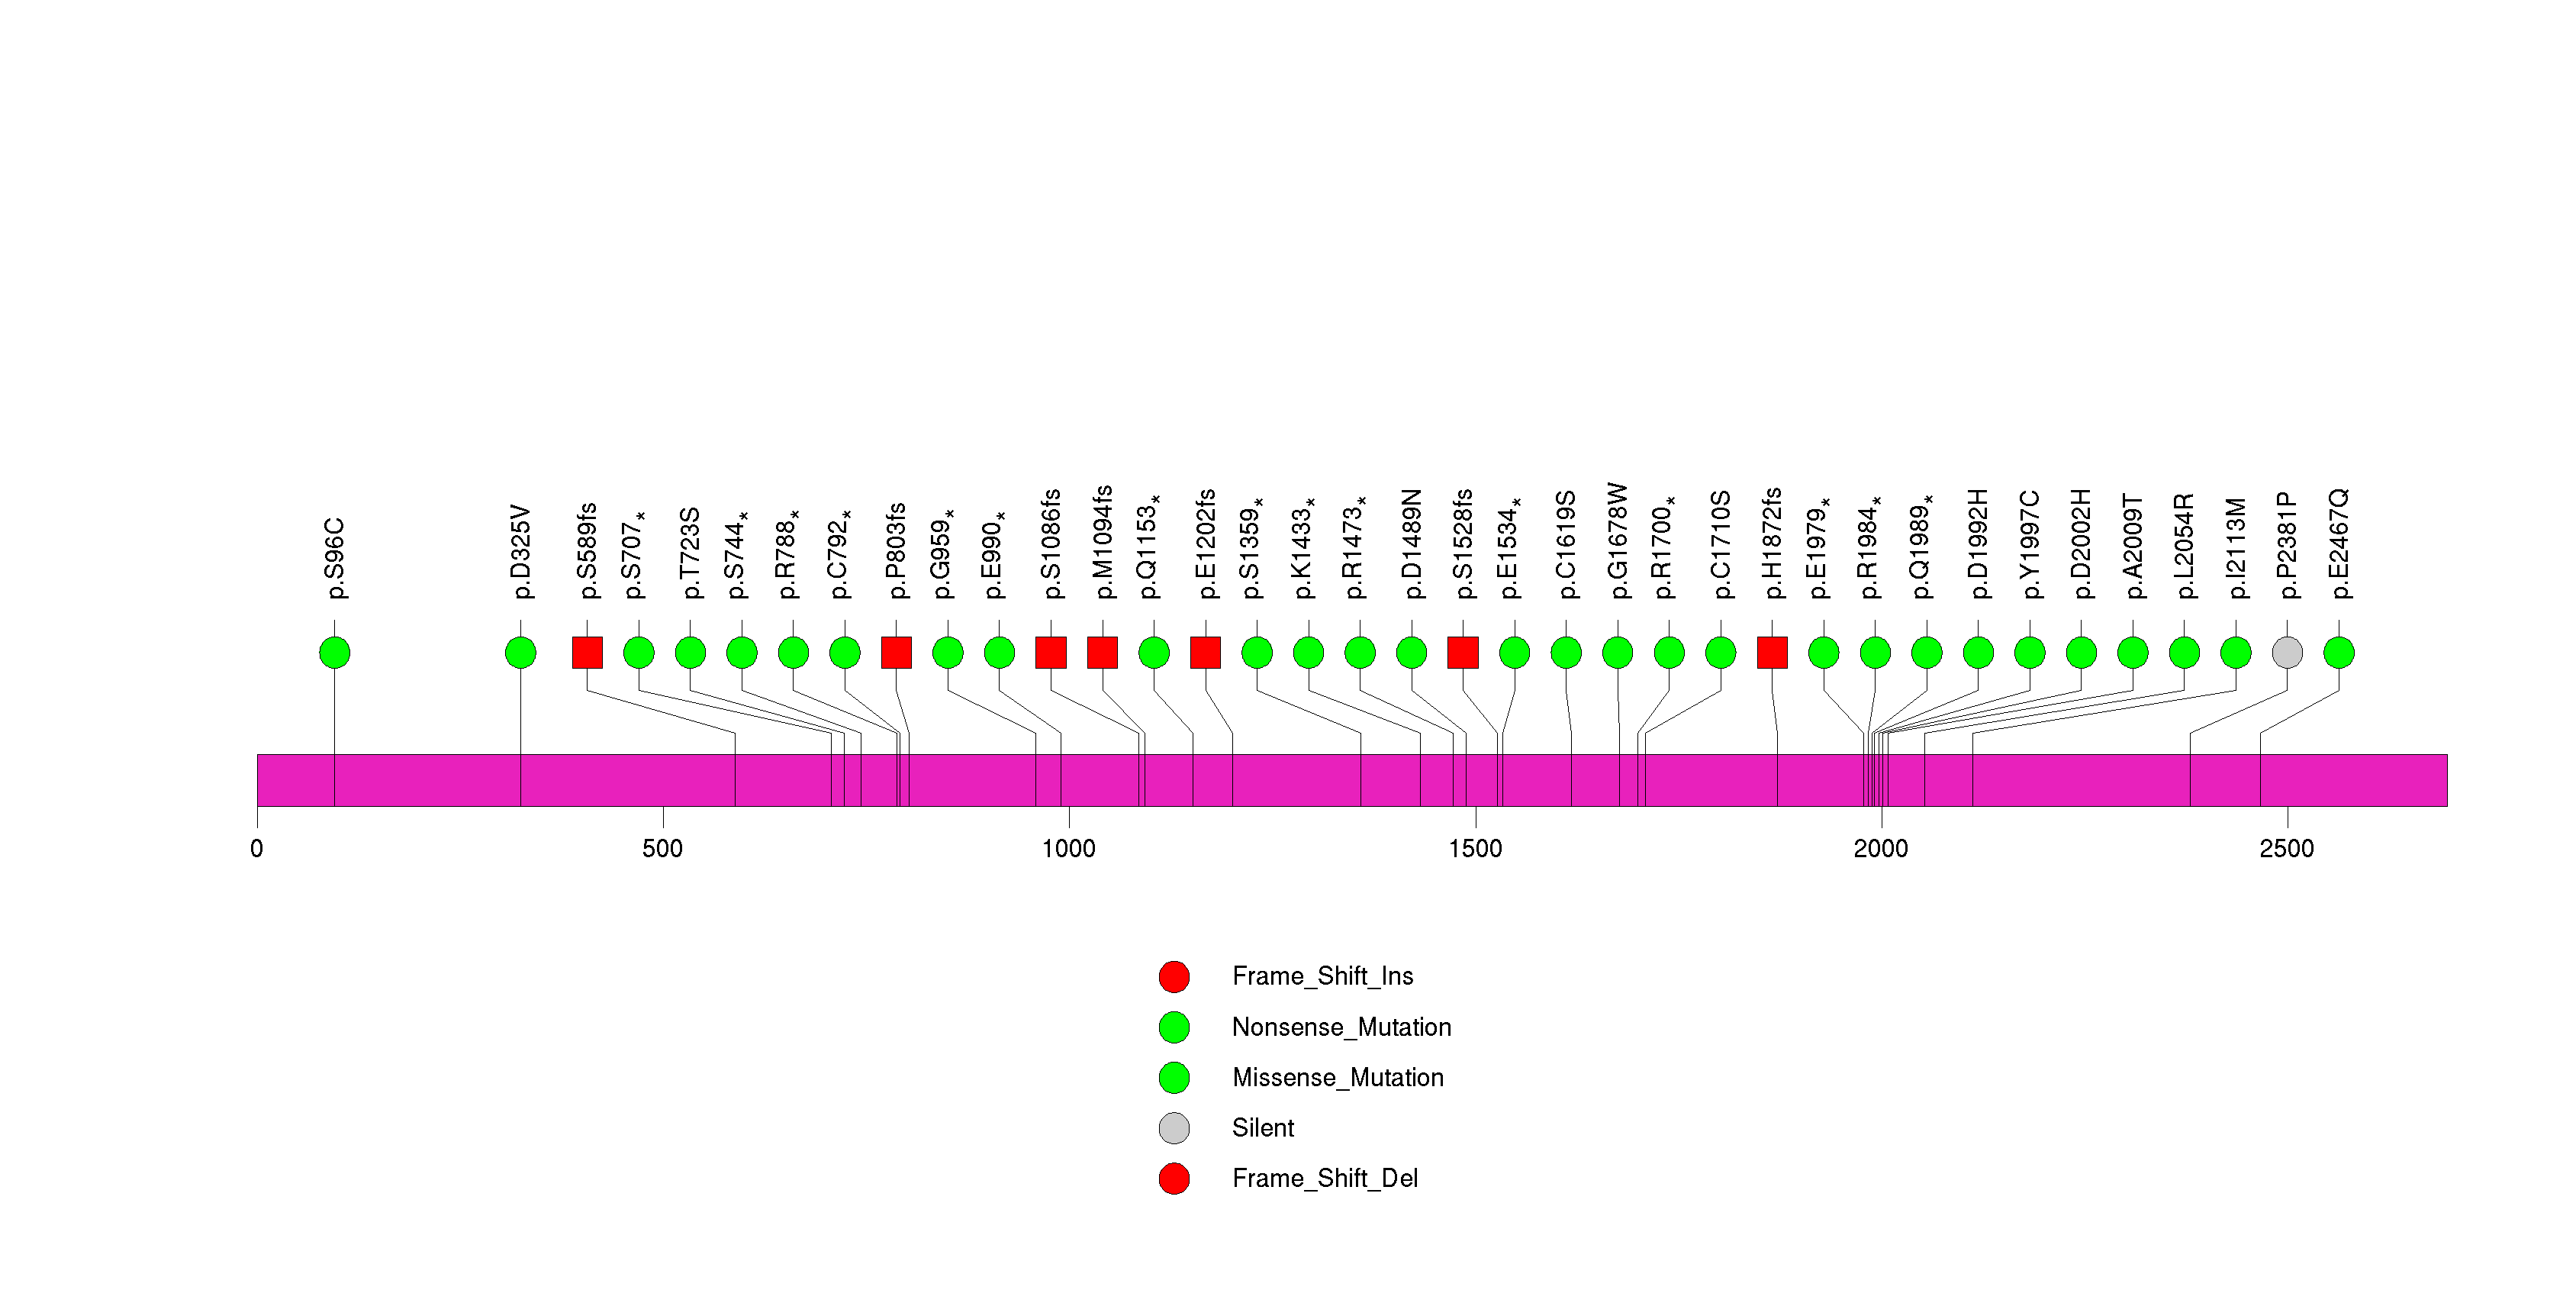
Figure S10. This figure depicts the distribution of mutations and mutation types across the POTEC significant gene.
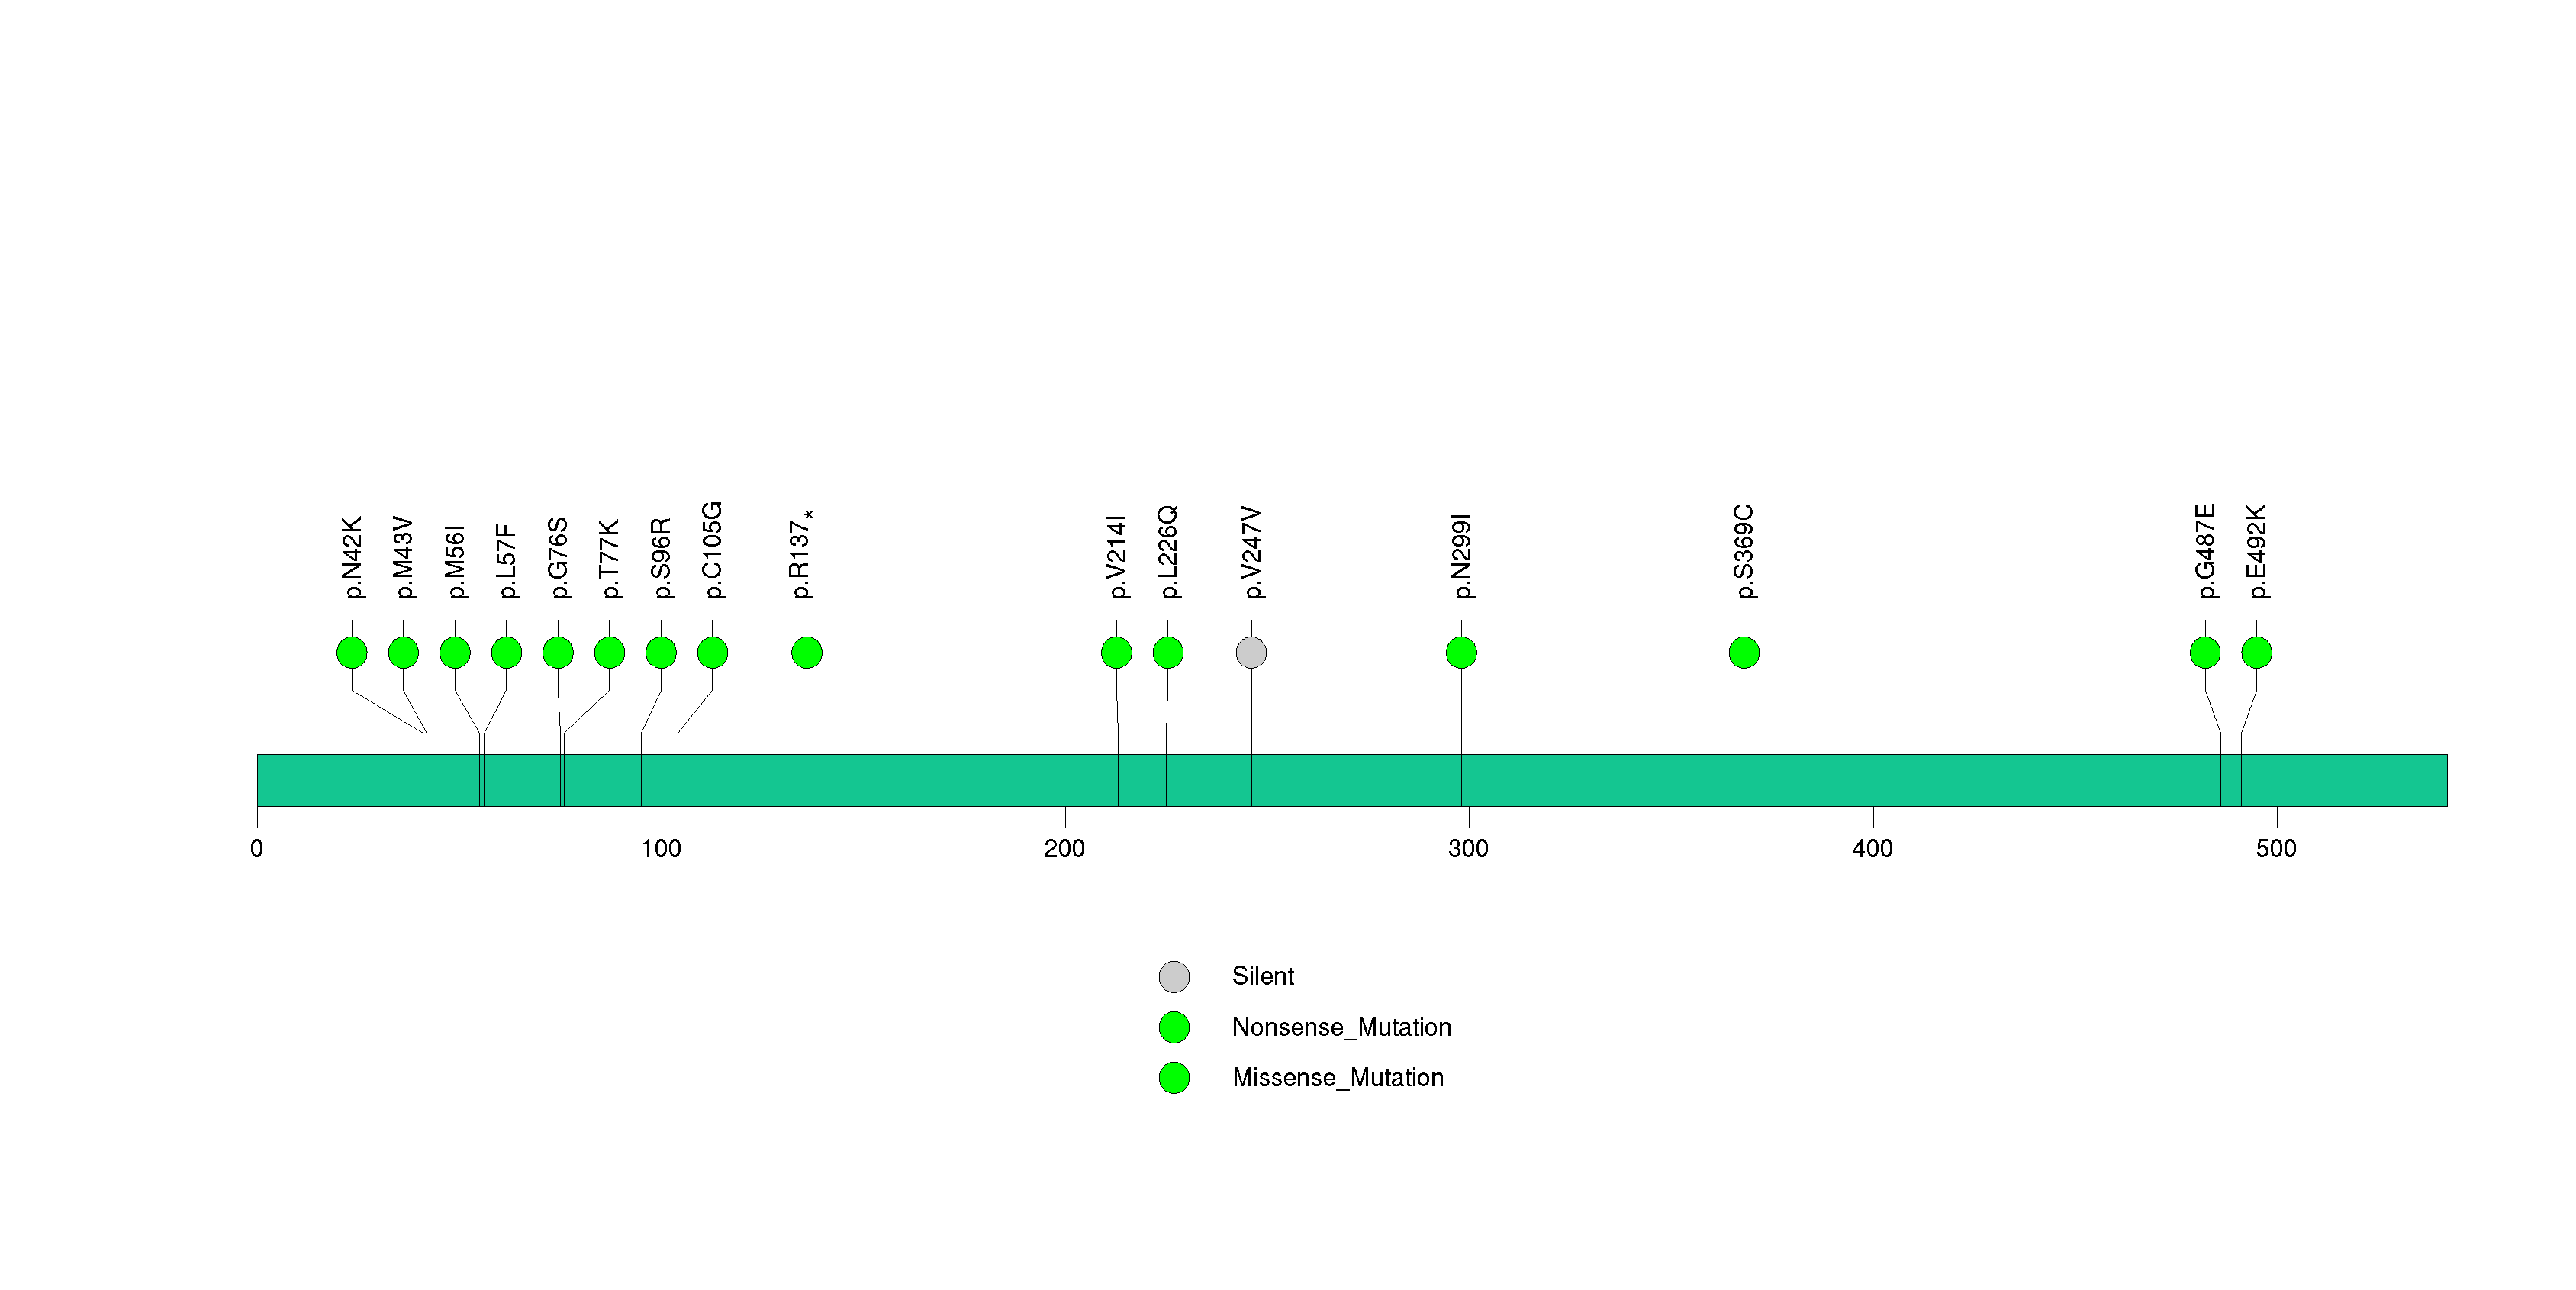
Figure S11. This figure depicts the distribution of mutations and mutation types across the HRAS significant gene.
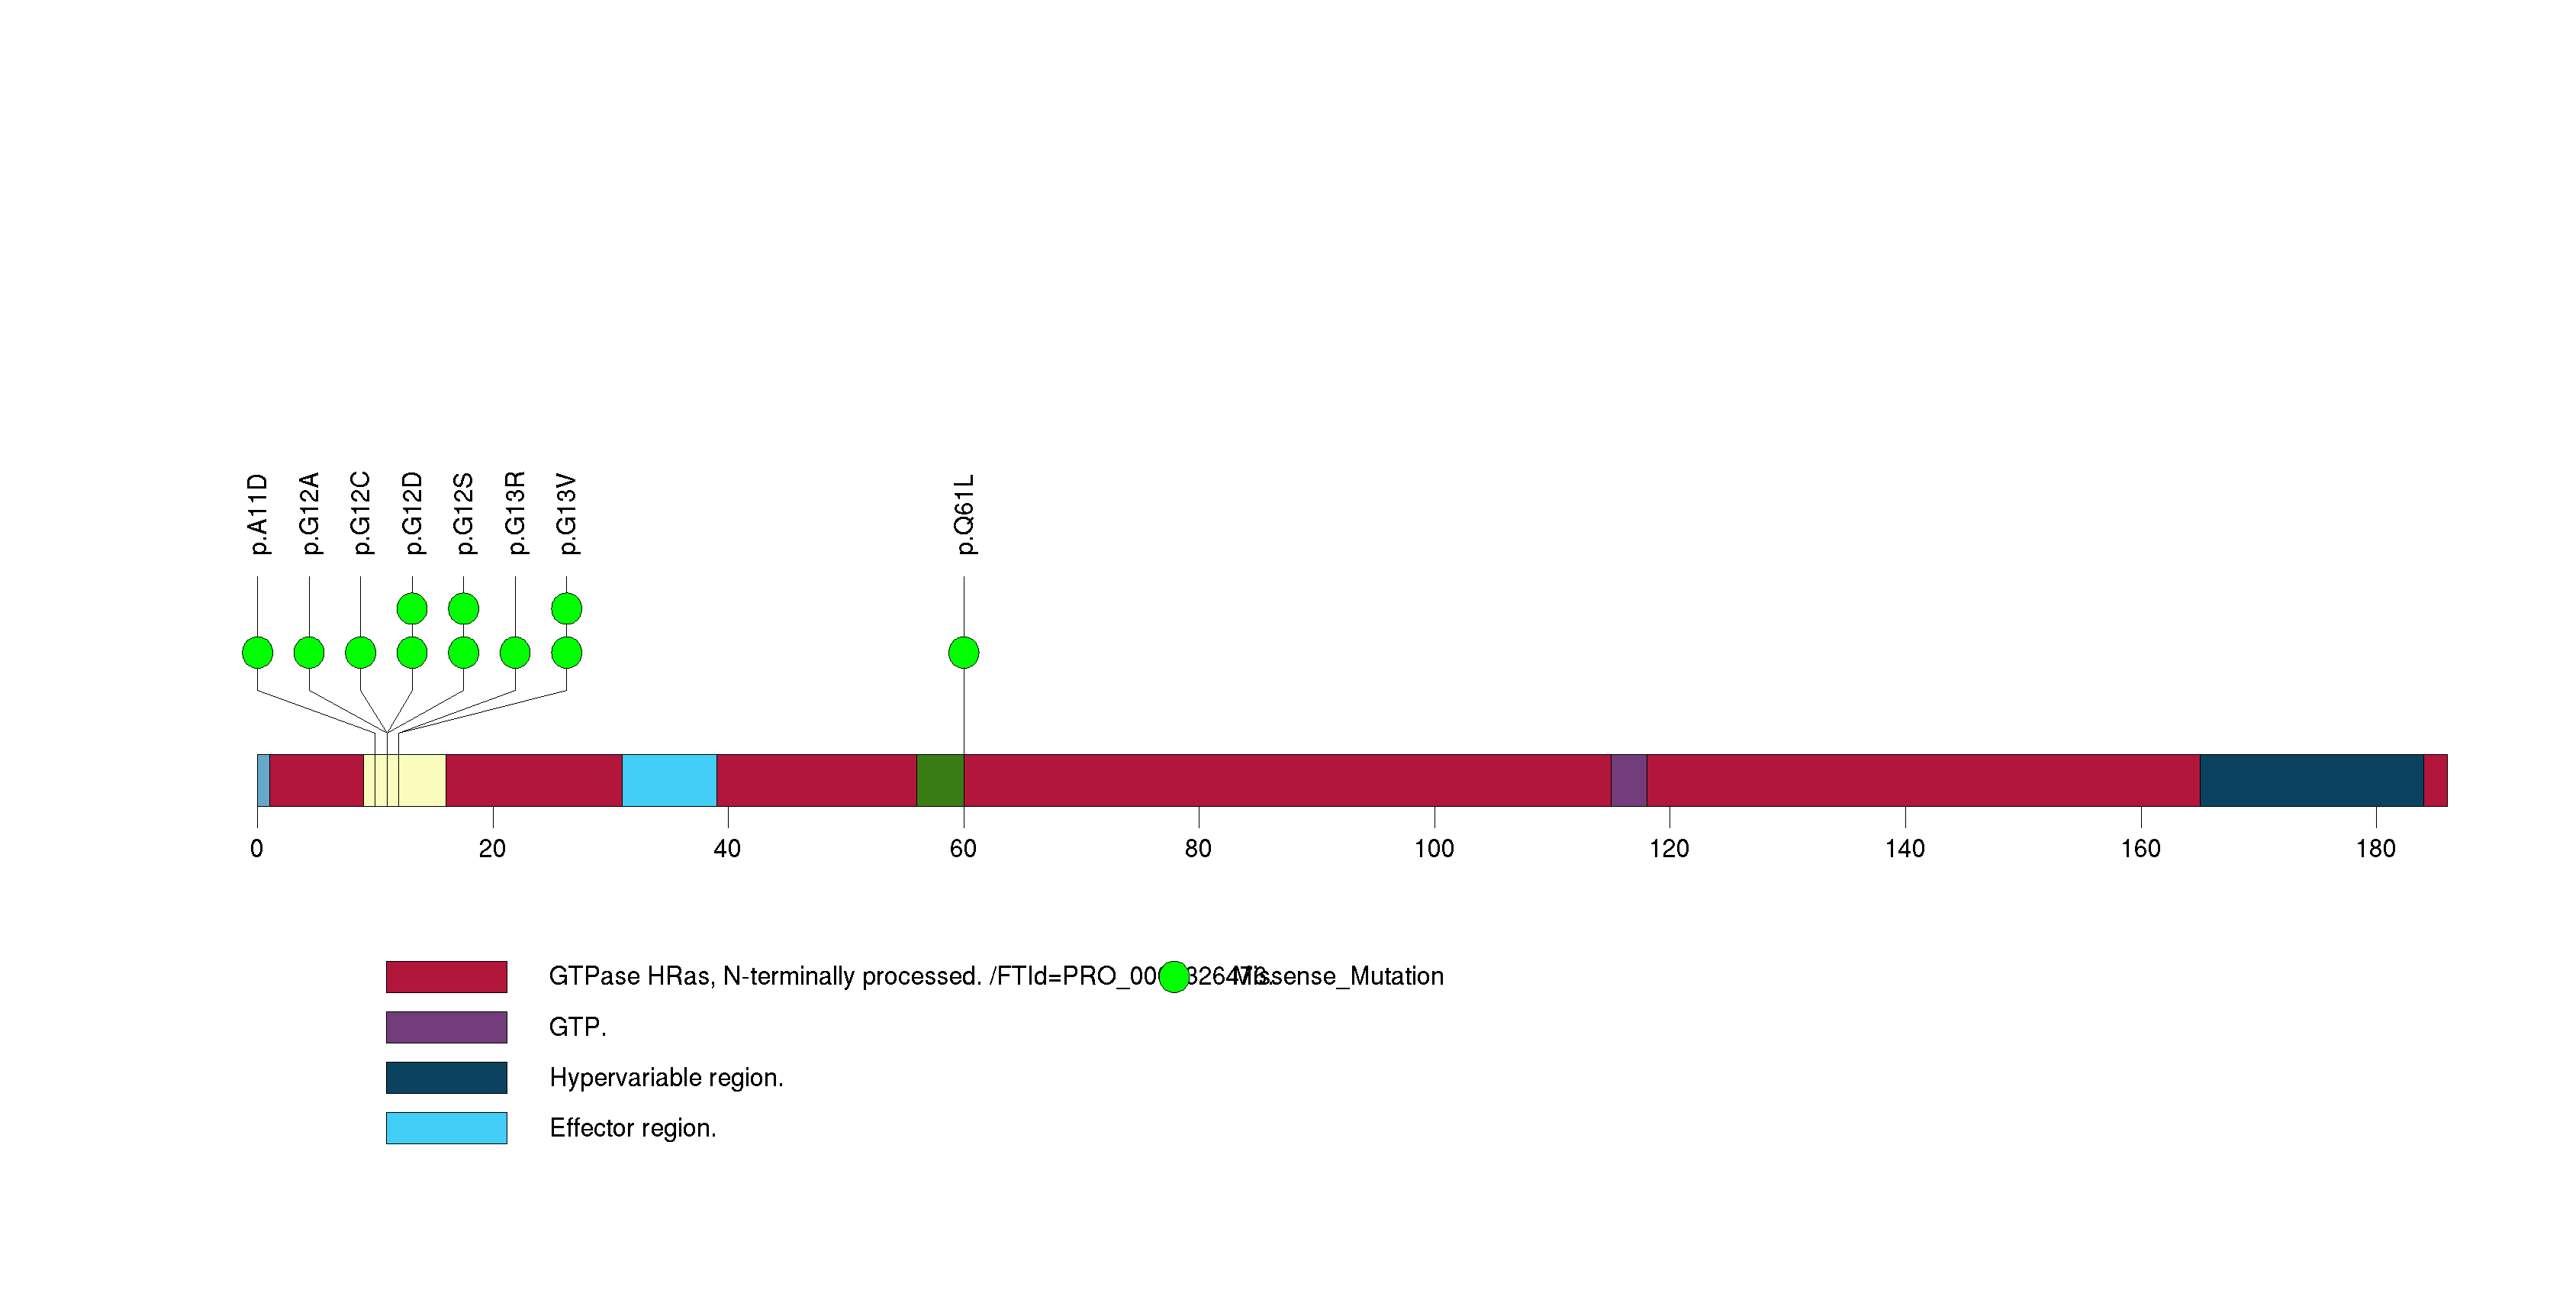
Figure S12. This figure depicts the distribution of mutations and mutation types across the B2M significant gene.
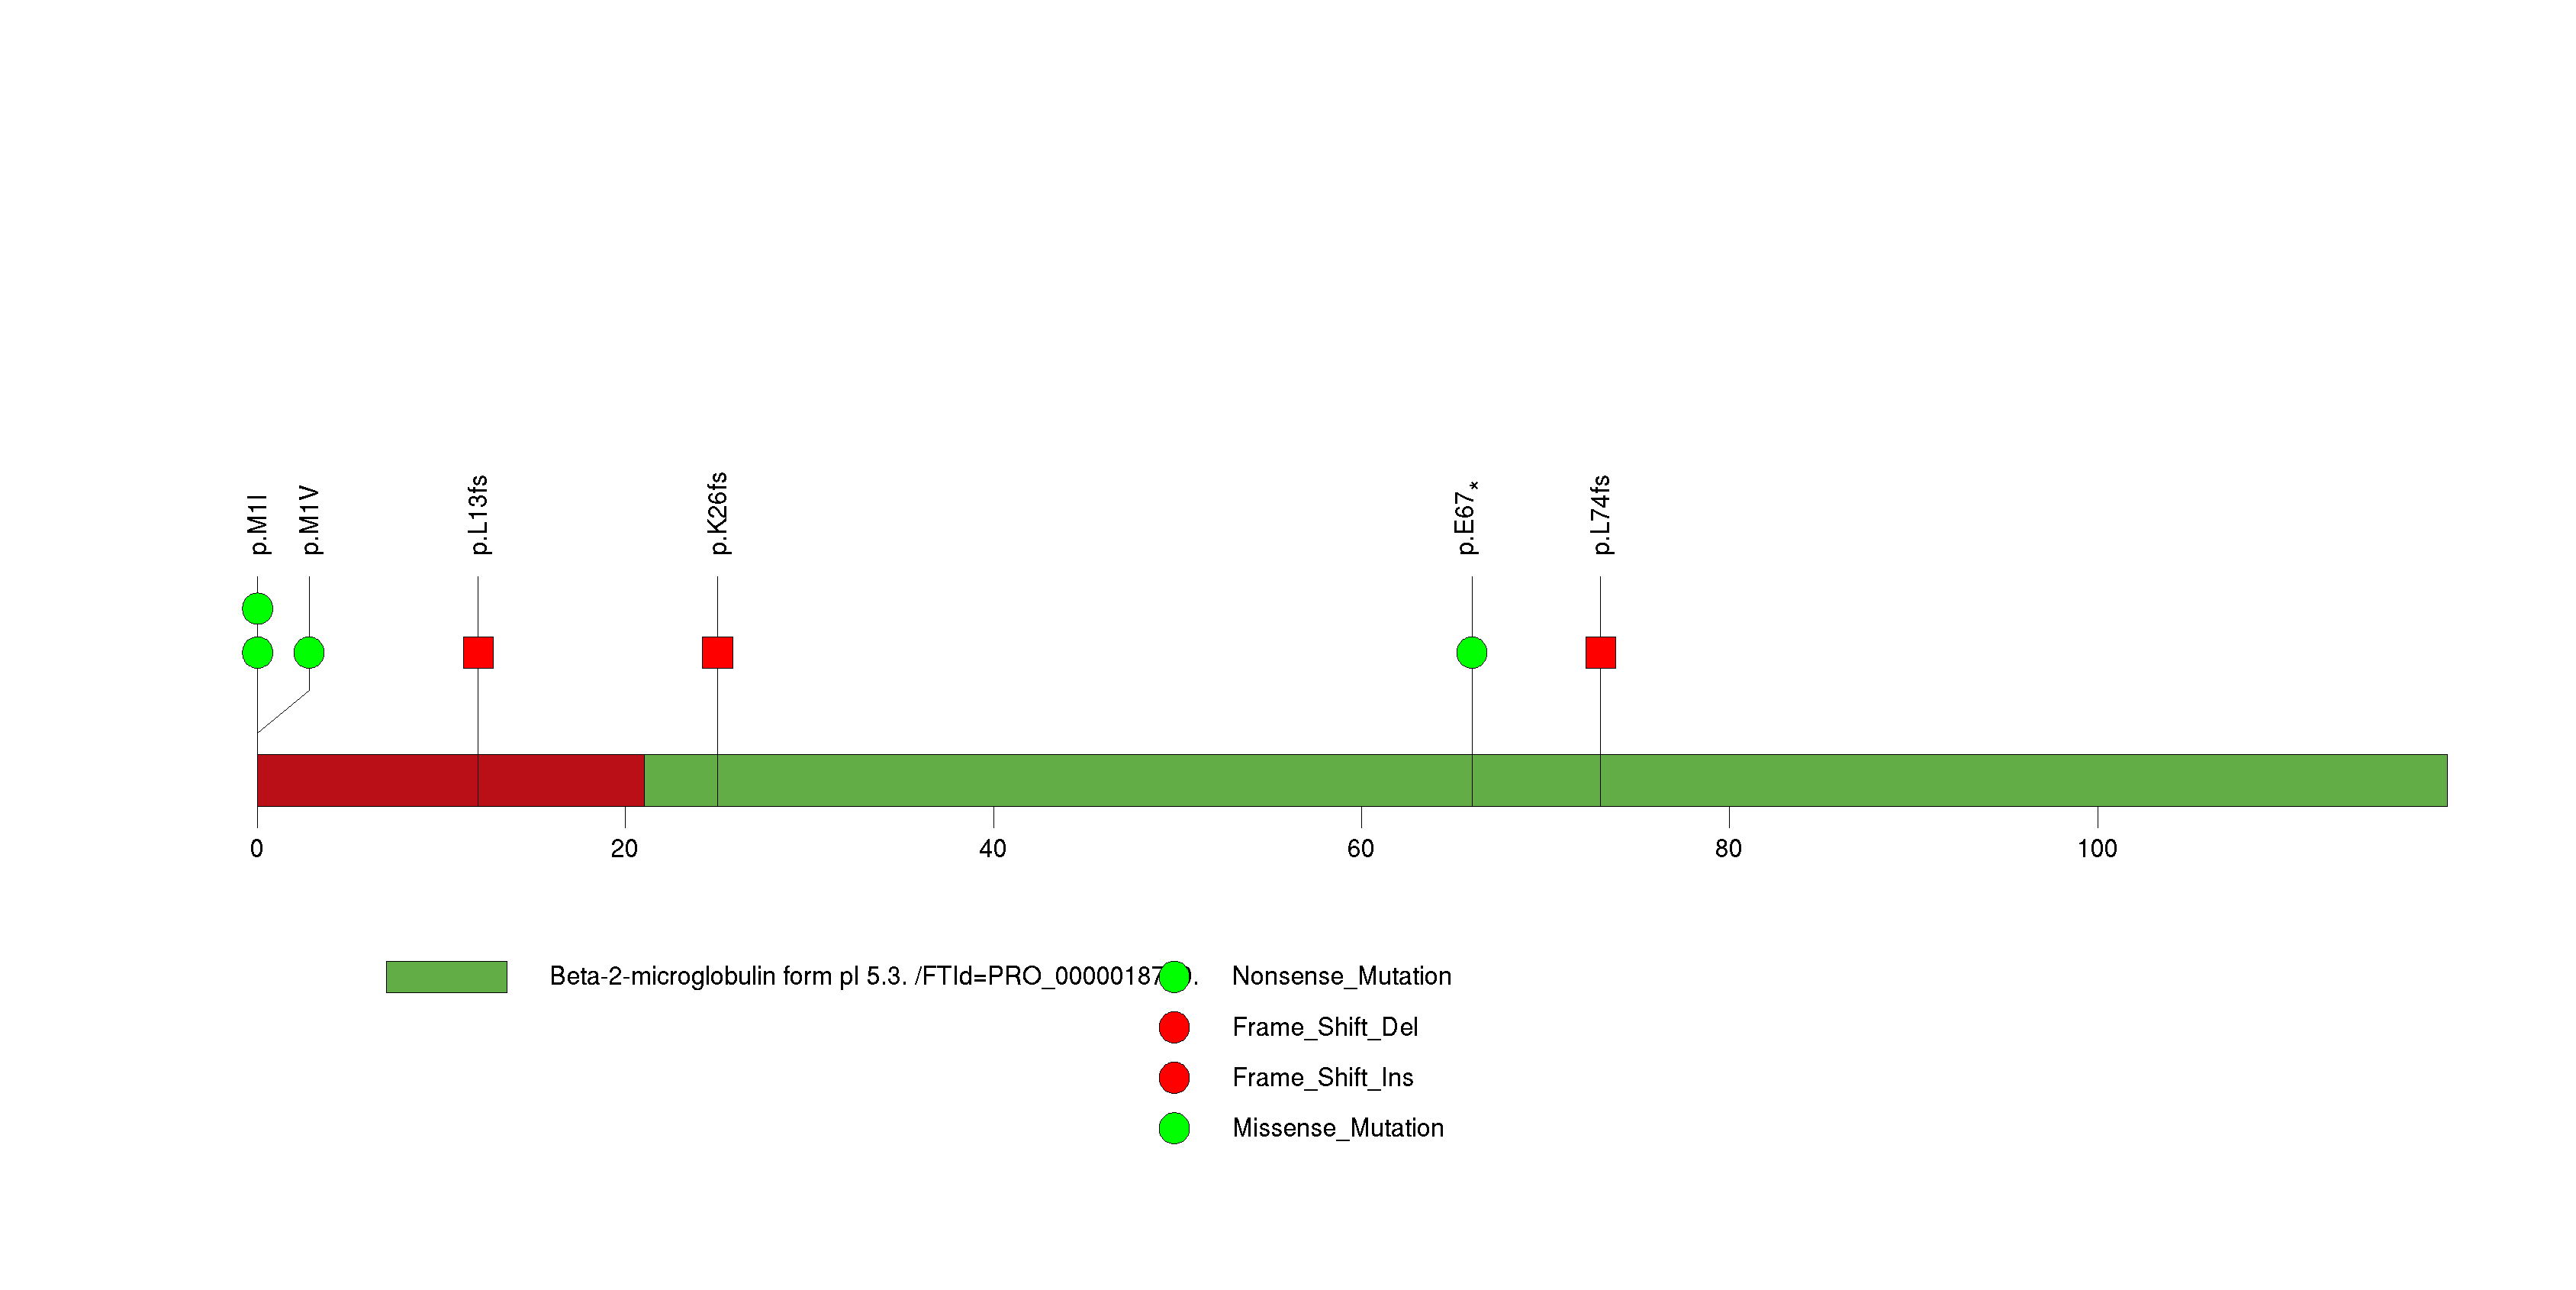
Figure S13. This figure depicts the distribution of mutations and mutation types across the POM121L12 significant gene.
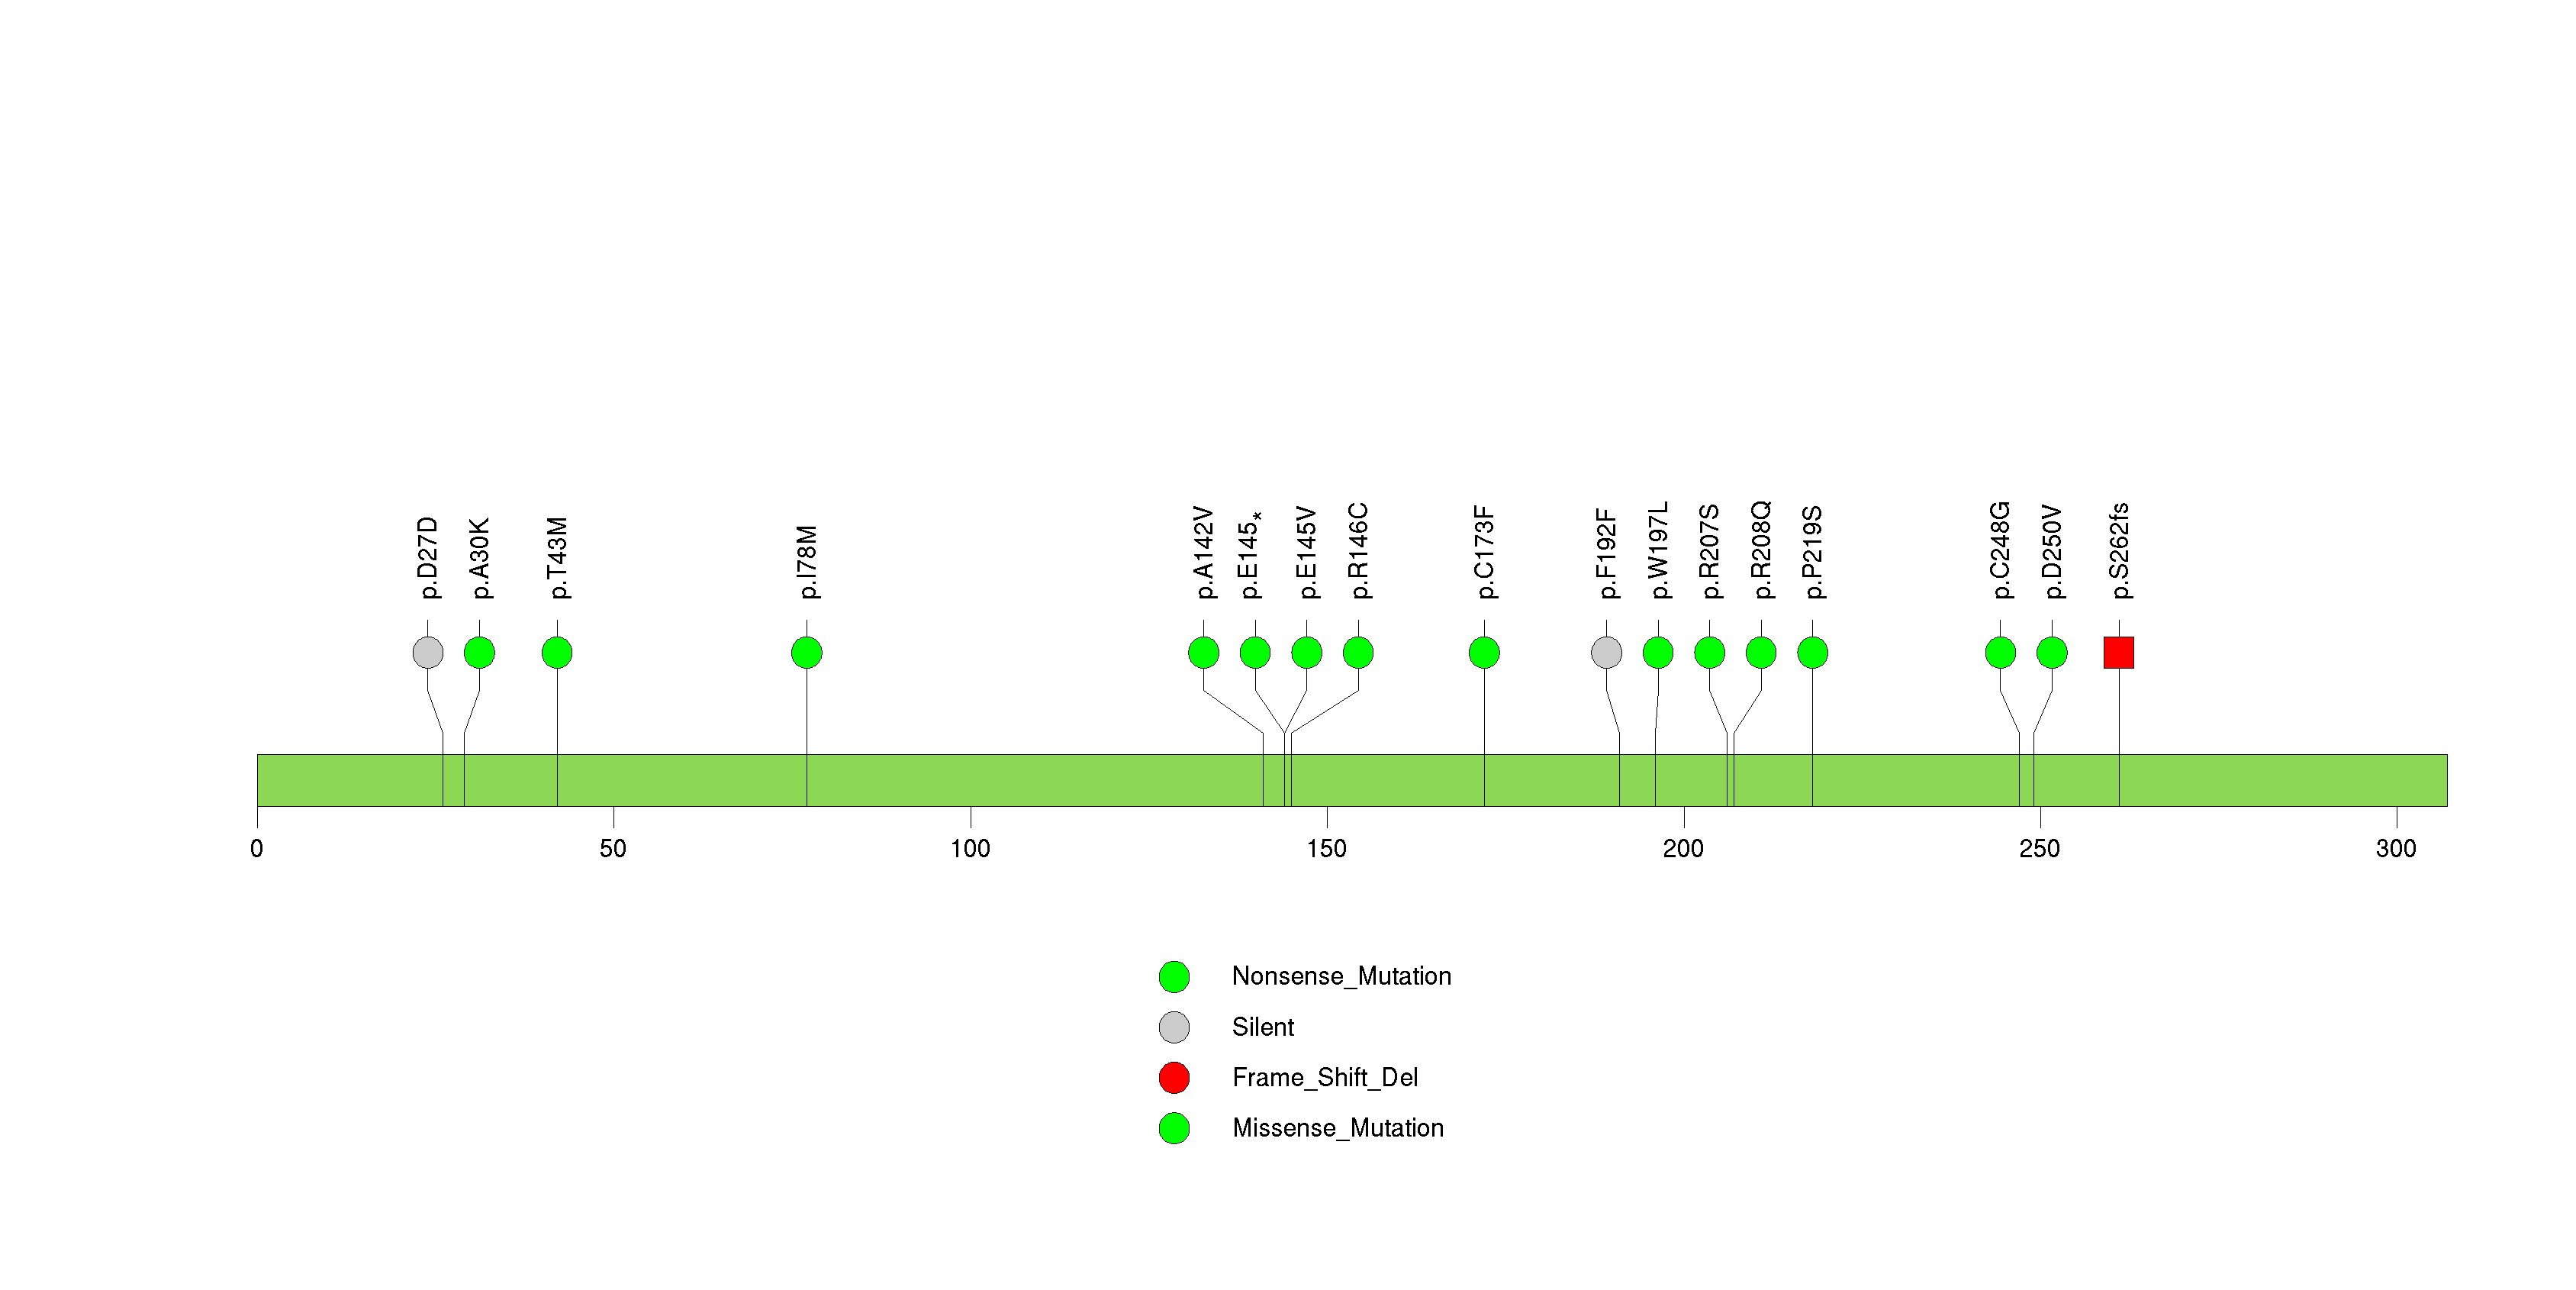
Figure S14. This figure depicts the distribution of mutations and mutation types across the RAC1 significant gene.
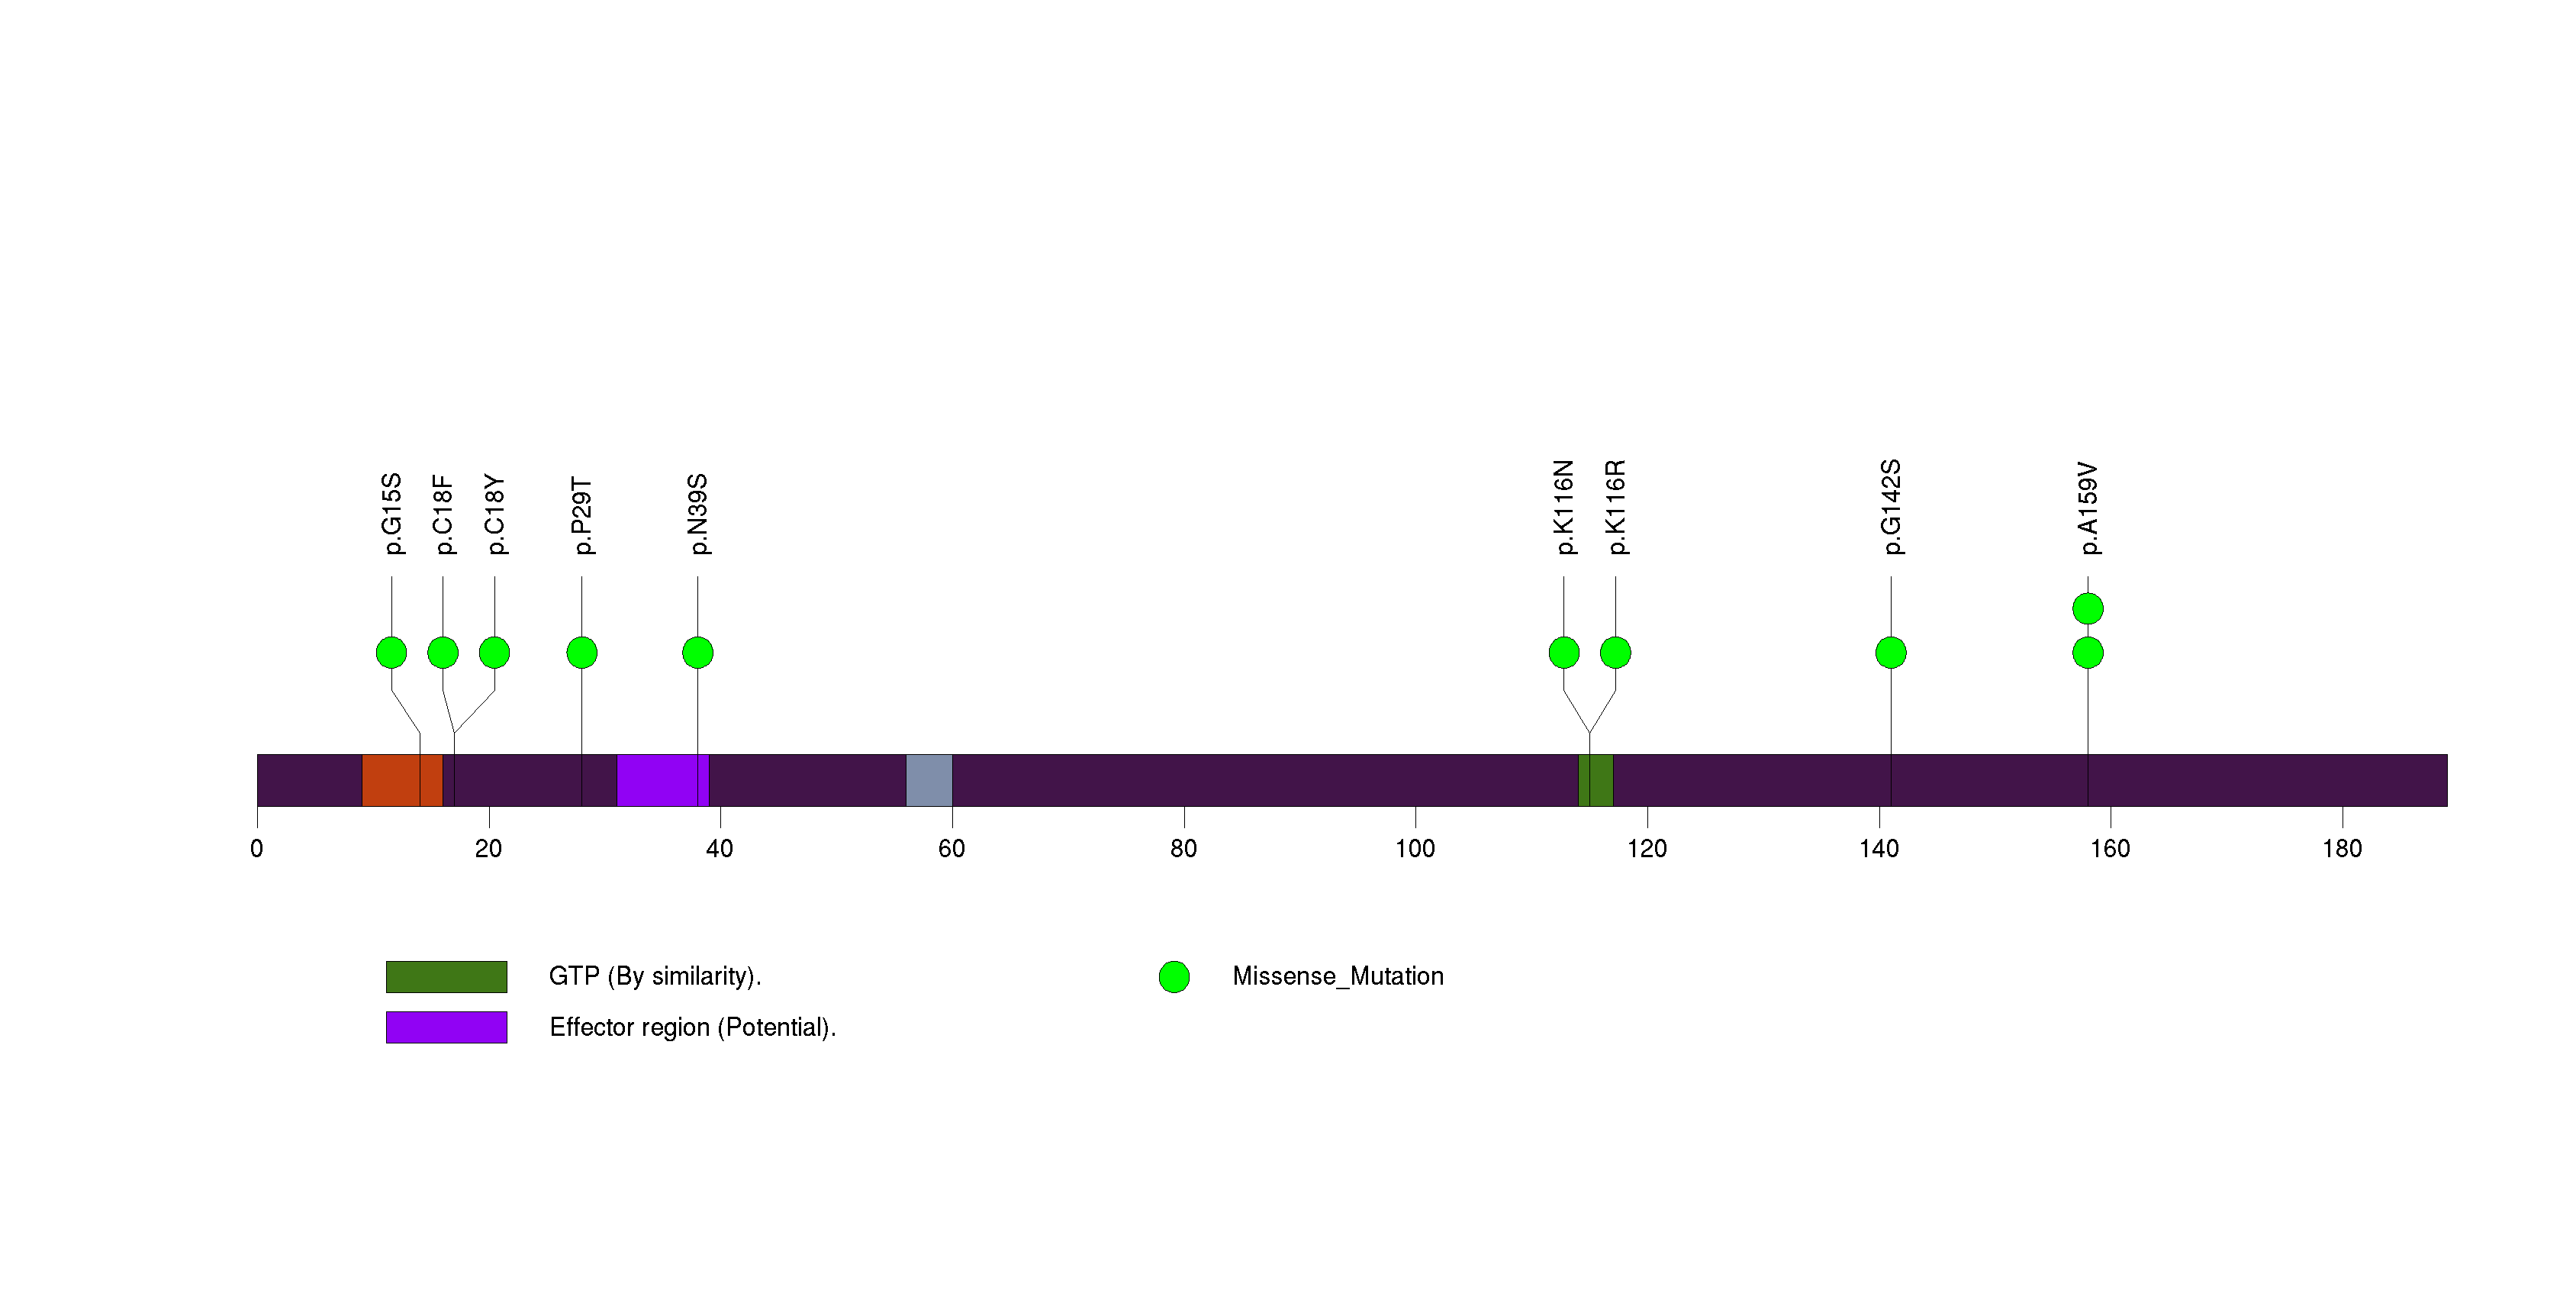
Figure S15. This figure depicts the distribution of mutations and mutation types across the ZNF804B significant gene.
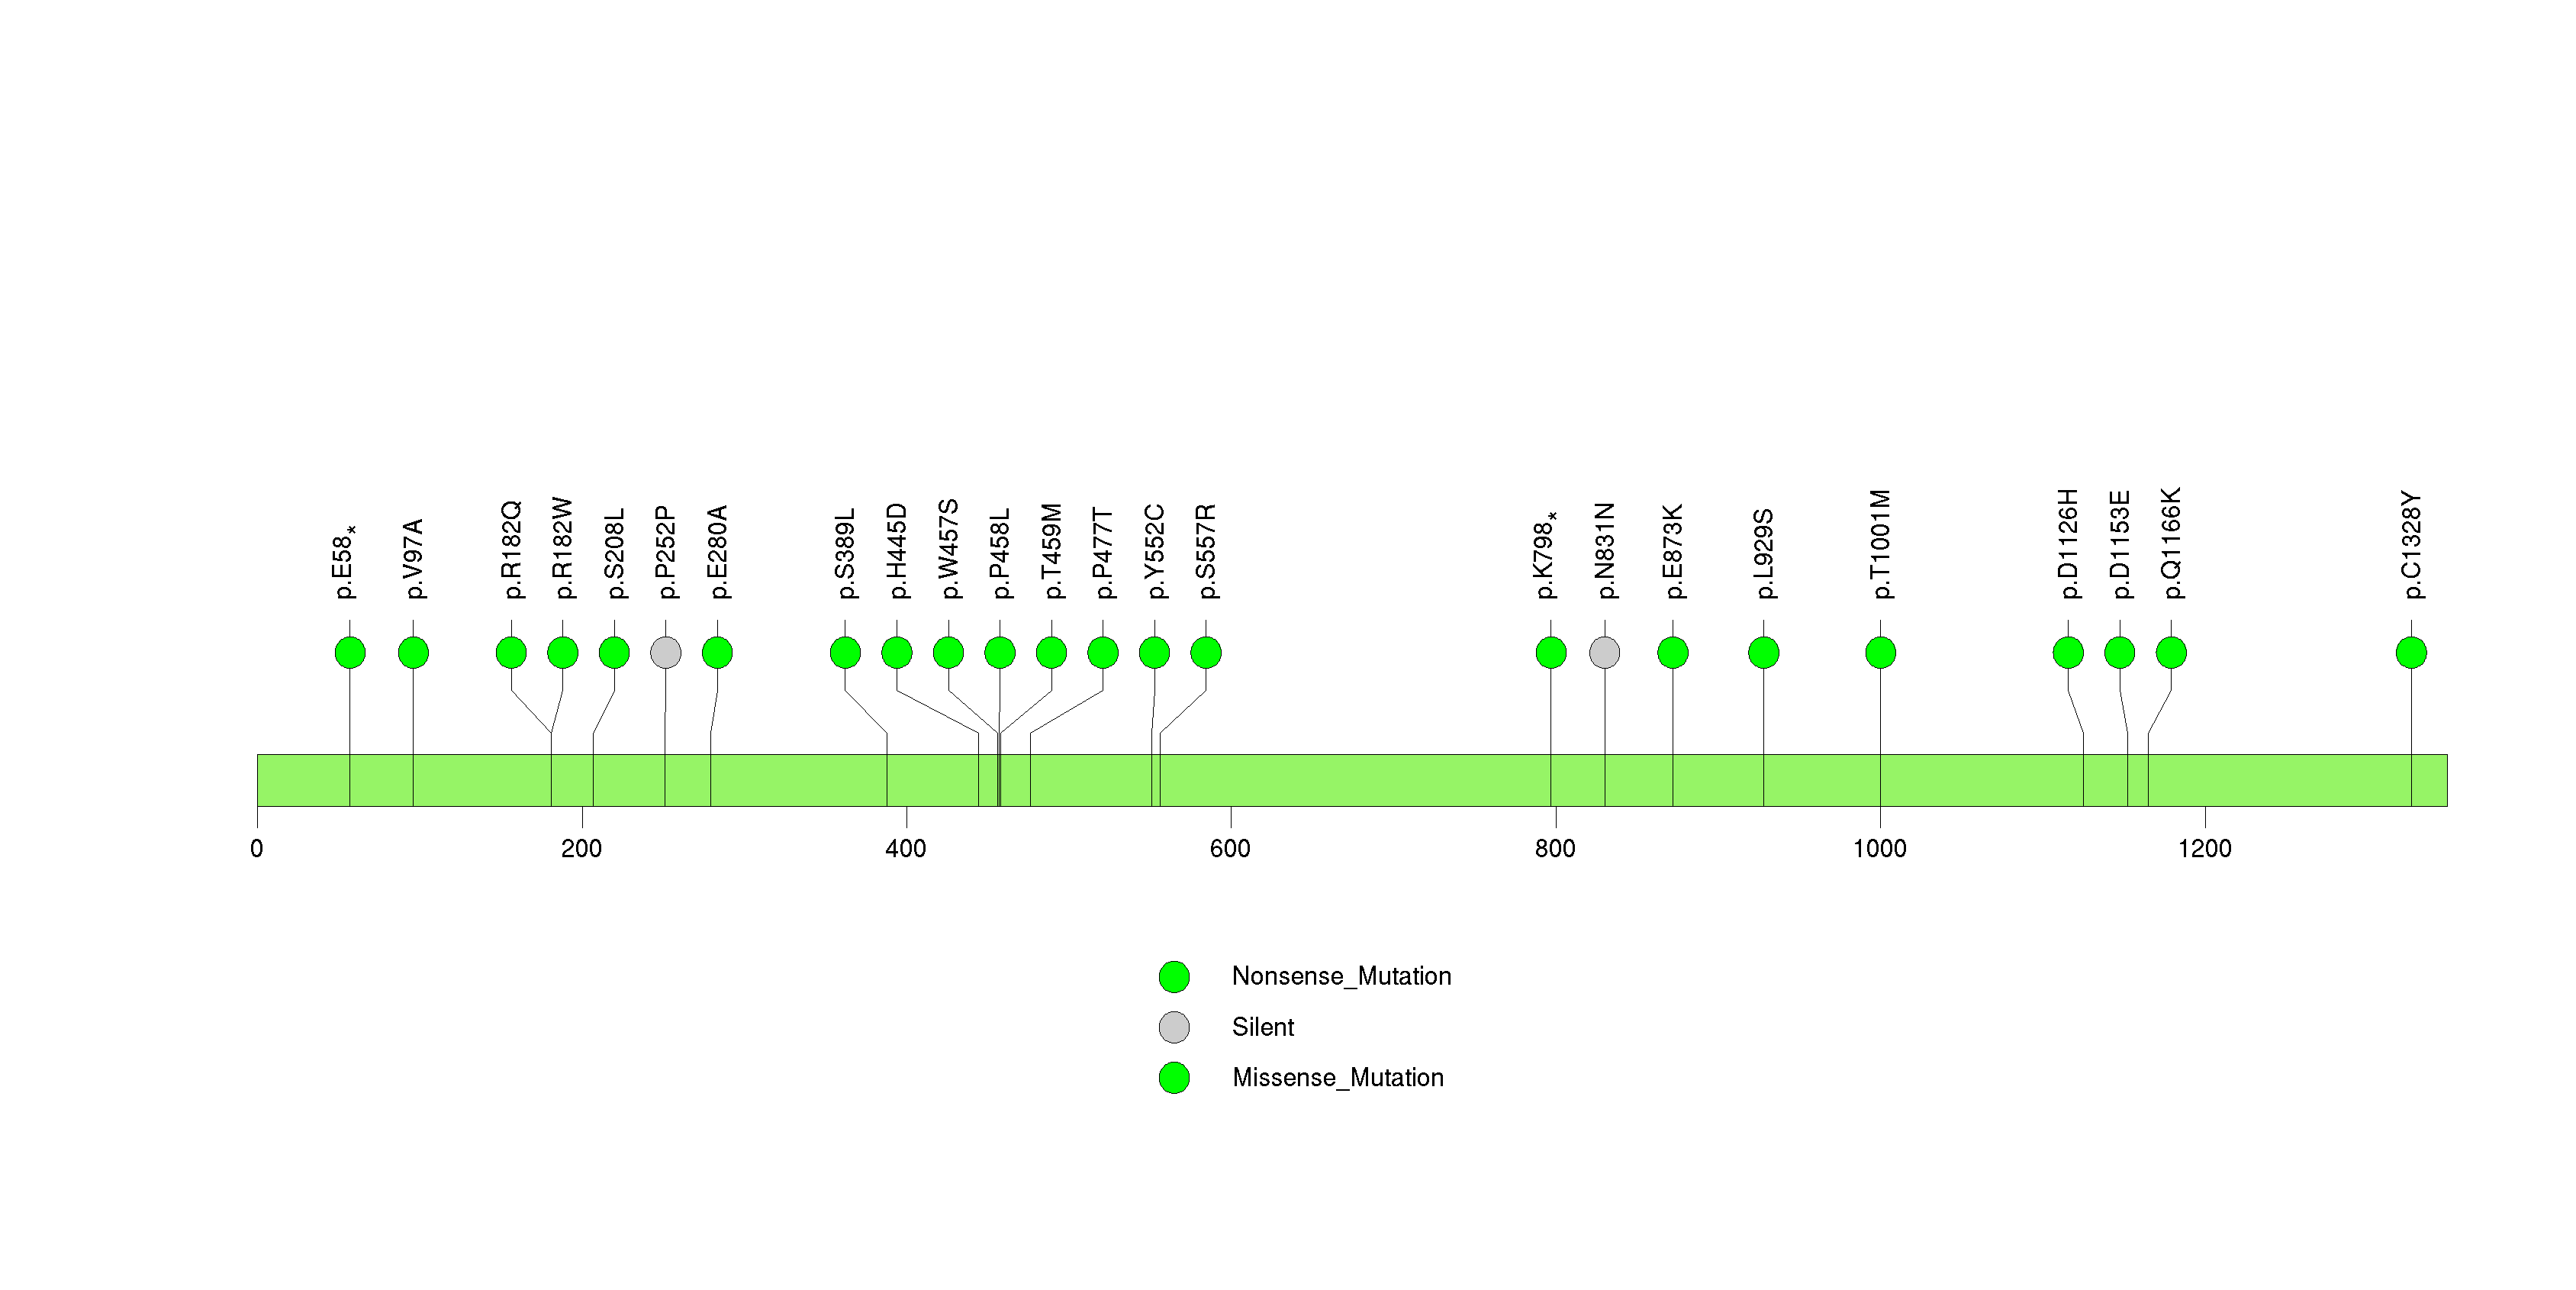
Figure S16. This figure depicts the distribution of mutations and mutation types across the OR2T12 significant gene.
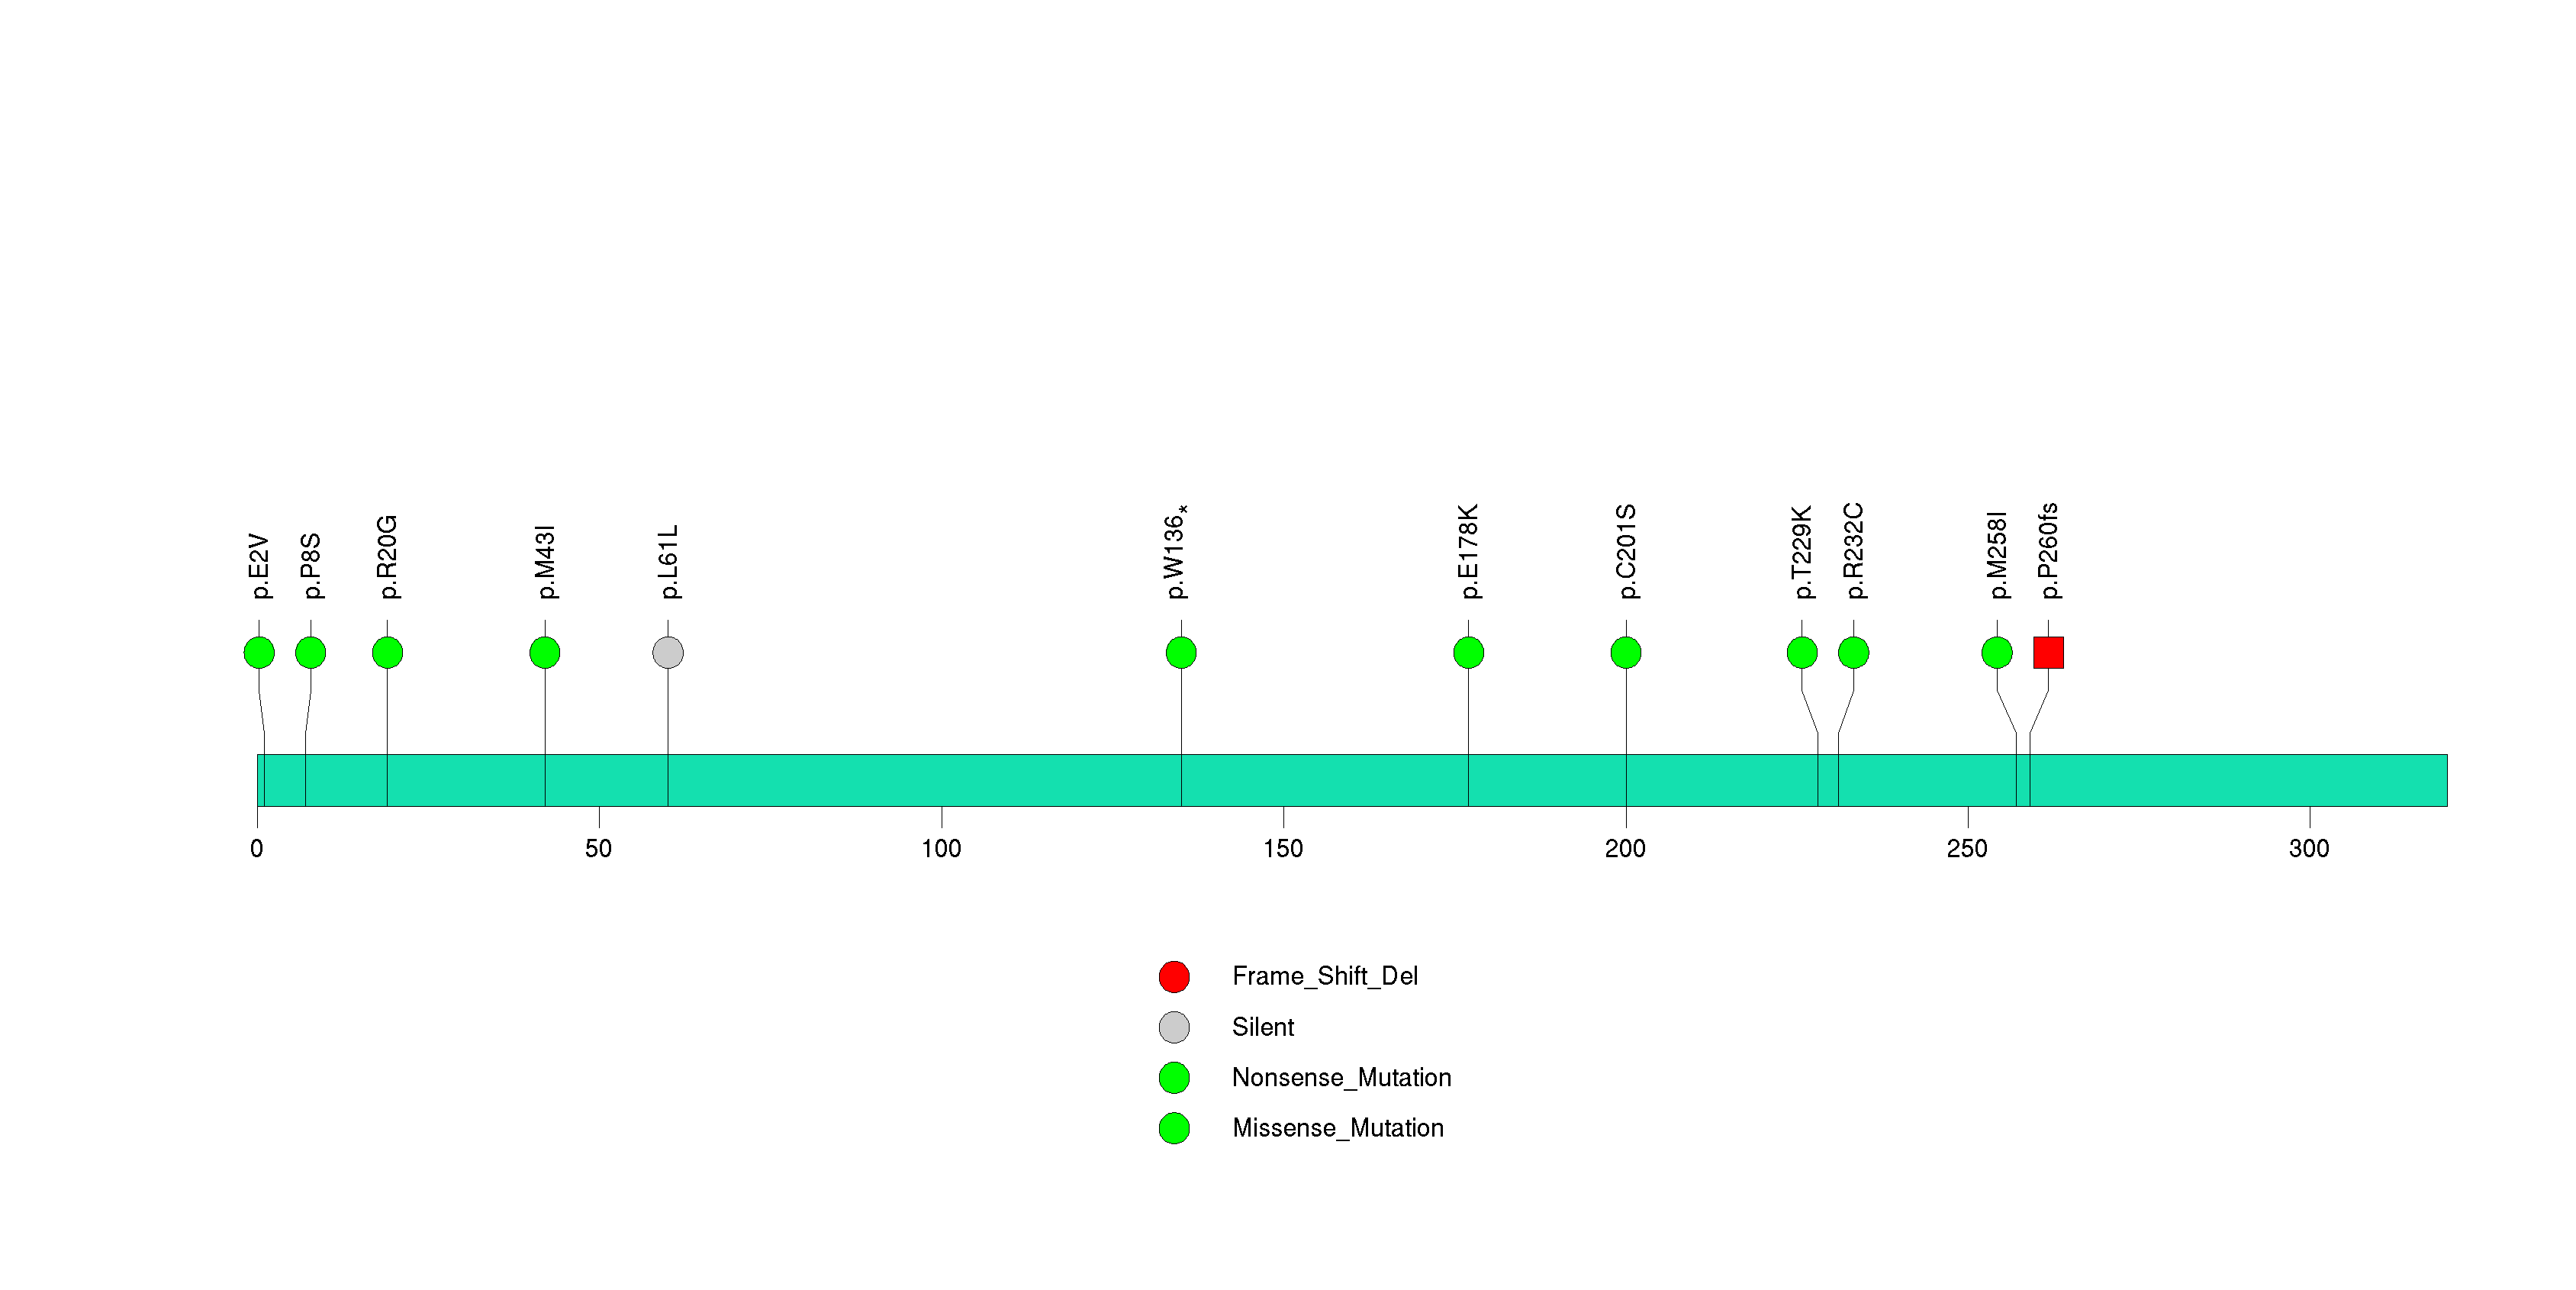
Figure S17. This figure depicts the distribution of mutations and mutation types across the CDH10 significant gene.
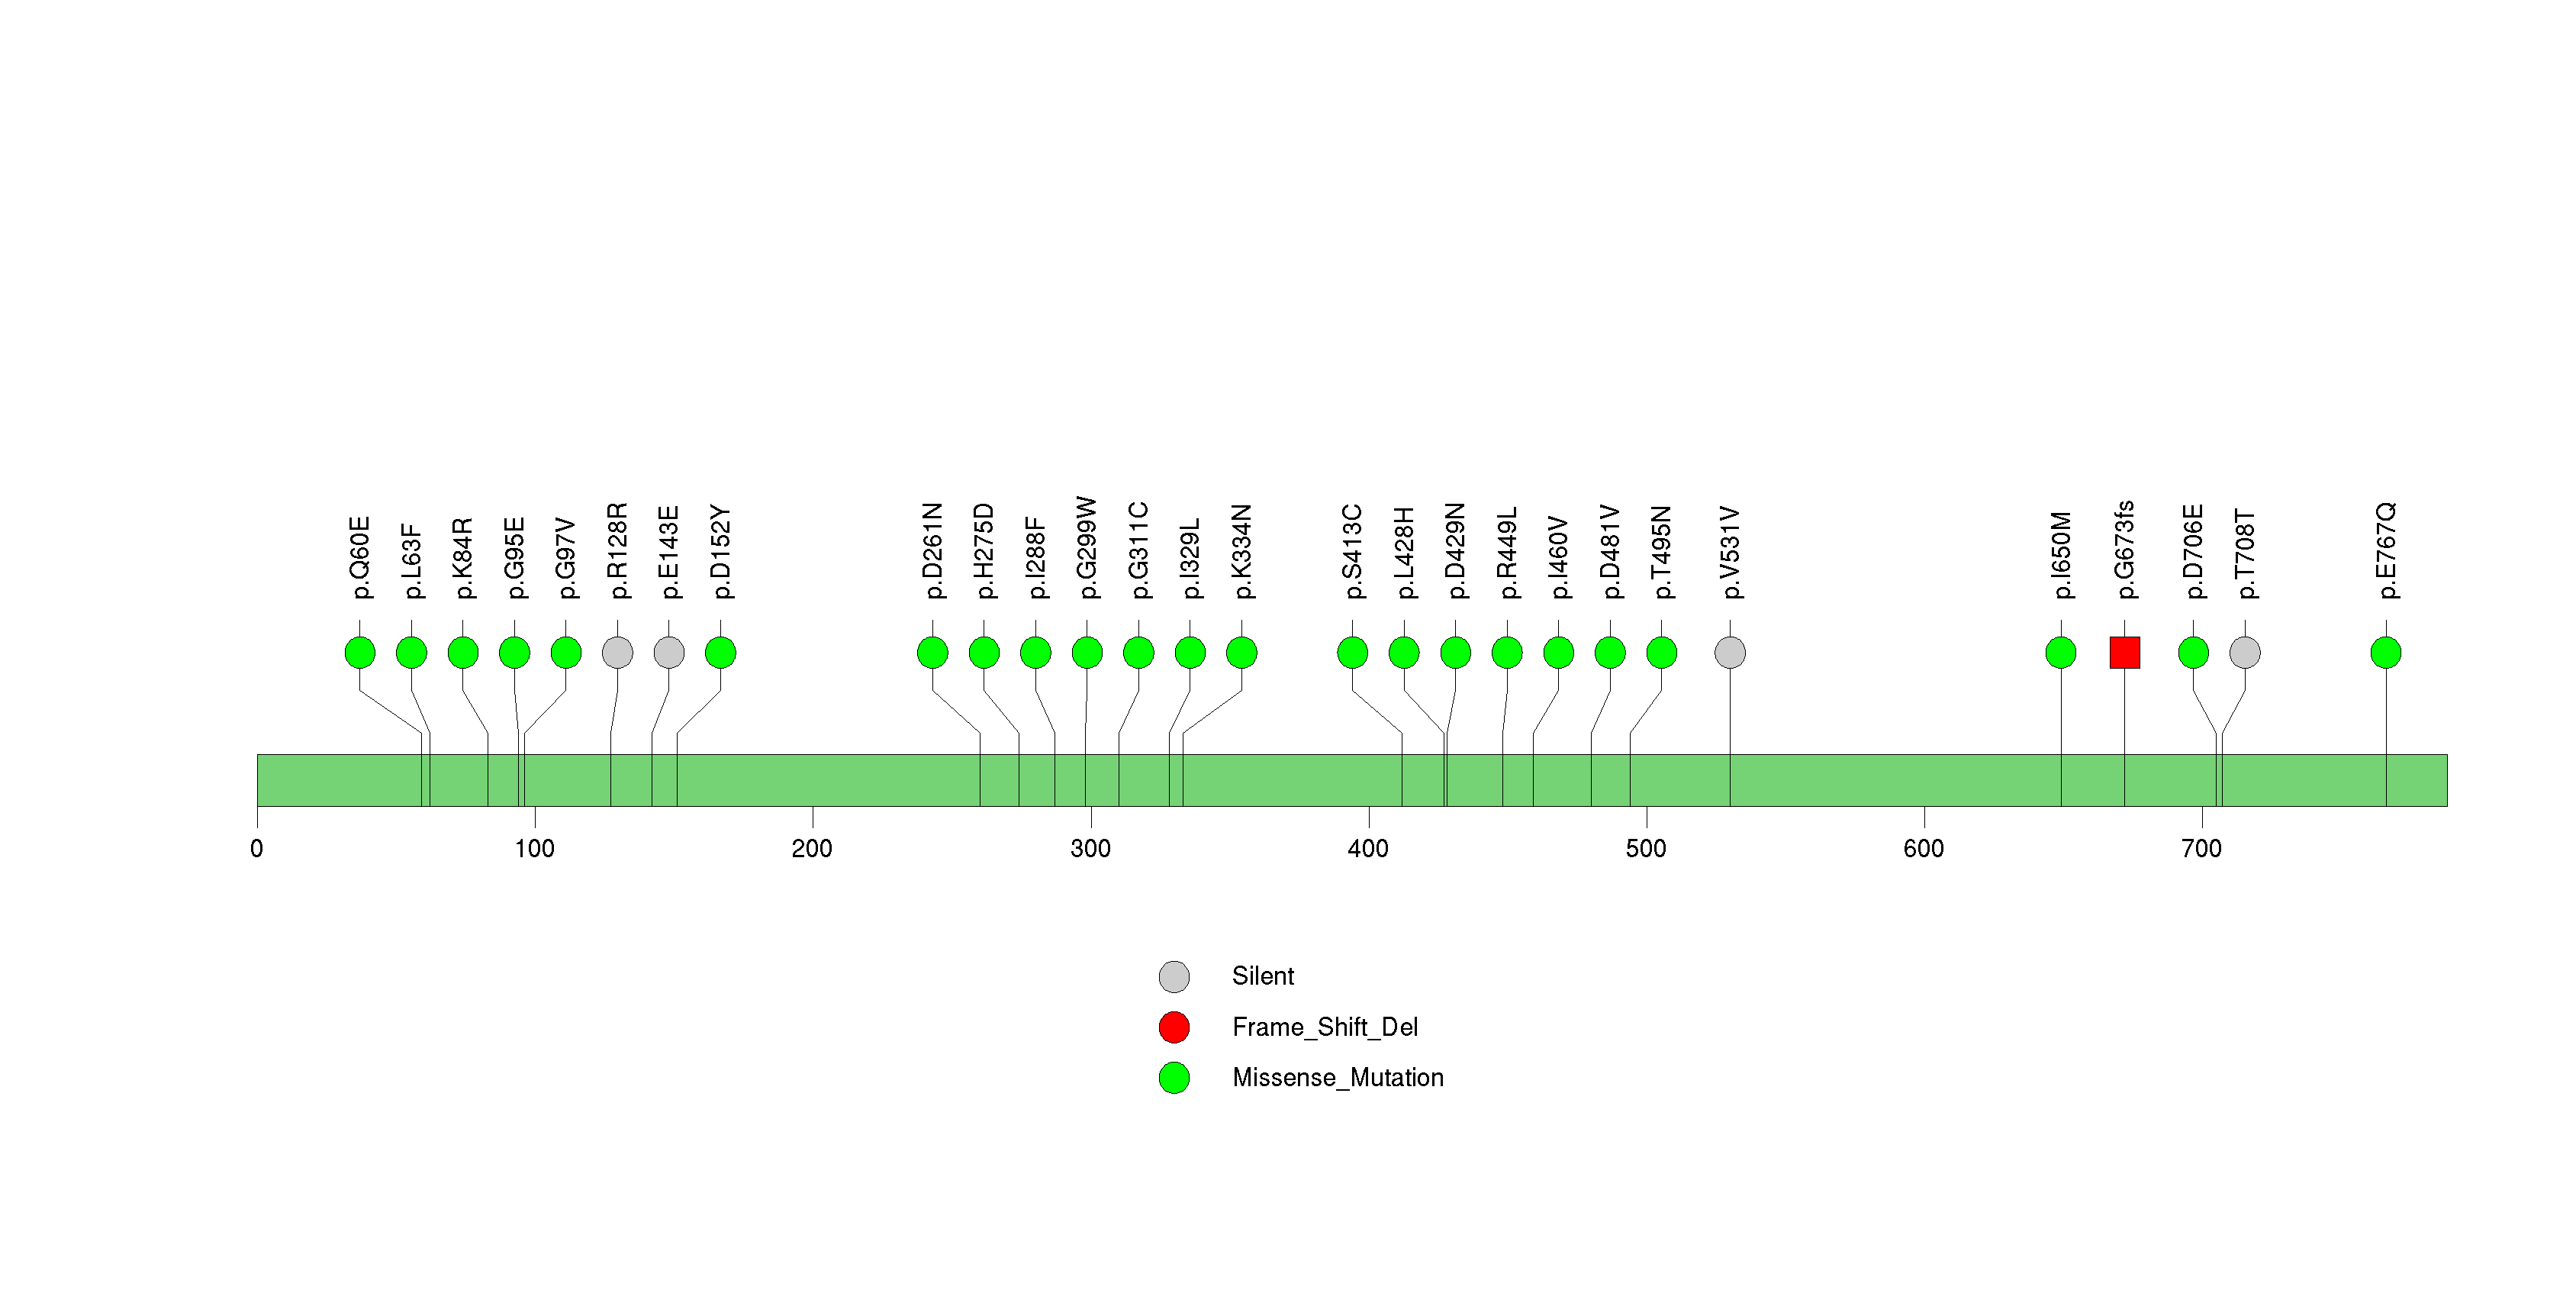
Figure S18. This figure depicts the distribution of mutations and mutation types across the KCNT2 significant gene.
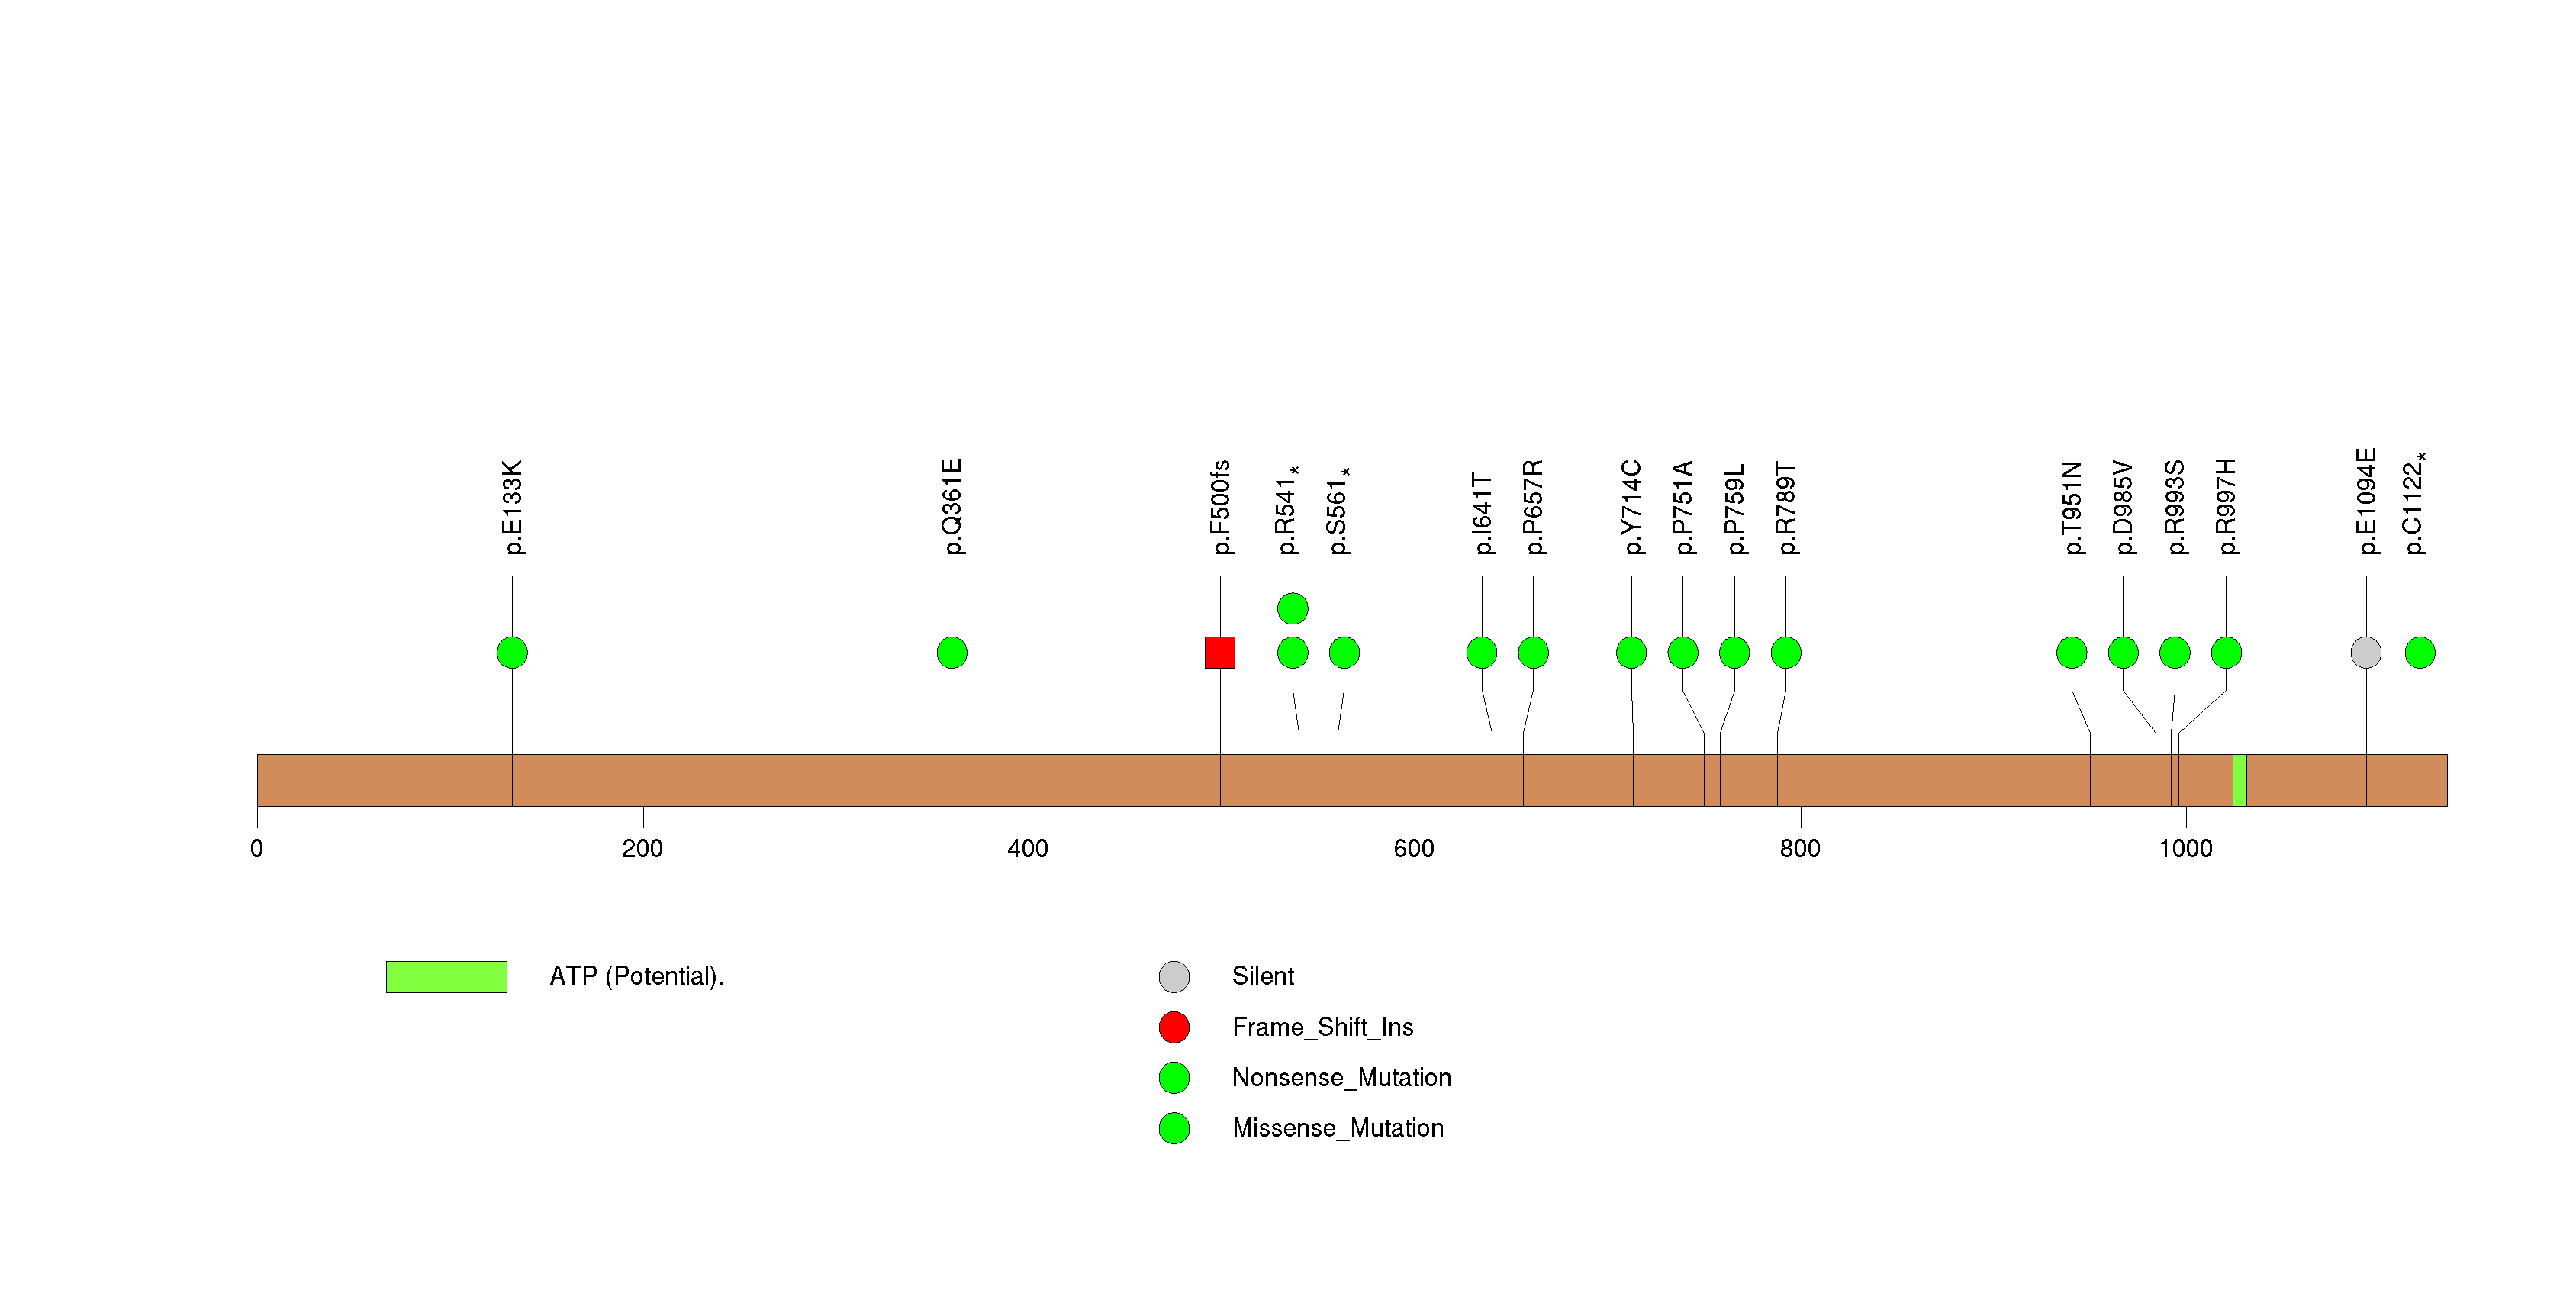
Figure S19. This figure depicts the distribution of mutations and mutation types across the RASA1 significant gene.
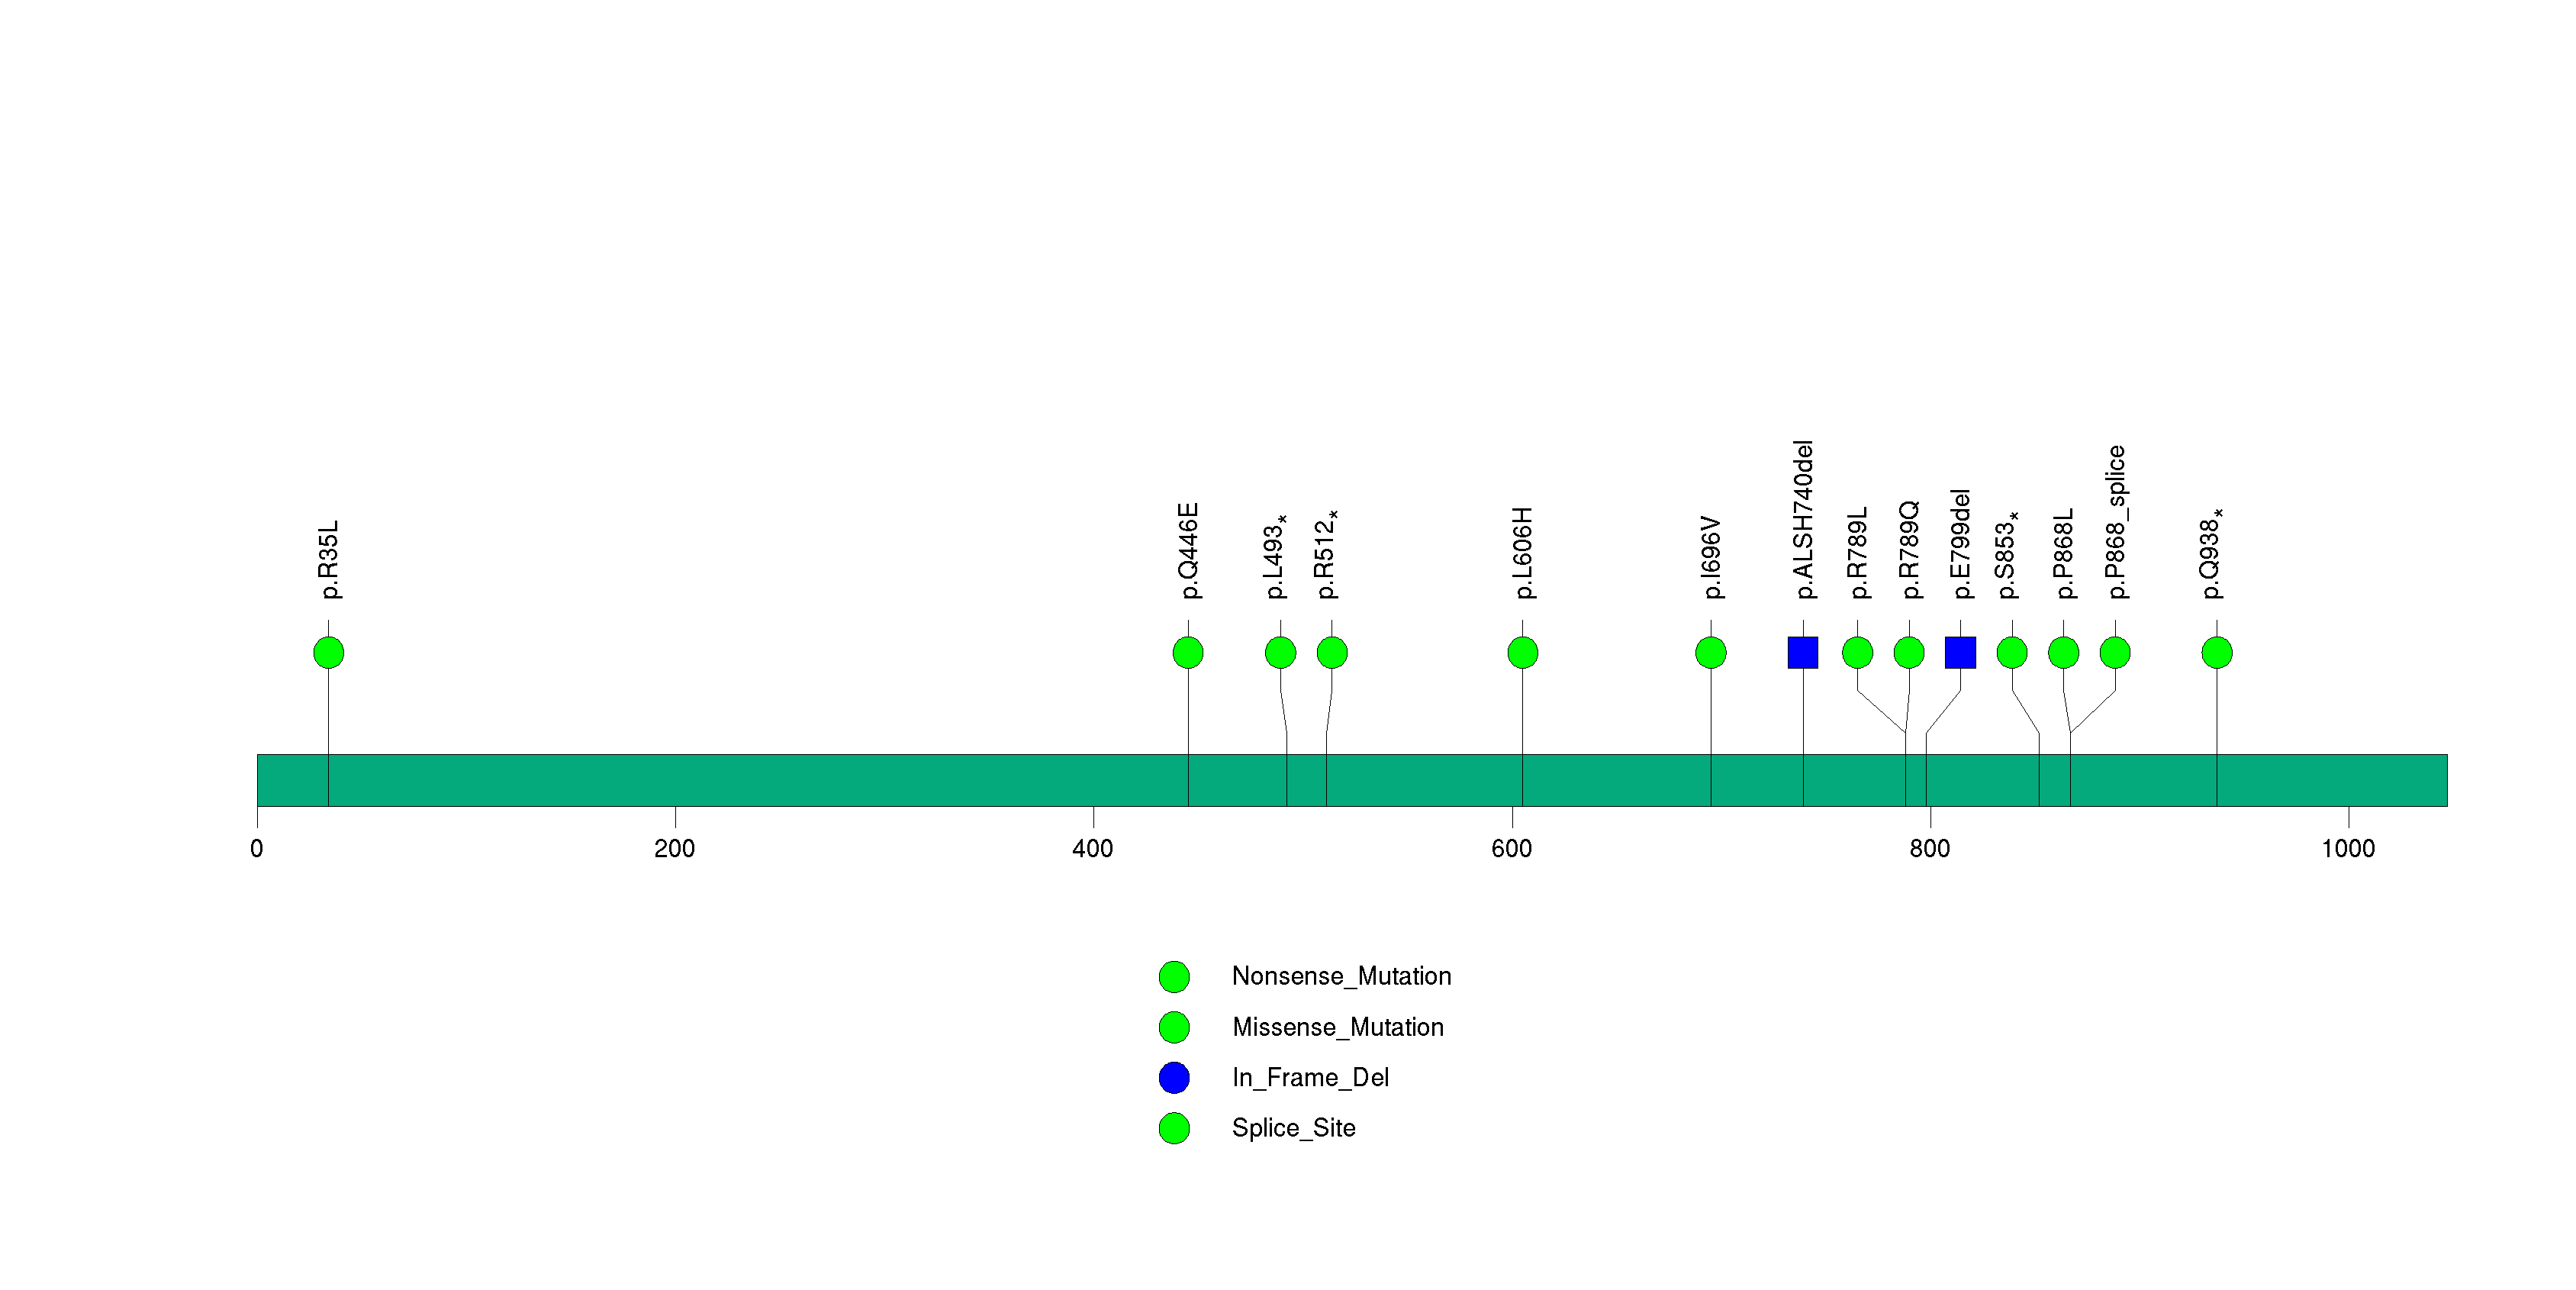
Figure S20. This figure depicts the distribution of mutations and mutation types across the EP300 significant gene.
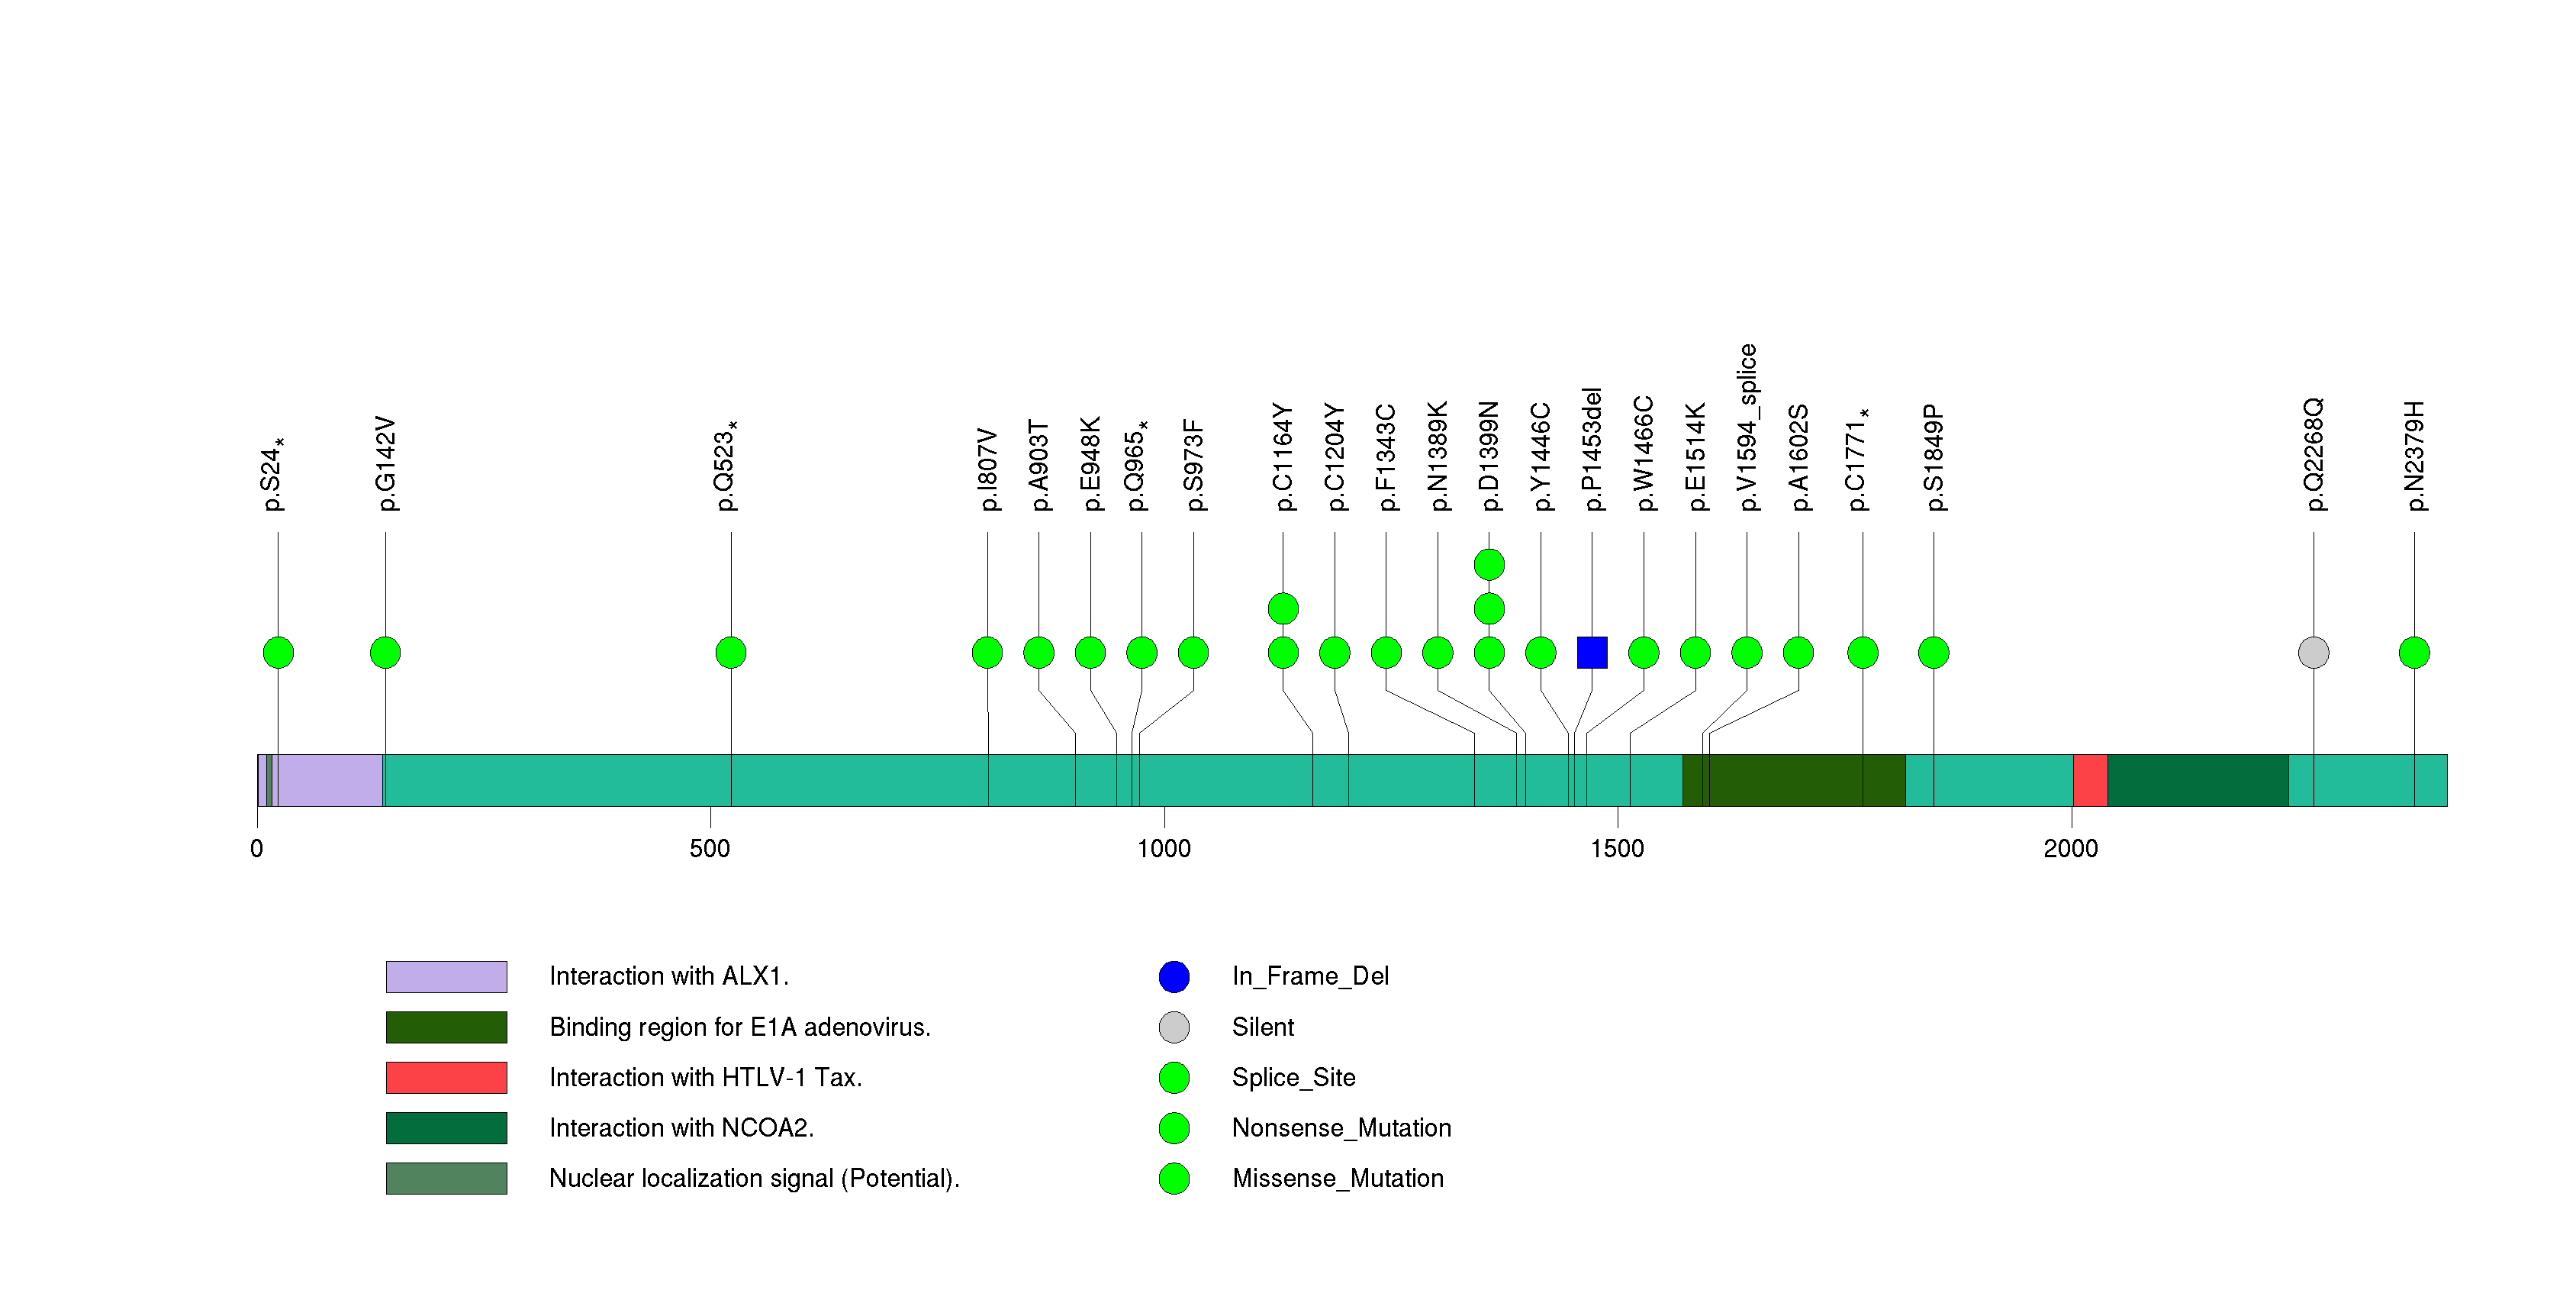
Figure S21. This figure depicts the distribution of mutations and mutation types across the LCP1 significant gene.
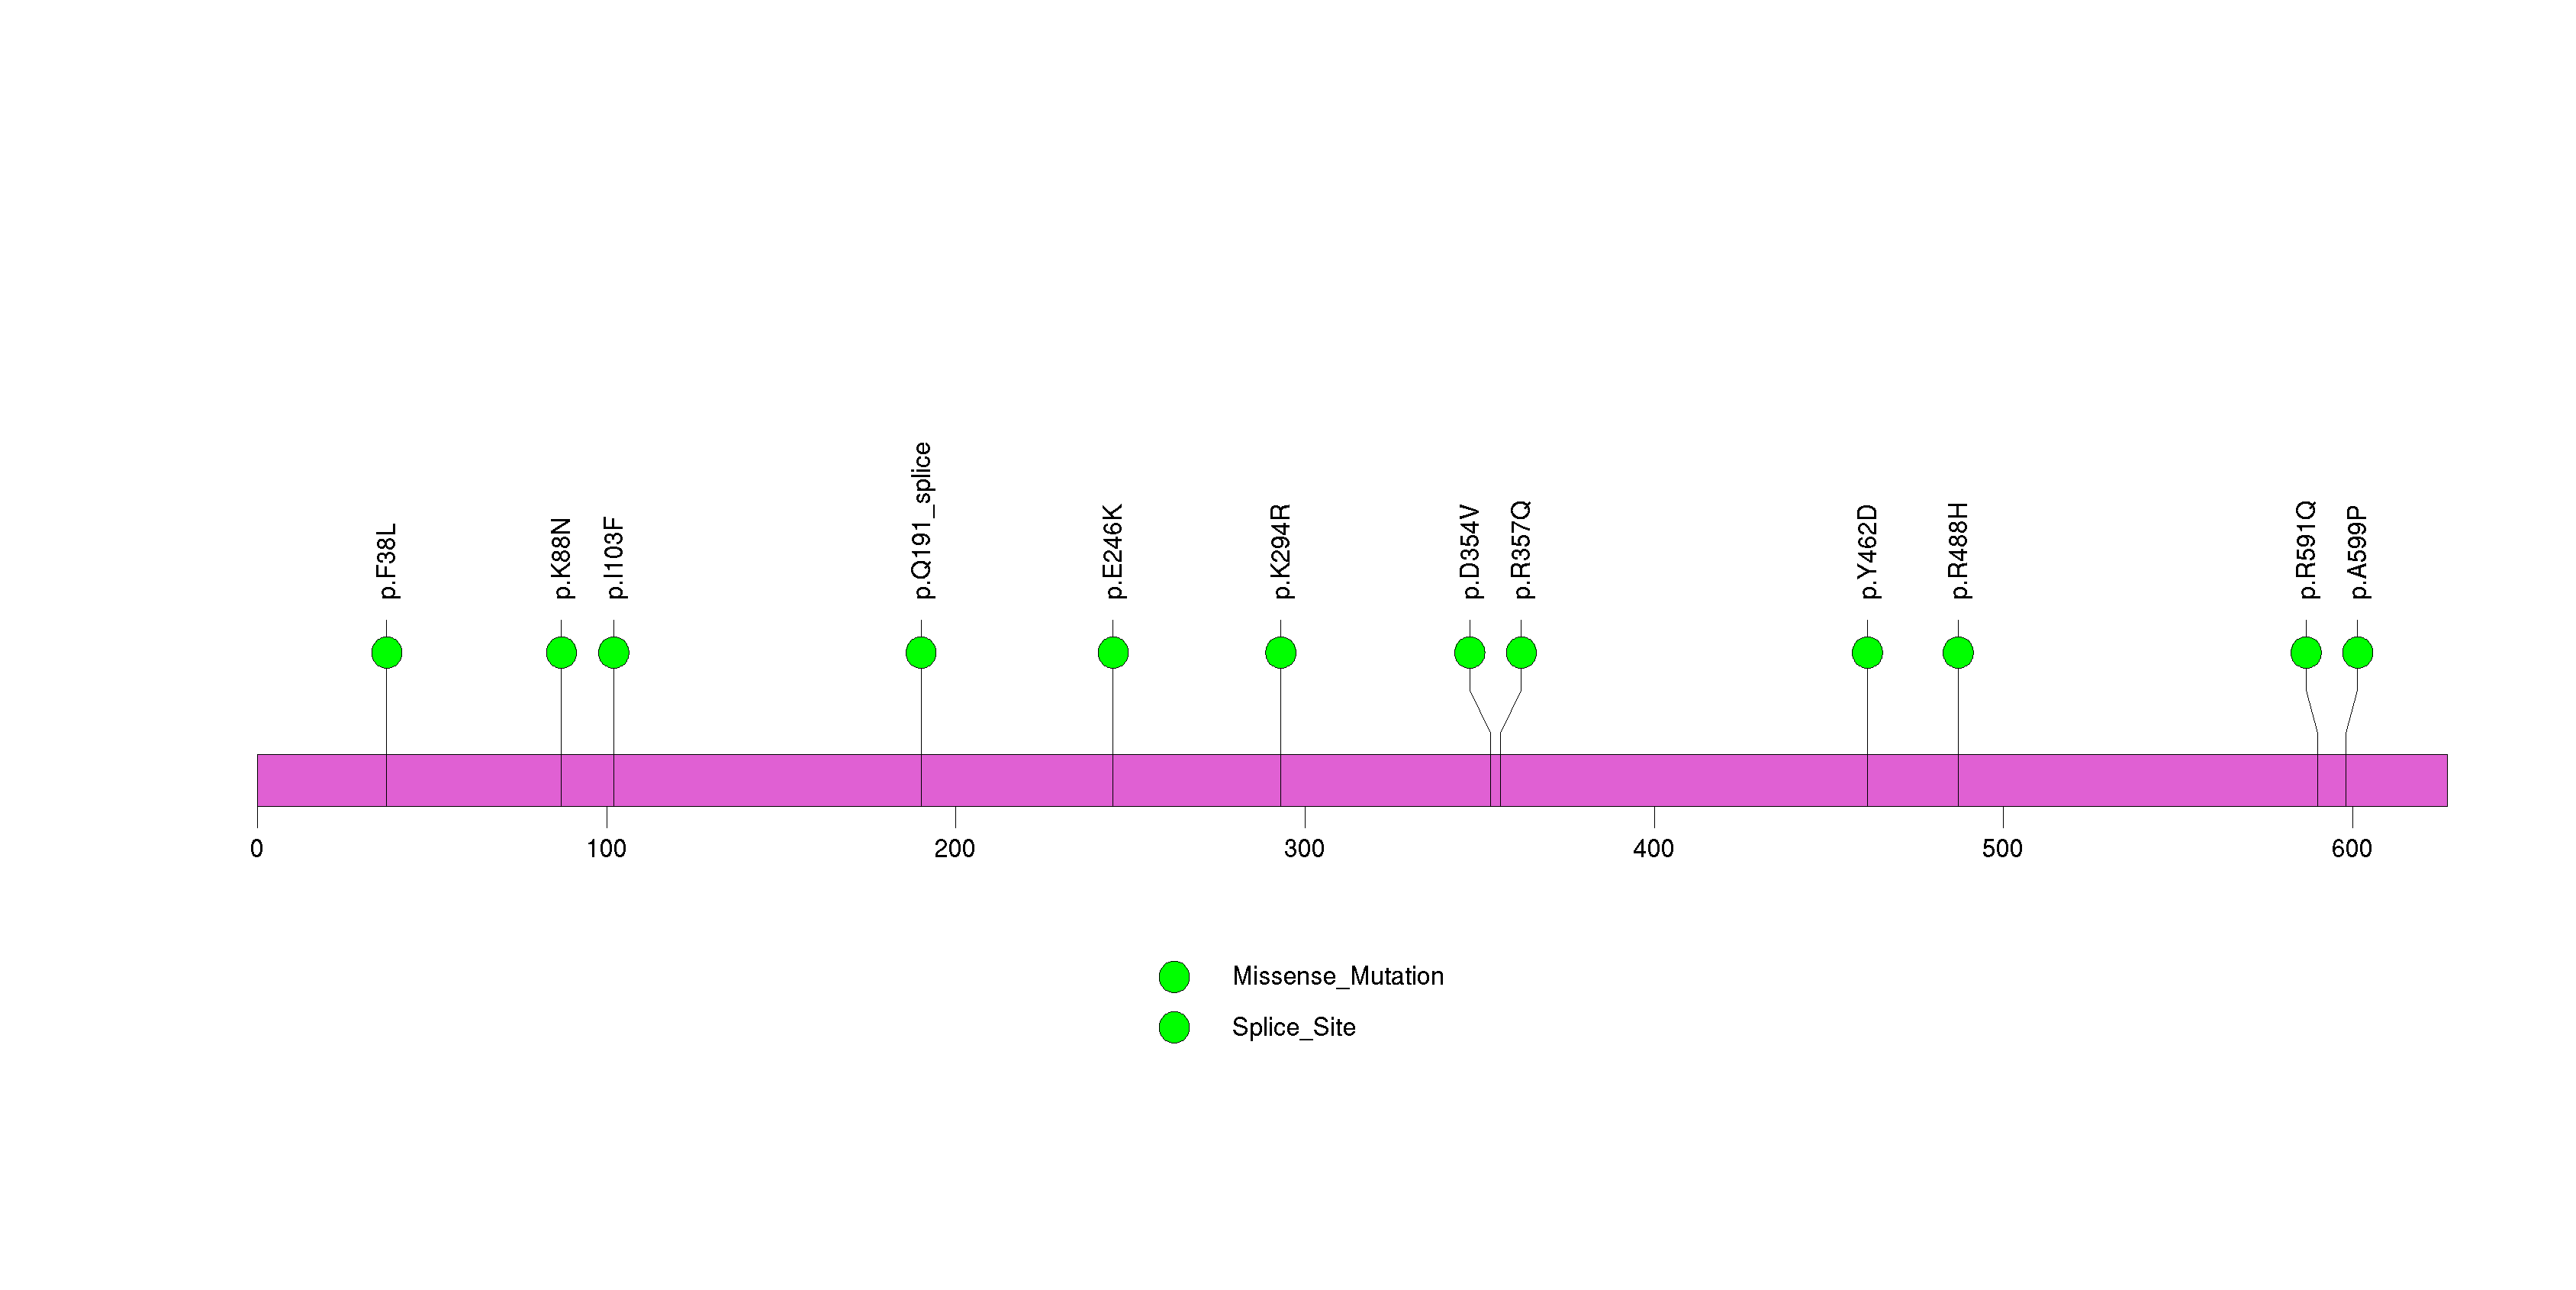
Figure S22. This figure depicts the distribution of mutations and mutation types across the PRAMEF11 significant gene.
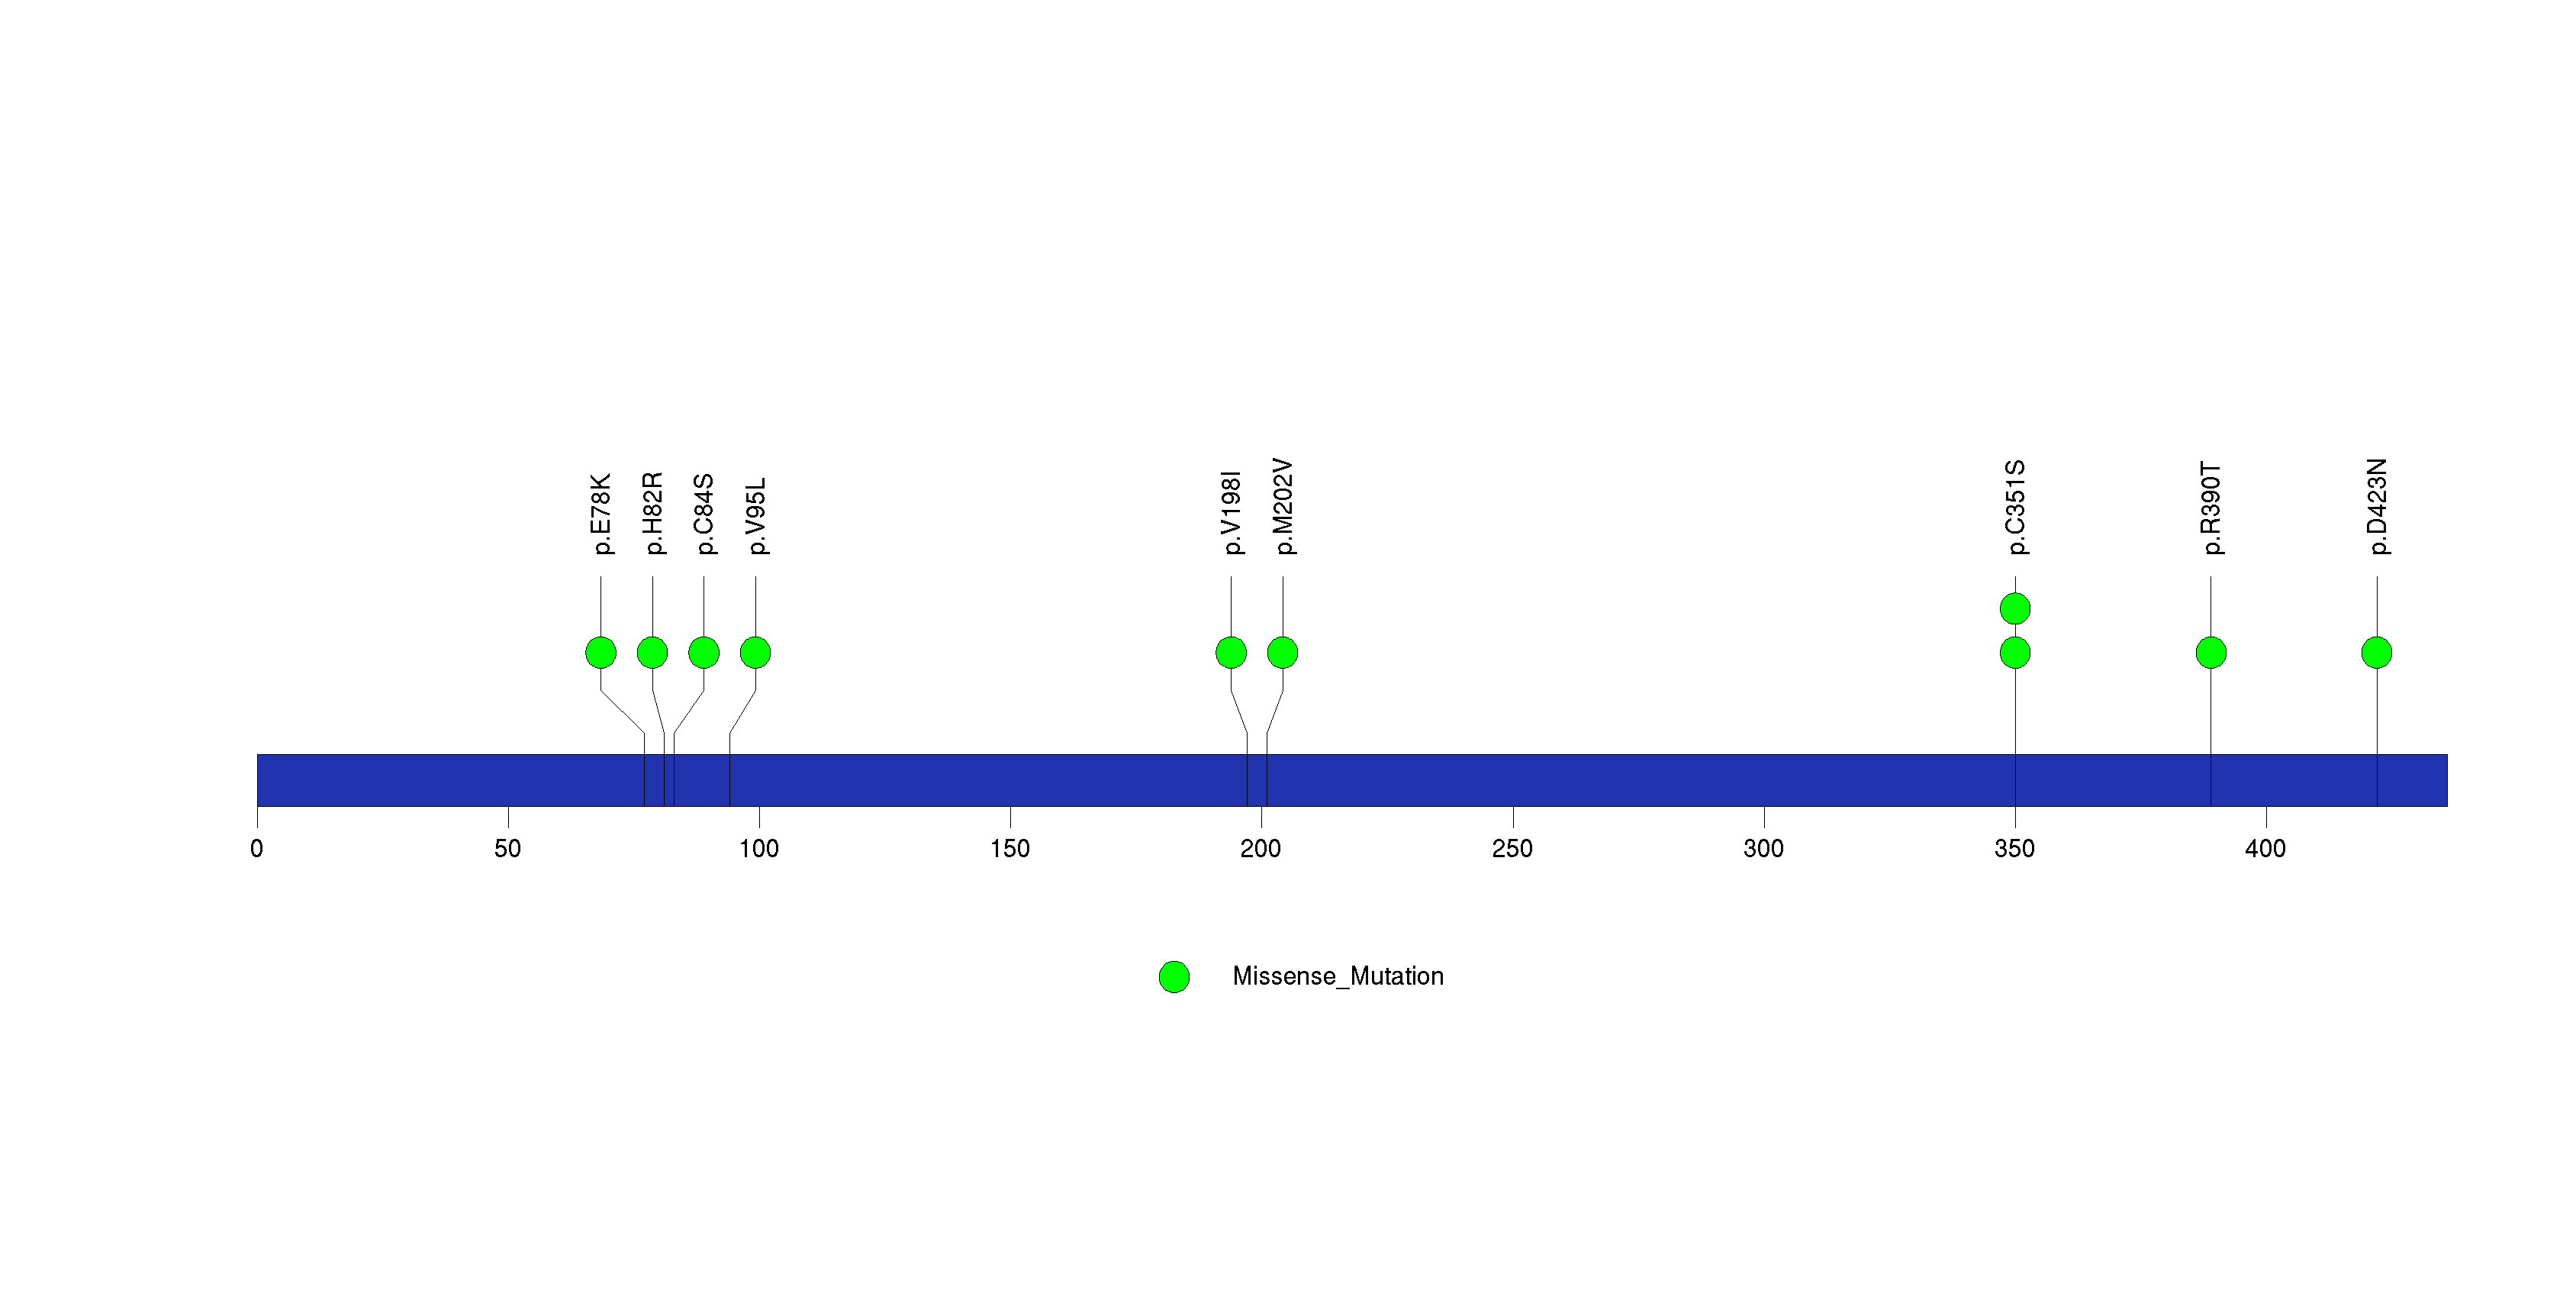
Figure S23. This figure depicts the distribution of mutations and mutation types across the PRSS1 significant gene.
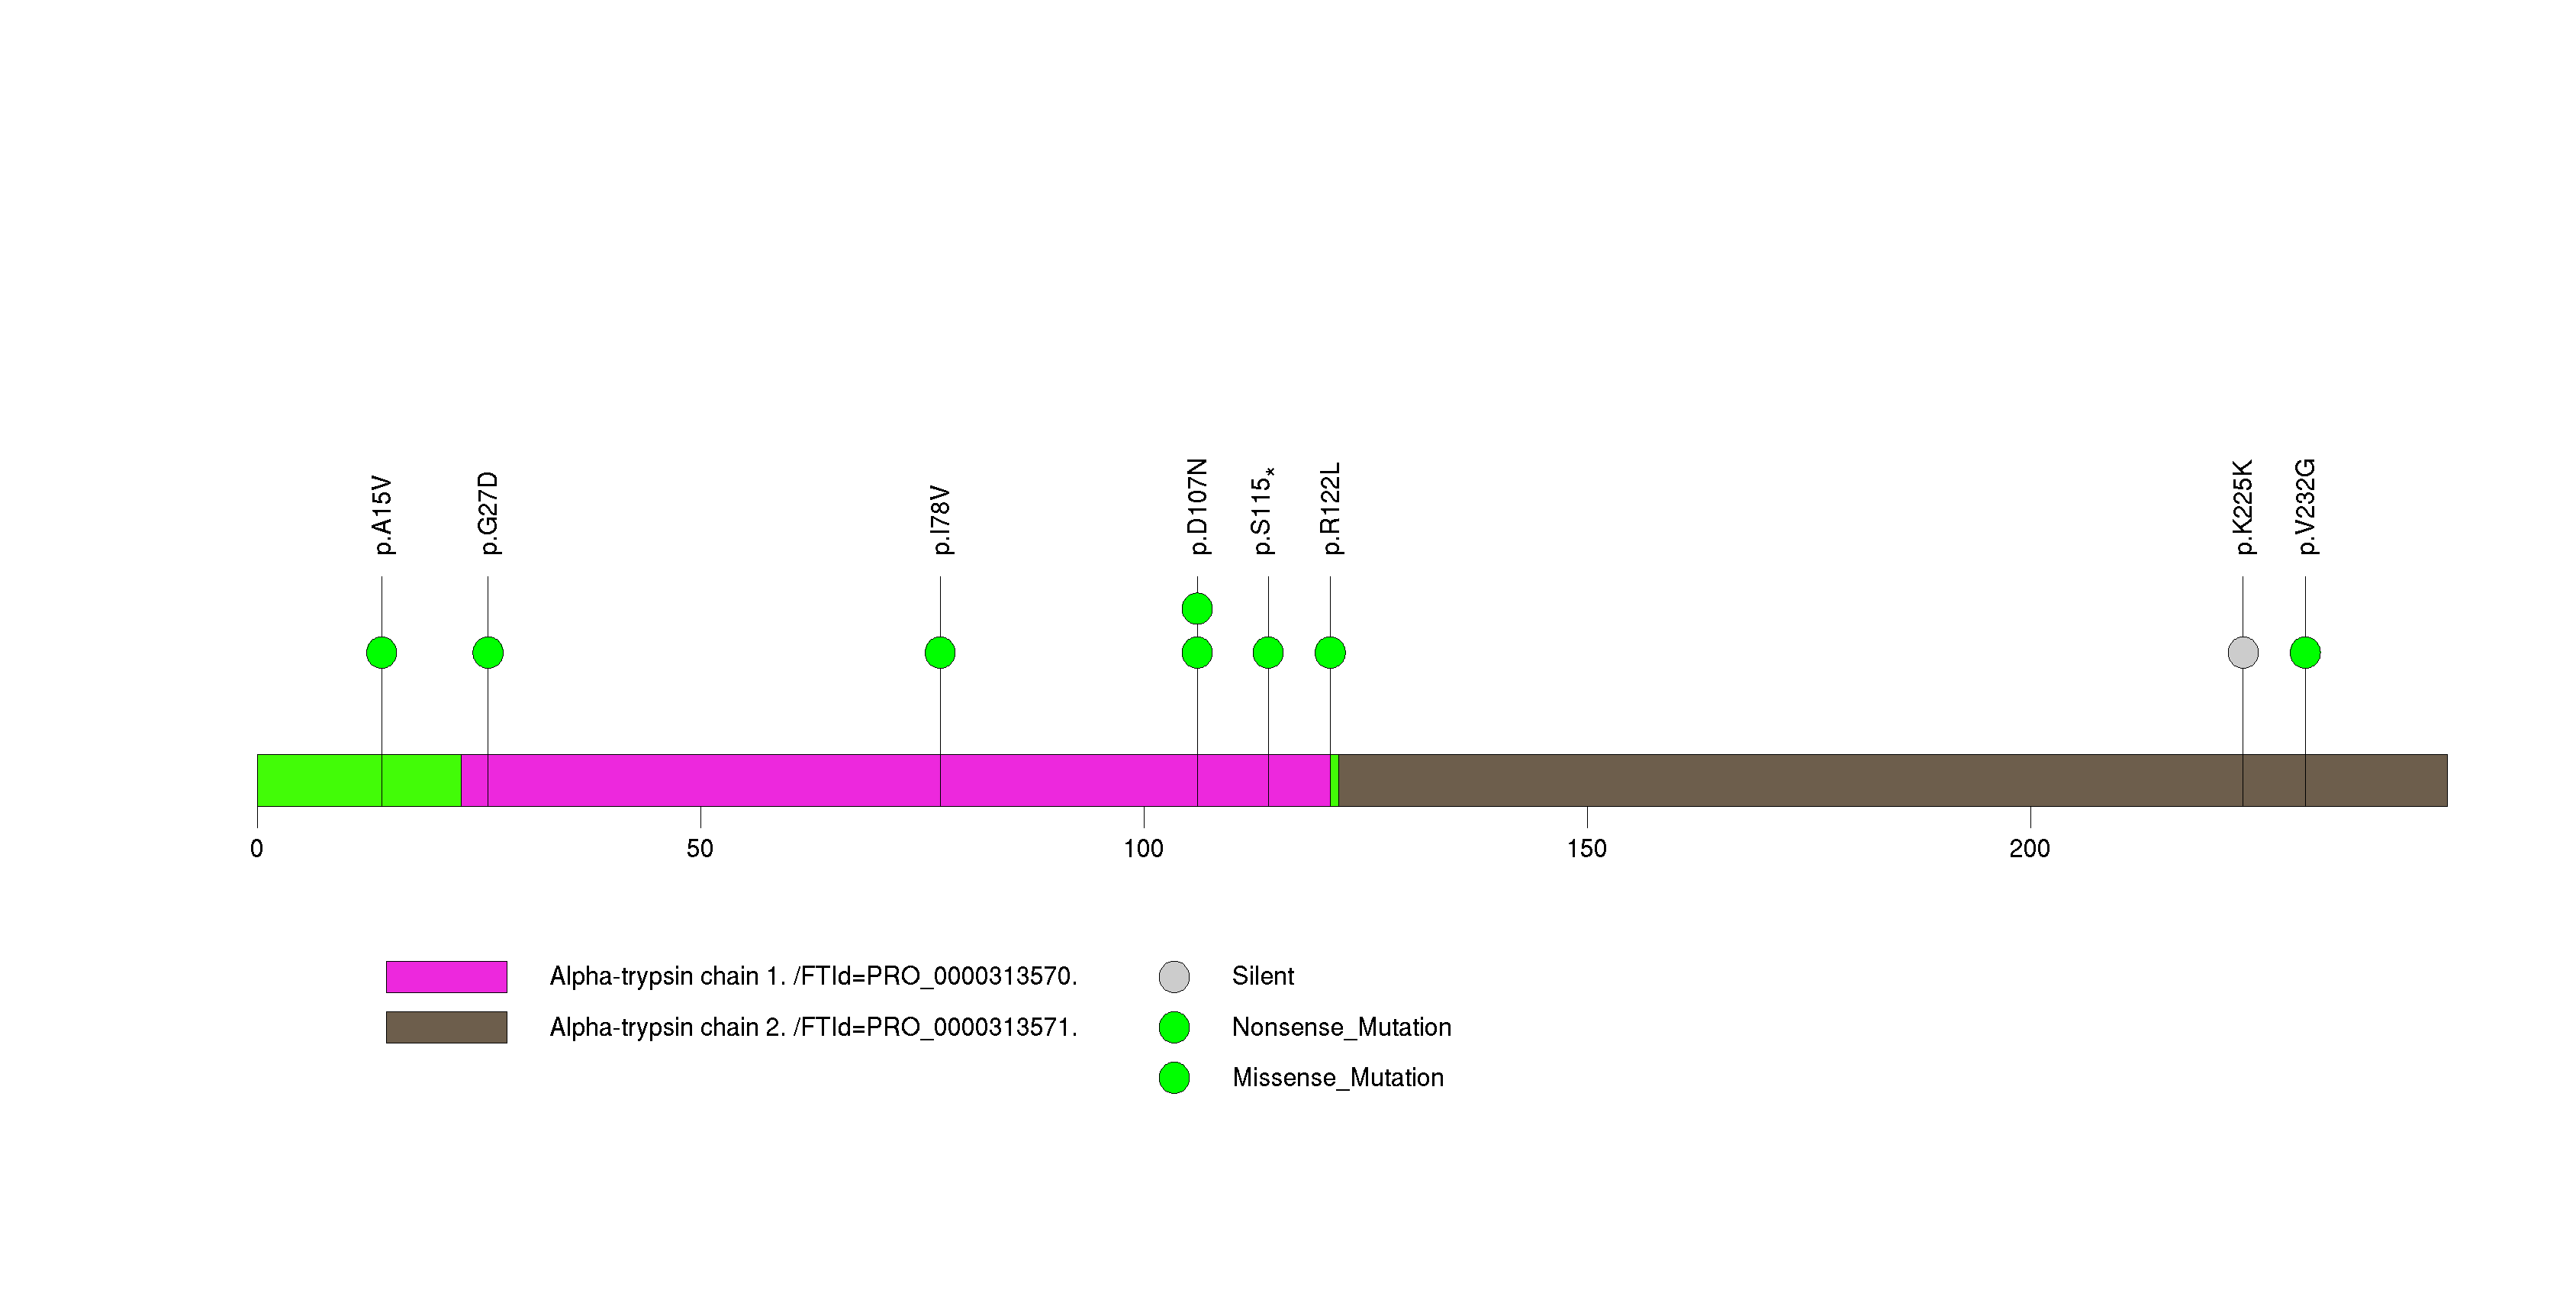
Figure S24. This figure depicts the distribution of mutations and mutation types across the FBXW7 significant gene.
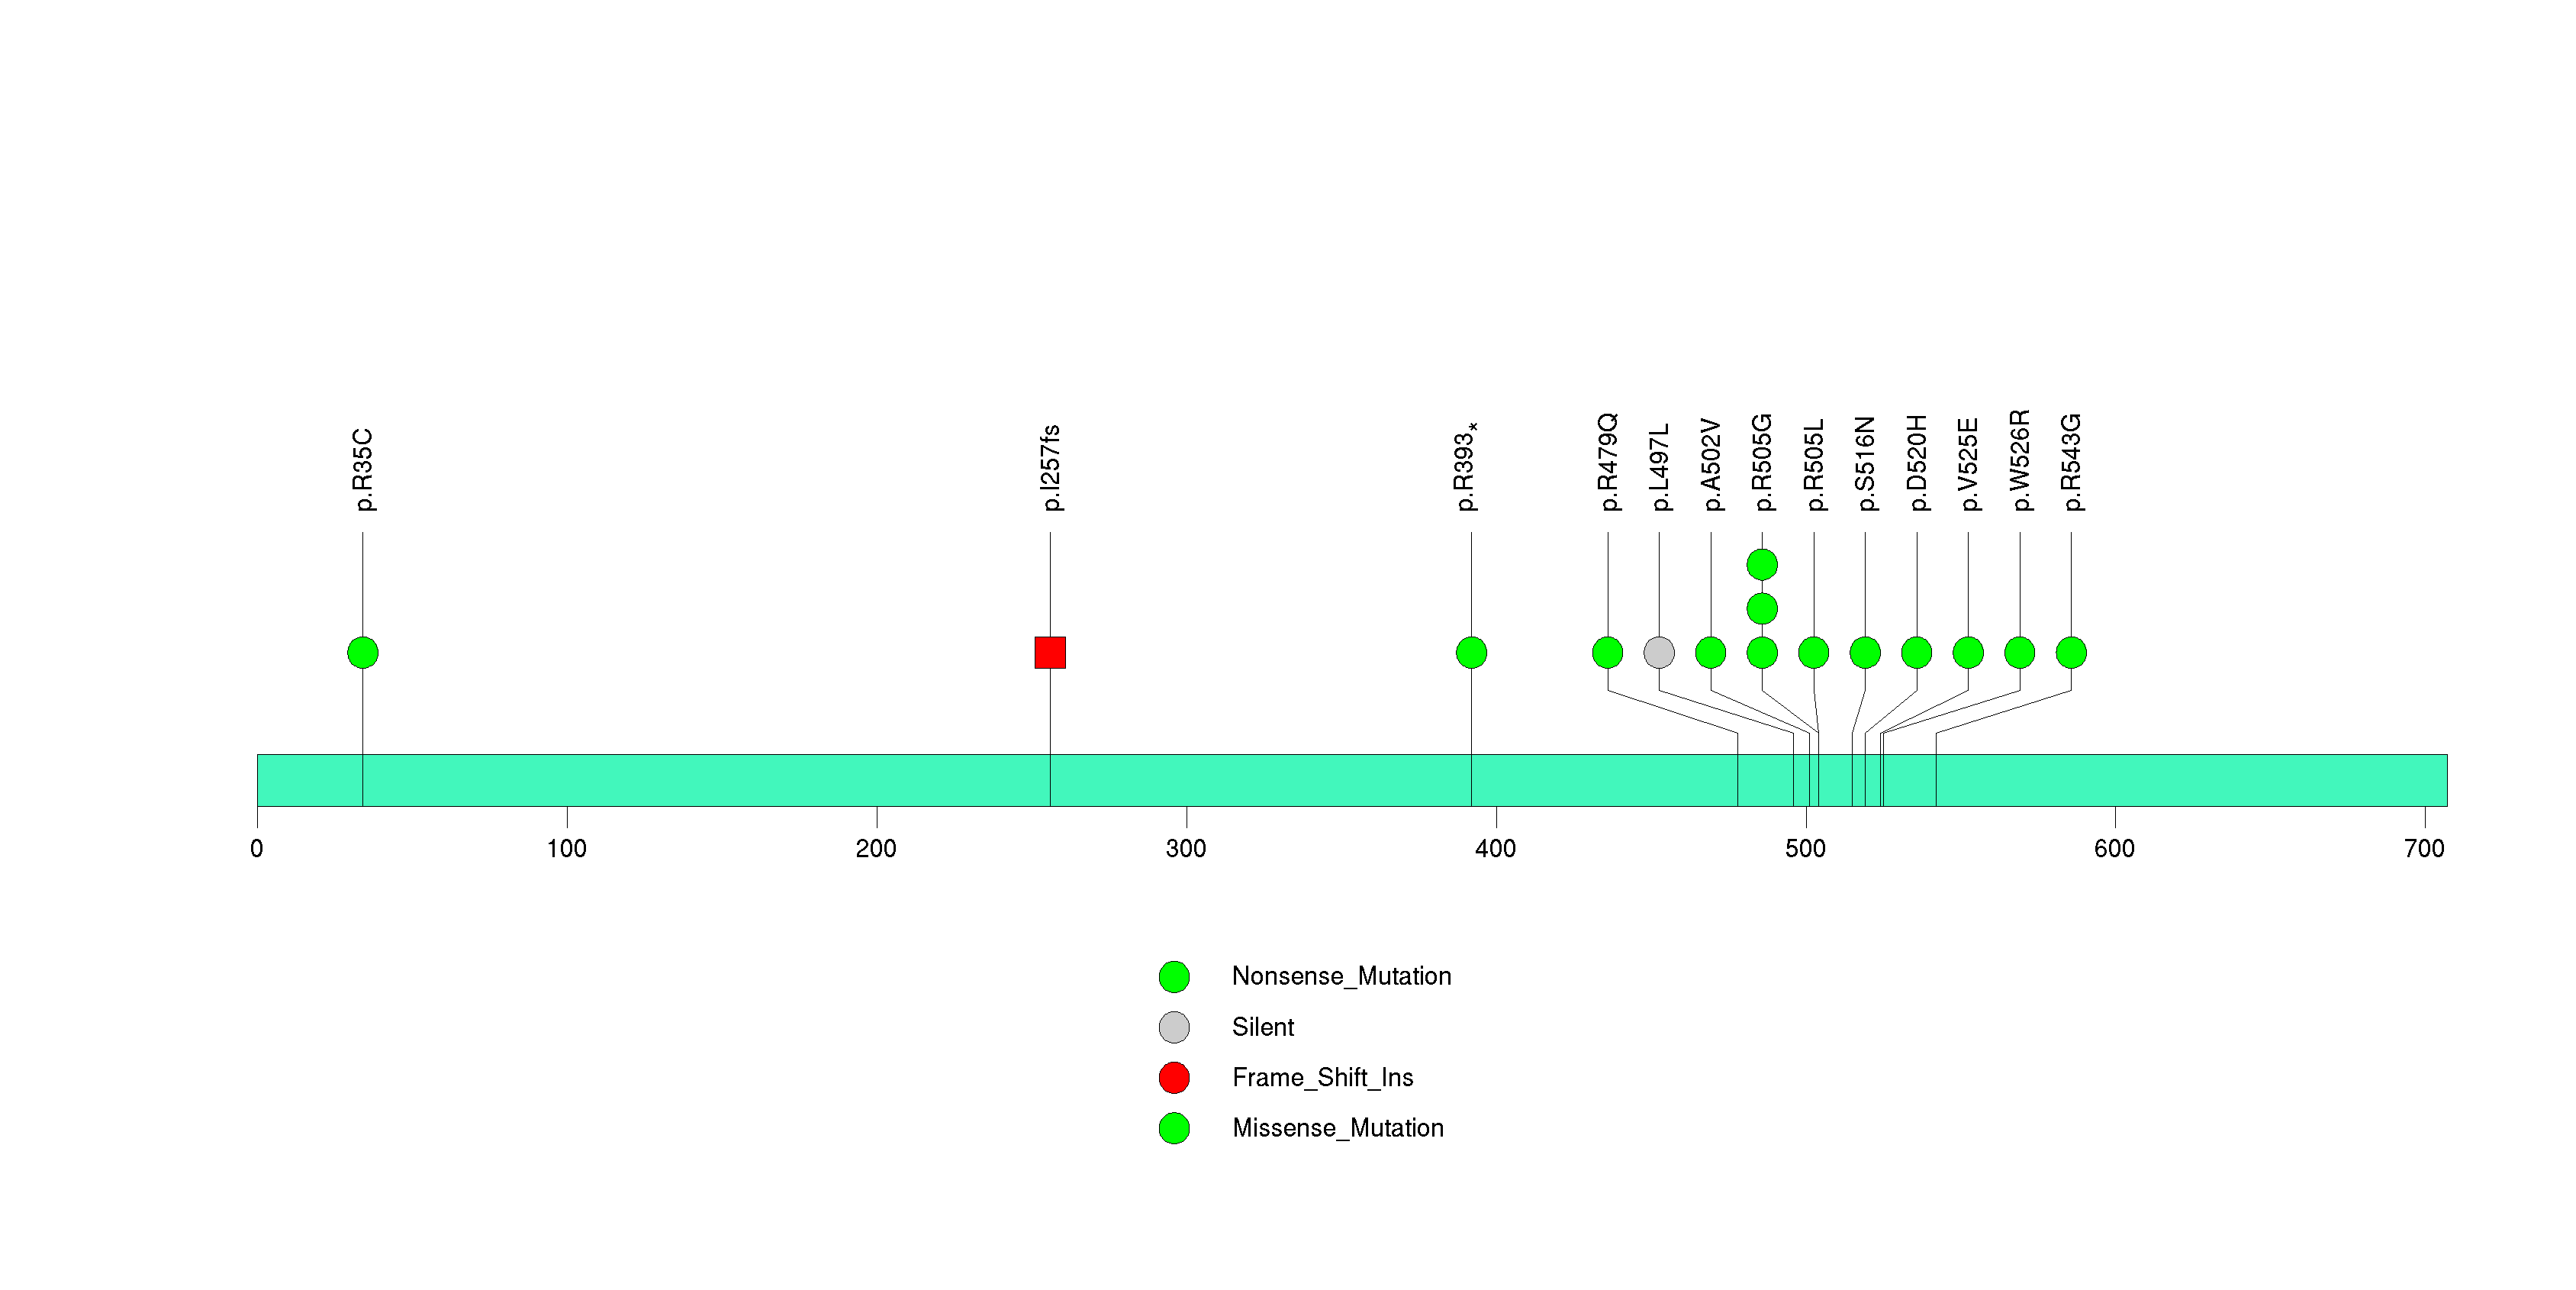
Figure S25. This figure depicts the distribution of mutations and mutation types across the PEG3 significant gene.
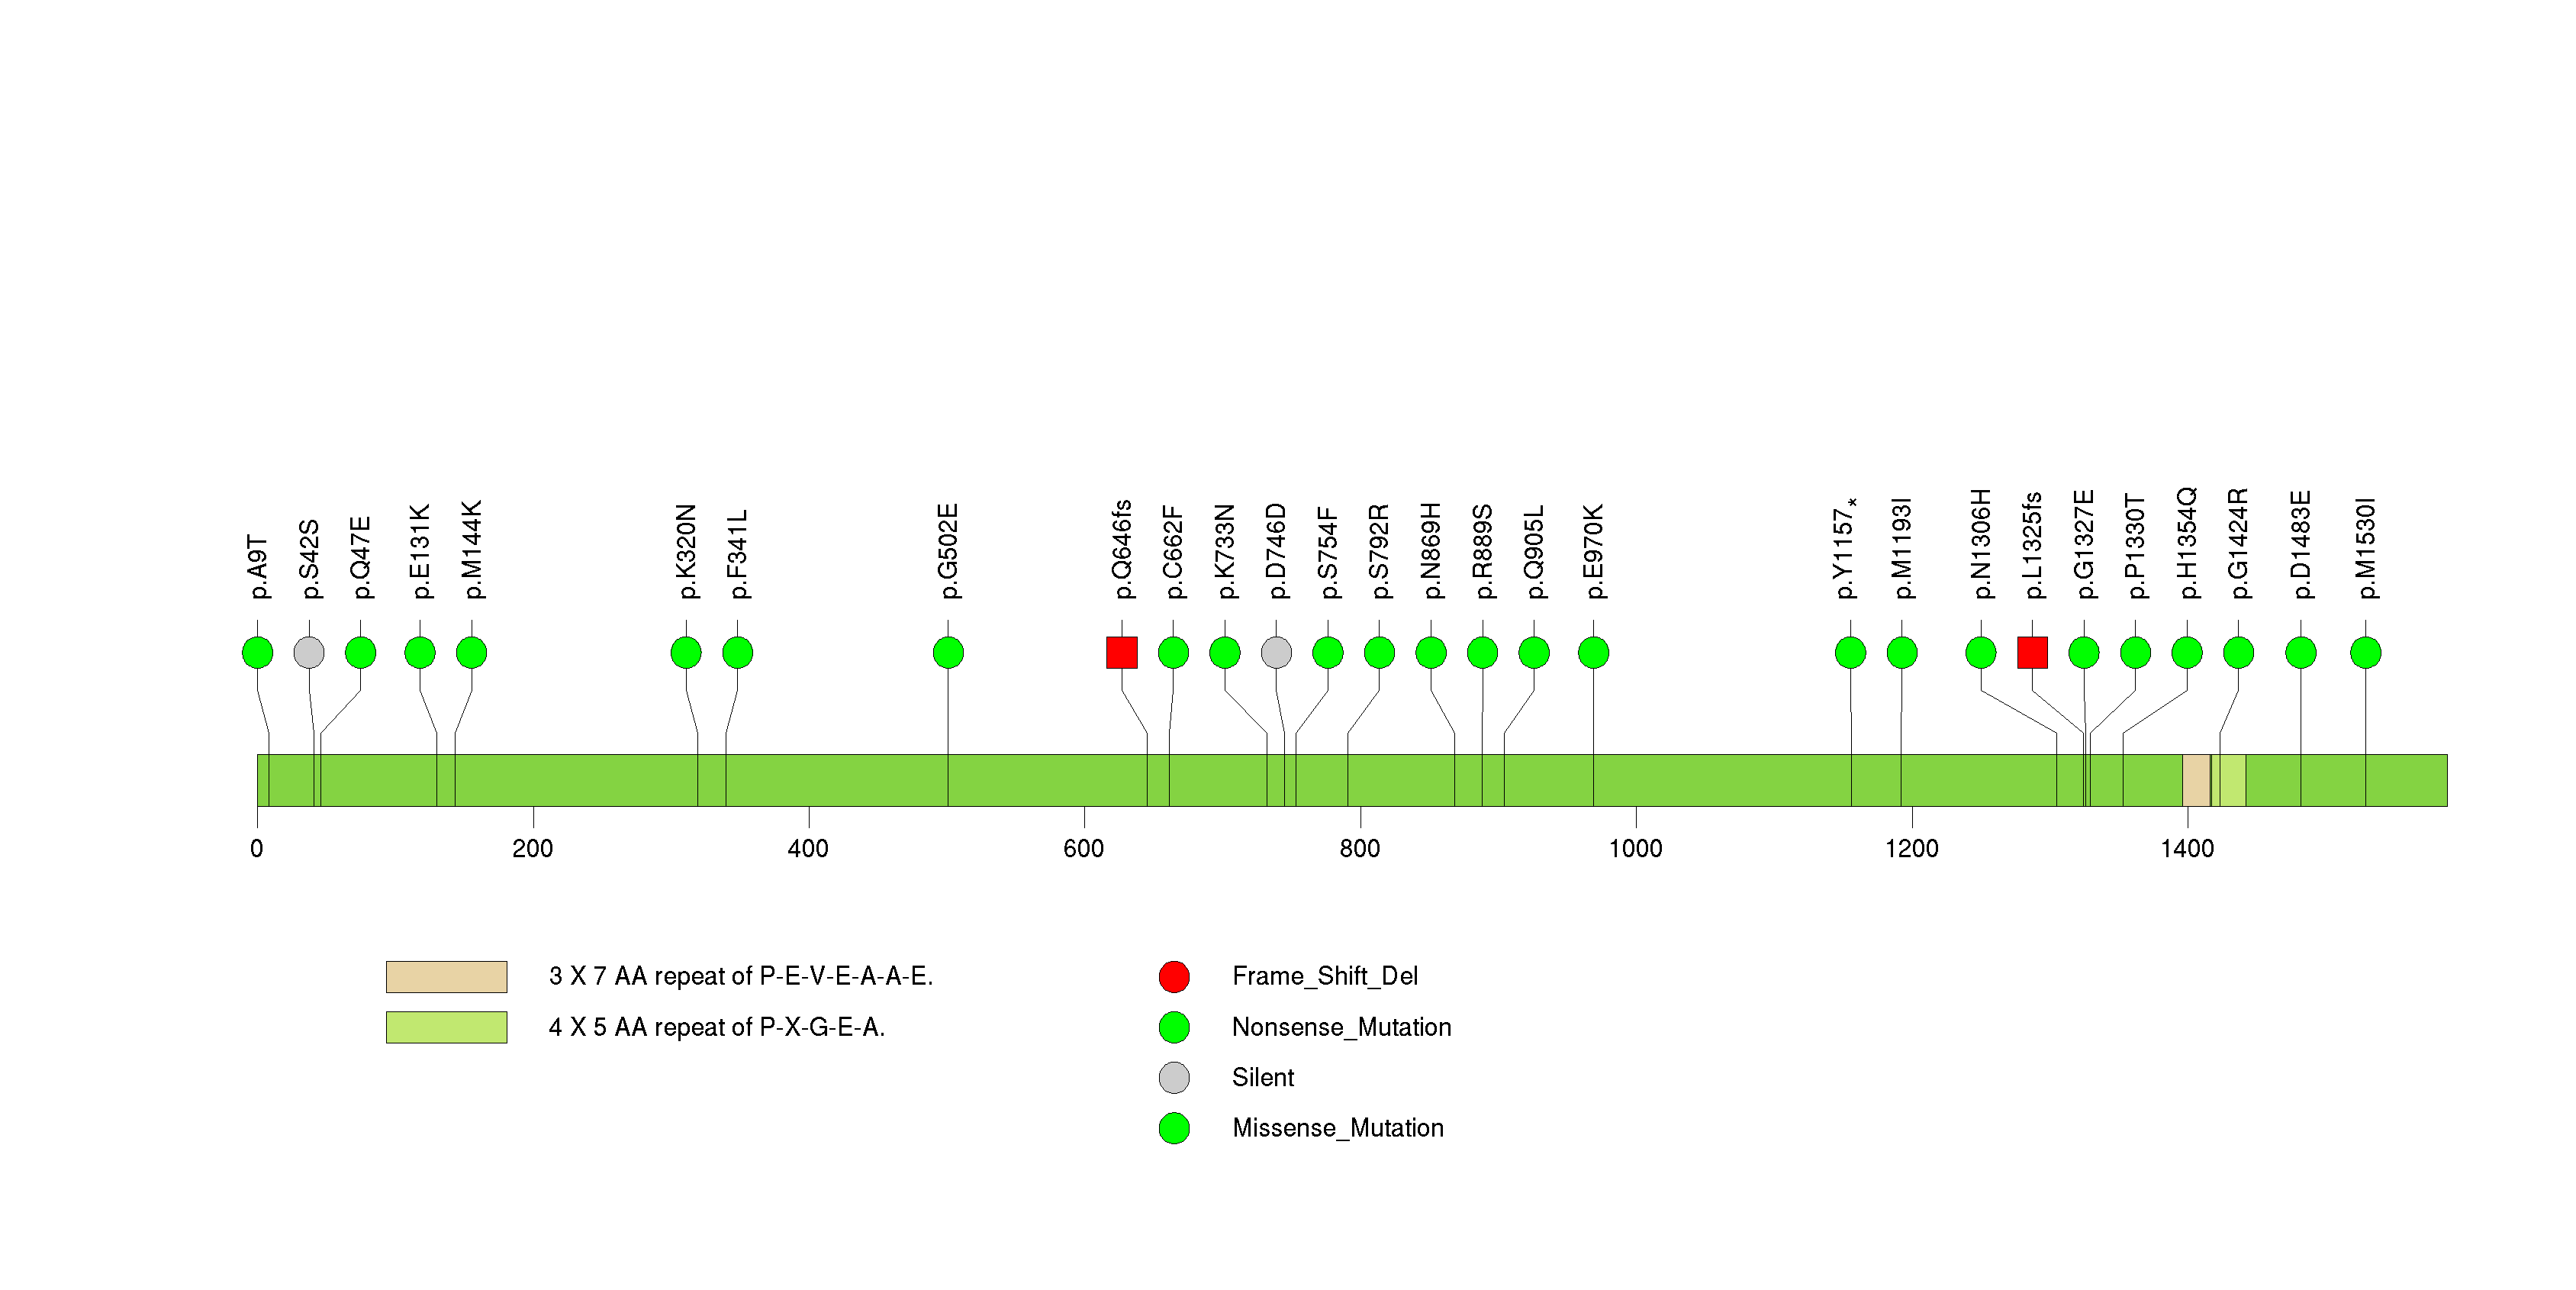
Figure S26. This figure depicts the distribution of mutations and mutation types across the REG1A significant gene.
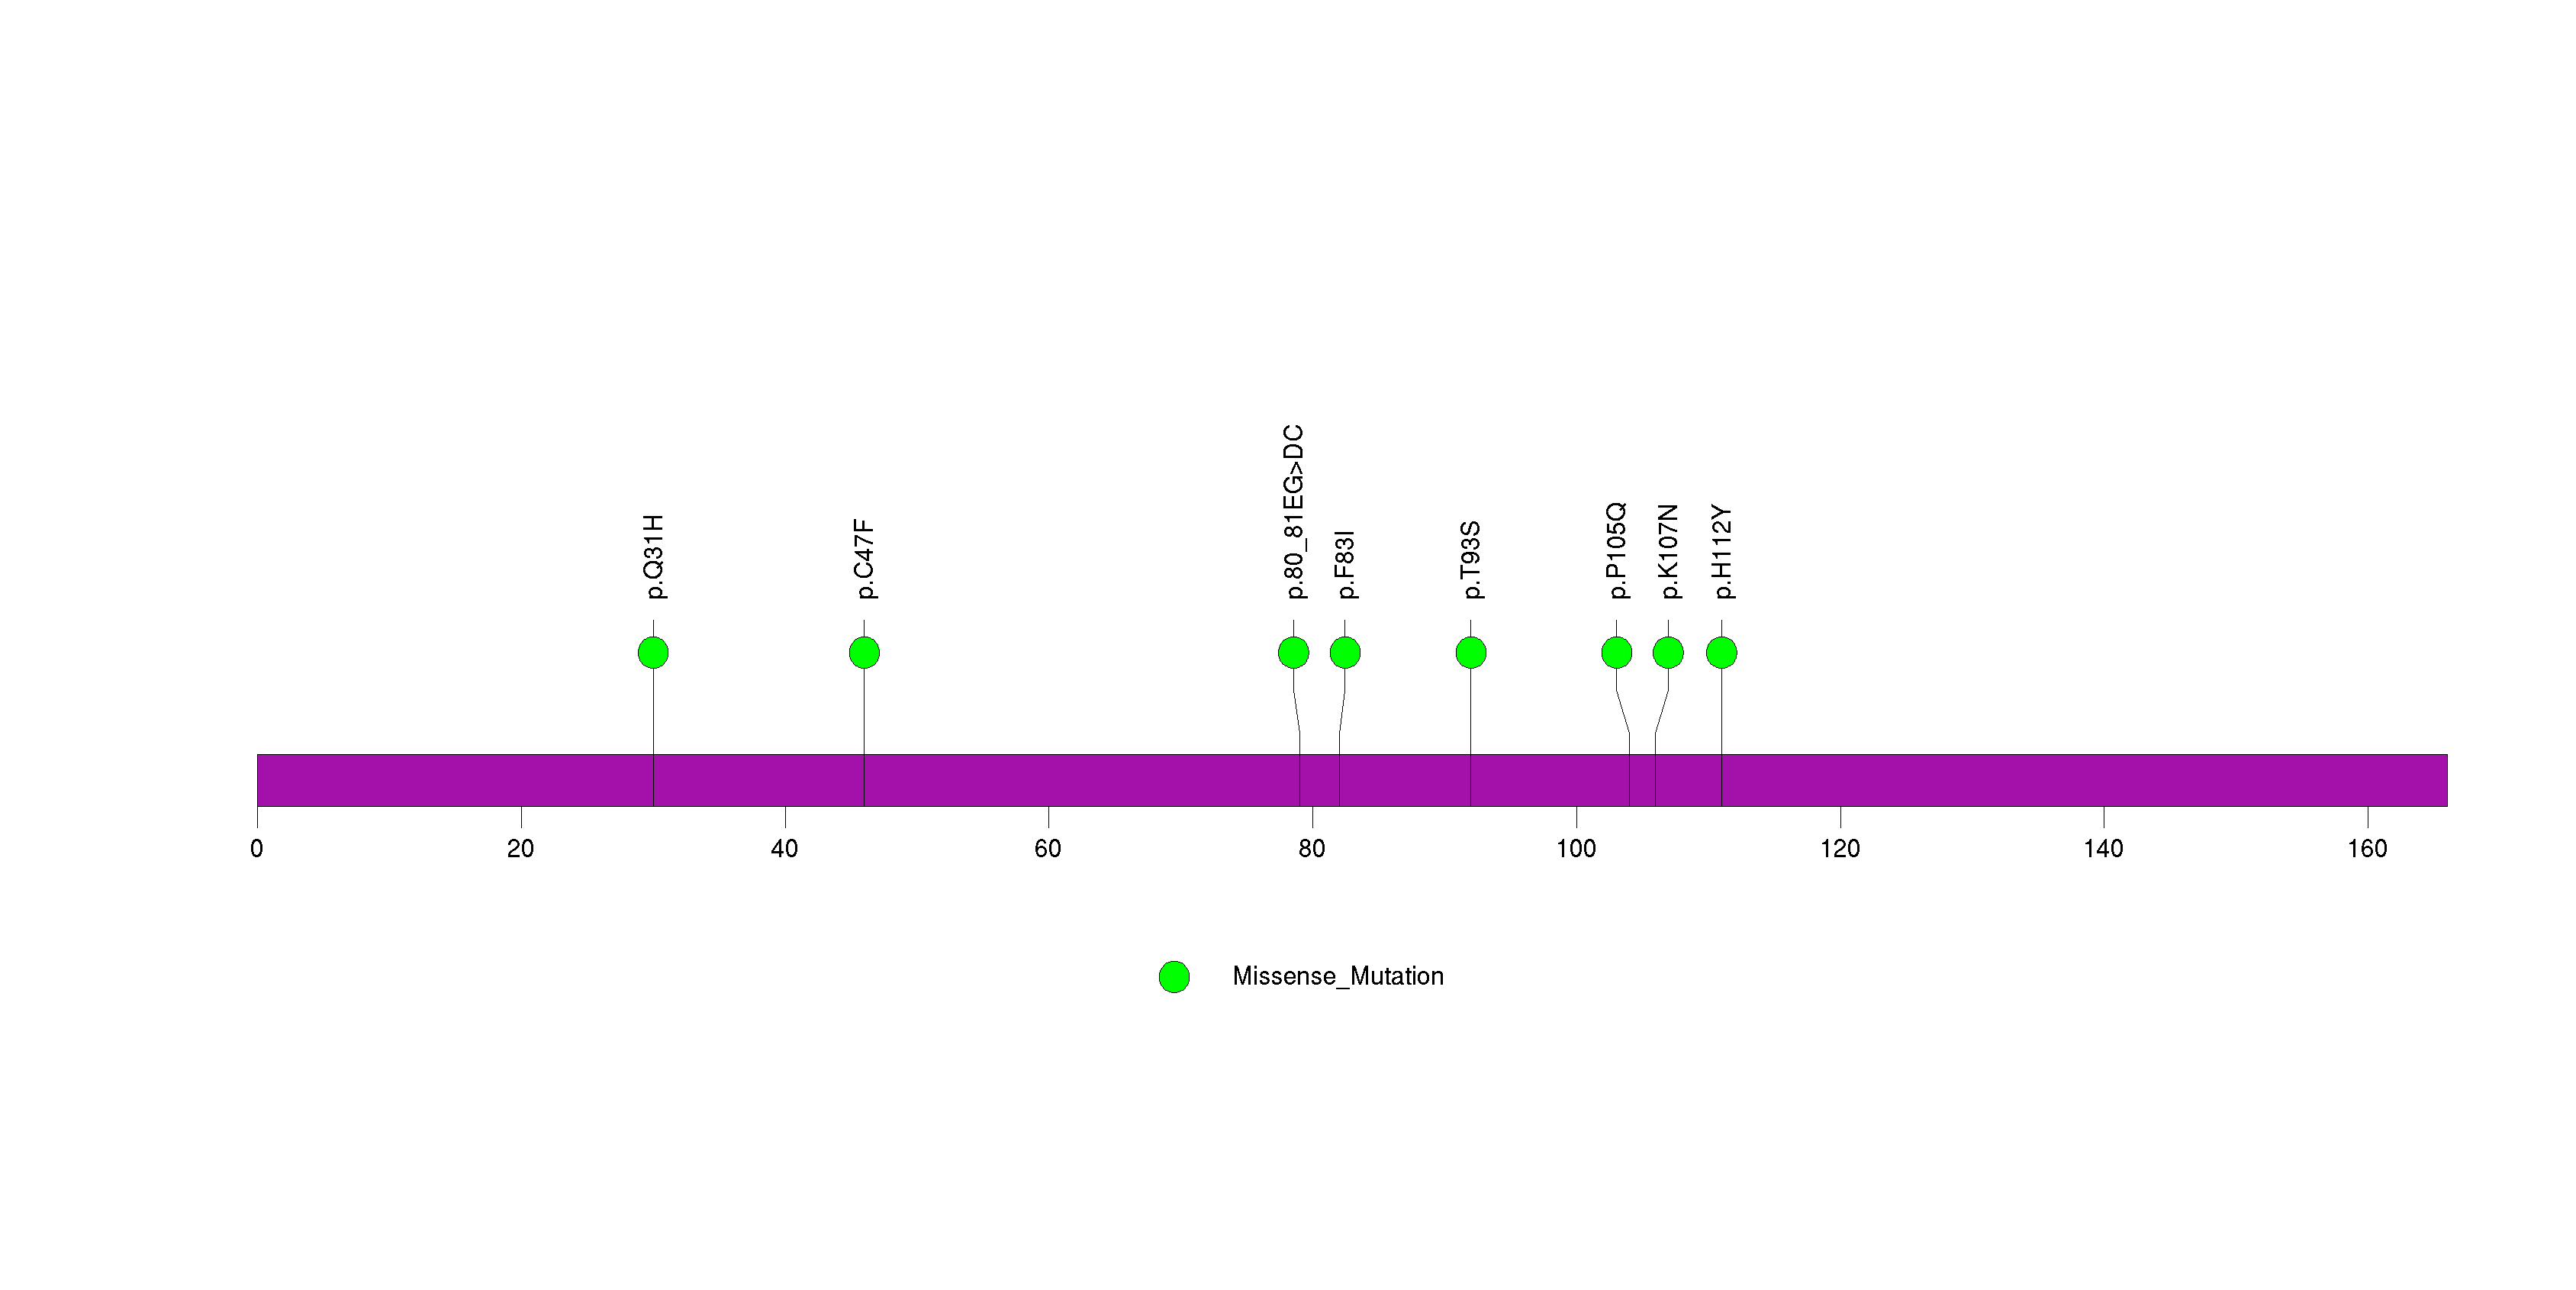
Figure S27. This figure depicts the distribution of mutations and mutation types across the STEAP4 significant gene.
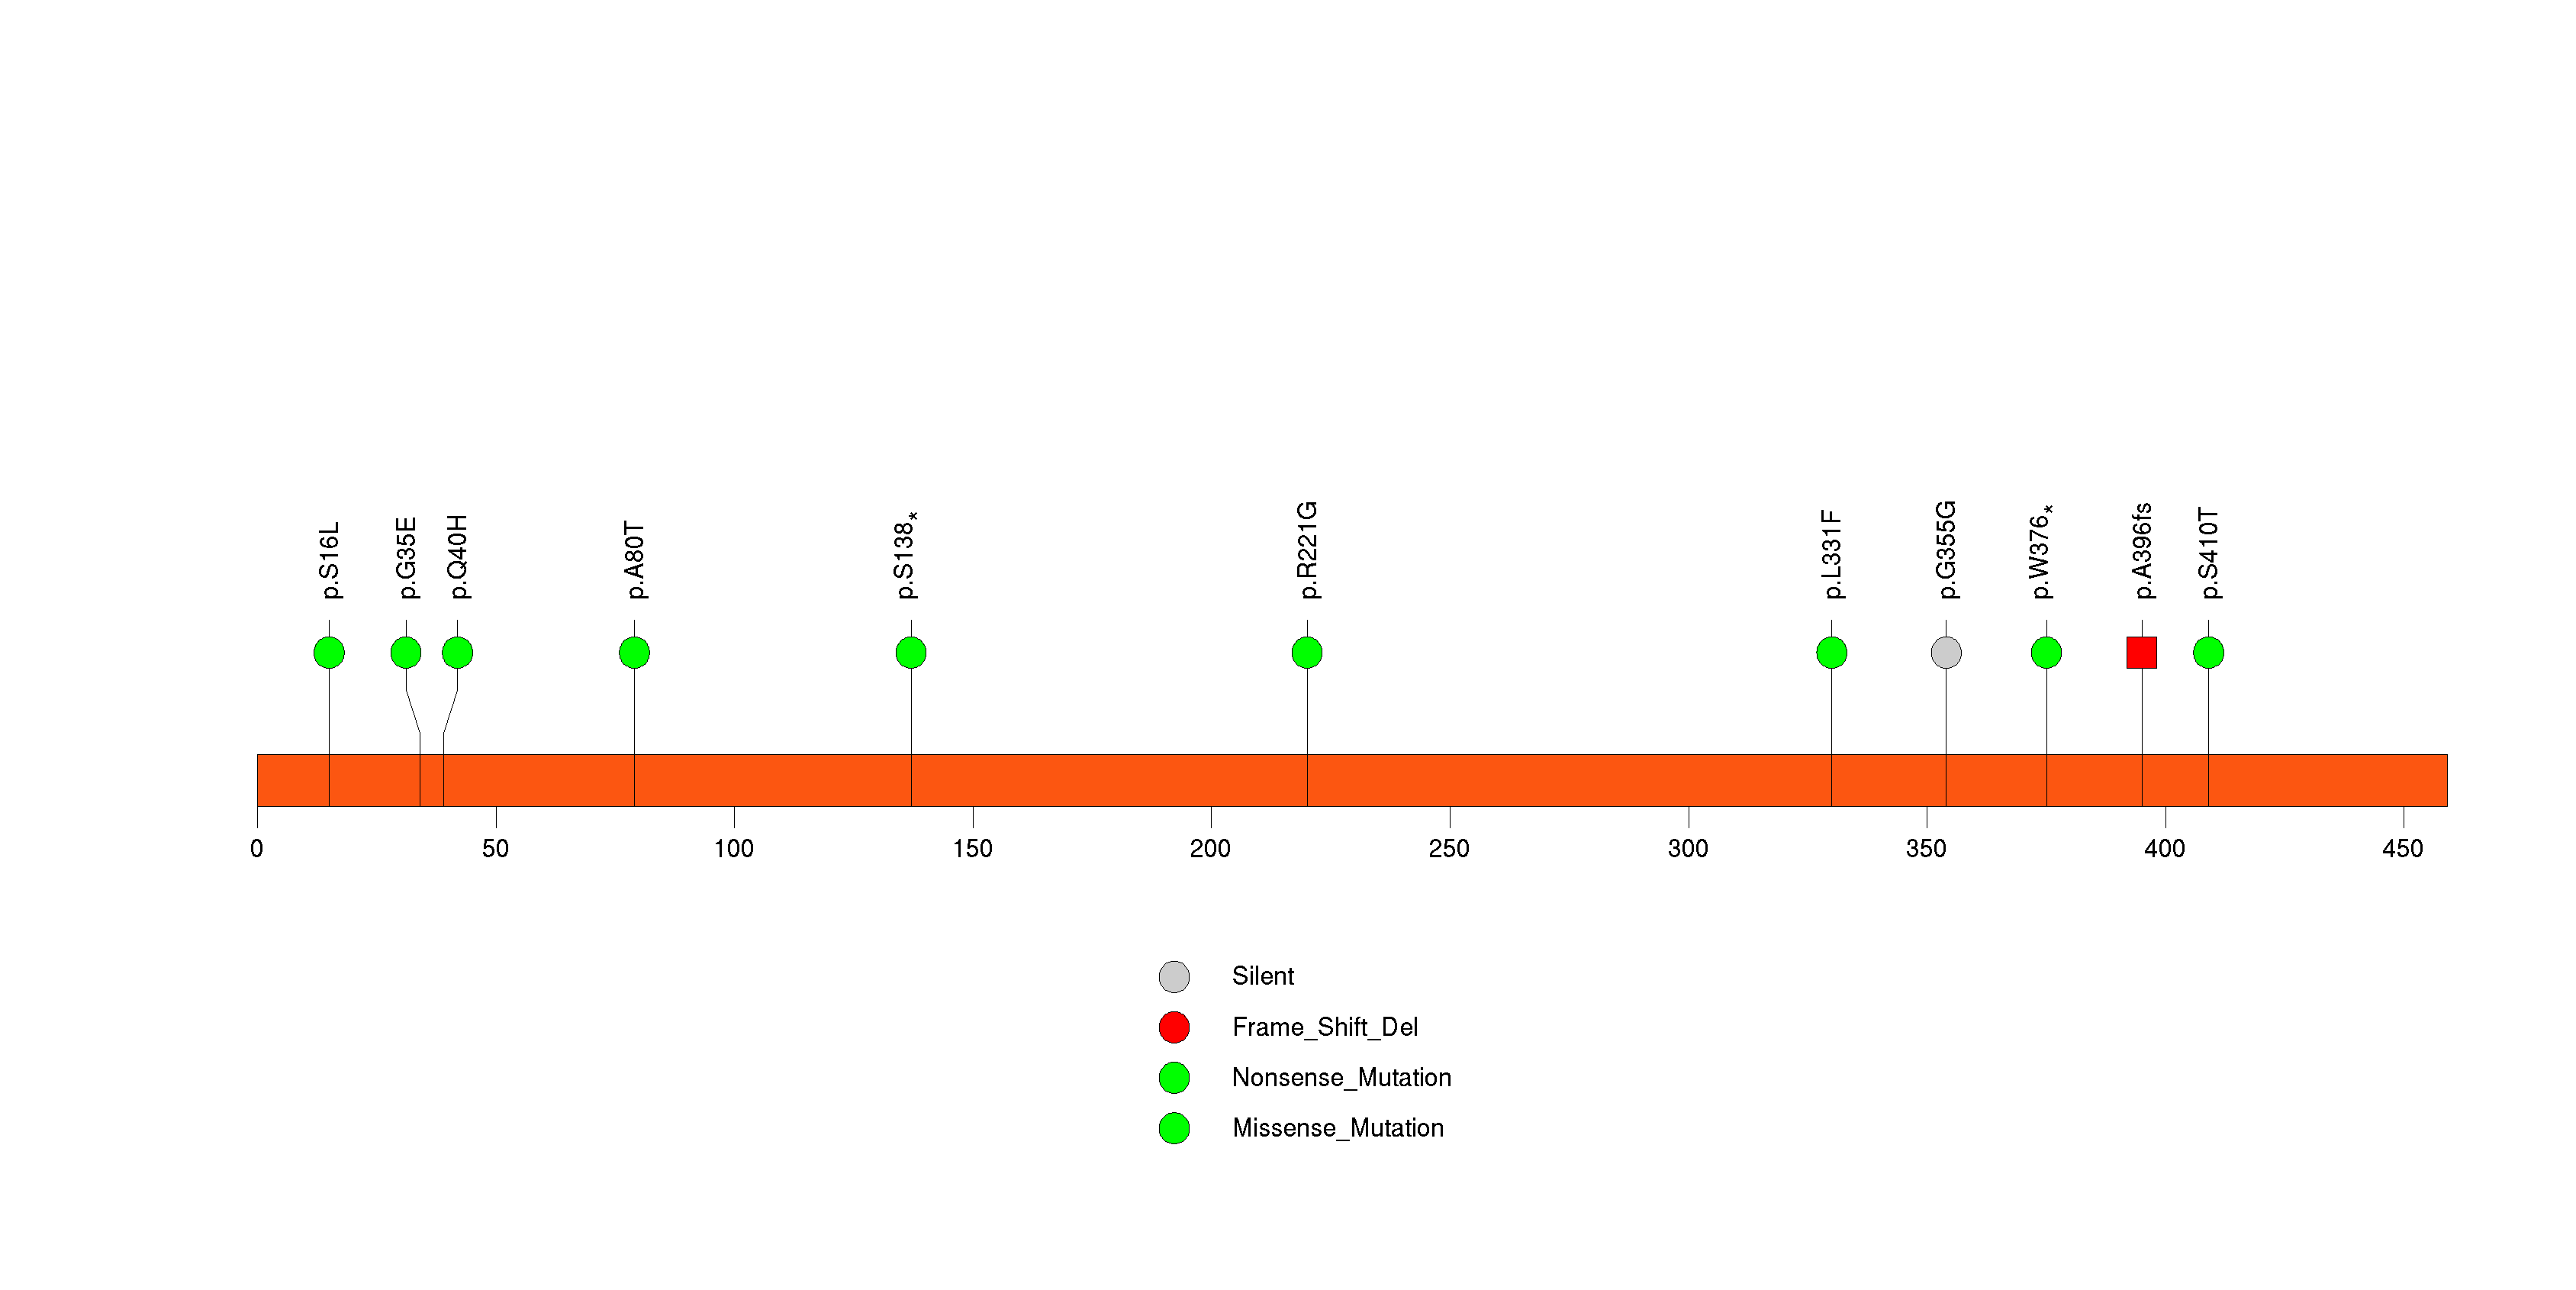
Figure S28. This figure depicts the distribution of mutations and mutation types across the FCRL4 significant gene.
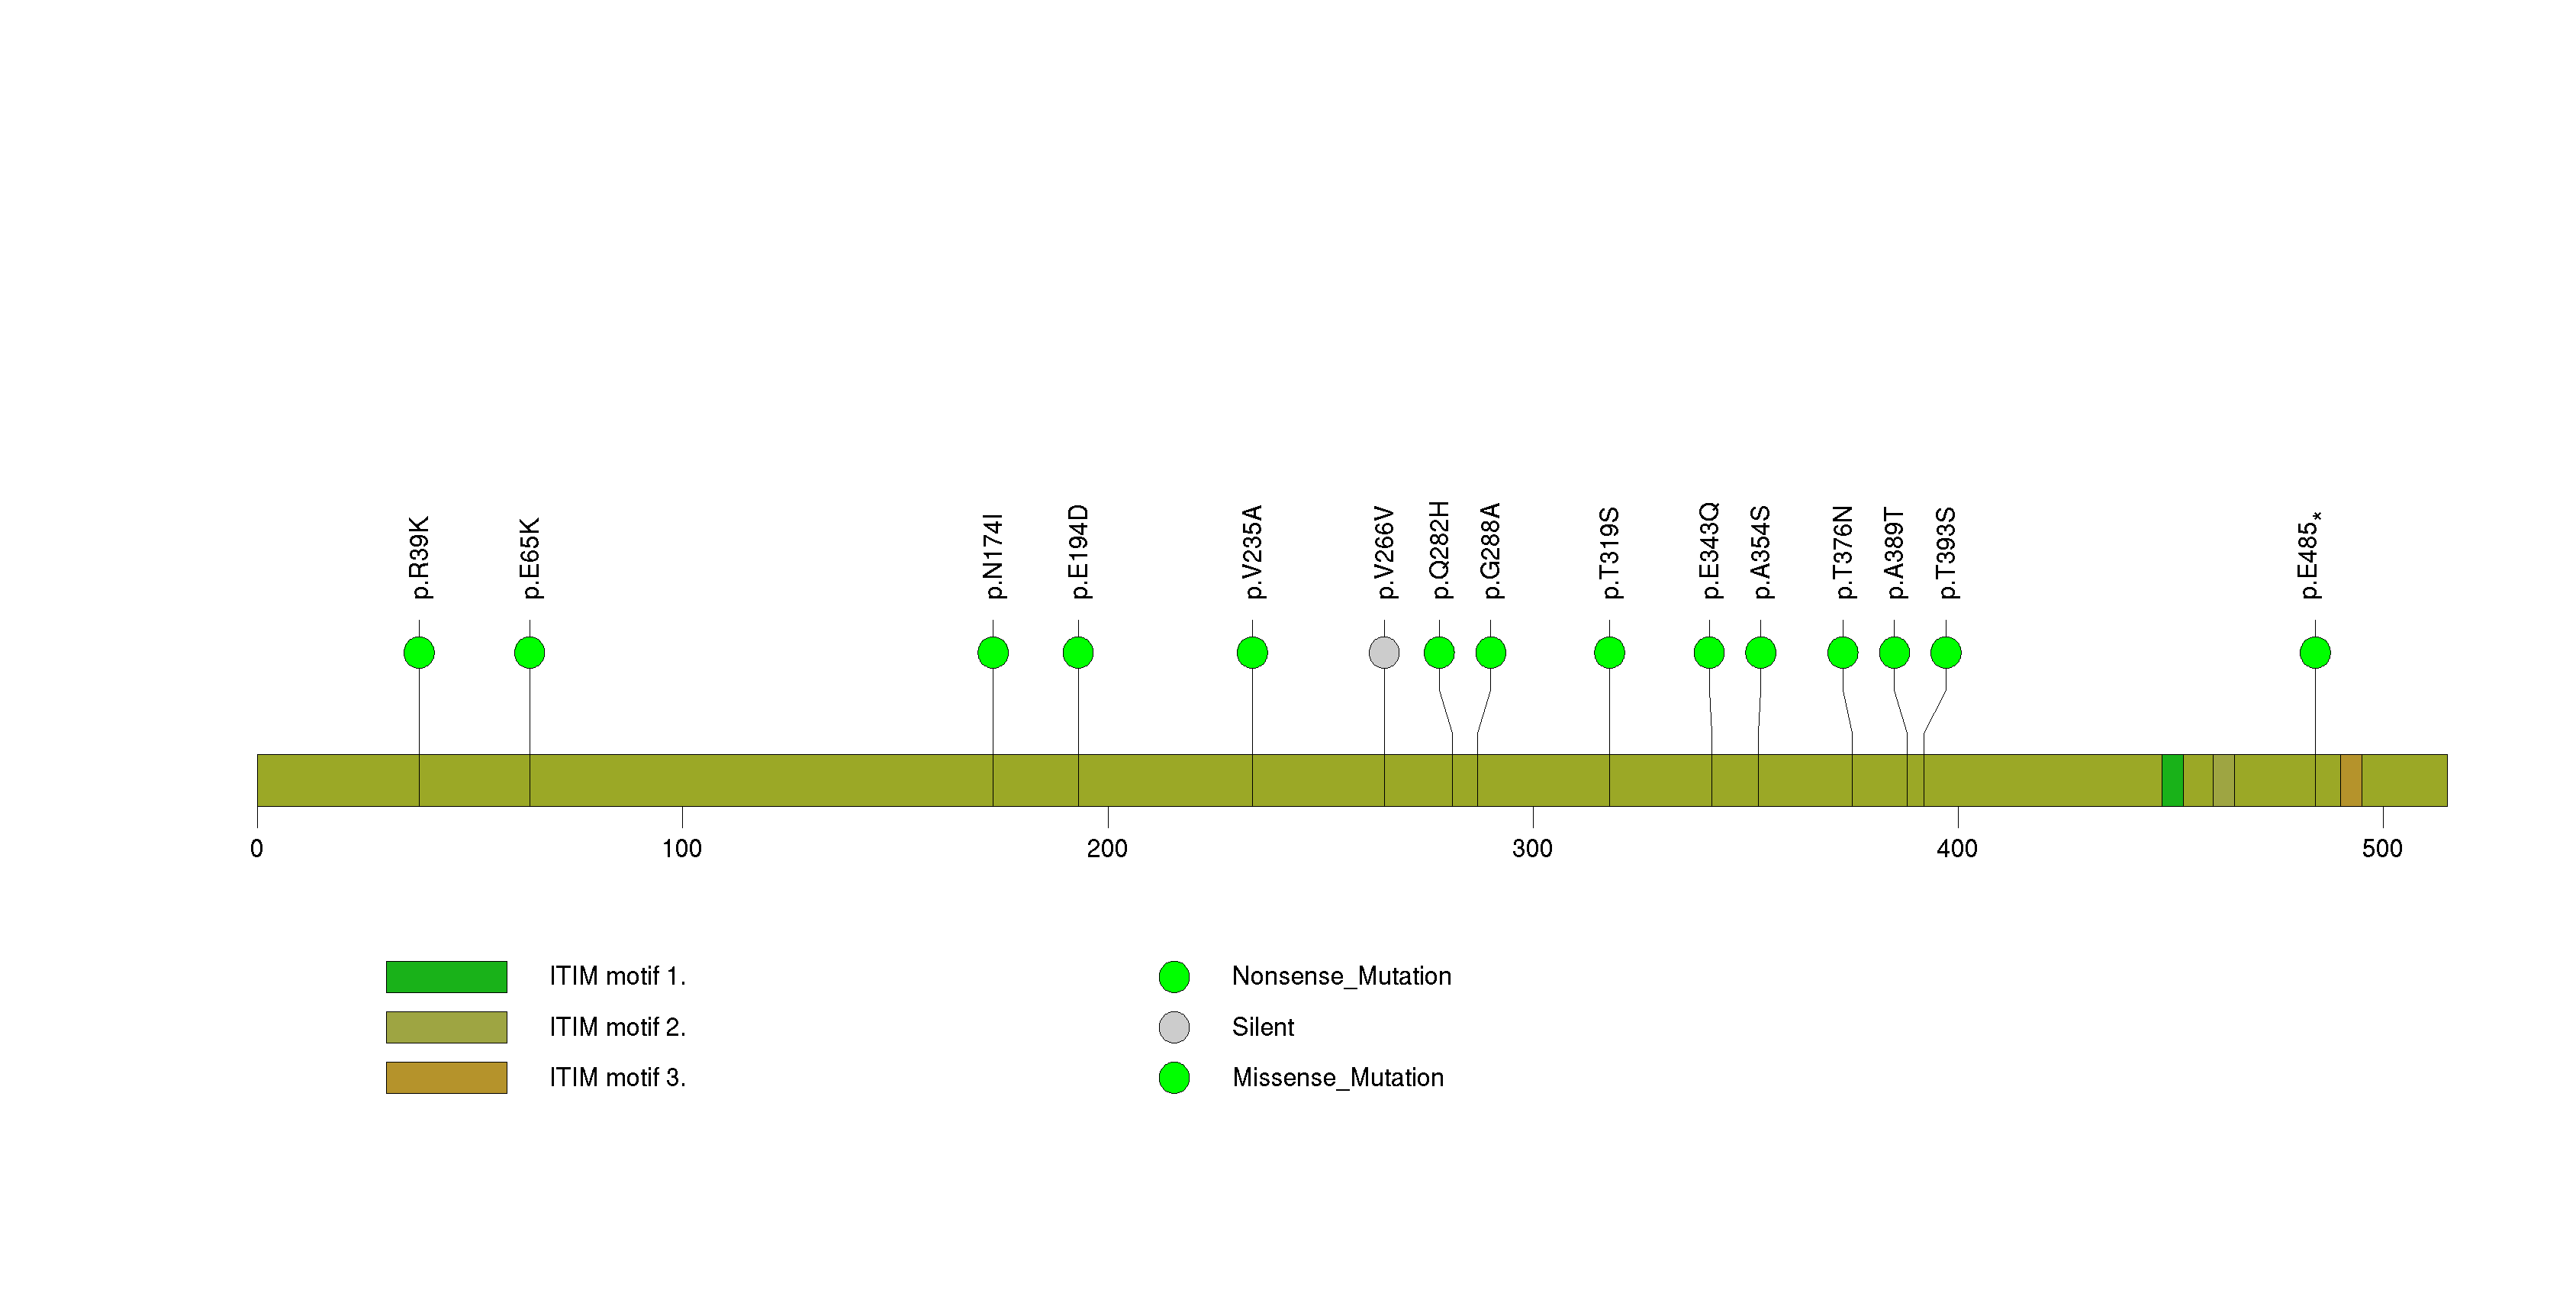
Figure S29. This figure depicts the distribution of mutations and mutation types across the LRFN5 significant gene.
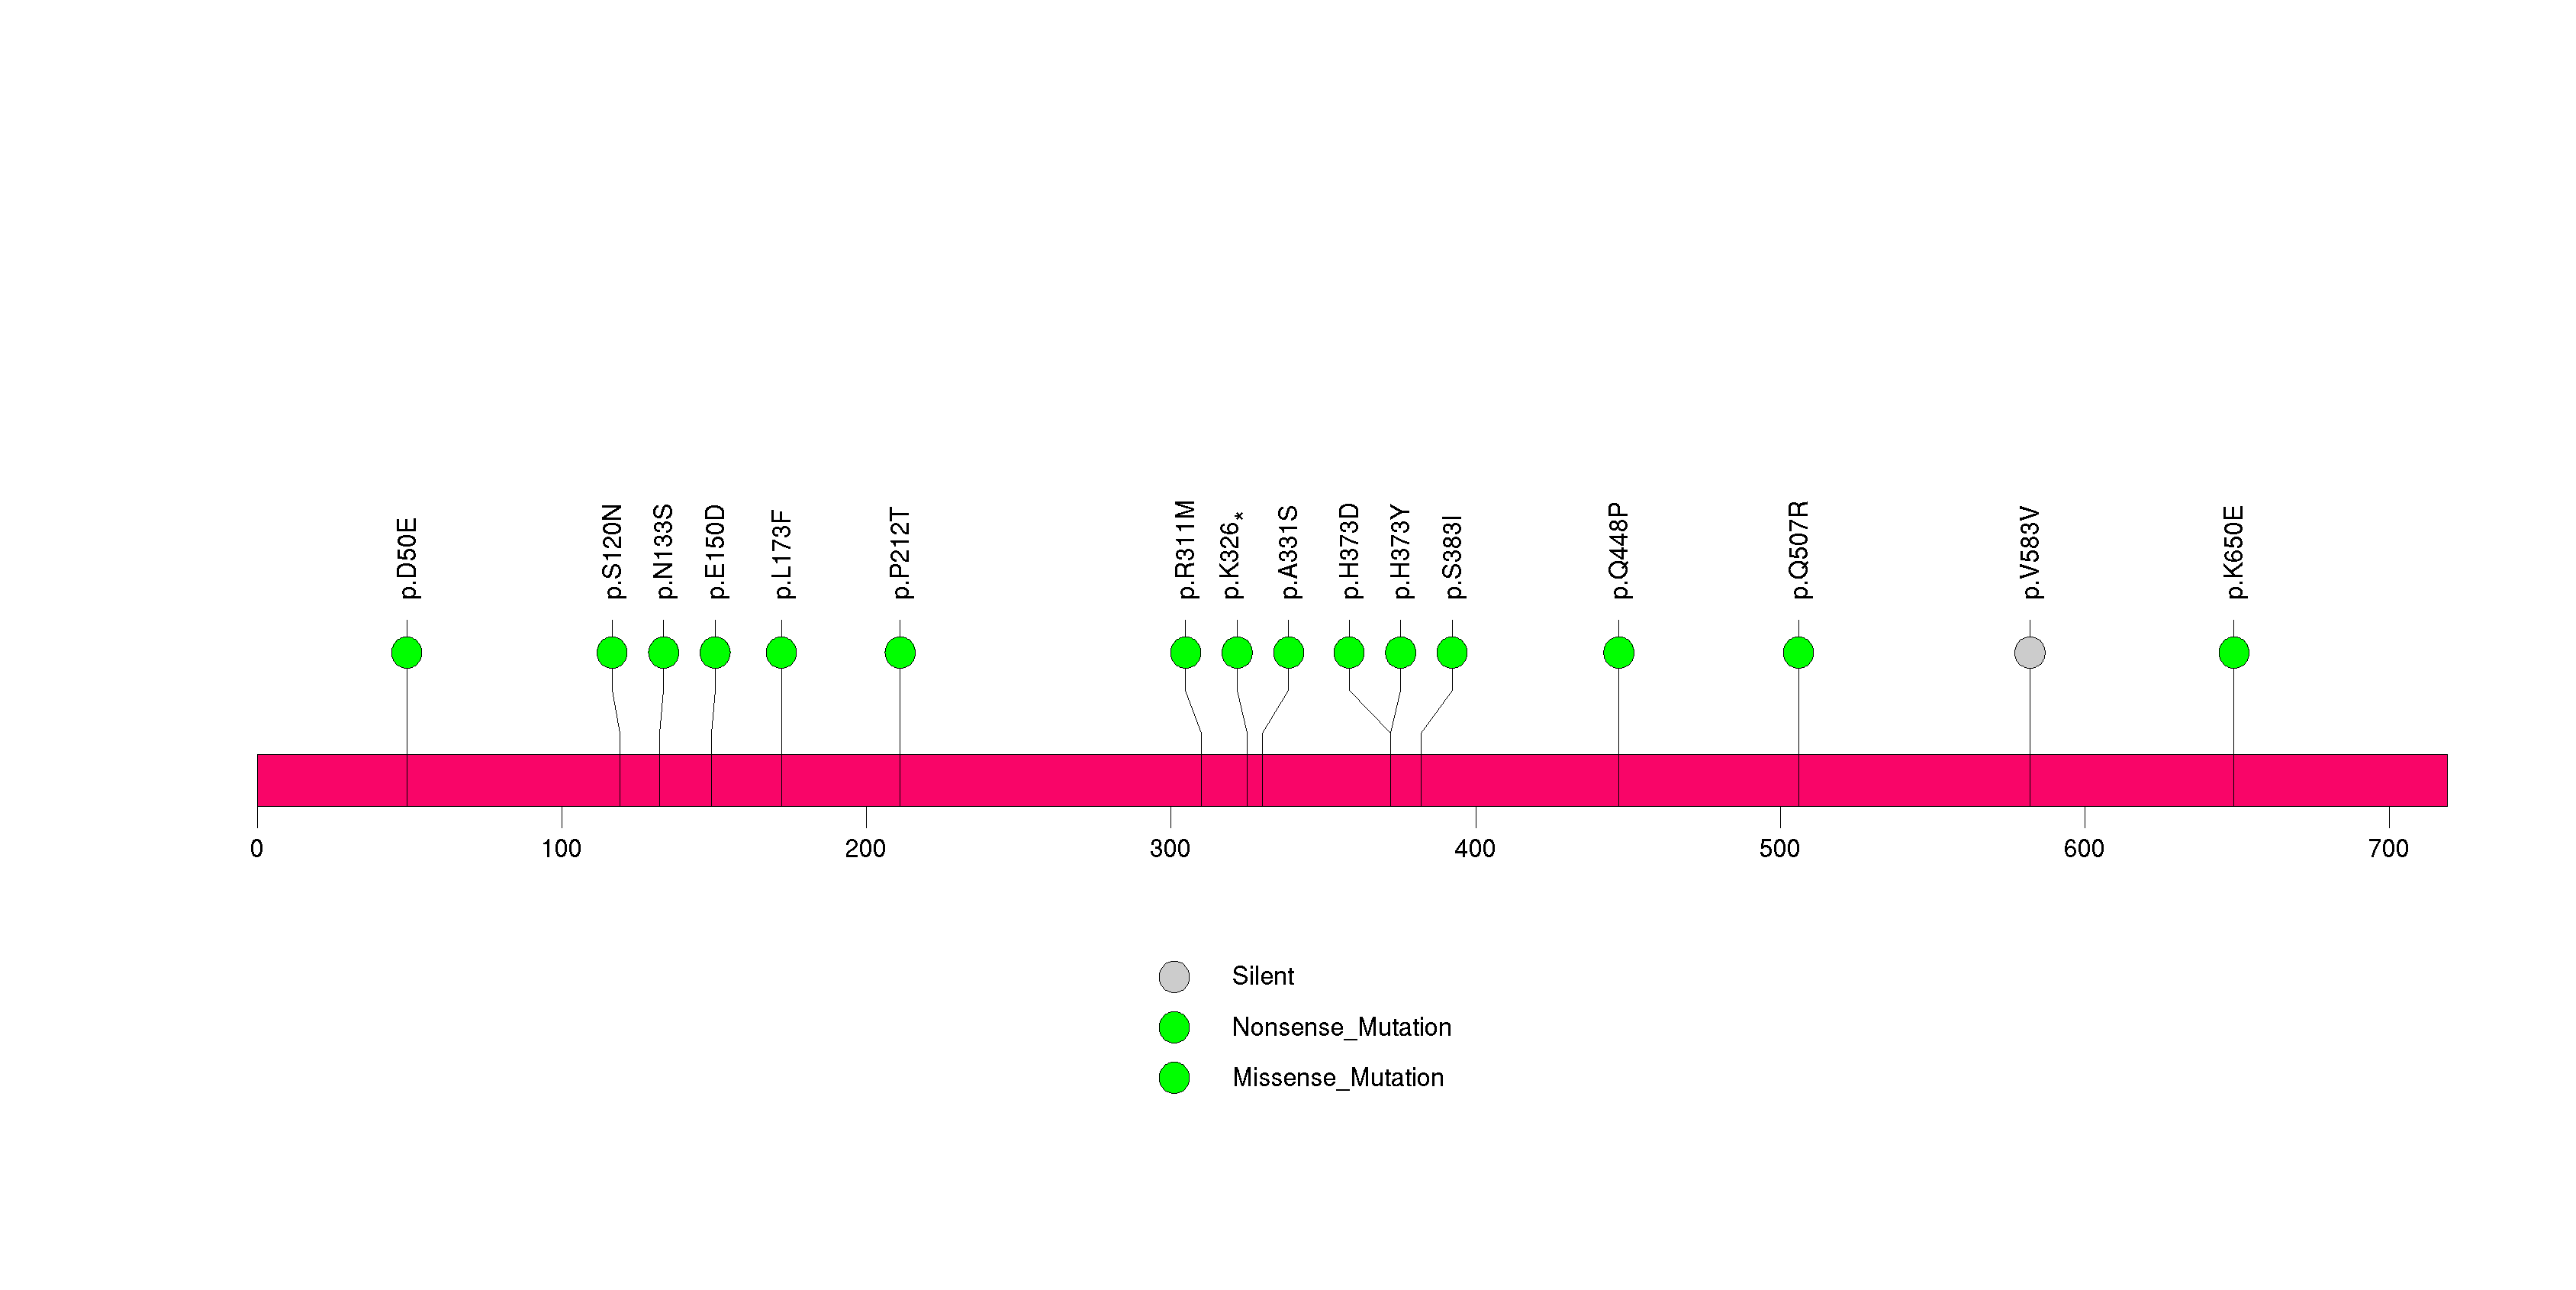
Figure S30. This figure depicts the distribution of mutations and mutation types across the EPHA2 significant gene.
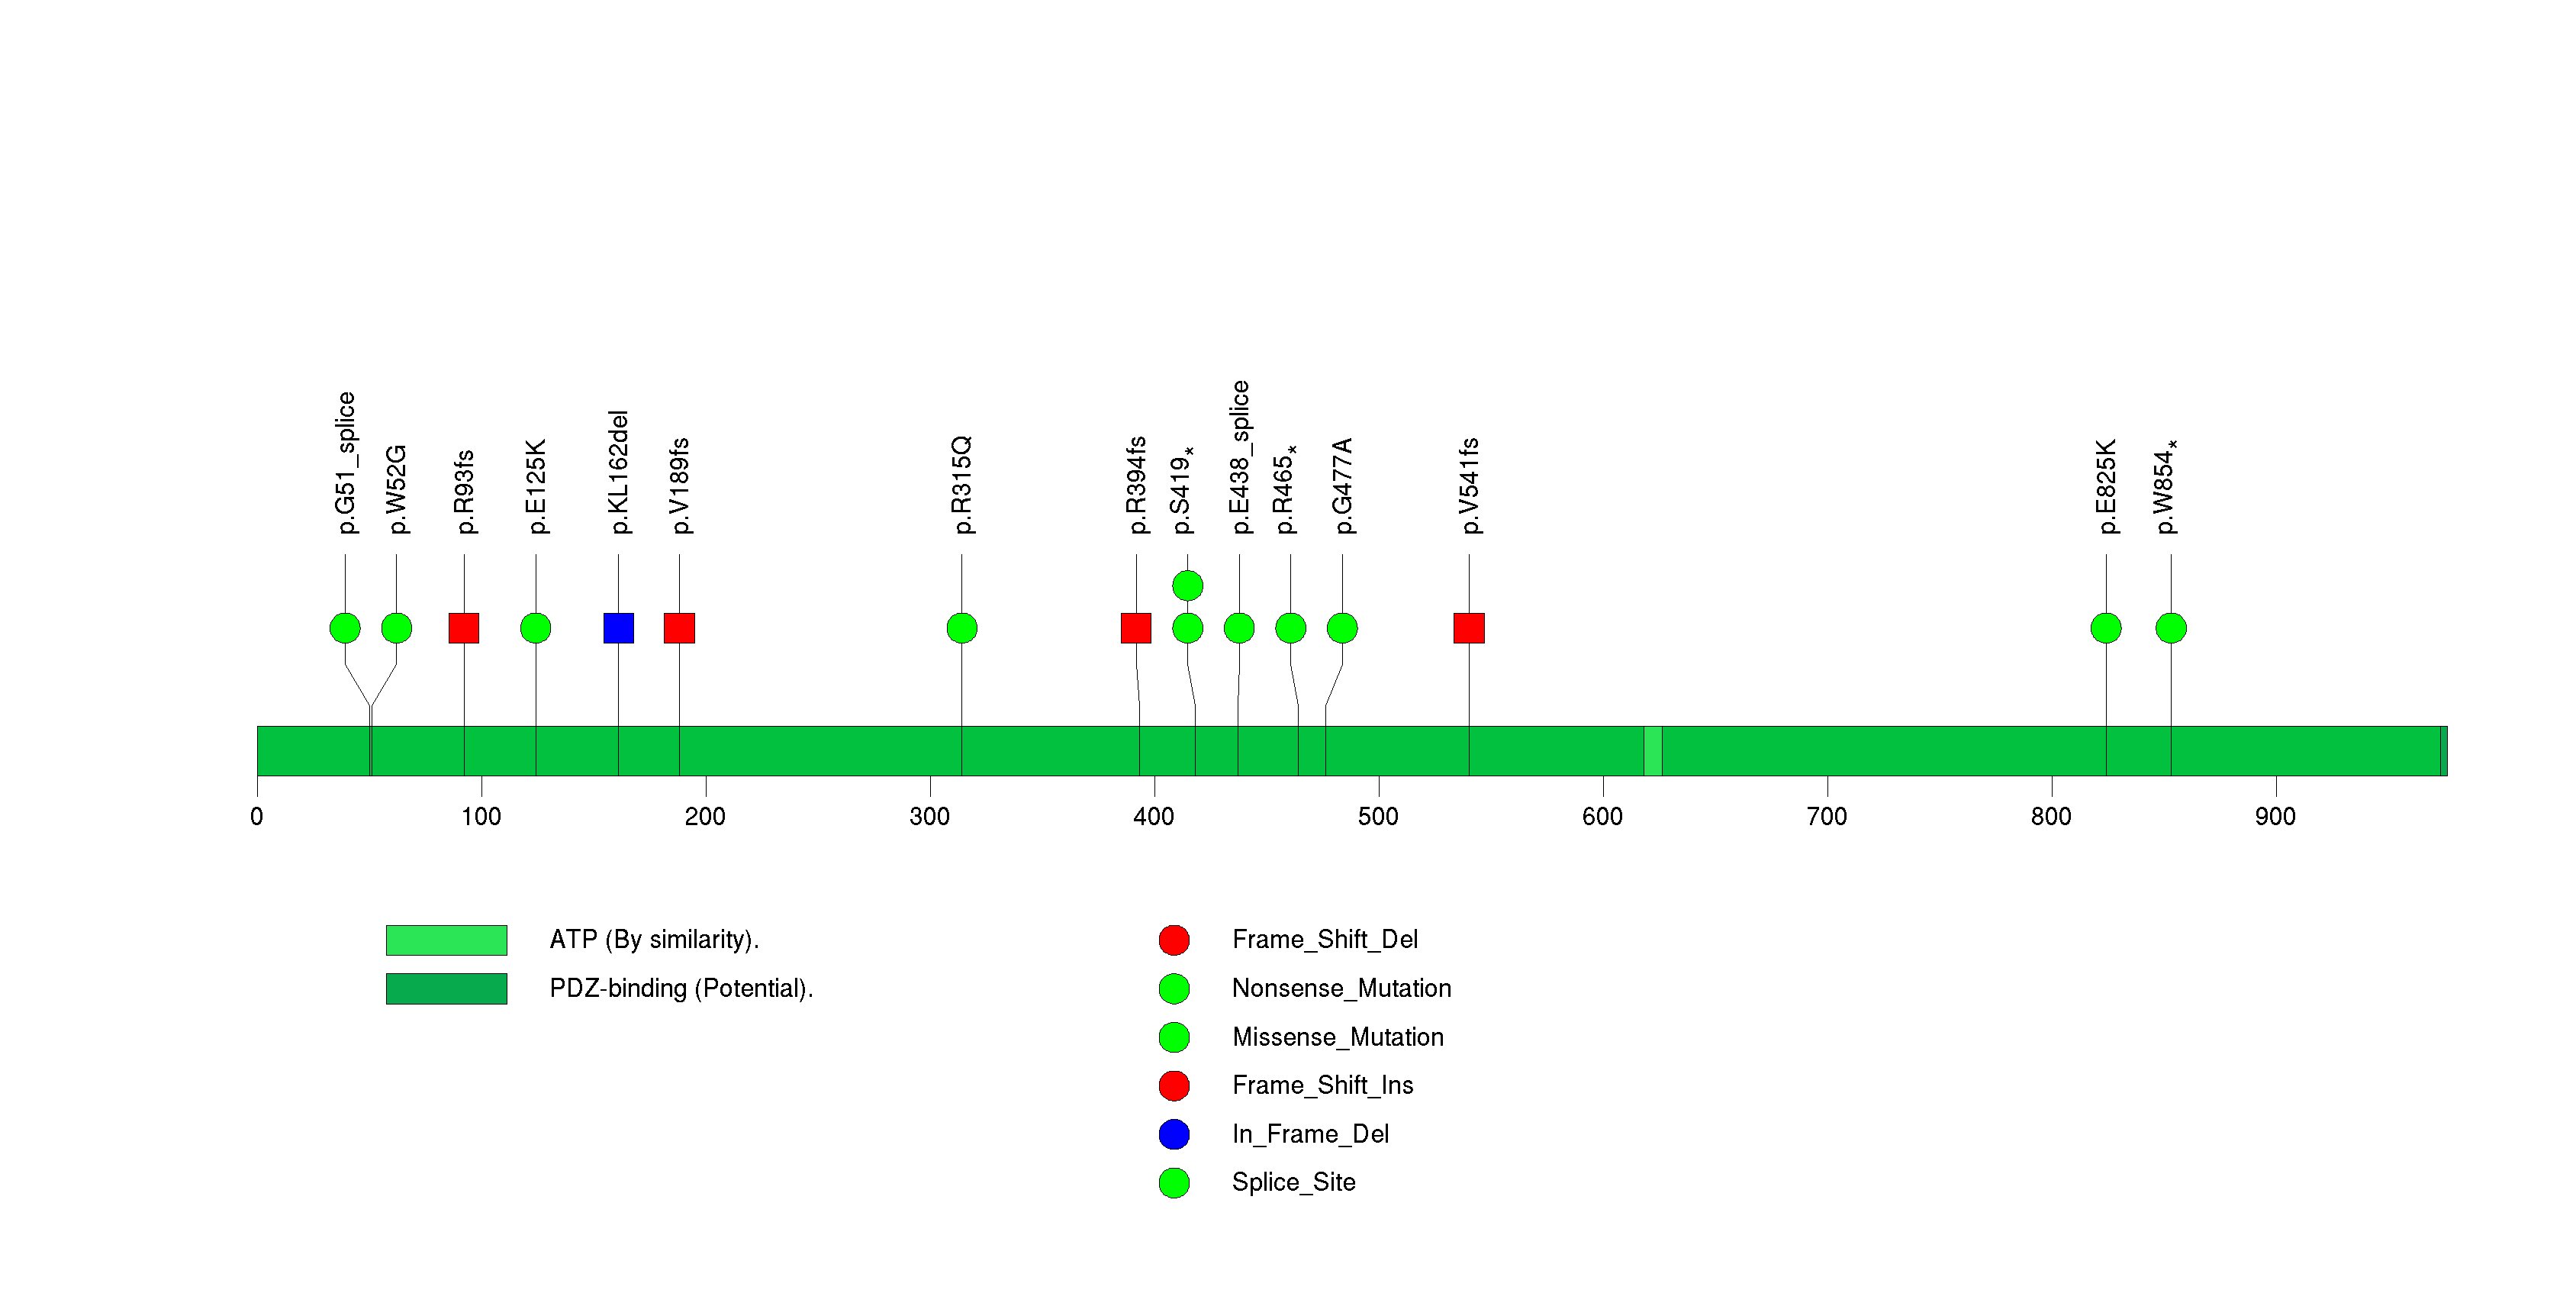
Figure S31. This figure depicts the distribution of mutations and mutation types across the POTEG significant gene.
In this analysis, COSMIC is used as a filter to increase power by restricting the territory of each gene. Cosmic version: v48.
Table 4. Get Full Table Significantly mutated genes (COSMIC territory only). To access the database please go to: COSMIC. Number of significant genes found: 8. Number of genes displayed: 10
| rank | gene | description | n | cos | n_cos | N_cos | cos_ev | p | q |
|---|---|---|---|---|---|---|---|---|---|
| 1 | TP53 | tumor protein p53 | 238 | 356 | 219 | 108936 | 45736 | 0 | 0 |
| 2 | CDKN2A | cyclin-dependent kinase inhibitor 2A (melanoma, p16, inhibits CDK4) | 61 | 332 | 60 | 101592 | 2905 | 0 | 0 |
| 3 | HRAS | v-Ha-ras Harvey rat sarcoma viral oncogene homolog | 11 | 19 | 11 | 5814 | 2979 | 1.3e-13 | 2e-10 |
| 4 | FBXW7 | F-box and WD repeat domain containing 7 | 14 | 91 | 10 | 27846 | 183 | 5.8e-13 | 6.5e-10 |
| 5 | PIK3CA | phosphoinositide-3-kinase, catalytic, alpha polypeptide | 64 | 220 | 54 | 67320 | 26364 | 1.2e-12 | 1e-09 |
| 6 | PIK3R1 | phosphoinositide-3-kinase, regulatory subunit 1 (alpha) | 6 | 33 | 4 | 10098 | 3 | 2e-07 | 0.00015 |
| 7 | PTPN14 | protein tyrosine phosphatase, non-receptor type 14 | 13 | 3 | 2 | 918 | 2 | 9.3e-06 | 0.006 |
| 8 | SCN9A | sodium channel, voltage-gated, type IX, alpha subunit | 10 | 4 | 2 | 1224 | 2 | 0.000016 | 0.0093 |
| 9 | PTCH1 | patched homolog 1 (Drosophila) | 11 | 256 | 4 | 78336 | 5 | 0.00057 | 0.2 |
| 10 | RB1 | retinoblastoma 1 (including osteosarcoma) | 9 | 267 | 4 | 81702 | 5 | 0.00067 | 0.2 |
Note:
n - number of (nonsilent) mutations in this gene across the individual set.
cos = number of unique mutated sites in this gene in COSMIC
n_cos = overlap between n and cos.
N_cos = number of individuals times cos.
cos_ev = total evidence: number of reports in COSMIC for mutations seen in this gene.
p = p-value for seeing the observed amount of overlap in this gene)
q = q-value, False Discovery Rate (Benjamini-Hochberg procedure)
Table 5. Get Full Table Genes with Clustered Mutations
| num | gene | desc | n | mindist | nmuts0 | nmuts3 | nmuts12 | npairs0 | npairs3 | npairs12 |
|---|---|---|---|---|---|---|---|---|---|---|
| 8573 | PIK3CA | phosphoinositide-3-kinase, catalytic, alpha polypeptide | 64 | 0 | 331 | 628 | 650 | 331 | 628 | 650 |
| 11744 | TP53 | tumor protein p53 | 238 | 0 | 321 | 853 | 2124 | 321 | 853 | 2124 |
| 5177 | HRAS | v-Ha-ras Harvey rat sarcoma viral oncogene homolog | 11 | 0 | 18 | 45 | 45 | 18 | 45 | 45 |
| 7412 | NFE2L2 | nuclear factor (erythroid-derived 2)-like 2 | 18 | 0 | 13 | 38 | 60 | 13 | 38 | 60 |
| 4038 | FBXW7 | F-box and WD repeat domain containing 7 | 14 | 0 | 6 | 11 | 20 | 6 | 11 | 20 |
| 1567 | C3orf59 | chromosome 3 open reading frame 59 | 8 | 0 | 6 | 6 | 6 | 6 | 6 | 6 |
| 6601 | MAPK1 | mitogen-activated protein kinase 1 | 4 | 0 | 6 | 6 | 6 | 6 | 6 | 6 |
| 9578 | RHOA | ras homolog gene family, member A | 4 | 0 | 6 | 6 | 6 | 6 | 6 | 6 |
| 1861 | CASP8 | caspase 8, apoptosis-related cysteine peptidase | 25 | 0 | 5 | 8 | 19 | 5 | 8 | 19 |
| 7537 | NOTCH1 | Notch homolog 1, translocation-associated (Drosophila) | 59 | 0 | 4 | 13 | 38 | 4 | 13 | 38 |
Note:
n - number of mutations in this gene in the individual set.
mindist - distance (in aa) between closest pair of mutations in this gene
npairs3 - how many pairs of mutations are within 3 aa of each other.
npairs12 - how many pairs of mutations are within 12 aa of each other.
Table 6. Get Full Table A Ranked List of Significantly Mutated Genesets. (Source: MSigDB GSEA Cannonical Pathway Set).Number of significant genesets found: 66. Number of genesets displayed: 10
| rank | geneset | description | genes | N_genes | mut_tally | N | n | npat | nsite | nsil | n1 | n2 | n3 | n4 | n5 | n6 | p_ns_s | p | q |
|---|---|---|---|---|---|---|---|---|---|---|---|---|---|---|---|---|---|---|---|
| 1 | APOPTOSIS_GENMAPP | APAF1, BAK1, BCL2L7P1, BAX, BCL2, BCL2L1, BID, BIRC2, BIRC3, BIRC4, CASP2, CASP3, CASP6, CASP7, CASP8, CASP9, CYCS, FADD, FAS, FASLG, GZMB, IKBKG, JUN, MAP2K4, MAP3K1, MAP3K14, MAPK10, MCL1, MDM2, MYC, NFKB1, NFKBIA, PARP1, PRF1, RELA, RIPK1, TNF, TNFRSF1A, TNFRSF1B, TNFSF10, TP53, TRADD, TRAF1, TRAF2 | 41 | APAF1(9), BAX(1), BCL2(1), BCL2L1(2), BID(2), BIRC2(1), BIRC3(1), CASP3(1), CASP6(2), CASP7(1), CASP8(25), FADD(1), FAS(1), FASLG(2), GZMB(1), MAP2K4(1), MAP3K1(3), MAP3K14(2), MAPK10(3), MCL1(1), MDM2(2), MYC(4), NFKB1(2), PARP1(3), PRF1(3), RELA(1), RIPK1(2), TP53(238), TRAF2(1) | 17088240 | 317 | 233 | 222 | 21 | 53 | 41 | 56 | 56 | 104 | 7 | <1.00e-15 | <1.00e-15 | <6.16e-14 | |
| 2 | G1PATHWAY | CDK4/6-cyclin D and CDK2-cyclin E phosphorylate Rb, which allows the transcription of genes needed for the G1/S cell cycle transition. | ABL1, ATM, ATR, CCNA1, CCND1, CCNE1, CDC2, CDC25A, CDK2, CDK4, CDK6, CDKN1A, CDKN1B, CDKN2A, CDKN2B, DHFR, E2F1, GSK3B, HDAC1, MADH3, MADH4, RB1, SKP2, TFDP1, TGFB1, TGFB2, TGFB3, TP53 | 25 | ATM(9), ATR(19), CCNA1(4), CCND1(2), CCNE1(3), CDK4(4), CDK6(1), CDKN1B(2), CDKN2A(61), DHFR(3), GSK3B(1), RB1(9), SKP2(2), TFDP1(3), TGFB1(1), TGFB2(2), TP53(238) | 13736583 | 364 | 226 | 238 | 19 | 48 | 43 | 56 | 61 | 148 | 8 | <1.00e-15 | <1.00e-15 | <6.16e-14 |
| 3 | TELPATHWAY | Telomerase is a ribonucleotide protein that adds telomeric repeats to the 3' ends of chromosomes. | AKT1, BCL2, EGFR, G22P1, HSPCA, IGF1R, KRAS2, MYC, POLR2A, PPP2CA, PRKCA, RB1, TEP1, TERF1, TERT, TNKS, TP53, XRCC5 | 15 | AKT1(2), BCL2(1), EGFR(14), IGF1R(7), MYC(4), POLR2A(9), PRKCA(2), RB1(9), TEP1(8), TERF1(3), TERT(1), TNKS(4), TP53(238), XRCC5(2) | 12869416 | 304 | 223 | 212 | 29 | 49 | 41 | 60 | 52 | 95 | 7 | 7.27e-14 | <1.00e-15 | <6.16e-14 |
| 4 | SA_G1_AND_S_PHASES | Cdk2, 4, and 6 bind cyclin D in G1, while cdk2/cyclin E promotes the G1/S transition. | ARF1, ARF3, CCND1, CDK2, CDK4, CDKN1A, CDKN1B, CDKN2A, CFL1, E2F1, E2F2, MDM2, NXT1, PRB1, TP53 | 15 | CCND1(2), CDK4(4), CDKN1B(2), CDKN2A(61), CFL1(2), E2F2(3), MDM2(2), PRB1(8), TP53(238) | 3842593 | 322 | 217 | 195 | 12 | 44 | 34 | 49 | 50 | 137 | 8 | <1.00e-15 | <1.00e-15 | <6.16e-14 |
| 5 | PLK3PATHWAY | Active Plk3 phosphorylates CDC25c, blocking the G2/M transition, and phosphorylates p53 to induce apoptosis. | ATM, ATR, CDC25C, CHEK1, CHEK2, CNK, TP53, YWHAH | 7 | ATM(9), ATR(19), CHEK1(1), CHEK2(4), TP53(238), YWHAH(1) | 7290074 | 272 | 213 | 180 | 10 | 43 | 35 | 47 | 52 | 88 | 7 | 1.48e-14 | <1.00e-15 | <6.16e-14 |
| 6 | TERTPATHWAY | hTERC, the RNA subunit of telomerase, and hTERT, the catalytic protein subunit, are required for telomerase activity and are overexpressed in many cancers. | HDAC1, MAX, MYC, SP1, SP3, TP53, WT1, ZNF42 | 7 | MAX(1), MYC(4), SP1(1), SP3(1), TP53(238) | 3219260 | 245 | 207 | 153 | 7 | 41 | 28 | 42 | 42 | 85 | 7 | <1.00e-15 | <1.00e-15 | <6.16e-14 |
| 7 | IGF1PATHWAY | Growth factor IGF-1 stimulates growth and inhibits apoptosis by activating the MAP kinase pathway in a variety of cell types. | CSNK2A1, ELK1, FOS, GRB2, HRAS, IGF1, IGF1R, IRS1, JUN, MAP2K1, MAPK3, MAPK8, PIK3CA, PIK3R1, PTPN11, RAF1, RASA1, SHC1, SOS1, SRF | 20 | CSNK2A1(6), ELK1(1), FOS(1), HRAS(11), IGF1R(7), IRS1(1), MAP2K1(4), MAPK8(4), PIK3CA(64), PIK3R1(6), PTPN11(1), RAF1(2), RASA1(14), SHC1(1), SOS1(8) | 11293994 | 131 | 109 | 83 | 5 | 11 | 47 | 32 | 24 | 17 | 0 | 2.07e-12 | <1.00e-15 | <6.16e-14 |
| 8 | NGFPATHWAY | Nerve growth factor (NGF) stimulates neural survival and proliferation via the TrkA and p75 receptors, which induce DAG and IP3 production and activate Ras. | CSNK2A1, DPM2, ELK1, FOS, GRB2, HRAS, JUN, KLK2, MAP2K1, MAPK3, MAPK8, NGFB, NGFR, PIK3CA, PIK3R1, PLCG1, RAF1, SHC1, SOS1 | 18 | CSNK2A1(6), ELK1(1), FOS(1), HRAS(11), MAP2K1(4), MAPK8(4), NGFR(1), PIK3CA(64), PIK3R1(6), PLCG1(5), RAF1(2), SHC1(1), SOS1(8) | 8695189 | 114 | 93 | 68 | 3 | 9 | 46 | 29 | 21 | 9 | 0 | 1.09e-12 | <1.00e-15 | <6.16e-14 |
| 9 | TRKAPATHWAY | Nerve growth factor (NGF) promotes neuronal survival and proliferation by binding its receptor TrkA, which activates PI3K/AKT, Ras, and the MAP kinase pathway. | AKT1, DPM2, GRB2, HRAS, KLK2, NGFB, NTRK1, PIK3CA, PIK3R1, PLCG1, PRKCA, PRKCB1, SHC1, SOS1 | 12 | AKT1(2), HRAS(11), NTRK1(3), PIK3CA(64), PIK3R1(6), PLCG1(5), PRKCA(2), SHC1(1), SOS1(8) | 7103380 | 102 | 87 | 56 | 5 | 6 | 49 | 21 | 23 | 3 | 0 | 4.12e-10 | <1.00e-15 | <6.16e-14 |
| 10 | AKTPATHWAY | Second messenger PIP3 promotes cell survival by activating the anti-apoptotic kinase AKT. | AKT1, BAD, CASP9, CHUK, FOXO1A, FOXO3A, GH1, GHR, HSPCA, MLLT7, NFKB1, NFKBIA, PDPK1, PIK3CA, PIK3R1, PPP2CA, RELA, TNFSF6, YWHAH | 14 | AKT1(2), BAD(1), CHUK(3), GH1(1), GHR(4), NFKB1(2), PDPK1(2), PIK3CA(64), PIK3R1(6), RELA(1), YWHAH(1) | 6437782 | 87 | 81 | 46 | 4 | 3 | 49 | 8 | 23 | 4 | 0 | 2.86e-09 | <1.00e-15 | <6.16e-14 |
Table 7. Get Full Table A Ranked List of Significantly Mutated Genesets (Excluding Significantly Mutated Genes). Number of significant genesets found: 0. Number of genesets displayed: 10
| rank | geneset | description | genes | N_genes | mut_tally | N | n | npat | nsite | nsil | n1 | n2 | n3 | n4 | n5 | n6 | p_ns_s | p | q |
|---|---|---|---|---|---|---|---|---|---|---|---|---|---|---|---|---|---|---|---|
| 1 | HSA00902_MONOTERPENOID_BIOSYNTHESIS | Genes involved in monoterpenoid biosynthesis | CYP2C19, CYP2C9 | 2 | CYP2C19(3), CYP2C9(5) | 922599 | 8 | 8 | 8 | 0 | 0 | 3 | 4 | 1 | 0 | 0 | 0.087 | 0.052 | 1 |
| 2 | HSA00627_1,4_DICHLOROBENZENE_DEGRADATION | Genes involved in 1,4-dichlorobenzene degradation | CMBL | 1 | CMBL(2) | 231812 | 2 | 2 | 2 | 0 | 0 | 0 | 0 | 0 | 2 | 0 | 0.66 | 0.12 | 1 |
| 3 | GSPATHWAY | Activated G-protein coupled receptors stimulate cAMP production and thus activate protein kinase A, involved in a number of signal transduction pathways. | ADCY1, GNAS, GNB1, GNGT1, PRKACA, PRKAR1A | 6 | ADCY1(12), GNAS(6), GNB1(2), PRKACA(4), PRKAR1A(2) | 2991458 | 26 | 23 | 26 | 2 | 10 | 3 | 9 | 4 | 0 | 0 | 0.019 | 0.16 | 1 |
| 4 | BLOOD_GROUP_GLYCOLIPID_BIOSYNTHESIS_NEOLACTOSERIES | ABO, B3GNT1, FUT1, FUT2, FUT9, GCNT2, ST8SIA1 | 7 | ABO(2), B3GNT1(1), FUT1(1), FUT2(2), FUT9(10), GCNT2(4), ST8SIA1(2) | 2797416 | 22 | 21 | 22 | 4 | 2 | 7 | 10 | 2 | 1 | 0 | 0.12 | 0.18 | 1 | |
| 5 | ACETAMINOPHENPATHWAY | Acetaminophen selectively inhibits Cox-3, which is localized to the brain, and yields the toxic metabolite NAPQI when processed by CAR in the liver. | CYP1A2, CYP2E1, CYP3A, NR1I3, PTGS1, PTGS2 | 5 | CYP1A2(4), CYP2E1(5), PTGS1(6), PTGS2(2) | 2433197 | 17 | 15 | 17 | 2 | 2 | 1 | 9 | 0 | 5 | 0 | 0.16 | 0.26 | 1 |
| 6 | HSA00550_PEPTIDOGLYCAN_BIOSYNTHESIS | Genes involved in peptidoglycan biosynthesis | GLUL, PGLYRP2 | 2 | GLUL(2), PGLYRP2(3) | 829283 | 5 | 5 | 5 | 1 | 1 | 2 | 0 | 1 | 1 | 0 | 0.39 | 0.32 | 1 |
| 7 | BETAOXIDATIONPATHWAY | Beta-Oxidation of Fatty Acids | ACADL, ACADM, ACADS, ACAT1, ECHS1, HADHA | 6 | ACADL(2), ACADM(3), ACADS(2), ECHS1(2), HADHA(3) | 2467452 | 12 | 12 | 12 | 1 | 2 | 2 | 4 | 3 | 1 | 0 | 0.13 | 0.34 | 1 |
| 8 | FBW7PATHWAY | Cyclin E interacts with cell cycle checkpoint kinase cdk2 to allow transcription of genes required for S phase, including transcription of additional cyclin E. | CCNE1, CDC34, CDK2, CUL1, E2F1, FBXW7, RB1, SKP1A, TFDP1 | 7 | CCNE1(3), CDC34(1), CUL1(6), RB1(9), TFDP1(3) | 2976526 | 22 | 21 | 22 | 4 | 3 | 4 | 2 | 2 | 11 | 0 | 0.16 | 0.34 | 1 |
| 9 | NGFPATHWAY | Nerve growth factor (NGF) stimulates neural survival and proliferation via the TrkA and p75 receptors, which induce DAG and IP3 production and activate Ras. | CSNK2A1, DPM2, ELK1, FOS, GRB2, HRAS, JUN, KLK2, MAP2K1, MAPK3, MAPK8, NGFB, NGFR, PIK3CA, PIK3R1, PLCG1, RAF1, SHC1, SOS1 | 16 | CSNK2A1(6), ELK1(1), FOS(1), MAP2K1(4), MAPK8(4), NGFR(1), PIK3R1(6), PLCG1(5), RAF1(2), SHC1(1), SOS1(8) | 7493191 | 39 | 35 | 39 | 3 | 6 | 4 | 17 | 3 | 9 | 0 | 0.0092 | 0.39 | 1 |
| 10 | FXRPATHWAY | The nuclear receptor transcription factors FXR and LXR are activated by cholesterol metabolites and regulate cholesterol homeostasis. | FABP6, LDLR, NR0B2, NR1H3, NR1H4, RXRA | 6 | FABP6(2), LDLR(3), NR0B2(1), NR1H4(5), RXRA(4) | 2480469 | 15 | 15 | 15 | 1 | 2 | 2 | 6 | 1 | 4 | 0 | 0.1 | 0.4 | 1 |
In brief, we tabulate the number of mutations and the number of covered bases for each gene. The counts are broken down by mutation context category: four context categories that are discovered by MutSig, and one for indel and 'null' mutations, which include indels, nonsense mutations, splice-site mutations, and non-stop (read-through) mutations. For each gene, we calculate the probability of seeing the observed constellation of mutations, i.e. the product P1 x P2 x ... x Pm, or a more extreme one, given the background mutation rates calculated across the dataset. [1]
This is an experimental feature. The full results of the analysis summarized in this report can be downloaded from the TCGA Data Coordination Center.