(primary solid tumor cohort)
This pipeline computes the correlation between significant copy number variation (cnv) genes and selected clinical features.
Testing the association between copy number variation of 30 peak regions and 8 clinical features across 493 patients, 26 significant findings detected with Q value < 0.25.
-
Amp Peak 3(3q26.32) cnvs correlated to 'PATHOLOGY.T', 'PATHOLOGICSPREAD(M)', and 'TUMOR.STAGE'.
-
Amp Peak 7(8q24.22) cnvs correlated to 'PATHOLOGY.T'.
-
Del Peak 6(3p21.32) cnvs correlated to 'PATHOLOGY.T' and 'TUMOR.STAGE'.
-
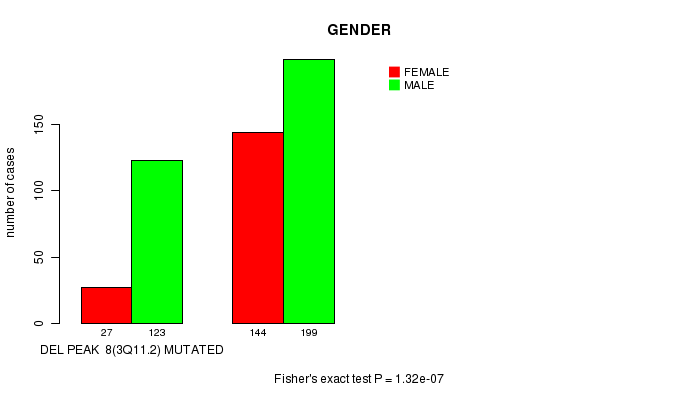
Del Peak 8(3q11.2) cnvs correlated to 'GENDER'.
-
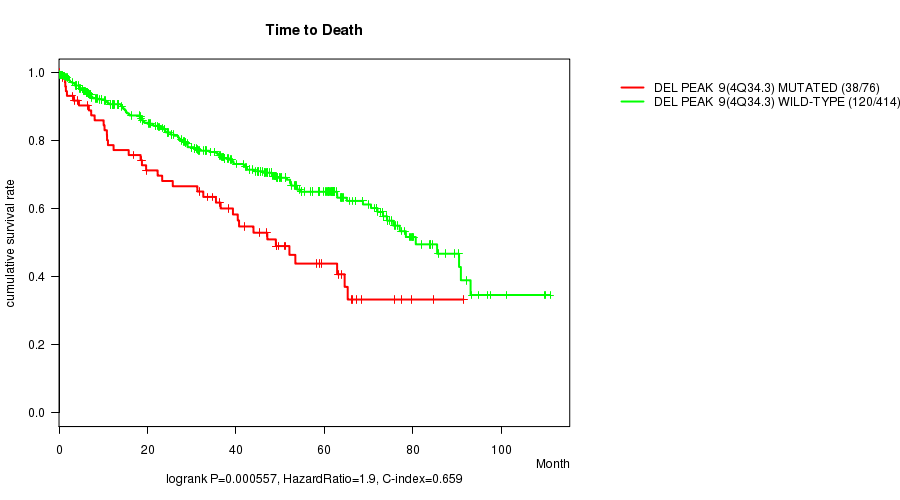
Del Peak 9(4q34.3) cnvs correlated to 'Time to Death', 'PATHOLOGY.T', and 'TUMOR.STAGE'.
-
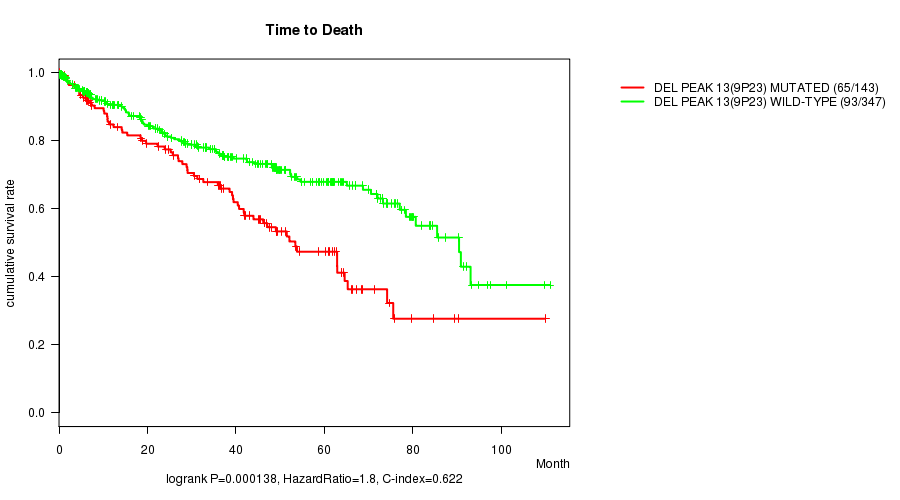
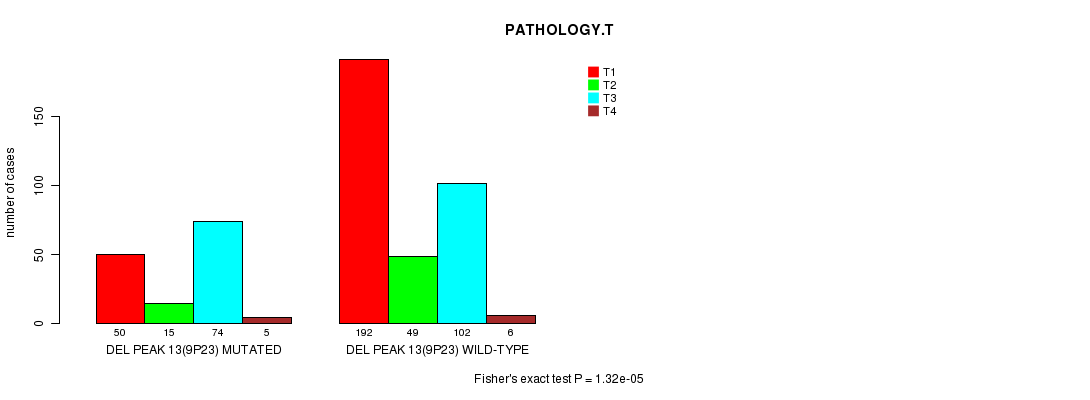
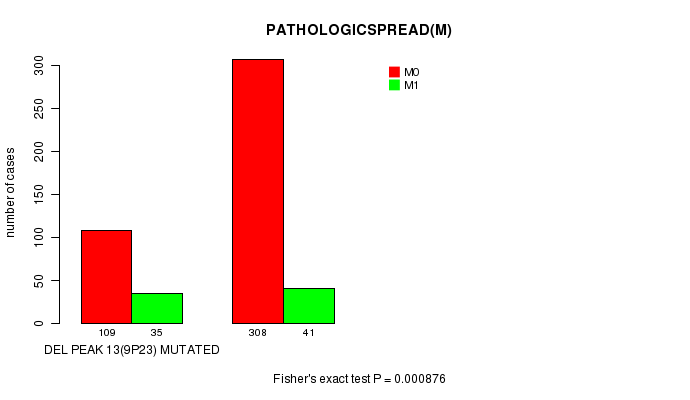
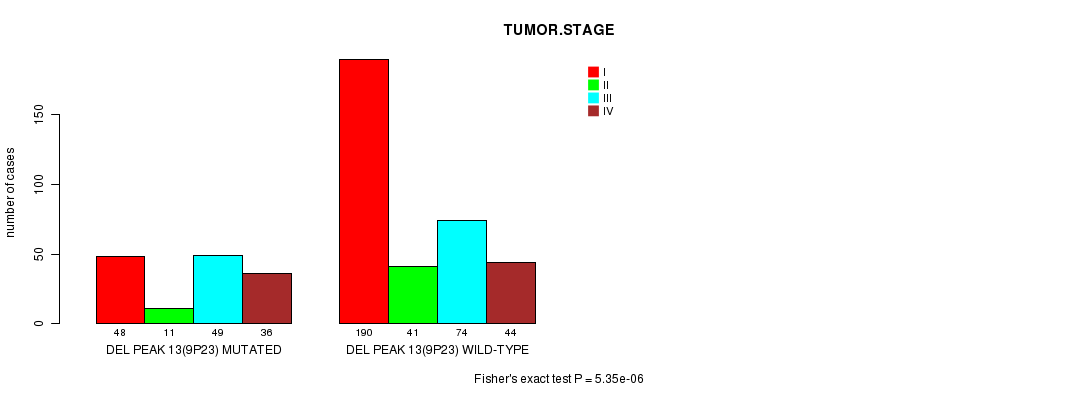
Del Peak 13(9p23) cnvs correlated to 'Time to Death', 'PATHOLOGY.T', 'PATHOLOGICSPREAD(M)', and 'TUMOR.STAGE'.
-
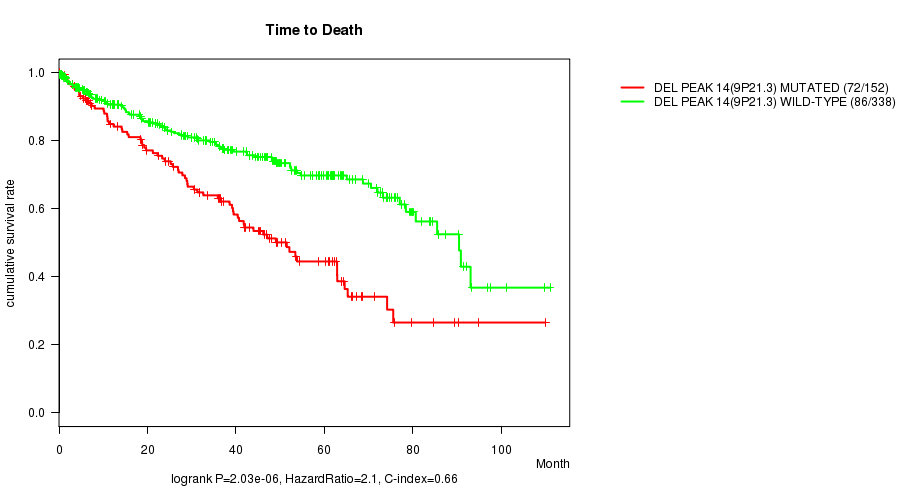
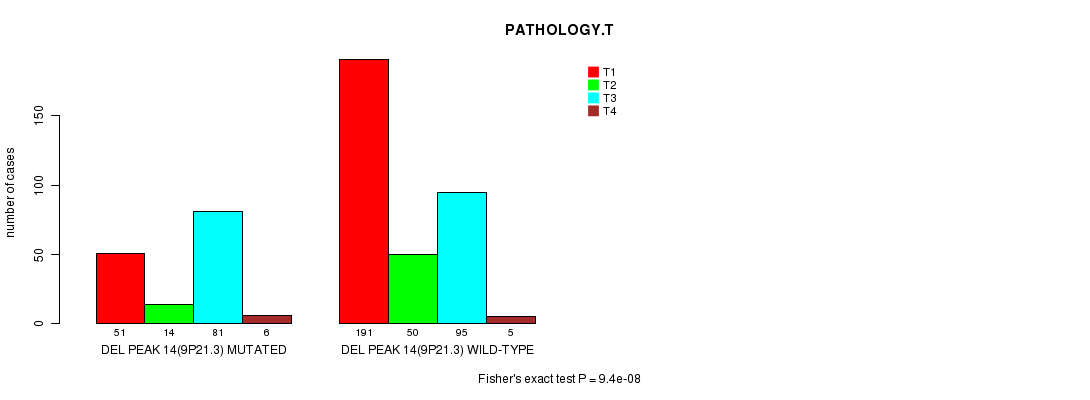
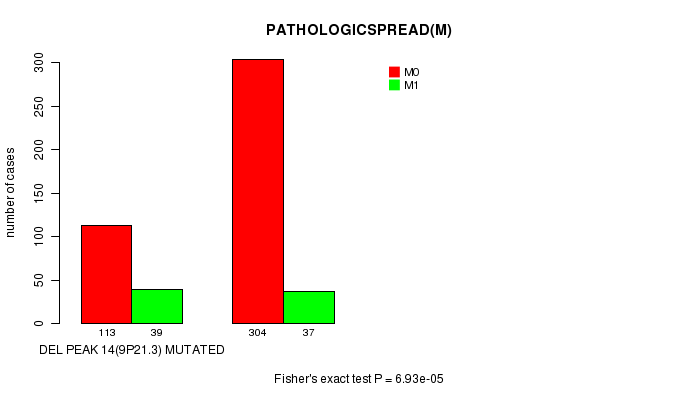
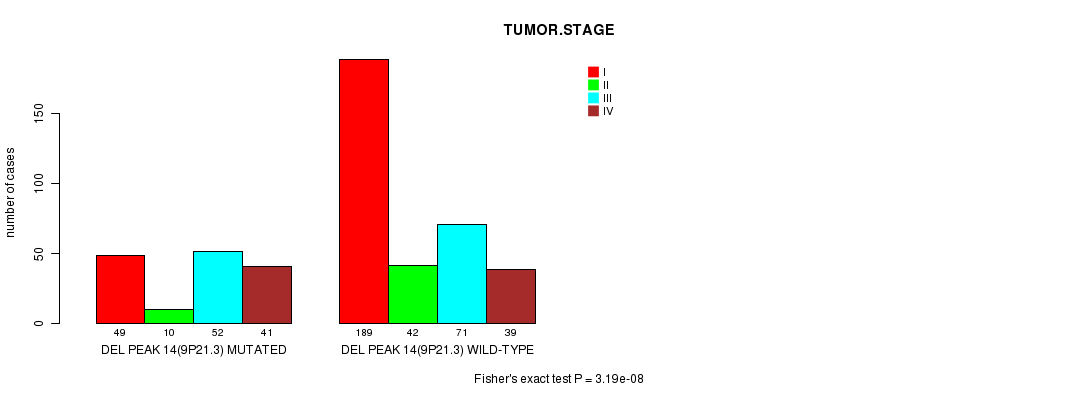
Del Peak 14(9p21.3) cnvs correlated to 'Time to Death', 'PATHOLOGY.T', 'PATHOLOGICSPREAD(M)', and 'TUMOR.STAGE'.
-
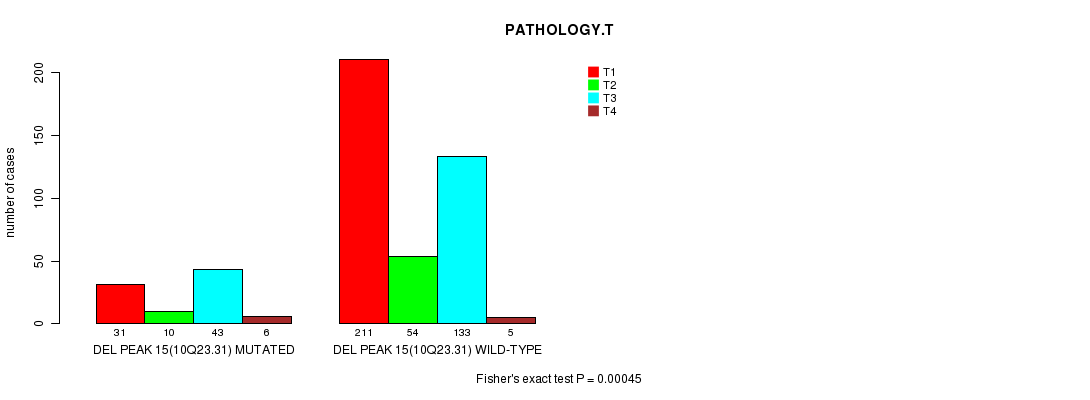
Del Peak 15(10q23.31) cnvs correlated to 'PATHOLOGY.T'.
-
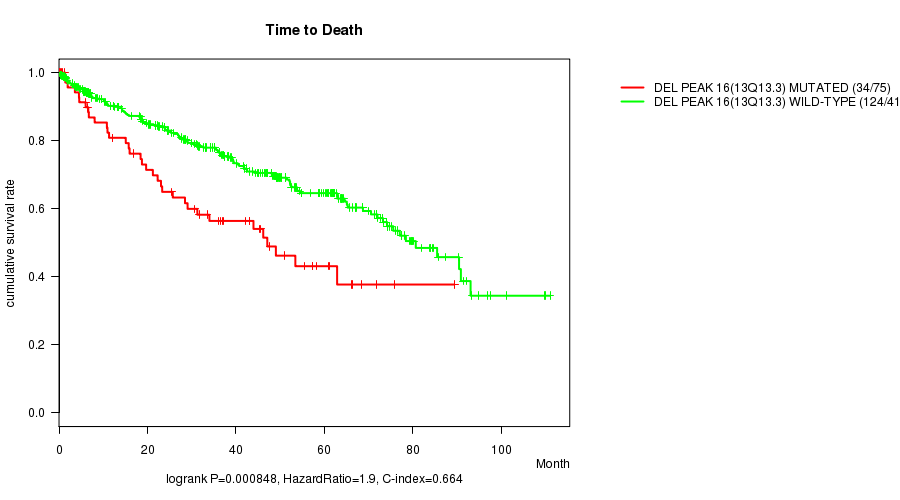
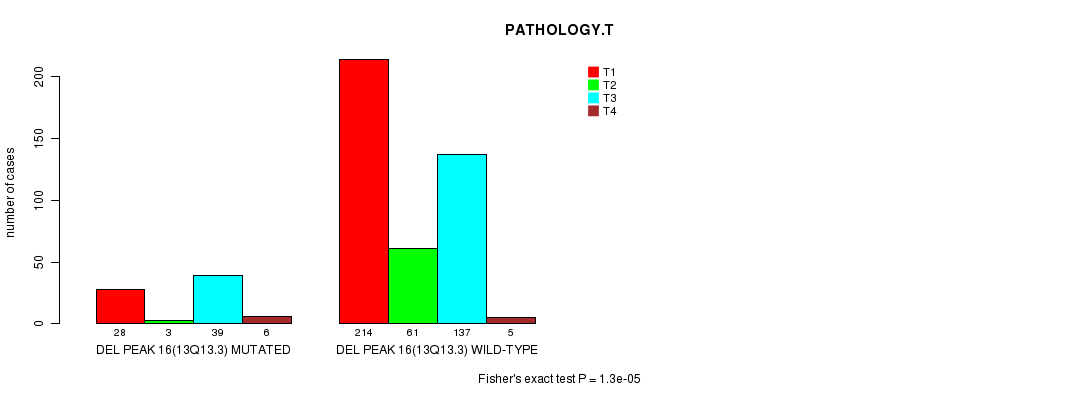
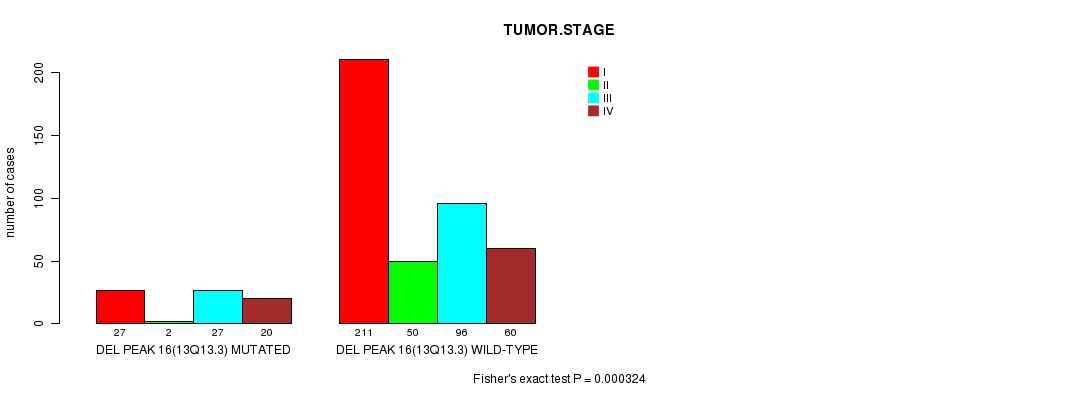
Del Peak 16(13q13.3) cnvs correlated to 'Time to Death', 'PATHOLOGY.T', and 'TUMOR.STAGE'.
-
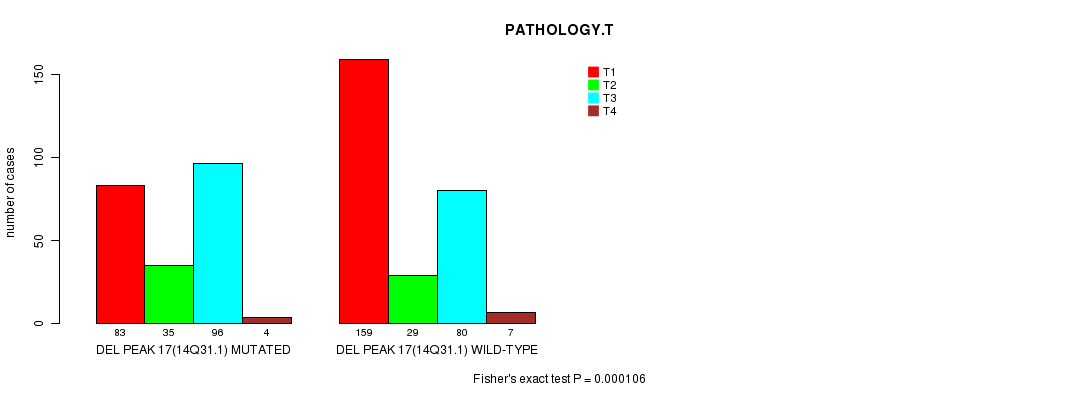
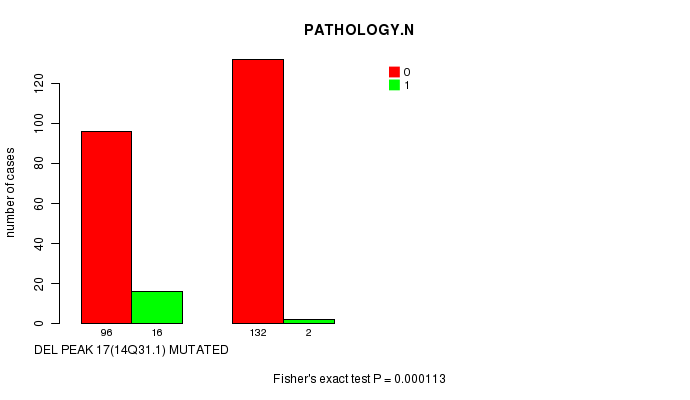
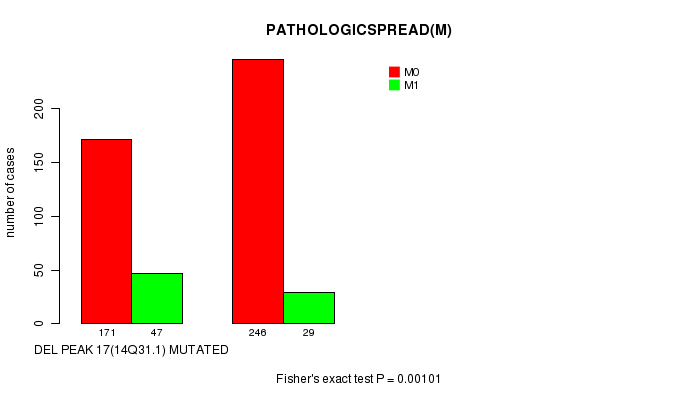
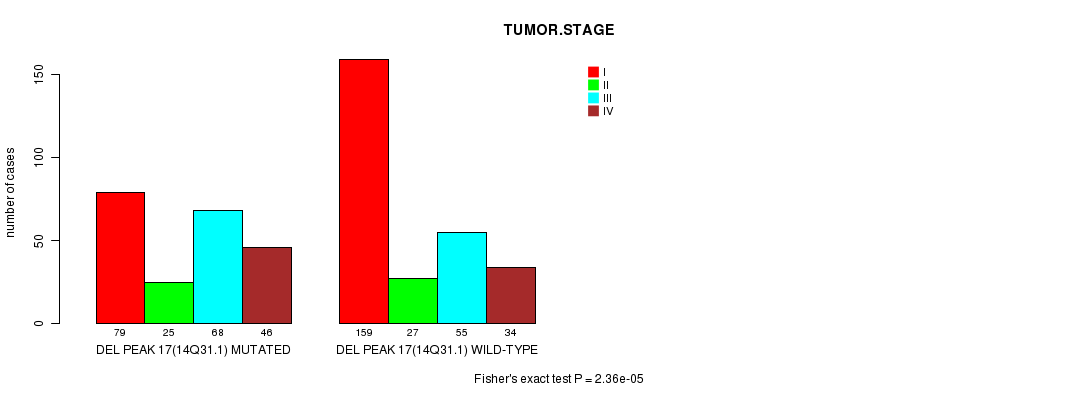
Del Peak 17(14q31.1) cnvs correlated to 'PATHOLOGY.T', 'PATHOLOGY.N', 'PATHOLOGICSPREAD(M)', and 'TUMOR.STAGE'.
Table 1. Get Full Table Overview of the association between significant copy number variation of 30 regions and 8 clinical features. Shown in the table are P values (Q values). Thresholded by Q value < 0.25, 26 significant findings detected.
|
Clinical Features |
Time to Death |
AGE | GENDER |
KARNOFSKY PERFORMANCE SCORE |
PATHOLOGY T |
PATHOLOGY N |
PATHOLOGICSPREAD(M) |
TUMOR STAGE |
||
| nCNV (%) | nWild-Type | logrank test | t-test | Fisher's exact test | t-test | Fisher's exact test | Fisher's exact test | Fisher's exact test | Fisher's exact test | |
| Del Peak 13(9p23) | 144 (29%) | 349 |
0.000138 (0.0304) |
0.0136 (1.00) |
0.00361 (0.744) |
0.656 (1.00) |
1.32e-05 (0.00302) |
0.262 (1.00) |
0.000876 (0.187) |
5.35e-06 (0.00123) |
| Del Peak 14(9p21 3) | 152 (31%) | 341 |
2.03e-06 (0.000473) |
0.0261 (1.00) |
0.00144 (0.303) |
0.656 (1.00) |
9.4e-08 (2.22e-05) |
0.0589 (1.00) |
6.93e-05 (0.0156) |
3.19e-08 (7.57e-06) |
| Del Peak 17(14q31 1) | 218 (44%) | 275 |
0.00179 (0.374) |
0.055 (1.00) |
0.393 (1.00) |
0.0872 (1.00) |
0.000106 (0.0236) |
0.000113 (0.0249) |
0.00101 (0.216) |
2.36e-05 (0.00537) |
| Amp Peak 3(3q26 32) | 80 (16%) | 413 |
0.156 (1.00) |
0.903 (1.00) |
0.442 (1.00) |
0.152 (1.00) |
9.88e-05 (0.022) |
0.0593 (1.00) |
7.09e-05 (0.0159) |
2.32e-05 (0.00529) |
| Del Peak 9(4q34 3) | 76 (15%) | 417 |
0.000557 (0.12) |
0.568 (1.00) |
0.433 (1.00) |
0.0261 (1.00) |
3.5e-07 (8.2e-05) |
1 (1.00) |
0.00862 (1.00) |
2.36e-06 (0.000547) |
| Del Peak 16(13q13 3) | 76 (15%) | 417 |
0.000848 (0.182) |
0.884 (1.00) |
0.794 (1.00) |
0.748 (1.00) |
1.3e-05 (0.00299) |
0.325 (1.00) |
0.0377 (1.00) |
0.000324 (0.0709) |
| Del Peak 6(3p21 32) | 435 (88%) | 58 |
0.498 (1.00) |
0.704 (1.00) |
0.772 (1.00) |
0.0817 (1.00) |
2.78e-05 (0.00629) |
1 (1.00) |
0.333 (1.00) |
0.000492 (0.107) |
| Amp Peak 7(8q24 22) | 73 (15%) | 420 |
0.0527 (1.00) |
0.0214 (1.00) |
0.11 (1.00) |
0.297 (1.00) |
0.00108 (0.229) |
0.74 (1.00) |
0.053 (1.00) |
0.00229 (0.473) |
| Del Peak 8(3q11 2) | 150 (30%) | 343 |
0.635 (1.00) |
0.0111 (1.00) |
1.32e-07 (3.1e-05) |
0.749 (1.00) |
0.132 (1.00) |
0.787 (1.00) |
0.591 (1.00) |
0.45 (1.00) |
| Del Peak 15(10q23 31) | 90 (18%) | 403 |
0.217 (1.00) |
0.209 (1.00) |
0.0272 (1.00) |
0.764 (1.00) |
0.00045 (0.0982) |
1 (1.00) |
0.333 (1.00) |
0.0174 (1.00) |
| Amp Peak 1(1q24 1) | 60 (12%) | 433 |
0.2 (1.00) |
0.164 (1.00) |
0.666 (1.00) |
0.499 (1.00) |
0.155 (1.00) |
0.0751 (1.00) |
0.339 (1.00) |
0.298 (1.00) |
| Amp Peak 2(1q32 1) | 59 (12%) | 434 |
0.437 (1.00) |
0.0725 (1.00) |
0.771 (1.00) |
0.499 (1.00) |
0.162 (1.00) |
0.482 (1.00) |
0.703 (1.00) |
0.239 (1.00) |
| Amp Peak 4(4q32 1) | 14 (3%) | 479 |
0.0584 (1.00) |
0.416 (1.00) |
0.258 (1.00) |
0.411 (1.00) |
0.231 (1.00) |
0.574 (1.00) |
0.462 (1.00) |
0.415 (1.00) |
| Amp Peak 5(5q35 1) | 311 (63%) | 182 |
0.0454 (1.00) |
0.0923 (1.00) |
0.141 (1.00) |
0.944 (1.00) |
0.296 (1.00) |
0.31 (1.00) |
0.366 (1.00) |
0.633 (1.00) |
| Amp Peak 6(7q36 3) | 163 (33%) | 330 |
0.724 (1.00) |
0.806 (1.00) |
0.0352 (1.00) |
0.57 (1.00) |
0.0564 (1.00) |
0.443 (1.00) |
0.00523 (1.00) |
0.02 (1.00) |
| Amp Peak 8(10p14) | 16 (3%) | 477 |
0.234 (1.00) |
0.423 (1.00) |
0.594 (1.00) |
0.887 (1.00) |
0.0101 (1.00) |
0.188 (1.00) |
0.288 (1.00) |
0.0495 (1.00) |
| Amp Peak 9(17q24 3) | 37 (8%) | 456 |
0.0512 (1.00) |
0.0662 (1.00) |
0.858 (1.00) |
0.471 (1.00) |
0.499 (1.00) |
0.359 (1.00) |
0.244 (1.00) |
0.867 (1.00) |
| Amp Peak 10(Xp22 2) | 35 (7%) | 458 |
0.468 (1.00) |
0.676 (1.00) |
0.854 (1.00) |
0.726 (1.00) |
0.0803 (1.00) |
0.668 (1.00) |
0.0897 (1.00) |
0.00984 (1.00) |
| Amp Peak 11(Xp11 4) | 36 (7%) | 457 |
0.759 (1.00) |
0.712 (1.00) |
0.857 (1.00) |
0.726 (1.00) |
0.0656 (1.00) |
0.668 (1.00) |
0.0509 (1.00) |
0.00472 (0.968) |
| Amp Peak 12(Xq11 2) | 32 (6%) | 461 |
0.803 (1.00) |
0.145 (1.00) |
0.706 (1.00) |
0.726 (1.00) |
0.168 (1.00) |
0.647 (1.00) |
0.31 (1.00) |
0.0563 (1.00) |
| Del Peak 1(1p36 23) | 98 (20%) | 395 |
0.0495 (1.00) |
0.123 (1.00) |
0.123 (1.00) |
0.284 (1.00) |
0.109 (1.00) |
1 (1.00) |
0.0844 (1.00) |
0.168 (1.00) |
| Del Peak 2(1p31 1) | 72 (15%) | 421 |
0.219 (1.00) |
0.0726 (1.00) |
0.016 (1.00) |
0.284 (1.00) |
0.0532 (1.00) |
0.722 (1.00) |
0.294 (1.00) |
0.179 (1.00) |
| Del Peak 3(1q43) | 38 (8%) | 455 |
0.704 (1.00) |
0.335 (1.00) |
1 (1.00) |
0.0673 (1.00) |
0.374 (1.00) |
1 (1.00) |
0.746 (1.00) |
|
| Del Peak 4(2q37 3) | 48 (10%) | 445 |
0.673 (1.00) |
0.63 (1.00) |
0.153 (1.00) |
0.835 (1.00) |
1 (1.00) |
0.402 (1.00) |
0.558 (1.00) |
|
| Del Peak 5(3p25 3) | 432 (88%) | 61 |
0.783 (1.00) |
0.788 (1.00) |
0.569 (1.00) |
0.0817 (1.00) |
0.00136 (0.287) |
1 (1.00) |
0.707 (1.00) |
0.0125 (1.00) |
| Del Peak 7(3p12 2) | 283 (57%) | 210 |
0.614 (1.00) |
0.761 (1.00) |
0.00221 (0.461) |
0.741 (1.00) |
0.218 (1.00) |
0.626 (1.00) |
0.53 (1.00) |
0.23 (1.00) |
| Del Peak 10(6q26) | 142 (29%) | 351 |
0.565 (1.00) |
0.287 (1.00) |
0.012 (1.00) |
0.256 (1.00) |
0.62 (1.00) |
0.0195 (1.00) |
0.41 (1.00) |
0.319 (1.00) |
| Del Peak 11(6q26) | 142 (29%) | 351 |
0.589 (1.00) |
0.226 (1.00) |
0.00648 (1.00) |
0.256 (1.00) |
0.62 (1.00) |
0.0195 (1.00) |
0.41 (1.00) |
0.319 (1.00) |
| Del Peak 12(8p23 2) | 146 (30%) | 347 |
0.0385 (1.00) |
0.139 (1.00) |
0.256 (1.00) |
0.893 (1.00) |
0.175 (1.00) |
0.786 (1.00) |
0.055 (1.00) |
0.139 (1.00) |
| Del Peak 18(Xq23) | 55 (11%) | 438 |
0.287 (1.00) |
0.669 (1.00) |
0.234 (1.00) |
0.295 (1.00) |
0.657 (1.00) |
0.168 (1.00) |
0.139 (1.00) |
P value = 9.88e-05 (Fisher's exact test), Q value = 0.022
Table S1. Gene #3: 'Amp Peak 3(3q26.32) mutation analysis' versus Clinical Feature #5: 'PATHOLOGY.T'
| nPatients | T1 | T2 | T3 | T4 |
|---|---|---|---|---|
| ALL | 242 | 64 | 176 | 11 |
| AMP PEAK 3(3Q26.32) MUTATED | 24 | 8 | 44 | 4 |
| AMP PEAK 3(3Q26.32) WILD-TYPE | 218 | 56 | 132 | 7 |
Figure S1. Get High-res Image Gene #3: 'Amp Peak 3(3q26.32) mutation analysis' versus Clinical Feature #5: 'PATHOLOGY.T'

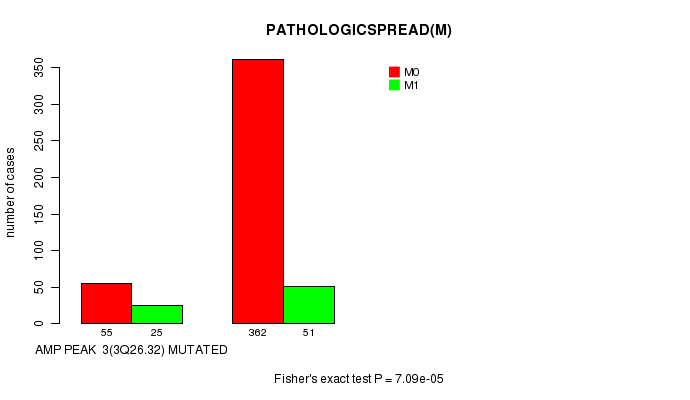
P value = 7.09e-05 (Fisher's exact test), Q value = 0.016
Table S2. Gene #3: 'Amp Peak 3(3q26.32) mutation analysis' versus Clinical Feature #7: 'PATHOLOGICSPREAD(M)'
| nPatients | M0 | M1 |
|---|---|---|
| ALL | 417 | 76 |
| AMP PEAK 3(3Q26.32) MUTATED | 55 | 25 |
| AMP PEAK 3(3Q26.32) WILD-TYPE | 362 | 51 |
Figure S2. Get High-res Image Gene #3: 'Amp Peak 3(3q26.32) mutation analysis' versus Clinical Feature #7: 'PATHOLOGICSPREAD(M)'
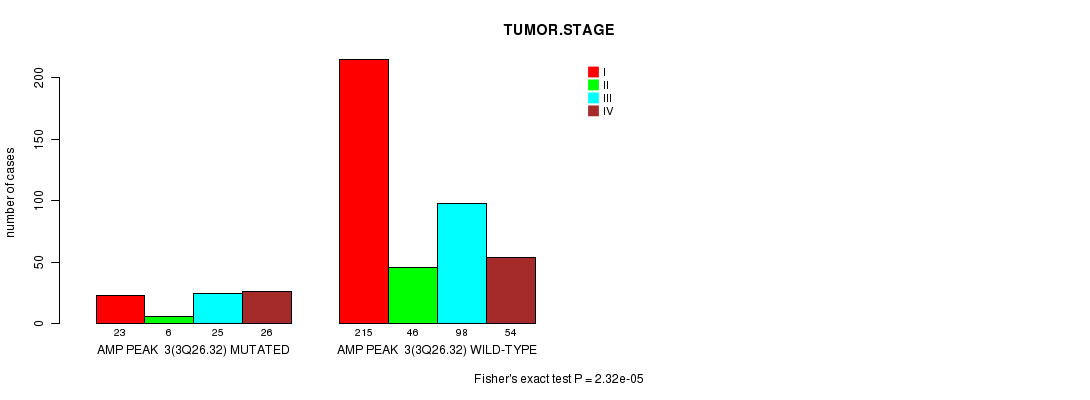
P value = 2.32e-05 (Fisher's exact test), Q value = 0.0053
Table S3. Gene #3: 'Amp Peak 3(3q26.32) mutation analysis' versus Clinical Feature #8: 'TUMOR.STAGE'
| nPatients | I | II | III | IV |
|---|---|---|---|---|
| ALL | 238 | 52 | 123 | 80 |
| AMP PEAK 3(3Q26.32) MUTATED | 23 | 6 | 25 | 26 |
| AMP PEAK 3(3Q26.32) WILD-TYPE | 215 | 46 | 98 | 54 |
Figure S3. Get High-res Image Gene #3: 'Amp Peak 3(3q26.32) mutation analysis' versus Clinical Feature #8: 'TUMOR.STAGE'
P value = 0.00108 (Fisher's exact test), Q value = 0.23
Table S4. Gene #7: 'Amp Peak 7(8q24.22) mutation analysis' versus Clinical Feature #5: 'PATHOLOGY.T'
| nPatients | T1 | T2 | T3 | T4 |
|---|---|---|---|---|
| ALL | 242 | 64 | 176 | 11 |
| AMP PEAK 7(8Q24.22) MUTATED | 21 | 11 | 39 | 2 |
| AMP PEAK 7(8Q24.22) WILD-TYPE | 221 | 53 | 137 | 9 |
Figure S4. Get High-res Image Gene #7: 'Amp Peak 7(8q24.22) mutation analysis' versus Clinical Feature #5: 'PATHOLOGY.T'

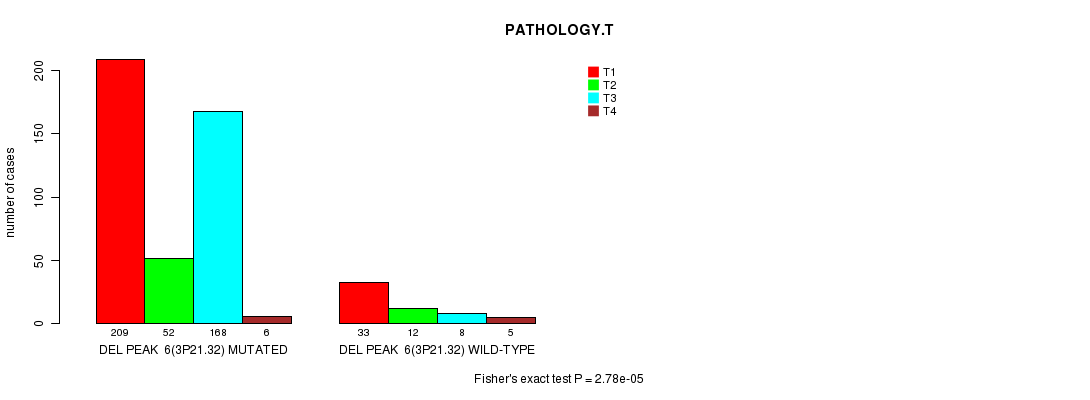
P value = 2.78e-05 (Fisher's exact test), Q value = 0.0063
Table S5. Gene #18: 'Del Peak 6(3p21.32) mutation analysis' versus Clinical Feature #5: 'PATHOLOGY.T'
| nPatients | T1 | T2 | T3 | T4 |
|---|---|---|---|---|
| ALL | 242 | 64 | 176 | 11 |
| DEL PEAK 6(3P21.32) MUTATED | 209 | 52 | 168 | 6 |
| DEL PEAK 6(3P21.32) WILD-TYPE | 33 | 12 | 8 | 5 |
Figure S5. Get High-res Image Gene #18: 'Del Peak 6(3p21.32) mutation analysis' versus Clinical Feature #5: 'PATHOLOGY.T'
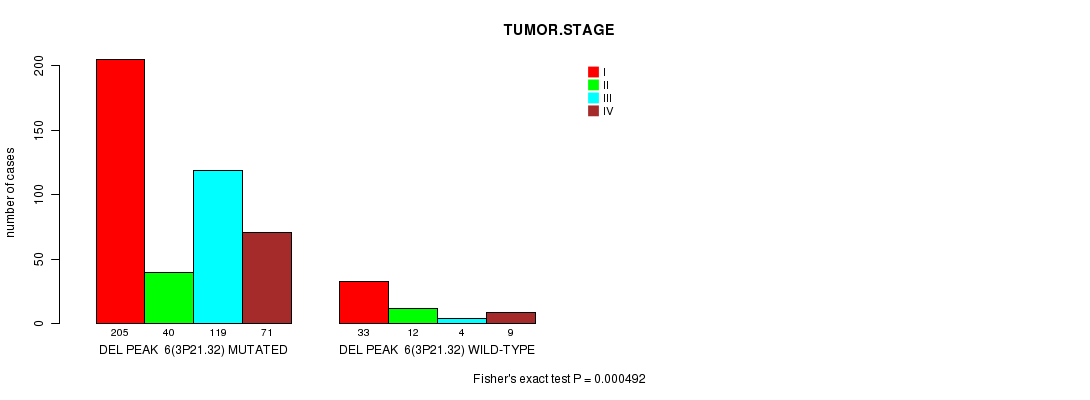
P value = 0.000492 (Fisher's exact test), Q value = 0.11
Table S6. Gene #18: 'Del Peak 6(3p21.32) mutation analysis' versus Clinical Feature #8: 'TUMOR.STAGE'
| nPatients | I | II | III | IV |
|---|---|---|---|---|
| ALL | 238 | 52 | 123 | 80 |
| DEL PEAK 6(3P21.32) MUTATED | 205 | 40 | 119 | 71 |
| DEL PEAK 6(3P21.32) WILD-TYPE | 33 | 12 | 4 | 9 |
Figure S6. Get High-res Image Gene #18: 'Del Peak 6(3p21.32) mutation analysis' versus Clinical Feature #8: 'TUMOR.STAGE'
P value = 1.32e-07 (Fisher's exact test), Q value = 3.1e-05
Table S7. Gene #20: 'Del Peak 8(3q11.2) mutation analysis' versus Clinical Feature #3: 'GENDER'
| nPatients | FEMALE | MALE |
|---|---|---|
| ALL | 322 | 171 |
| DEL PEAK 8(3Q11.2) MUTATED | 123 | 27 |
| DEL PEAK 8(3Q11.2) WILD-TYPE | 199 | 144 |
Figure S7. Get High-res Image Gene #20: 'Del Peak 8(3q11.2) mutation analysis' versus Clinical Feature #3: 'GENDER'
P value = 0.000557 (logrank test), Q value = 0.12
Table S8. Gene #21: 'Del Peak 9(4q34.3) mutation analysis' versus Clinical Feature #1: 'Time to Death'
| nPatients | nDeath | Duration Range (Median), Month | |
|---|---|---|---|
| ALL | 490 | 158 | 0.1 - 111.0 (35.2) |
| DEL PEAK 9(4Q34.3) MUTATED | 76 | 38 | 0.2 - 91.4 (35.1) |
| DEL PEAK 9(4Q34.3) WILD-TYPE | 414 | 120 | 0.1 - 111.0 (35.2) |
Figure S8. Get High-res Image Gene #21: 'Del Peak 9(4q34.3) mutation analysis' versus Clinical Feature #1: 'Time to Death'
P value = 3.5e-07 (Fisher's exact test), Q value = 8.2e-05
Table S9. Gene #21: 'Del Peak 9(4q34.3) mutation analysis' versus Clinical Feature #5: 'PATHOLOGY.T'
| nPatients | T1 | T2 | T3 | T4 |
|---|---|---|---|---|
| ALL | 242 | 64 | 176 | 11 |
| DEL PEAK 9(4Q34.3) MUTATED | 19 | 8 | 43 | 6 |
| DEL PEAK 9(4Q34.3) WILD-TYPE | 223 | 56 | 133 | 5 |
Figure S9. Get High-res Image Gene #21: 'Del Peak 9(4q34.3) mutation analysis' versus Clinical Feature #5: 'PATHOLOGY.T'

P value = 2.36e-06 (Fisher's exact test), Q value = 0.00055
Table S10. Gene #21: 'Del Peak 9(4q34.3) mutation analysis' versus Clinical Feature #8: 'TUMOR.STAGE'
| nPatients | I | II | III | IV |
|---|---|---|---|---|
| ALL | 238 | 52 | 123 | 80 |
| DEL PEAK 9(4Q34.3) MUTATED | 18 | 6 | 30 | 22 |
| DEL PEAK 9(4Q34.3) WILD-TYPE | 220 | 46 | 93 | 58 |
Figure S10. Get High-res Image Gene #21: 'Del Peak 9(4q34.3) mutation analysis' versus Clinical Feature #8: 'TUMOR.STAGE'

P value = 0.000138 (logrank test), Q value = 0.03
Table S11. Gene #25: 'Del Peak 13(9p23) mutation analysis' versus Clinical Feature #1: 'Time to Death'
| nPatients | nDeath | Duration Range (Median), Month | |
|---|---|---|---|
| ALL | 490 | 158 | 0.1 - 111.0 (35.2) |
| DEL PEAK 13(9P23) MUTATED | 143 | 65 | 0.2 - 109.9 (36.1) |
| DEL PEAK 13(9P23) WILD-TYPE | 347 | 93 | 0.1 - 111.0 (34.6) |
Figure S11. Get High-res Image Gene #25: 'Del Peak 13(9p23) mutation analysis' versus Clinical Feature #1: 'Time to Death'
P value = 1.32e-05 (Fisher's exact test), Q value = 0.003
Table S12. Gene #25: 'Del Peak 13(9p23) mutation analysis' versus Clinical Feature #5: 'PATHOLOGY.T'
| nPatients | T1 | T2 | T3 | T4 |
|---|---|---|---|---|
| ALL | 242 | 64 | 176 | 11 |
| DEL PEAK 13(9P23) MUTATED | 50 | 15 | 74 | 5 |
| DEL PEAK 13(9P23) WILD-TYPE | 192 | 49 | 102 | 6 |
Figure S12. Get High-res Image Gene #25: 'Del Peak 13(9p23) mutation analysis' versus Clinical Feature #5: 'PATHOLOGY.T'
P value = 0.000876 (Fisher's exact test), Q value = 0.19
Table S13. Gene #25: 'Del Peak 13(9p23) mutation analysis' versus Clinical Feature #7: 'PATHOLOGICSPREAD(M)'
| nPatients | M0 | M1 |
|---|---|---|
| ALL | 417 | 76 |
| DEL PEAK 13(9P23) MUTATED | 109 | 35 |
| DEL PEAK 13(9P23) WILD-TYPE | 308 | 41 |
Figure S13. Get High-res Image Gene #25: 'Del Peak 13(9p23) mutation analysis' versus Clinical Feature #7: 'PATHOLOGICSPREAD(M)'
P value = 5.35e-06 (Fisher's exact test), Q value = 0.0012
Table S14. Gene #25: 'Del Peak 13(9p23) mutation analysis' versus Clinical Feature #8: 'TUMOR.STAGE'
| nPatients | I | II | III | IV |
|---|---|---|---|---|
| ALL | 238 | 52 | 123 | 80 |
| DEL PEAK 13(9P23) MUTATED | 48 | 11 | 49 | 36 |
| DEL PEAK 13(9P23) WILD-TYPE | 190 | 41 | 74 | 44 |
Figure S14. Get High-res Image Gene #25: 'Del Peak 13(9p23) mutation analysis' versus Clinical Feature #8: 'TUMOR.STAGE'
P value = 2.03e-06 (logrank test), Q value = 0.00047
Table S15. Gene #26: 'Del Peak 14(9p21.3) mutation analysis' versus Clinical Feature #1: 'Time to Death'
| nPatients | nDeath | Duration Range (Median), Month | |
|---|---|---|---|
| ALL | 490 | 158 | 0.1 - 111.0 (35.2) |
| DEL PEAK 14(9P21.3) MUTATED | 152 | 72 | 0.2 - 109.9 (31.5) |
| DEL PEAK 14(9P21.3) WILD-TYPE | 338 | 86 | 0.1 - 111.0 (36.2) |
Figure S15. Get High-res Image Gene #26: 'Del Peak 14(9p21.3) mutation analysis' versus Clinical Feature #1: 'Time to Death'
P value = 9.4e-08 (Fisher's exact test), Q value = 2.2e-05
Table S16. Gene #26: 'Del Peak 14(9p21.3) mutation analysis' versus Clinical Feature #5: 'PATHOLOGY.T'
| nPatients | T1 | T2 | T3 | T4 |
|---|---|---|---|---|
| ALL | 242 | 64 | 176 | 11 |
| DEL PEAK 14(9P21.3) MUTATED | 51 | 14 | 81 | 6 |
| DEL PEAK 14(9P21.3) WILD-TYPE | 191 | 50 | 95 | 5 |
Figure S16. Get High-res Image Gene #26: 'Del Peak 14(9p21.3) mutation analysis' versus Clinical Feature #5: 'PATHOLOGY.T'
P value = 6.93e-05 (Fisher's exact test), Q value = 0.016
Table S17. Gene #26: 'Del Peak 14(9p21.3) mutation analysis' versus Clinical Feature #7: 'PATHOLOGICSPREAD(M)'
| nPatients | M0 | M1 |
|---|---|---|
| ALL | 417 | 76 |
| DEL PEAK 14(9P21.3) MUTATED | 113 | 39 |
| DEL PEAK 14(9P21.3) WILD-TYPE | 304 | 37 |
Figure S17. Get High-res Image Gene #26: 'Del Peak 14(9p21.3) mutation analysis' versus Clinical Feature #7: 'PATHOLOGICSPREAD(M)'
P value = 3.19e-08 (Fisher's exact test), Q value = 7.6e-06
Table S18. Gene #26: 'Del Peak 14(9p21.3) mutation analysis' versus Clinical Feature #8: 'TUMOR.STAGE'
| nPatients | I | II | III | IV |
|---|---|---|---|---|
| ALL | 238 | 52 | 123 | 80 |
| DEL PEAK 14(9P21.3) MUTATED | 49 | 10 | 52 | 41 |
| DEL PEAK 14(9P21.3) WILD-TYPE | 189 | 42 | 71 | 39 |
Figure S18. Get High-res Image Gene #26: 'Del Peak 14(9p21.3) mutation analysis' versus Clinical Feature #8: 'TUMOR.STAGE'
P value = 0.00045 (Fisher's exact test), Q value = 0.098
Table S19. Gene #27: 'Del Peak 15(10q23.31) mutation analysis' versus Clinical Feature #5: 'PATHOLOGY.T'
| nPatients | T1 | T2 | T3 | T4 |
|---|---|---|---|---|
| ALL | 242 | 64 | 176 | 11 |
| DEL PEAK 15(10Q23.31) MUTATED | 31 | 10 | 43 | 6 |
| DEL PEAK 15(10Q23.31) WILD-TYPE | 211 | 54 | 133 | 5 |
Figure S19. Get High-res Image Gene #27: 'Del Peak 15(10q23.31) mutation analysis' versus Clinical Feature #5: 'PATHOLOGY.T'
P value = 0.000848 (logrank test), Q value = 0.18
Table S20. Gene #28: 'Del Peak 16(13q13.3) mutation analysis' versus Clinical Feature #1: 'Time to Death'
| nPatients | nDeath | Duration Range (Median), Month | |
|---|---|---|---|
| ALL | 490 | 158 | 0.1 - 111.0 (35.2) |
| DEL PEAK 16(13Q13.3) MUTATED | 75 | 34 | 0.1 - 89.4 (28.5) |
| DEL PEAK 16(13Q13.3) WILD-TYPE | 415 | 124 | 0.1 - 111.0 (36.3) |
Figure S20. Get High-res Image Gene #28: 'Del Peak 16(13q13.3) mutation analysis' versus Clinical Feature #1: 'Time to Death'
P value = 1.3e-05 (Fisher's exact test), Q value = 0.003
Table S21. Gene #28: 'Del Peak 16(13q13.3) mutation analysis' versus Clinical Feature #5: 'PATHOLOGY.T'
| nPatients | T1 | T2 | T3 | T4 |
|---|---|---|---|---|
| ALL | 242 | 64 | 176 | 11 |
| DEL PEAK 16(13Q13.3) MUTATED | 28 | 3 | 39 | 6 |
| DEL PEAK 16(13Q13.3) WILD-TYPE | 214 | 61 | 137 | 5 |
Figure S21. Get High-res Image Gene #28: 'Del Peak 16(13q13.3) mutation analysis' versus Clinical Feature #5: 'PATHOLOGY.T'
P value = 0.000324 (Fisher's exact test), Q value = 0.071
Table S22. Gene #28: 'Del Peak 16(13q13.3) mutation analysis' versus Clinical Feature #8: 'TUMOR.STAGE'
| nPatients | I | II | III | IV |
|---|---|---|---|---|
| ALL | 238 | 52 | 123 | 80 |
| DEL PEAK 16(13Q13.3) MUTATED | 27 | 2 | 27 | 20 |
| DEL PEAK 16(13Q13.3) WILD-TYPE | 211 | 50 | 96 | 60 |
Figure S22. Get High-res Image Gene #28: 'Del Peak 16(13q13.3) mutation analysis' versus Clinical Feature #8: 'TUMOR.STAGE'
P value = 0.000106 (Fisher's exact test), Q value = 0.024
Table S23. Gene #29: 'Del Peak 17(14q31.1) mutation analysis' versus Clinical Feature #5: 'PATHOLOGY.T'
| nPatients | T1 | T2 | T3 | T4 |
|---|---|---|---|---|
| ALL | 242 | 64 | 176 | 11 |
| DEL PEAK 17(14Q31.1) MUTATED | 83 | 35 | 96 | 4 |
| DEL PEAK 17(14Q31.1) WILD-TYPE | 159 | 29 | 80 | 7 |
Figure S23. Get High-res Image Gene #29: 'Del Peak 17(14q31.1) mutation analysis' versus Clinical Feature #5: 'PATHOLOGY.T'
P value = 0.000113 (Fisher's exact test), Q value = 0.025
Table S24. Gene #29: 'Del Peak 17(14q31.1) mutation analysis' versus Clinical Feature #6: 'PATHOLOGY.N'
| nPatients | 0 | 1 |
|---|---|---|
| ALL | 228 | 18 |
| DEL PEAK 17(14Q31.1) MUTATED | 96 | 16 |
| DEL PEAK 17(14Q31.1) WILD-TYPE | 132 | 2 |
Figure S24. Get High-res Image Gene #29: 'Del Peak 17(14q31.1) mutation analysis' versus Clinical Feature #6: 'PATHOLOGY.N'
P value = 0.00101 (Fisher's exact test), Q value = 0.22
Table S25. Gene #29: 'Del Peak 17(14q31.1) mutation analysis' versus Clinical Feature #7: 'PATHOLOGICSPREAD(M)'
| nPatients | M0 | M1 |
|---|---|---|
| ALL | 417 | 76 |
| DEL PEAK 17(14Q31.1) MUTATED | 171 | 47 |
| DEL PEAK 17(14Q31.1) WILD-TYPE | 246 | 29 |
Figure S25. Get High-res Image Gene #29: 'Del Peak 17(14q31.1) mutation analysis' versus Clinical Feature #7: 'PATHOLOGICSPREAD(M)'
P value = 2.36e-05 (Fisher's exact test), Q value = 0.0054
Table S26. Gene #29: 'Del Peak 17(14q31.1) mutation analysis' versus Clinical Feature #8: 'TUMOR.STAGE'
| nPatients | I | II | III | IV |
|---|---|---|---|---|
| ALL | 238 | 52 | 123 | 80 |
| DEL PEAK 17(14Q31.1) MUTATED | 79 | 25 | 68 | 46 |
| DEL PEAK 17(14Q31.1) WILD-TYPE | 159 | 27 | 55 | 34 |
Figure S26. Get High-res Image Gene #29: 'Del Peak 17(14q31.1) mutation analysis' versus Clinical Feature #8: 'TUMOR.STAGE'
-
Copy number data file = All Lesions File (all_lesions.conf_##.txt, where ## is the confidence level). The all lesions file is from GISTIC pipeline and summarizes the results from the GISTIC run. It contains data about the significant regions of amplification and deletion as well as which samples are amplified or deleted in each of these regions. The identified regions are listed down the first column, and the samples are listed across the first row, starting in column 10.
-
Clinical data file = KIRC-TP.clin.merged.picked.txt
-
Number of patients = 493
-
Number of copy number variation regions = 30
-
Number of selected clinical features = 8
-
Exclude regions that fewer than K tumors have alterations, K = 3
For survival clinical features, the Kaplan-Meier survival curves of tumors with and without gene cnvs were plotted and the statistical significance P values were estimated by logrank test (Bland and Altman 2004) using the 'survdiff' function in R
For continuous numerical clinical features, two-tailed Student's t test with unequal variance (Lehmann and Romano 2005) was applied to compare the clinical values between tumors with and without gene cnvs using 't.test' function in R
For binary or multi-class clinical features (nominal or ordinal), two-tailed Fisher's exact tests (Fisher 1922) were used to estimate the P values using the 'fisher.test' function in R
For multiple hypothesis correction, Q value is the False Discovery Rate (FDR) analogue of the P value (Benjamini and Hochberg 1995), defined as the minimum FDR at which the test may be called significant. We used the 'Benjamini and Hochberg' method of 'p.adjust' function in R to convert P values into Q values.
This is an experimental feature. The full results of the analysis summarized in this report can be downloaded from the TCGA Data Coordination Center.